DFs com capa - Ingl s
148
Financial Statements BB Seguridade Participações S.A
Transcript of DFs com capa - Ingl s

Financial Statements BB Seguridade Participações S.A


1
ITR - Quarterly Financial Information - 9/30/2013 - BB Seguridade Participações S.A.��������������������������������������������������������������������Version : 1�
Company Information / Capital Breakdown�
�
Number of Shares� Current Quarter (Units)� 9/30/2013�
� �
Paid-in-Capital� �� �
Common� 2,000,000,000�
Preferred� 0�� �
Total� 2,000,000,000�
Treasury Shares� �� �
Common� 0�
Preferred� 0�� �
Total� 0�

2
ITR - Quarterly Financial Information - 9/30/2013 - BB Seguridade Participações S.A.��������������������������������������������������������������������Version : 1�
A free translation from Portuguese into English of individual interim financial information prepared in Brazilian currency in accordance with accounting practices adopted in Brazil and of consolidated interim financial information prepared in Brazilian currency in accordance with accounting practices adopted in Brazil and with International Financial Reporting Standards (IFRS) issued by the International Accounting Standards Board – IASB and specific CVM rules.
Parent Company Financial Statements/ Balance Sheet Assets
(Reais Thousand)
Code Description Third Quarter Last Year
09.30.2013 12.31.2012
1 Total Assets 6,391,039 5,638,374
1.01 Current Assets 189,108 1,500
1.01.01 Cash and Cash Equivalents 187,735 1,500
1.01.09 Other Current Assets 1,373 0
1.01.09.03 Other Assets 1,373 0
1.01.09.03.01 Current Tax Assets 1,373 0
1.02 Non-Current Assets 6,201,931 5,636,874
1.02.02 Investments 6,201,931 5,636,874
1.02.02.01 Equity Investments 6,201,931 5,636,874
1.02.02.01.01 Investments in Associates (Domestic) 6,201,931 5,636,874

3
ITR - Quarterly Financial Information - 9/30/2013 - BB Seguridade Participações S.A.��������������������������������������������������������������������Version : 1�
Parent Company Financial Statements/ Balance Sheet Liabilities
(Reais Thousand)
Code Description Third Quarter Last Year
09.30.2013 12.31.2012
2 Total Liabilities 6,391,039 5,638,374
2.01 Current Liabilities 1,460 0
2.01.01 Accounts Payable 1,460 0
2.03 Equity 6,389,579 5,638,374
2.03.01 Paid-in Capital 5,646,768 5,633,268
2.03.04 Profit Reserves 204,462 0
2.03.04.01 Legal Reserves 51,115 0
2.03.04.02 Estatutory Reserves 153,347 0
2.03.05 Retained Earnings / Accumulated Losses 547,832 0
2.03.06 Equity Valuation Adjustments -9,483 5,106

4
ITR - Quarterly Financial Information - 9/30/2013 - BB Seguridade Participações S.A.��������������������������������������������������������������������Version : 1�
Parent Company Financial Statements/ Statement of Income
(Reais Thousand)
Code Description QTD Current Year YTD Current Year QTD Previous Year YTD Previous Year
07.01.2013 to 09.30.2013
01.01.2013 to 09.30.2013
07.01.2012 to 09.30.2012
01.01.2012 to09.30.2012
3.05 Other operating income and expenses -7,655 -7,987 0 0
3.05.01 Interest earnings of financial instruments 1,547 2,018 0 0
3.05.02 Personnel expenses -2,909 -3,705 0 0
3.05.03 Administrative expenses -164 -169 0 0
3.05.04 Other income (expenses) -6,129 -6,131 0 0
3.06 Revenue from equity investments 550,487 1,578,129 0 0
3.06.01 Equity income 550,487 1,578,129 0 0
3.07 Result before financial result and taxes 547,832 1,570,142 0 0
3.09 Result before taxes on income 547,832 1,570,142 0 0
3.11 Net income from continued operations 547,832 1,570,142 0 0
3.13 Net Income/Loss for the period 547,832 1,570,142 0 0
3.99 Earnings per share (R $/share)
3.99.01 Basic earnings per share
3.99.01.01 ON 0.27392 0.78507 0.00000 0.00000

5
ITR - Quarterly Financial Information - 9/30/2013 - BB Seguridade Participações S.A.��������������������������������������������������������������������Version : 1�
Parent Company Financial Statements/ Statement of Comprehensive Income
(Reais Thousand)
Code Description QTD Current Year YTD Current Year YTD Ending Year YTD Ending Year
07.01.2013 to 09.30.2013
01.01.2013 to 09.30.2013
07.01.2012 to 09.30.2012
01.01.2012 to 09.30.2012
4.01 Net Income/Loss for the period 547,832 1,570,142 0 0
4.02 Other comprehensive income -6,241 -14,589 0 0
4.03 Comprehensive income for the period 541,591 1,555,553 0 0

6
ITR - Quarterly Financial Information - 9/30/2013 - BB Seguridade Participações S.A.��������������������������������������������������������������������Version : 1�
Parent Company Financial Statements/ Statements Cash Flow – Indirect Method
(Reais Thousand)
Code Description YTD Current Year YTD Ending Year 01.01.2013 to 09.30.2013 01.01.2012 to 09.30.2012
6.01 Net Cash From Operating Activities -1,133 0
6.01.01 Cash From Operations -7,780 0
6.01.01.01 Earnings Before Income Taxes 1,570,142 0
6.01.01.02 Equity In the Earnings of Subsidiaries and Associates -1,578,129 0
6.01.01.03 Other income/(expenses) 207
6.01.02 Changes In Assets and Liabilities -2,054 0
6.01.02.01 Tax paid -681 0
6.01.02.02 Current Tax Assets -1,373
6.01.03 Other 8,701 0
6.02 Investment Activities net cash 1,002,823 0
6.02.01 Dividends Received 1,003,903 0
6.02.02 Increase of investment in subsidiary -1,080 0
6.03 Net Cash from Financing Activities -815,455 0
6.03.01 Capital Subscription/Increase (Decrease) 13,500 0
6.03.02 Dividends Paid -828,955 0
6.05 Increase/(Decrease) In Cash and Cash Equivalents 186,235 0
6.05.01 Opening Balance of Cash and Cash Equivalents 1,500 0
6.05.02 Closing Balance of Cash and Cash Equivalents 187,735 0

7
ITR
- Q
ua
rte
rly
Fin
anci
al I
nfo
rma
tion
- 9
/30
/20
13 -
BB
Seg
urid
ad
e P
art
icip
açõ
es
S.A
.���������������������������������������������������������������������������������������������������������������������������������������������������������������������������������V
ers
ion
: 1�
Pa
ren
t C
om
pa
ny
Fin
an
cia
l S
tate
me
nts
/ S
tate
me
nt
of
Ch
an
ge
s in
Eq
uit
y -
01
.01.2
01
3 t
o 0
9.3
0.2
01
3
(Re
ais
Th
ou
sa
nd
)
Co
de
Descri
pti
on
Cap
ital
Cap
ital
Re
serv
es,
Pro
fit
Reta
ined
Acc
um
ula
ted
Oth
er
Sh
are
ho
lders
' S
toc
k
Op
tio
ns
Gra
nte
d a
nd
R
eserv
es
E
arn
ing
s (
losse
s)
Co
mp
reh
en
siv
e
Eq
uit
y
T
rea
su
ry S
hare
s
Inco
me
5.0
1O
peni
ng
Bal
ance
s 5,
633
,26
80
00
5,1
065,
638
,37
4
5.0
3A
djus
ted
Op
enin
g B
alan
ces
5,6
33,2
68
00
05,
106
5,6
38,3
74
5.0
4E
quity
Tra
nsac
tions
With
Par
tne
rs
13,5
000
0-8
17,
848
0-8
04,
348
5.0
4.0
1S
ubsc
ribe
d C
apita
l 13
,500
00
00
13,5
00
5.0
4.0
6D
ivid
end
s 0
00
-81
7,8
480
-81
7,8
48
5.0
5T
otal
Com
pre
hens
ive
Inco
me
0
00
1,5
70,1
42
-14
,58
91,
555
,55
3
5.0
5.0
1N
et I
ncom
e fo
r th
e P
erio
d
00
01,
570
,14
20
1,5
70,1
42
5.0
5.0
2O
the
r C
ompr
ehe
nsiv
e In
com
e
00
00
-14
,58
9-1
4,5
89
5.0
5.0
2.0
3E
quity
me
tho
d on
the
Com
pre
hen
sive
Inc
ome
of
Sub
sidi
arie
s a
nd A
ssoc
iate
s 0
00
0-1
4,5
89
-14
,58
9
5.0
6.A
lloca
tion
0
020
4,4
62
-20
4,4
620
0
5.0
6.0
1R
ese
rves
0
020
4,4
62
-20
4,4
620
0
5.0
7C
losi
ng
Bal
ance
s 5,
646
,76
80
204
,46
254
7,8
32
-9,4
836,
389
,57
9

8
ITR - Quarterly Financial Information - 9/30/2013 - BB Seguridade Participações S.A.��������������������������������������������������������������������Version : 1�
Parent Company Financial Statements/ Statement of Value Added
(Reais Thousand)
Code Description YTD Current Year YTD Ending Year 01.01.2013 to 09.30.2013 01.01.2012 to 09.30.2012
7.05 Inputs acquired from third parties -6,300 0
7.05.05 Other -6,300 0
7.05.05.02 Administrative Expenses -169 0
7.05.05.03 Other expenses -6,131 0
7.06 Distribution of Added Value -6,300 0
7.08 Net Added Value Produced -6,300 0
7.09 Added Value Received Through Transfer 1,580,147 0
7.09.01 Financial Income 2,018 0
7.09.02 Equity In the Earnings of Associates 1,578,129 0
7.10 Total Added Value to Distribute 1,573,847 0
7.11 Distribution of Added Value 1,573,847 0
7.11.01 Personnel 3,705 0
7.11.04 Value Distributed to Shareholders 1,570,142 0
7.11.04.02 Dividends 817,848 0
7.11.04.03Retained Earnings / Accumulated Losses for the Period 752,294 0

9
ITR - Quarterly Financial Information - 9/30/2013 - BB Seguridade Participações S.A.��������������������������������������������������������������������Version : 1�
Consolidated Financial Statements/ Balance Sheet Assets
(Reais Thousand)
Code Description Third Quarter Last Year
09.30.2013 12.31.2012
1 Total Assets 7,826,383 7,292,611
1.01 Current Assets 1,707,576 1,901,306
1.01.01 Cash and Cash Equivalents 1,014,933 1,327,931
1.01.02 Financial Assets 3,016 398
1.01.02.01 Financial Assets at Fair Value 3,016 398
1.01.02.01.01 Trading Securities 2,933 291
1.01.02.01.02 Securities Available for Sale 83 107
1.01.09 Other Current Assets 689,627 572,977
1.01.09.03 Other Assets 689,627 572,977
1.01.09.03.01 Current Tax Assets 87,083 18,098
1.01.09.03.02 Receivable Income 467,788 381,550
1.01.09.03.03 Judicial Deposits 134,489 128,848
1.01.09.03.04 Prepaid Taxes 0 44,201
1.01.09.03.05 Sundry 267 280
1.02 Non-Current Assets 6,118,807 5,391,305
1.02.01 Long-Term Assets 6,602 5,762
1.02.01.09 Deferred Tax Assets 6,602 5,762
1.02.02 Investments 6,112,205 5,385,543
1.02.02.01 Equity Investments 6,112,205 5,385,543
1.02.02.01.01 Investments in Associates (Domestic) 6,112,205 5,385,543

10
ITR - Quarterly Financial Information - 9/30/2013 - BB Seguridade Participações S.A.��������������������������������������������������������������������Version : 1�
Consolidated Financial Statements/ Balance Sheet Liabilities
(Reais Thousand)
Code Description Third Quarter Last Year
09.30.2013 12.31.2012
2 Total Liabilities 7,826,383 7,292,611
2.01 Current Liabilities 1,165,914 1,384,583
2.01.01 Accounts Payable 180 624,698
2.01.01.01 Dividends Payable 180 624,698
2.01.05 Other Liabilities 1,165,734 759,885
2.01.05.01 Provisions for Labor, Fiscal and Civil Claims 8,703 5,718
2.01.05.02 Current Tax Liabilities 199,466 92,756
2.01.05.03 Commissions to Apportion 911,613 504,428
2.01.05.04 Sundry Creditors (Domestic) 14,066 146,635
2.01.05.05 Indirect Taxes 0 8,122
2.01.05.06 Labor Charges and Obligations 0 1,483
2.01.05.07 Payable to Related Companies 28,934 0
2.01.05.08 Sundry 2,952 743
2.02 Non-Current Liabilities 270,890 269,654
2.02.01 Long-Term Liabilities 270,890 269,654
2.02.01.05 Deferred Tax Liabilities 270,890 269,654
2.03 Consolidated Equity 6,389,579 5,638,374
2.03.01 Paid-in Capital 5,646,768 5,633,268
2.03.04 Profit Reserves 204,462 0
2.03.04.01 Legal Reserves 51,115 0
2.03.04.02 Estatutory Reserves 153,347 0
2.03.05 Retained Earnings / Accumulated Losses 547,832 0
2.03.06 Equity Valuation Adjustments -9,483 5,106

11
ITR - Quarterly Financial Information - 9/30/2013 - BB Seguridade Participações S.A.��������������������������������������������������������������������Version : 1�
Consolidated Financial Statements/ Statement of Income
(Reais Thousand)
Code DescriptionQTD Current
YearYTD Current
YearQTD Previous
YearYTD Previous
Year
07.01.2013 to 09.30.2013
01.01.2013 to 09.30.2013
07.01.2012 to 09.30.2012
01.01.2012 to 09.30.2012
3.05 Other operating income/expenses 335,008 963,308 0 0
3.05.01 Commission income 425,497 1,230,052 0 0
3.05.02 Income from financial instruments 35,682 90,586 0 0
3.05.03 Personnel expenses -6,636 -15,550 0 0
3.05.04 Administrative expenses -65,461 -200,654 0 0
3.05.05 Other income/(expenses) -54,074 -141,126 0 0
3.06 Equity In the earnings of subsidiaries 329,841 938,213 0 0
3.06.01 Revenue from equity investments 329,841 938,213 0 0
3.07 Income before financial income and taxes 664,849 1,901,521 0 0
3.09 Income before taxes 664,849 1,901,521 0 0
3.10 Income taxes -117,017 -331,379 0 0
3.10.01 Current -117,017 -331,379 0 0
3.11 Net income from continued operations 547,832 1,570,142 0 0
3.13 Net income/loss for the period 547,832 1,570,142 0 0
3.13.01 Attributable to owners of the parent 547,832 1,570,142 0 0
3.99 Earnings per share - (In Reais/Share)
3.99.01 Basic earnings per share
3.99.01.01 ON 0.27392 0.78507 0.00000 0.00000

12
ITR - Quarterly Financial Information - 9/30/2013 - BB Seguridade Participações S.A.��������������������������������������������������������������������Version : 1�
Consolidated Financial Statements/ Statement of Comprehensive Income
(Reais Thousand)
Code Description QTY Current Year YTD Current Year 07.01.2013 to 09.30.2013 01.01.2013 to 09.30.2013
4.01 Net income/loss for the period 547,832 1,570,142
4.02 Other comprehensive income -6,241 -14,589
4.03 Comprehensive income for the period 541,591 1,555,553
4.03.01 Attributable to parent company 541,591 1,555,553

13
ITR - Quarterly Financial Information - 9/30/2013 - BB Seguridade Participações S.A.��������������������������������������������������������������������Version : 1�
Consolidated Financial Statements/ Statements Cash Flow – Indirect Method
(Reais Thousand)
Code Description YTD Current Year YTD Previous Year 01.01.2013 to 09.30.2013 01.01.2012 to 09.30.2012
6.01 Net Cash From Operating Activities 825,313 0
6.01.01 Cash From Operations 963,308 0
6.01.01.01 Earnings Before Income Taxes 1,901,521 0
6.01.01.02 Equity In the Earnings Of Subsidiaries And Associates -938,213 0
6.01.02 Changes In Assets And Liabilities -137,995 0
6.01.02.01 Decrease Fair Value In Assets Through Profit Or Loss -2,642 0
6.01.02.02 Decrease In Financial Assets Available For Sale 24 0
6.01.02.03 Income and Social Contribution Taxes Paid -304,968 0
6.01.02.04 Increase In Assets For Current Taxes -68,985 0
6.01.02.05 Increase In Assets For Deferred Taxes -840 0
6.01.02.06 Increase In Other Assets -167,649 0
6.01.02.07 Increase In Contingent Liabilities 2,985 0
6.01.02.08 Increase In Liabilities For Current Taxes 106,710 0
6.01.02.09 Increase In Liabilities For Deferred Taxes 1,236 0
6.01.02.10 Increase In Other Liabilities 296,146 0
6.02 Net Cash From Investment Activities 319,829 0
6.02.01 Dividends Received 867,238 0
6.02.02 Acquisition of Investments -547,409 0
6.03 Net Cash From Financing Activities -1,458,140 0
6.03.01 Capital Subscription/Increase (Decrease) 13,500 0
6.03.02 Dividends Paid -1,471,640 0
6.05 Increase (Decrease) In Cash And Cash Equivalents -312,998 0
6.05.01 Opening Balance Of Cash And Cash Equivalents 1,327,931 0
6.05.02 Closing Balance Of Cash And Cash Equivalents 1,014,933 0
14
ITR
- Q
ua
rte
rly
Fin
anci
al I
nfo
rma
tion
- 9
/30
/20
13 -
BB
Seg
urid
ad
e P
art
icip
açõ
es
S.A
.��������������������������������������������������������������������������������������������������������������������������������������������������������������������������������V
ers
ion
: 1�
Co
ns
oli
da
ted
Fin
an
cia
l S
tate
me
nts
/ S
tate
me
nt
of
Ch
an
ge
s i
n E
qu
ity
- 0
1.0
1.2
013
to
09
.30
.20
13
(Re
ais
Th
ou
sa
nd
)
Co
de
De
sc
rip
tio
nC
ap
ital
Cap
ital
Re
serv
es,
Pro
fit
Reta
ined
A
cc
um
ula
ted
Oth
er
Sh
are
ho
lders
' A
ttri
bu
tab
le t
o
Sh
are
ho
lders
'S
toc
k
Op
tio
ns
Gra
nte
d a
nd
R
eserv
es
earn
ing
s (
los
ses
) C
om
pre
he
nsiv
e
Eq
uit
y
no
n-c
on
tro
llin
g
Eq
uit
y
T
rea
su
ry S
hare
s
Inco
me
inte
res
ts
Co
nso
lid
ate
d
5.0
1O
peni
ng
Bal
ance
s 5
,63
3,2
680
00
5,1
06
5,6
38
,374
05
,63
8,3
74
5.0
3A
djus
ted
Op
enin
g B
alan
ces
5,6
33
,268
00
05
,10
65
,63
8,3
740
5,6
38
,374
5.0
4E
quity
Tra
nsac
tions
With
Par
tne
rs
13
,50
00
0-8
17
,848
0-8
04
,348
0-8
04
,348
5.0
4.0
1S
ubsc
ribe
d C
apita
l 1
3,5
00
00
00
13
,50
00
13
,50
0
5.0
4.0
6D
ivid
end
s 0
00
-81
7,8
480
-81
7,8
480
-81
7,8
48
5.0
5T
otal
Com
pre
hens
ive
Inco
me
0
00
1,5
70
,142
-14
,58
91
,55
5,5
530
1,5
55
,553
5.0
5.0
1N
et I
ncom
e fo
r T
he P
erio
d
00
01
,57
0,1
420
1,5
70
,142
01
,57
0,1
42
5.0
5.0
2O
the
r C
ompr
ehe
nsiv
e In
com
e
00
00
-14
,58
9-1
4,5
89
0-1
4,5
89
5.0
5.0
2.0
3A
djus
tme
nts
of F
inan
cial
Inst
rum
ents
0
00
0-1
4,5
89
-14
,58
90
-14
,58
9
5.0
6A
lloca
tion
0
02
04
,46
2-2
04
,462
00
00
5.0
6.0
1R
ese
rves
0
02
04
,46
2-2
04
,462
00
00
5.0
7C
losi
ng
Bal
ance
s 5
,64
6,7
680
20
4,4
62
54
7,8
32
-9,4
83
6,3
89
,579
06
,38
9,5
79

15
ITR - Quarterly Financial Information - 9/30/2013 - BB Seguridade Participações S.A Version : 1.���������������������������������������������������
Consolidated Financial Statements/ Statement of Value Added
(Reais Thousand)
Code Description YTD Current Year YTD Previous Year 01.01.2013 to 09.30.2013 01.01.2012 to 09.30.2012
7.05 Input Acquired From Third Parties 888,272 0
7.05.05 Other 888,272 0
7.05.05.01 Revenue from comissions 1,230,052 0
7.05.05.02 Administrative Expenses -200,654 0
7.05.05.03 Other Expenses -141,126 0
7.06 Gross Added Value 888,272 0
7.08 Net Added Value Generated By The Entity 888,272 0
7.09 Added Value Received Through Transfer 1,028,799 0
7.09.01 Financial income 90,586 0
7.09.02 Equity In The Earnings of Associates 938,213 0
7.10 Total Added Value to Distribute 1,917,071 0
7.11 Distribution of Added Value 1,917,071 0
7.11.01 Personnel 15,550 0
7.11.02 Taxes, Fees And Contributions 331,379 0
7.11.04 Value Distributed to Shareholders 1,570,142 0
7.11.04.02 Dividends 817,848 0
7.11.04.03 Retained Earnings / Accumulated Losses 752,294 0

���
�
ITR – Management comments on performance
Dear Shareholders,
BB Seguridade recorded a net income of R$547.8 million in the quarter, which corresponds to a return on average equity annualized of 38.0% and basic earnings per share of R$0.27. Premiums written by affiliated insurance totaled R$3.6 billion in the period. In turn, the affiliates that act in the segments of pension plans and premium bonds, reported collection of R$3.7 billion and R$1.4 billion, respectively.
Since the company went public until the end of the quarter, the shares of BB Seguridade recorded appreciation of 31.4%, compared to an depreciation of 4.6% in the Índice Bovespa, the main index of the Brazilian stock.
Presentation of the Company and its business segments
BB Seguridade Participações was created on 12.20.2012 and, since 12.31.2012, holds the stakes previously owned by Banco do Brasil in insurance, pension plan and premium bonds companies, besides a fully-owned insurance broker, that sells products through the branch network of Banco do Brasil S.A.
In its corporate structure, BB Seguridade has two holding companies: BB Seguros and BB Cor Participações, both wholly-owned subsidiaries.
The stakes in insurance, pension plan and premium bonds companies are held by BB Seguros.
In the insurance segment, BB Seguridade, through BB Seguros, has two partnerships with the spanish group Mapfre:
• BB Mapfre SH1 - Operates in the segment of life. Its main products are life insurance, credit insurance, rural and housing. BB Seguridade has 49.9% of its voting capital and 74.9% of its total capital.
• Mapfre BB SH2 - Focused on the P&C segments. Its main products are auto insurance, besides others linked to P&C, as big risks. BB Seguridade owns 49.0% of its voting capital and 50% of its total capital.
In the open-end pension plans segment, BB Seguridade has a partnership with Principal Financial Group in Brasilprev Seguros e Previdência S.A. This Company sales private solutions for pension, with a highlight for PGBL and VGBL products. BB Seguridade owns 49.9% of the voting capital and 74.9% of the total capital.
BB Seguridade operates in the premium bonds segment through Brasilcap Capitalização S.A., which holds, also through BB Seguros, 49.9% of the voting capital and 66.7% of total capital.
Company holds, through BB Cor Participações, the controlling stake of BB Corretora, which sells insurance products of the other companies described previously. BB Corretora has an exclusive contract that allows it to explore the bacassurance channel, through Banco do Brasil branch network.
New Businesses
On 08.27.2013, BB Seguridade, through BB Seguros Participações S.A., effected the purchase of 212,421 common shares of IRB-Brasil Resseguros S.A., until then held by the Federal Government. With this transaction, BB Seguros holds a shareholding of 20.5% in IRB-Brasil Resseguros S.A.

���
�
Banco do Brasil S.A. and BB Seguridade Participações S.A., also published a Material Fact in 06.11.2013, which reported the signing of an agreement between Banco do Brasil S.A., BB Seguros Participações S.A., BB Corretora de Seguros e Administradora de Bens S.A., Odontoprev S.A. and Odontoprev Serviços Ltda., aiming to develop and disseminate, through a new corporation, called Brasildental Operadora de Planos Odontológicos S.A., and to distribute and sell, through BB Corretora, dental plans under the brand BB Dental, with exclusivity on all BB channels in the Brazilian territory. The Agreement was approved by the Banco Central de Brasil and CADE – Conselho Administrativo de Defesa Econômica. When constituted, BB Seguros will hold 49.99% of the common shares and 74.99% of the Brasildental's total capital.
For further information about BB Seguridade, please refer to www.bancodobrasilseguridade.com.br

Notes to the Financial Statements
18
1 – Operations
BB Seguridade Participações S.A. ("Grupo BB Seguridade" or "Group") was incorporated as a subsidiary of Banco do Brasil S.A. on December 20, 2012, in accordance with Brazilian law. The purpose of the Group is to participate in insurance companies, capitalization, open private pension funds as well as other companies whose corporate purpose is brokerage and facilitation of business involving personal, property and vehicle insurance, capitalization plans, private pension plans and asset management.
BB Seguridade Participações S.A., enrolled with the CNPJ (Brazilian equivalent of IRS Registry of Legal Entities) 17.344.597/0001-94, headquartered in Setor Bancário Sul, Quadra 1, Bloco A, Lote 31, Edifício Sede I, 15th Floor, Room 3, Brasilia, Distrito Federal, Brazil.
The Group's operations are conducted through its wholly owned subsidiaries BB Corretora de Seguros e Administradora de Bens S.A. and BB Seguros Participações S.A., which are under common administrative and corporate control.
2 – Acquisitions, Disposals and Corporate Restructuring
Increase in equity participation in Brasilprev Seguros e Previdência S.A. (Brasilprev)
In October 2009, for the purpose of redefining the terms of the existing partnership in the open private pension segment, BB Seguros Participações SA (BB Seguros) and Principal Financial Group do Brasil Ltda. (PFG), with the approval of Banco do Brasil, signed a Memorandum of Understanding for the trading of private pension plans for an additional 23-year period.
In April 2010, BB Seguros and PFG renewed their strategic partnership in development and commercialization of private pension plans in Brazil. Among the conditions agreed upon by the partners was the increasing in the participation of BB Seguros in Brasilprev to 74.995% of its capital, in return for the exclusivity granted to Brasilprev, over the term of the partnership, to trade private pension plans in the distribution channels of Banco do Brasil. The partnership agreement establishes that the company´s management model remains shared between the partners.
On that occasion, the Principal acquired 4% of the total shares of Brasilprev held by Serviço Brasileiro de Apoio às Micro e Pequenas Empresas (Sebrae).
Corporate Structure of Brasilprev:
Common stock Preferred stock Total
% # stock % # stock % # stock
Principal 50.01 572,634 - - 25.005 572,634
BB Seguros 49.99 572,406 100.00 1,145,040 74.995 1,717,446
Total 100.00 1,145,040 100.00 1,145,040 100.00 2,290,080
Additionally, on December 19, 2011, MAPFRE Brasil Participações, BB Seguros Participações and Brasilprev Seguros e Previdência celebrated a contract of sale of shares of MAPFRE Nossa Caixa Vida e Previdência (MNCVP). It was established in contract the purchase of 100% of the shares of the MNCVP by Brasilprev, with 49% of shares owned by BB Seguros and 51% of shares held by the participation of MAPFRE. The agreement was finalized on July 31, 2012, and the final values resulted in the payment of R$ 81,809 thousand and profit before tax in the amount of R$ 69,926 thousand.
Disposal of Brasilsaúde
In May 2010, BB Seguros and Sul América Seguro Saúde S.A. (SAS Saúde) entered into a Sale and Purchase Agreement for the acquisition by SAS Health of all shares held by BB Seguros (49.67% of the total share capital) in Brasilsaúde Companhia de Seguros. On July 08, 2010, after approval by the Agência Nacional de Saúde (ANS), the operation was closed for R$ 29,158 thousand.
Balances and results

Notes to the Financial Statements
19
R$ thousand
Assets 137,807
Liabilities 93,270
Equity 44,537
Results until Disposal (2,247)
Brasilsaúde adjusted equity 44,537
Value invested in the Group (49.67%) 22,121
Consideration received in the transaction 29,158
Disposal of gross profit 7,037
Shareholders´ restructuring - Brasilveículos Companhia de Seguros
In October 2010, after the approval of Brazil’s Private Insurance Supervisory Office (Susep), BB Aliança REV acquired, by the amount of R$ 359,360 thousand, the entire participation held by Sul América in Brasilveículos Companhia de Seguros (Brasilveículos), according to the sale and purchase contract signed in May 2010 and respective amendment.
This acquisition meant to the group a business combination achieved in stages. According to IFRS 3, the acquirer shall remeasure its previously held equity interest in the acquiree at its acquisition-date fair value and recognize the resulting gain or loss.
These procedures resulted in an after tax gain of R$ 554,727 thousand recorded in Other operating income as follows:
Fair value of held equity interest 815,600
Carrying amount of held equity interest (260,873)
Gain on held equity interest 554,727
Deferred taxes (188,607)
After tax gain 366,120
R$ thousand
Consideration paid 359,360
Fair value of held equity interest 815,600
Total 1,174,960
Identified net assets 400,109
Goodwill 774,851
In November 2010, BB Seguros increased the capital of BB Aliança REV by R$ 260,186 thousand. Capital was paid in through transfer to BB Aliança REV of 26,018,646 common shares of Brasilveiculos, which represented 70% of the capital of Brasilveículos.
As such, BB Aliança REV now holds 100% of the total capital share of Brasilveículos, as follows:
Previous position After restructuring position
Common stock Preferred stock Common stock Preferred stock
BB Seguros 40% 100% - -
BB Aliança REV - - 100% 100%
Sul América 60% - - -
Increase in equity participation in Brasilcap Capitalização
In January 2011, BB Seguros entered into a Sale and Purchase Agreement for the acquisition of the entire participation (16.67%) held by Sul América Capitalização S.A. (Sulacap) in Brasilcap. The deal took effect in July 2011, and the participation of BB Seguros increased from 49.99% to 66.66%, however the joint control still remained.
The amount involved in the increase of Brasilcap participation is as follows:

Notes to the Financial Statements
20
R$ thousand
Brasilcap
Acquisition price 145,224
Interest in equity acquired (16.67%) 34,475
Premium on acquisition 110,749
Partnership with MAPFRE
In May 2010, the Group announced that BB Seguros and Grupo Segurador MAPFRE (MAPFRE) had entered into a partnership agreement so as to form a strategic alliance in the segments of personal, casualties and vehicles insurance for a 20-year period.
Based on this agreement, as from June 2011, BB Seguros and MAPFRE started to operate jointly. Two holdings, with separate legal identities under private law, were organized: BB MAPFRE SH1 Participações S.A. (SH1), whose branch of activity aggregates personal, property and agricultural insurance, and MAPFRE BB SH2 Participações S.A. (SH2), focused on casualty and vehicle insurance.
The companies present the following structure:
BB MAPFRE SH1 Participações S.A. MAPFRE BB SH2 Participações S.A.
% of total capital
% Common stock
% Preferred stock
% of total capital
% Common stock
% Preferred stock
BB Seguros 74.99 49.99 100.0 50.00 49.00 51.00
MAPFRE 25.01 50.01 - 50.00 51.00 49.00
Capital subscription in SH1 by BB Seguros and MAPFRE was made through transfer of the investments in insurance companies Companhia de Seguros Aliança do Brasil, MAPFRE Vera Cruz Vida e Previdência S.A. and Vida Seguradora S.A., as well as holdings BB Aliança Participações S.A. and MAPFRE Participações Ltda. Capital subscription in SH2 by BB Seguros and MAPFRE was made through transfer of the investments in insurance companies Aliança do Brasil Seguros S.A., Brasilveículos Companhia de Seguros, MAPFRE Vera Cruz Seguradora S.A. and MAPFRE Riscos Especiais Seguradora S.A., as well as holding BB Aliança REV Participações S.A. and MAPFRE Assistência S.A.
In order to equalize the participation in the holding companies organized as a result of the agreement, BB Seguros paid up capital of R$ 332,614 thousand.
The contributed businesses deconsolidation process and the recognition of the new fair value participation were reconized in accordance with the effective accounting standards, which establishes that in applying the accounting standards to non-monetary contributions, in exchange for equity interest, a venturer shall recognize in profit or loss for the period the portion of gains or losses attributable to the equity interest of the other venturers.
These procedures resulted in an after tax gain of R$ 791,540 thousand recorded in Other operating income as follows:
R$ thousand
BB MAPFRE SH1 MAPFRE BB SH2 Total
Fair value of participation in holdings 6,285,569 1,697,740 7,983,309
Carrying amount of the contributed net assets (1,674,382) (1,665,919) (3,340,301)
Elimination of unrealized gains (3,917,351) (65,883) (3,851,468)
Gain on holdings 693,836 97,704 791,540
Income taxes (235,904) (33,219) (269,124)
Effects through equity method investments, net of taxes 62,301 (135,678) (73,376)
After tax gain (loss) 520,233 (71,193) 449,040

Notes to the Financial Statements
21
Fair value of the assets and liabilities transferred to SH1 and SH2 R$ thousand
Jun 30, 2011
BB MAPFRE SH1 MAPFRE BB SH2 Total
Cash and bank deposits 1,334 20,562 21,896
Securities purchased under resale agreements 19,387 1,912 21,299
Financial assets 2,514,893 1,179,188 3,694,081
Noncurrent assets available for sale - 44,706 44,706
Investments in associates 698,797 861,934 1,560,731
Property and equipment 4,482 59,192 63,674
Intangible assets 486,767 1,091,228 1,577,995
Current tax assets 7,301 12,942 20,243
Deferred tax assets 186,101 299,575 485,676
Other assets 670,372 2,191,614 2,861,986
Fair value of assets 4,589,434 5,762,853 10,352,287
Provision for labor, tax and civil claims 18,318 270,158 288,476
Insurance contracts 1,966,436 1,892,218 3,858,654
Current tax liabilities 15,881 6,590 22,471
Deferred tax liabilities - 238 238
Other liabilities 384,366 378,276 762,642
Fair value of liabilities 2,385,001 2,547,480 4,932,481
Fair value of net assets 2,204,433 3,215,373 5,419,806
BB Seguros participation - % 74.99% 50%
BB Seguros participation 1,653,104 1,607,687 3,260,791
Fair value of the interest in the holdings (2,346,940) (1,705,391) (4,052,331)
Allocated goodwill 693,835 97,704 791,539
Identified intangible assets from this acquisition R$ thousand
Jun 30, 2011
Pre-acquisition intangible assets 866,037
Distribution channels 517,241
Related to customer portfolios 170,508
Brands 24,209
Total 1,577,995
The identified intangible assets are amortized in accordance with their useful life out by a specialized and independent firm, corresponding 20 years on average. From Jan 01, 2013 to Sep 30, 2013, the amounts amortized totaled R$ 13,769 thousand.
The effects concerning the constitution of the identified intangible assets and their amortization are presented in net income from SH1 and SH2 holdings’ equity method investments.
Structuring of BB Seguridade and organization of subsidiaries BB Cor Participações S.A. and BB Seguridade Participações S.A.
As of December 2012, the Group established BB Seguridade Participações S.A. (BB Seguridade) and BB Cor Participações S.A. (BB Cor).
After establishment of BB Seguridade, the company holds the following participation:
a) 100% of the shares of BB Cor;
b) 100% of the shares of BB Seguros Participações S.A. (BB Seguros) which, in turn, holds interests in the followings companies:
(i) 74.9% of the total shares (49.9% common shares) of BB MAPFRE SH1 Participações S.A., which operates in the field of personal insurance in partnership with MAPFRE Group;

Notes to the Financial Statements
22
(ii) 50.0% of the total shares (49.0% common shares) of MAPFRE BB SH2 Participações S.A., which operates in the field of property insurance also in partnership with MAPFRE Group;
(iii) 74.9% of the total shares (49.9% common shares) of Brasilprev Seguros e Previdência S.A., which operates in private pension plans in partnership with Principal Financial Group;
(iv) 66.7% of the total shares (49.9% common shares) of Brasilcap Capitalização S.A., which operates in the capitalization Market in partnership with Icatu Seguros S.A. and Companhia de Seguros Aliança da Bahia.
(v) 100% of the shares of Nossa Caixa Capitalização S.A, which operates in the capitalization market.
The Group objectives with the establishment of BB Seguridade are as follows:
(i) to consolidate under a single company, all BB activities in the areas of insurance, capitalization, open private pension and related activities, including any future expansion of these activities in Brazil or abroad, either organic or not;
(ii) to provide gains of scale in these operations;
(iii) to reduce costs and expenses in the insurance segment.
The administration, backed by monitoring tools that align executives' behavior to the interests of shareholders and society in general, will be conducted with the best corporate governance practices, so as to allow BB Seguridade to be listed in a special segment of the market shares of BM&F Bovespa S.A. - Bolsa de Valores, Mercadorias e Futuros, called New Market.
As of December 2012, the Group established BB Cor Participações S.A. (BB Cor), which now holds 100% participation in BB Corretora de Seguros e Administradora de Bens S.A. (BB Corretora).
The Group's objective is to expand the market share of BB Corretora which will trade within and outside of the distribution channels of Banco do Brasil, third-party products in the fields in which the Group does not have exclusive agreements with partner companies.
BB Cor will also hold interest in the capital of other companies operating in the market as brokers in the commercialization of insurance, pension plans, capitalization and/or healthcare and dental plans in which the Group will participate in the future.
IPO
As of December 20, 2012, Banco do Brasil established BB Seguridade Participações S.A. (BB Seguridade), in order to consolidate under a single company, all BB activities in the areas of insurance, capitalization, open private pension and related activities; provide gains of scale in these operations; and to reduce costs and expenses in the insurance segment.
As of February 20, 2013, by Extraordinary General Meeting, Banco do Brasil decided by the Inicial Public Offering (IPO) of BB Seguridade. The minutes of the General Meeting was filed with the Junta Comercial do Distrito Federal (Commercial Registry of the Federal District) on March 14, 2013, under No. 20130248401, published in the Diário Oficial da União (Union Official Gazette) and in the Jornal de Brasília (Journal of Brasilia) on March 25, 2013.
The IPO occurred as of April 29, 2013, on the over-the-counter market, according CVM 400 Instruction. Simultaneously, there were efforts in order to issue shares abroad, in accordance with the Placement Facilitation Agreement ("International Placement agreement"), concluded between the company, the Shareholder Seller and International Placement Agents.
Final data about the IPO, considering the exercise of additional stock options, is released bellow:

Notes to the Financial Statements
23
Investor Quantities of shares buyers
Number of shares acquired (1)
Individuals 103,359 105,448,951
Investiments Clubs 207 3,050,427
Investments Fund 586 152,701,554
Pension Plan Entities 16 1,431,673
Insurance Entities 2 1,494,600
Foreign Investors 473 393,949,671
Intermediary Institutions participants of distribution consortium 0 0
Financial Institutions linked to the company and/or participants of consortium 0 0
Other financial institutions 1 10,000
Other legal entities linked to the company and/or participants of consortium 9 8,740
Other legal entities 8,886 12,686,344
Partners, managers, employees, agentes and other individual linked to the company and/or other participants of consortium
794 4,215,644
Others 2 2,396
Total 114,335 675,000,000
(1) Includes 109,484,800 shares acquired for J.P Morgan, 2,500,000 shares acquired for BTG Pactual and 5,810,000 shares acquired for Citi and/or individuals that, directly or indirectly, control, are under control or are under common control of J.P. Morgan, BTG Pactual and Citi, respectively, acting on behalf of its customers, in order to do hedge with derivative transactions, including as a result of contracts of total return swap and/or other financial instruments signed overseas with the same effect.
Instituto de Resseguro do Brasil (IRB)
As of May 24, 2013, BB Seguros Participações S.A. (BB Seguros) and the Federal Government signed an agreement (Contrato de Transferência de Ações) aiming to transfer 212,421 common shares issued by IRB Brasil Resseguros S.A. (IRB) held by the Federal Government to BB Seguros.
Moreover, today, a Shareholders Agreement was signed between BB Seguros, the Federal Government, Bradesco Auto Re – Companhia de Seguros S.A., Itaú Seguros S.A., Itaú Vida e Previdência S.A. and Fundo de Investimento em Participações Caixa Barcelona in order to create an IRB’s governance control group by regulating the relationship between the partners, as well as the company’s management structure and operation. Common shares were linked to the Shareholders Agreement, representing 20% of the total common shares held by BB Seguros; 15% of the total common shares held by the Federal Government; 15% of the total common shares held by Itaú Seguros Group; 20% of the total common shares held by Bradesco Seguros; and 3% of the total common shares held by FIP Caixa Barcelona.
Besides the Sheareholders Agreement celebration, the restructuring process of IRB involves the following steps:
a) conversion of IRB non-voting shares into common shares (1:1);
b) creation of a golden share held by the Federal Government (with the veto right to certain decisions), and;
c) capital increase of IRB by its current shareholders, with the issuance of new shares, and the commitment of the Federal Government not to exercise its preference rights.
As of August 20, 2013, occurred an Extraordinary Shareholders Meeting for approval of the capital increase of the IRB, which was a condition for payment, by BB Seguros, the acquisition of common shares.
As of August 27, 2013, BB Seguros holds 20.5% of the capital of IRB through the transfer of shares and the payment made to the Union as follows
R$ thousand
Number of shares 212,421 shares
Amount per share (R$) 2,577.00
Acquisition price 547,409
Interest equity acquired adjusted in August, 31th, 2013 489,259
Premium on acquisition 58,150
The transaction was approved by Conselho Administrativo de Defesa Econômica (CADE) on April 16, 2013 and by Superintendência de Seguros Privados (SUSEP) on September 16, 2013.

Notes to the Financial Statements
24
BB Seguridade management is assessing the impacts resulting from acquisition of IRB in accordance with IFRS 3 and IAS 28. The definitive values related to the transaction will be obtained after the study of allocation of price paid.
BrasilDental
As of June 11, 2013, Banco do Brasil, BB Seguros Participações SA (BB Seguros), BB Corretora de Seguros e Administradora de Bens S.A. (BB Corretora), Odontoprev S.A. (Odontoprev) and Odontoprev Serviços Ltda. (Odontoprev Serviços) signed today an Agreement (Acordo de Associação e Outras Avenças) aiming to develop and disseminate, by a new limited company named Brasildental Operadora de Planos Odontológicos S.A. (Brasildental), and to distribute and sell, by BB Corretora, dental plans under the brand BB Dental, exclusively through BB channels in the Brazilian territory.
Brasildental will have R$ 5 million as initial capital, distributed in 100,000 common shares (ON) and 100,000 preferred shares (PN) with the following shareholding structure:
Brasildental Operadora de Planos Odontológicos S.A.
% of total capital % Common stock % Preferred stock
BB Seguros 74.99 49.99 100.00
Odontoprev 25.01 50.01 --
BB Seguros and Odontoprev will respond for Brasildental’s initial capital constitution accordingly to their respective ownership stake.
The Agreement was approved by Conselho Administrativo de Defesa Econômica (CADE) on August 02, 2013 and on September 19, 2013, Banco Central do Brasil (BACEN) authorized the indirect participation of Banco do Brasil in the capital of Brasildental.
The next stages to be completed are:
a) constituition of the company, and
b) approval by Agência Nacional de Saúde (ANS) to Brasildental operate and offer their products in the Brazilian market of dental plans.
The Agreement will remain effective for 20 years, renewable for equal periods.
3 - Presentation of Financial Statements
a) Statement of Compliance
The individual financial statements have been prepared in accordance with the accounting guidelines derived from Brazilian corporation law and are released in compliance to Comitê de Pronunciamentos Contabeis –CPC (Accounting Pronouncements Committee), approved by Conselho Federal de Contabilidade – CFC (Federal Accounting Council).
The consolidated financial statements have been prepared in accordance with International Financial Reporting Standards (IFRS), issued by the International Accounting Standards Board (IASB), and interpretations issued by the International Financial Reporting Interpretation Committee (IFRIC) and its predecessor institutions.
These financial statements were approved by the Executive Board of Directors on Nov 08, 2013.
b) Continuity
Management evaluated the ability of the Group to operate normally and is convinced that the Group has the resources to continue their business in the future. Additionally, the Administration is not aware of any material uncertainty that might generate significant doubts about the companies’ ability to continue as a going concern.
c) Measurement basis of assets and liabilities
These individual and consolidated financial statements have been prepared using historical cost as a measurement basis, except for the following items: (i) financial assets and liabilities held for trading, (ii)

Notes to the Financial Statements
25
financial assets and liabilities measured at fair value through profit or loss, and (iii) financial assets available for sale, which were measured at fair value.
d) Functional and presentation currency
The consolidated financial statements are presented in Brazilian Reais (R$), the functional and presentation currency of the Group. Except as otherwise indicated, the financial information is presented in quantitative thousands of Reais (R$ thousand). BB Seguridade did not do transactions in foreign currency.
e) Consolidation basis
The consolidated financial statements of the Group include the consolidation of assets and liabilities from BB Seguridade Participações S.A. and the controlled entities, as follows:
Company Activity Country of constitution
% Share
Sep 30,2013 Dec 31,2012
BB Seguros Participações S.A. Holding Brazil 100% 100%
BB Cor Participações S.A. Holding Brazil 100% 100%
BB Corretora de Seguros e Administradora de Bens S.A..
Brokerage Brazil 100% 100%
BB Capitalização S.A.(1) Capitalization Plans Brazil 100% 100%
(1) Previously called Nossa Caixa Capitalização S.A.
The intra-group balances and transactions, as any unrealized income or expenses on transactions between companies, are eliminated in preparing the consolidated financial statements. Unrealized gains arising from transactions with equity method investments are eliminated against the investment to the extent of Grupo BB Seguridade.
f) Changes in accounting policies
The accounting policies and methods used in preparing these consolidated financial statements equivalent to those applied to the consolidated financial statements for the year ended Dec 31,2012, except for the adoption of the following standards effective as of Jan 01,2013:
• IFRS 10 - Consolidated financial statements; • IFRS 11 - Joint arrangements; • IFRS 13 - Fair value measurement.
The effects of these standards are described below.
IFRS 10 - Consolidated Financial Statements - IFRS 10 replaces consolidation guidelines in IAS 27 - Consolidated and Separate Financial Statements and SIC 12 - Consolidation special purpose entities, introducing a single consolidation model to be applied in the control analysis for all investees. According to IFRS 10, control is based on the evaluation of wether investor has (a) power over the investee, (b) exposure, or rights, on variable returns arising from its involvement with the investee and (c) the capacity to use its power over the investee to affect return.
These new requirements have the potential to affect results of the evaluation of the BB Seguridade’s investments considered subsidiaries and therefore change the scope of consolidation. The requirements relating to the consolidation procedures, changes in non-controlling interests and the loss of control remain unchanged.
The management revised control ratings in accordance with IFRS 10 and concluded that there was no effect on the classification of its investments (as subsidiaries or not) during the comparative period or periods covered by these financial statements.
IFRS 11 - Joint arrangements - IFRS 11 replaces IAS 31 - Interests in joint ventures and the SIC 13 - non-monetary contributions to jointly controlled entities. According to IFRS 11, equity method is mandatory and the method of proportional consolidation of Jointly-owned subsidiaries is prohibited.
IFRS 11 derives from the principle that the parties to a joint venture agreement should determine the type of joint arrangements, based on the assessment of rights and obligations, conducting in cognition to the type of joint arrangement. There are two types of joint arrangements: (i) joint operations: rights and obligations on assets and liabilities concerning the agreement. The parties recognize their assets, liabilities and the corresponding income and expenses proportionally to their interest in the operation, (ii) joint venture: rights to the net assets of the agreement. The parties recognize their investments at the equity method (MEP).

Notes to the Financial Statements
26
BB Seguridade has joint ventures in accordance with of IFRS 11 Joint ventures, which are already, since the beginning of operations of the Group, accounted for using the equity method. Therefore, the adoption of IFRS 11 had no material effect on the consolidated financial statements of the Group.
IFRS 13 - Fair Value Measurement - IFRS 13 provides a review of fair value definition and guidelines on how it should be measured, together with a set of disclosure requirements. However, IFRS 13 does not change requirements regarding that items should be measured or disclosed at fair value. The standard was applied on a prospective basis for periods beginning on or after January 1, 2013. 13 The adoption of IFRS 13 did not have a material effect on the consolidated financial statements of the Group.
g) Seasonality of operations
BB Seguridade and its subsidiaries consider the nature of your transactions as non-seasonal and cyclical, taking into account the activities carried out by the Group. Consequently, no specific disclosures are provided in these notes to the consolidated financial statements for the nine months ended September 30, 2013.
4 – Significant Accounting Practices
a) Revenue and expense recognition
Revenue and expenses are recognized on an accrual basis and recorded in the financial statements in the period when they were generated or incurred. This concept is applied to the main revenue streams generated by BB Seguridade and its subsidiaries’ activities, namely:
a.1) Revenue from equity investments – The revenue from application of equity method of accounting for equity investments are recognized proportionally to the equity interest held by BB Seguridade in the investees results.
a.2) Commission revenue – Commissions revenues are recognized when their value, their associated costs and the transaction stage can be reliably measured and when it is probable that the economic benefits will occur.
a.3) Interest revenue – Interest revenue and expenses resulting from assets and liabilities that yield and pay interest are recognized in income for the period on an accrual basis, using the effective interest rate method.
The effective interest rate method is a method used to calculate the amortized cost of a financial asset or of a financial liability (or of a group of financial assets or financial liabilities) and to allocate the interest revenue or expense over the corresponding period.
The effective interest rate is the rate that exactly discounts the estimated future cash payments and receipts through the expected life of the financial asset or liability. The effective interest rate is established upon the initial recognition of the financial asset or liability and is not subject to subsequent reviews. In calculating the effective interest rate, BB Seguridade estimates the future cash flows considering all contractual terms of the financial instrument, but not future credit losses.
The calculation of the effective rate includes all the commissions, the transaction costs and the discounts or premiums that are an integral part of the effective interest rate. The transaction costs correspond to incremental costs directly attributable to the acquisition, issuance or divestiture of a financial asset or liability.
In accordance with IAS 18, BB Seguridade appropriates revenues from finance charges when it is considered probable to receive the economic benefits related to the transaction.
b) Cash and cash equivalents
Cash and cash equivalents include funds available and investments immediately convertible into cash and subject to an insignificant risk of change in value.
c) Financial instruments
Financial instruments are classified in accordance with their nature and its intention for the instrument. All financial assets and liabilities are initially recognized on the trading date, i.e., the date on which the Group becomes party to the contractual provisions of the instrument. Classification of financial assets and liabilities is determined on the date of initial recognition.
All financial instruments are initially measured at fair value plus associated transaction costs, except in cases in which the financial assets and liabilities are recorded at fair value through profit or loss. The accounting practices applied to each class of financial instruments are presented below.

Notes to the Financial Statements
27
c.1) Financial assets at fair value through profit or loss – Financial instruments are classified in this category if held for trading on the origination or acquisition date, or if designated as such by Management upon initial recognition.
A financial asset is classified as held for trading if: (i) it is acquired mainly to be sold in the near term; or (ii) upon initial recognition it is part of a portfolio of identified financial instruments that are managed jointly and for which there is evidence of a recent actual pattern of short-term profit-taking.
The Group only measures a financial instrument at fair value through profit or loss upon initial recognition when the following criteria are met: (i) the designation eliminates or significantly reduces the inconsistent treatment that would arise from measuring assets and liabilities or recognizing the corresponding gains and losses in different forms; or (ii) the assets and liabilities are part of a group of financial assets, financial liabilities or both, which are managed and have their performances evaluated on a fair value basis, pursuant to documented strategy of risk management or investment.
Financial assets classified into this category will not be transferred to other categories, with the exception of non-derivative financial assets held for trading, which can be reclassified after initial recognition when: (i) in rare circumstances, the financial instrument is no longer held with the purpose of sale in the near term; or (ii) it meets the definition of a loan and receivable, and if the Group has the intention and ability to hold the financial asset for the foreseeable future or until maturity.
Financial instruments recorded in this category are initially recognized at fair value and their yields (interest and dividends) are appropriated as interest revenue. Transaction costs, when incurred, are recognized immediately in the Consolidated Income Statement.
Realized and unrealized gains or losses related to fair value variations of these instruments are included in net gains/(losses) under financial assets/liabilities at fair value through profit or loss.
Financial assets recorded in this category comprise securities and derivative financial instruments held for trading.
c.2) Financial assets available for sale – Securities are classified as financial assets available-for-sale when, in the opinion of Management, they can be sold in response to or in anticipation of changes in market conditions or they are not classified as (i) loans and receivables, (ii) investments held to maturity, or (iii) financial assets at fair value through profit or loss.
These securities are initially accounted for at fair value, including direct costs and incremental transaction costs. Also, subsequent measuring of these instruments is recorded at fair value.
Unrealized gains or losses (net of taxes) are recorded in a separate component of equity (other accumulated comprehensive income) until their disposal. The yields (interest, dividends) of these assets are allocated as interest income. Gains and losses on disposal of financial assets available for sale are recorded as gains / (losses) on financial assets available for sale, in the date of disposition.
Occurring reclassification of financial assets available for sale to trading category, the unrealized gains or losses until the date of reclassification, which are recorded in Other accumulated comprehensive income should be deferred over the remaining term.
Financial assets available for sale are valued for the purpose of determining their recoverable amount as discussed in the section entitled "impairment of financial assets”. Losses due to reduction to the recoverable amount of these financial instruments are recognized in the consolidated statement of income, in gains/(losses) on financial assets available for sale, and written off from the amount recorded in other accumulated comprehensive income.
c.3) Financial assets held to maturity – Financial assets that the Group has a positive intention and proven financial ability to hold to maturity are classified as financial assets held to maturity and are initially accounted at fair value, including incremental transaction costs. These financial instruments are subsequently measured at amortized cost. Interest, including premiums and discounts, are recorded as financial assets interest, using the effective interest rate, less impairment (if applicable).
In accordance with IAS 39, is not classified any financial asset as held to maturity if it has, during the current financial year or during the two preceding financial years, sold or reclassified more than an insignificant amount of held-to-maturity investments before maturity, other than sales or reclassifications that: (i) are so close to maturity or to the call date of the financial asset that changes in the market rate of interest would not have a significant effect on the financial asset's fair value; (ii) occur after the Group has collected substantially all of the financial asset's original principal through scheduled payments or prepayments; or (iii) are attributable to an isolated event that is beyond the entity's control, is non-recurring and could not have been reasonably foreseen by the entity.

Notes to the Financial Statements
28
Whenever the sales or reclassifications of more than an insignificant amount of held-to-maturity investments do not meet any of the conditions previously mentioned, any remaining held-to-maturity investment should be reclassified as available for sale.
c.4) Determination of fair value – Fair value is the amount for which an asset could be exchanged, or a liability settled, between knowledgeable, willing parties in a transaction without favoritism.
The fair value of financial instruments traded in active markets on the base date of the balance sheet is based on the quoted market price or on the quotation of the over-the-counter price (sale price for long positions or purchase price for short positions), without any transaction cost deduction.
In situations in which there is no market price for a particular financial instrument, its fair value is estimated based on valuation methods commonly used in financial markets, appropriate for the specific characteristics of the instrument and that capture the various risks to which it is exposed. Valuation methods include: the discounted cash flow method, comparison with similar financial instruments for which there is a market with observable prices, option pricing model, credit models and other known valuation models.
The aforesaid models are adjusted to capture the variation of purchase and sale prices, the cost of settlement of the position, to serve as a counter entry to credit and liquidity variations, and mainly, to overcome the theoretical limitations inherent in the models.
Internal pricing models may involve estimates and judgment of Management, whose intensity will depend, among other factors, on the complexity of the financial instrument.
c.5) Financial liabilities – An instrument is classified as a financial liability when there is a contractual obligation of its settlement through the delivery of cash or other financial asset, regardless of its legal form. Financial liabilities include short-term and long term debts issued which are initially measured at fair value, which is the amount received, net of incurred transaction costs, and subsequently at amortized cost.
Financial liabilities held for trading and those designated by Management as financial liabilities at fair value through profit or loss are recorded in the consolidated balance sheet at fair value.
When an existing financial liability is replaced by another from the same lender under substantially different terms, or the terms of the existing liability are substantially modified, such exchange or modification is treated as a write-off of the original liability and the recognition of a new liability, and the difference in the book value is recognized in net income of the period.
d) Derecognition of financial assets and liabilities
d.1) Financial assets – A financial asset is derecognized when (i) the contractual rights relating to the respective cash flows expire; (ii) the Group transfers to third parties all the risks and rewards associated with the operation; or (iii) when control over the asset is transferred, even with the Group having retained part of the risks and rewards associated with the transaction.
The rights and obligations retained in the transfer are recognized separately as assets and as liabilities, when appropriate. If control over the asset is retained, the Group continues to recognize it to the extent of its continuous involvement, which is determined by the extent to which it remains exposed to changes in the value of the asset transferred.
d.2) Financial liabilities – A financial liability is derecognized when the respective obligation is eliminated, cancelled or expired. If an existing financial liability is replaced by another from the same lender under substantially different terms, or the terms of the existing liability are substantially modified, such modification is treated as derecognition of the original liability and the recognition of a new liability, and the difference between the respective carrying amounts is recognized in net income.
e) Impairment of financial assets
Annually, is valued whether there is any objective evidence that a financial asset or group of financial assets is impaired. A financial asset is considered impaired if, cumulatively: (i) there is objective evidence of reduction in its recoverable amount as a result of one or more events occurring after initial recognition of the asset; (ii) the loss event has an impact on the estimated future cash flows of the financial asset; and (iii) a reliable estimate of the loss amount can be made. Losses expected as a result of future events, no matter how likely, are not recognized.
In some cases, the observable data required to estimate the amount of an impairment loss on a financial asset may be limited or no longer fully relevant to the current circumstances. In such cases, BB Seguridade uses its judgment to estimate the amount of any impairment loss. The use of reasonable estimates is an essential part of the preparation of consolidated financial statements and does not undermine their reliability.

Notes to the Financial Statements
29
Financial assets subject to having their recoverable amounts tested are presented below.
e.1) Financial assets available for sale – For financial assets available for sale, at each reporting date the Group assesses whether there is any objective evidence that its financial assets are impaired.
To establish whether there is objective evidence of impairment of a financial asset, is verified the likelihood of recovery of its value, considering the following factors cumulatively: (i) duration and magnitude of the reduction of the asset's value below the book value; (ii) historical behavior of the value of the asset and the experience recovering such assets; and (iii) likelihood of non-receipt of the assets’ principal and interest, due to difficulties relating to the issuer, such as application for bankruptcy or filing for chapter 11, deterioration of the credit risk rating and financial difficulties, related or not to the market conditions of the sector in which the issuer operates.
When a decline in the fair value of a financial asset available for sale has been recognized in other comprehensive income and there is objective evidence of impairment, the accumulated loss that has been recognized by BB Seguridade will be reclassified from equity to income for the period as a reclassification adjustment, even if the financial asset has not been written off.
The value of the accumulated loss reclassified to income for the period will be recorded in net gains/(losses) on financial assets available for sale and corresponds to the difference between the book value of the devalued asset and its fair value on the valuation date, less any loss due to impairment previously recognized in income.
Reversals of impairment losses on assets classified as available for sale are only recognized in equity when they consist of investments in equity instruments. In the case of investments in debt instruments, the reversal of the impairment loss will be recognized directly in income for the period.
e.2) Financial assets held to maturity – If there is objective evidence of impairment of financial assets held to maturity, is recognized a loss, the amount of which corresponds to the difference between the carrying amount of the asset and the present values of estimated future cash flows. If, in a subsequent period, the amount of the impairment loss decreases and this decrease can be objectively related to an event occurring after the impairment recognition, it is reversed in a contra entry to net income for the year.
f) Offsetting of financial assets and liabilities
Financial assets and liabilities are stated at net amount if, and only if, there is a legal right to offset one with the other and if there is an intention to settle them in this manner, or to realize an asset and to settle a liability simultaneously. In other situations they are presented gross.
g) Business combination – The acquisition of a subsidiary by means of a business combination is recorded on the acquisition date, which is the date on which control is transferred to BB Seguridade, applying the acquisition method. According to this method, identified assets (including intangible assets not previously recognized), assumed liabilities and contingent liabilities are recognized at fair value on the acquisition date. Possible positive differences between acquisition cost and fair value of identifiable net assets acquired are recognized as goodwill. In case of a negative difference (gain from a bargain purchase), the identified amount is recognized in the income statement under other non-interest income.
The transaction costs that BB Seguridade incurs in a business combination, except for the costs related to the issuance of debt or equity instruments, are recorded in profit or loss in the period incurred. Any contingent consideration payable is measured at its fair value on the acquisition date.
The results of subsidiaries acquired during the accounting period are included in the consolidated financial statements as from acquisition date until the end of the year. By contrast, the results of disposed subsidiaries during the year are included in consolidated financial statements as from the beginning of the year until the date of disposal, or up to the date that BB Seguridade no longer has control.
h) Change of equity interest in subsidiaries – Changes in the equity interest in a subsidiary that do not result in loss of control are accounted for as equity transactions (that is, transactions with owners in their capacity as owners). Consequently, no goodwill is recognized as a result of such transactions.
Under these circumstances, the book values of the controlling and non-controlling interest will be adjusted to reflect changes in their relative interests in the subsidiary. Any difference between the amount by which the non-controlling interests are adjusted and the fair value of the consideration paid or received will be recognized directly in stockholders' equity and attributed to the owners of the parent company.
i) Loss of control – In accordance with IAS 27, in the event of loss of control of a subsidiary, BB Seguridade derecognizes, in the date on which control is lost: (i) the assets, including goodwill, and the liabilities of the

Notes to the Financial Statements
30
subsidiary at their book value; and (ii) the book value of any non-controlling interest in the former subsidiary, including any components of other comprehensive income attributed to it.
Moreover, BB Seguridade recognizes on the date of loss of control: (i) the fair value of the consideration received, if any, originating from the transaction, event or circumstances that resulted in the loss of control; (ii) the distribution of shares of the subsidiary to the owners, if the transaction that resulted in the loss of control involves a distribution of shares; (iii) any investment held in the former subsidiary at its fair value; and (iv) any difference resulting as a gain or loss in the result attributable to the parent company.
j) Non-monetary contributions to jointly controlled entities - In accordance with IFRS 11, when the Group contributes with non-monetary assets in exchange for an equity interest in a jointly controlled entity, the gain or loss on this transaction is recognized according the assets is being sold to other entrepreneurs. No gain or loss is recognized if (i) the significant risks and rewards of ownership of the assets have not been transferred, (ii) the gain or loss cannot be measured reliably, or (iii) the transaction has no commercial substance.
k) Goodwill and other intangible assets
Goodwill on the acquisition of subsidiaries and joint ventures is accounted for by taking into consideration the fair value of the identifiable assets and liabilities of the acquired company on the acquisition date and, in accordance with IFRS 3, it is not amortized. However, it is tested at least annually for impairment. After initial recognition, goodwill is measured at the cost less any accumulated impairment losses.
Intangible assets are recognized separately from goodwill when they are separable or arise from contractual or other legal rights, their fair value can be reliably measured and estimated future economic benefits may flow to BB Seguridade. The cost of the intangible assets acquired in a business combination is the fair value on the acquisition date. Intangible assets acquired independently are initially measured at cost.
The useful life of the intangible assets is considered finite or indefinite. Intangible assets with a finite useful life are amortized over their economic life. They are initially stated at cost, less accumulated amortization and impairment losses. Intangible assets with an indefinite useful life are stated at cost, less any impairment losses.
Intangible assets with a finite useful life are amortized on a straight-line basis over their estimated useful life. Amortization period and method of an intangible asset with a defined useful life are reviewed at least on an annual basis. Changes to expected useful life or expected rate of use of future benefits incorporated to the asset are recognized through changing amortization period or method, when adequate, and treated as changes to accounting estimates.
The expenses from the amortization of intangible assets with a finite useful life are recognized in the income statement of the period, under "amortization of intangible assets". Impairment losses are recorded as an adjustment to recoverable amount expenses (other expenses) in the consolidated income statement.
l) Impairment of non-financial assets
Annually, is evaluated, based on internal and external sources of information, whether there is any indication that a non-financial asset may be impaired. If there is indication of impairment, is estimated the recoverable amount of the asset. The asset's recoverable amount is the higher of fair value less costs to sell it or its value in use.
Regardless of the existence of any indication of impairment, is performed annually the impairment testing of intangible assets with an indefinite useful life, including goodwill acquired in a business combination, or an intangible asset not yet available for use. This test may be performed at any time during the year, provided that it is carried out at the same time every year.
In case the recoverable amount of the asset is lower than its book value, the book value of the asset is reduced to its recoverable amount through a provision for impairment losses, whose contra-entry is recognized in income for the period in which is occurs, under other expenses.
Is also evaluated, annually, if there is any indication that an impairment loss recognized in prior periods for an asset, except for goodwill due to expected future earnings, may have ceased to exist or may have decreased. If there is indication of impairment, the recoverable amount of this asset is estimated. Reversal of impairment losses of an asset will be immediately recognized in income for the period, rectifying other expenses balance.

Notes to the Financial Statements
31
m) Investments in associates
Under the equity method, investments are initially measured at cost and subsequently adjusted for the recognition of the investor's share in the investee’s assets changes. Furthermore, the share which fits the results generated by the investee should appear in the income of the investor.
n) Provisions, contingent liabilities and legal liabilities
In accordance with IAS 37, provisions are recognized when conditions show that: (i) BB Seguridade has a present obligation (legal or constructive) resulting from past events; (ii) it is more probable than not that a disbursement of funds that incorporate economic benefits will be required to settle the obligation; and (iii) the value of the obligation is presented based on reliable estimates. Provisions are recorded based on our best estimate of probable losses.
There is continuous monitoring of the lawsuits in progress to evaluate, among other things: (i) their nature and complexity; (ii) the progress of proceedings; (iii) the opinion of BB Seguridade legal advisors; and (iv) BB Seguridade experience with similar proceedings. In determining whether a loss is probable are considered: (i) the likelihood of loss resulting from claims that occurred prior to or at the balance sheet date, but that were identified after that date, yet prior to its disclosure; and (ii) the need to disclose the claims or events that occur after the balance sheet date, but prior to its publication.
Also are recognized in its liabilities tax obligations subject to legal discussions on the constitutionality of laws that established them, up to the effective extinguishment of corresponding tax credits. In these situations, is considered that in fact there is a legal obligation to pay to the government. Accordingly, the legal obligation should be recorded, including interest and other charges, if applicable. Bookkeeping of these legal obligations results in judicial deposits being recorded.
o) Income taxes
o.1) Current taxes – current tax expense is the amount of income and social contribution taxes payable or recoverable in relation to taxable income for the period.
Current tax assets are the amounts of income and of social contribution taxes to be recovered in the next 12 months and deferred tax assets are the amounts to be recovered in future periods, including those arising from tax losses or tax credits not utilized.
Current taxes related to current and prior periods should, to the extent in which they are not paid, be recognized as liabilities. If the amount already paid for current and prior periods exceeds the amount owed for those periods, the excess should be recognized as an asset.
Current and prior taxable assets and liabilities are measured at expected recoverable amount or at recoverable amount paid to tax authorities. Tax rates and tax laws used for calculating this amount are those effective at the balance sheet date.
o.2) Deferred taxes – these are amounts of tax assets and liabilities to be recovered and paid in future periods, respectively. Deferred tax liabilities originate from taxable temporary differences and deferred tax assets from deductible temporary differences and from unused tax loss carry forwards.
Deferred tax assets from income and social contribution tax losses and from temporary differences are recognized to the extent that is probable the existence of taxable income against which deductible temporary differences may be used.
Book values of deferred tax assets will be reviewed at the end of each period. An entity will reduce the book value of deferred tax assets to the extent that it is no longer probable that it will obtain taxable income sufficient to allow the benefit from part of or the total deferred tax assets to be used. Any reduction will be reversed to the extent that the entity is likely to obtain sufficient taxable income.
Deferred tax assets and liabilities are measured at tax rates expectedly applicable in the year in which the asset or the liability is realized or settled, based on tax rates (or tax law) that were substantively enacted at balance sheet date.
o.3) Temporary differences – It is the differences that impact or may impact the calculation of income and social contribution taxes arising from temporary differences between the tax bases of an asset or liability and its carrying amount in the consolidated balance sheet.
Temporary differences can be taxable or deductible. Taxable temporary differences are temporary differences that will result in taxable amounts to determine taxable income (tax loss) for future periods when the book value of an asset or liability is recovered or settled. Deductible temporary differences are temporary

Notes to the Financial Statements
32
differences that will result in deductible amounts to determine taxable income (tax loss) for future periods when the book value of the asset or liability is recovered or settled.
The tax base of an asset is the amount that will be deductible for tax purposes against any taxable economic benefits that will flow to the entity when it recovers that asset's book value. If those economic benefits are not taxable, the asset's tax base will be equal to its book value.
The tax base of a liability is its book value less any amount that will be deductible for tax purposes, in relation to that liability, in future periods. In case of revenue received in advance, the resulting liability tax base is its book value less any revenue amount that will not be taxable in future periods.
o.4) Offsetting income taxes
Assets from current taxes and liabilities from current taxes are offset if, and only if, the entity: (i) has the right, legally executable, of clearing recognized amounts; and (ii) intends to settle on net bases, or simultaneously realize the asset and settle the liability.
Assets from deferred taxes and liabilities from deferred taxes are offset if, and only if: (i) the company has the right, legally executable, of offsetting current tax assets against current tax liabilities; and (ii) deferred tax assets and deferred tax liabilities are related to taxes on income owed to the same tax authority: (a) in the same taxable entity; or (b) in different taxable entities that intend to settle liabilities and current tax assets on net bases, or simultaneously realize assets and settle liabilities, in each future period in which significant deferred tax assets or liabilities are expected to be settled or recovered.
p) Segment reporting
IFRS 8 requires the report of information related to operating segments consistent with the internal reports used by management to allocate resources and assess their performance.
q) Deferred costs
Include commissions on the cost of insurance policies that the allocation in income results performed according to the risk period coverage. The direct and indirect costs incurred during the financial maturity, from subscription or renewal of insurance contracts and/or investments contracts with discretionary benefit rights that are deferred to the extent that such costs, are recoverable from futures premiums. All other acquisition costs are recognized as expenses when incurred. The deferred costs are written off whenever the sale or liquidation of the respective contracts.
r) Liabilities from insurance contracts
The subsidiaries and associates issues contracts that contain insurance risks, financial risks or a combination of both. Contracts according to which is accepted a significant non-financial risk from an insured person, committing to compensate him/her upon uncertain future events, are characterized as insurance contracts, in accordance with IFRS 4.
Insurance risk is significant if, and only if, the insured event produces effects on the insurance company, like significant additional benefit payments in any scenario, except for those that do not have commercial substance. Additional benefits refer to amounts that exceed those that would be paid if the insured event did not occur. Contracts classified as insurance contracts are not subsequently reclassified, even if the insurance risk is significantly reduced.
The reinsurance contracts are also treated from the perspective of IFRS 4 because they represent significant risk transfer.
Private pension plans represent the current amount of obligatins for life coverage annuity, disability, pension an lump-sump death benefits, determined by means of actuarial calculations and assumptions under actuarial notes, for the capitalization, lifetime annuity and pay-as-you-go systems, respectively.
Liabilities from insurance contracts are substantially comprised of technical and mathematical provisions, recognized when the contract is recorded and the respective premium is issued, in case of insurance contracts, and charged, in case of pension plans. On the other hand, a liability is written-off at the end of contract effectiveness, in case of cancellation, among other applicable situations.
Technical and mathematical provisions are recognized in accordance with standards established by the Conselho Nacional de Seguros Privados – CNSP (Brazilian National Council of Private Insurance) for insurance and pension plans. Amounts are determined based on methods and hypotheses defined by the actuary and validated by Management, reflecting the best estimate current value, on calculation base date, of future obligations deriving from insurance and pension plan contracts.

Notes to the Financial Statements
33
r.1) Mathematical provisions for future benefit and for vested benefit – correspond, respectively, to the commitments assumed by insurance companies with the insured, while the indemnity and/or benefit payment generating event has not started, and otherwise, after the start of the indemnity and/or benefit payment generating event. They are calculated according to methodology described in actuarial technical note of the plan or the product.
r.2) Provision for unearned premiums – formed by the insurance premium corresponding to the period of risk not yet elapsed. The measurement is individual by policy or endorsement of the current contracts, on the date of formation, by the pro rata method with a basis on the validity start and end dates of the insured risk. The generating factor of the formation of this provision is the issuance of the policy or endorsement.
r.3) Provision for claims – calculated by estimate of probable payments, gross of reinsurance and net of recovery of coinsurance, based on the notifications and notices of claims received up to the balance sheet date, and include provisions for claims under litigation calculated according to the criteria defined and documented in an actuarial technical note. The accrued amounts are restated under the terms of the applicable legislation.
r.4) Provision for claims incurred but not reported – IBNR – calculated in accordance with the expected amount of claims incurred in risks assumed in the portfolio and not reported.
r.5) Provision for premium insufficiency – its purpose is to assess the sufficiency or insufficiency of premium reserves for coverage of future obligations related to the insurance contracts. The estimates are based on discounted cash flow of rights and future obligations of each contract, considering hypotheses and assumptions according to each type of risk.
r.6) Provision for redemptions and other values to be regularized – includes amounts relating to the redemptions to be regularized, the repayments of contributions or premiums and the portability requested, which for any reason have not yet been executed.
r.7) Other provisions – mainly include provisions for administrative expenses, additional investment returns payable on pension funds and for benefits to be regularized.
The provisions of Risks Oscillation, Insufficient Contributions, Lack of Awards and Financial Oscillation have been maintained since February, 2013 and transferred to the account "Other Technical Provisions", according to Circular SUSEP 462/13, and are under review by the administration of the entities.
In accordance with IFRS 4, at each presentation period, is analyzed the adequacy of its liabilities in all contracts that meet an insurance contract definition and are effective on execution date. This procedure, called liability adequacy test, considers insurance contract liabilities less deferred trading expenses and related intangible assets as the net book value.
In case the analysis demonstrates that insurance liabilities' book value is lower than expected contract future cash flows, this insufficiency should be recorded as an expense in net income for the period and additional provisions for insurance liabilities should be recorded on reporting date.
All the valuation methods used are based on the general principle that the carrying amount of net liabilities needs to be sufficient to fulfill any foreseeable obligation resulting from the insurance contracts.
Investment assumptions are also determined by the local regulatory agency or based on future expectations of Management. In the latter case, the anticipated return on future investment is defined considering available market information and economic indicators. A significant assumption related to the estimate of gross income in variable annuities is the annual long-term growth rate of the underlying assets.
s) Interest on equity capital and dividends
Brazilian companies are allowed to assign a nominal interest expense, deductible for fiscal purposes, on their equity capital. The amount of interest on equity capital is considered a dividend and, when applicable, is presented in the consolidated financial statements as a direct reduction in equity.
Dividends distributed are calculated on adjusted net income. The Group's present policy is to pay dividends and interest on equity capital of minimum 25% on adjusted net income, which are recognized as liabilities and deducted from net equity upon approval by the Board of Directors.
t) Seasonality of operations
The Group, its subsidiaries and jointly controlled consider the nature of their business to be non-cyclic and non-seasonal, taking into account the activities performed by the Group. Consequently, there are no specific disclosures related to such matters provided in these notes to the consolidated financial statements for the period ended at September 30, 2013.
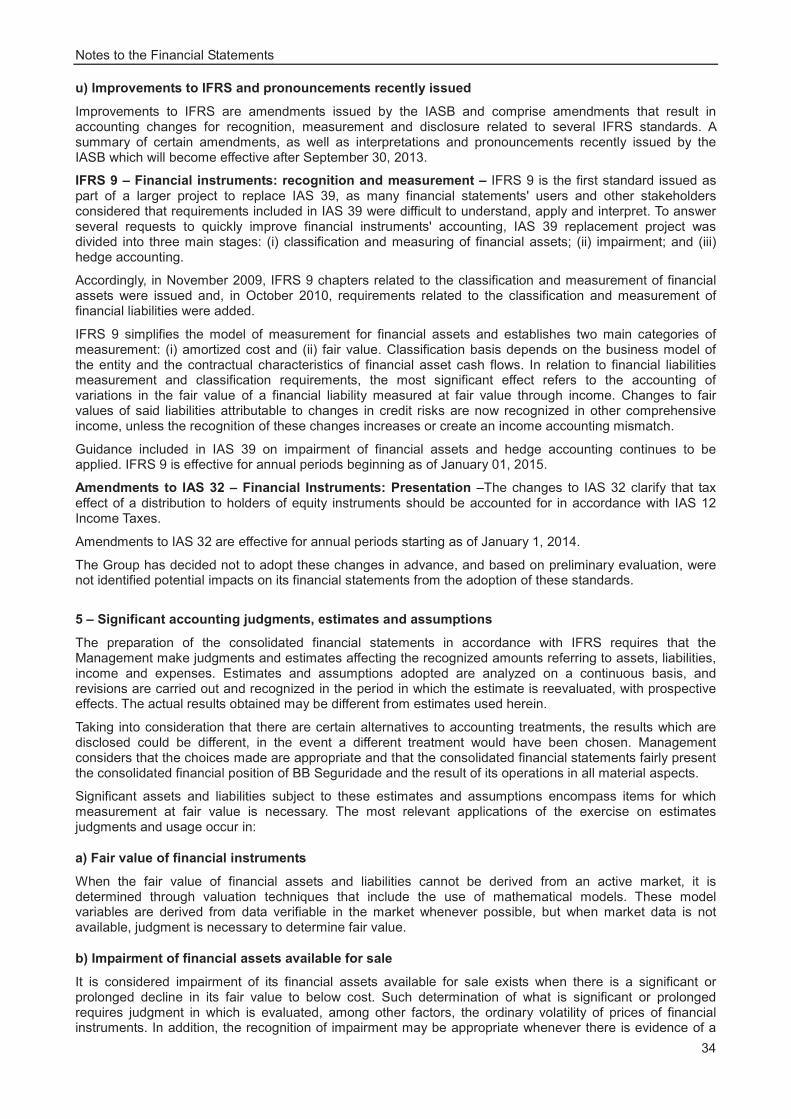
Notes to the Financial Statements
34
u) Improvements to IFRS and pronouncements recently issued
Improvements to IFRS are amendments issued by the IASB and comprise amendments that result in accounting changes for recognition, measurement and disclosure related to several IFRS standards. A summary of certain amendments, as well as interpretations and pronouncements recently issued by the IASB which will become effective after September 30, 2013.
IFRS 9 – Financial instruments: recognition and measurement – IFRS 9 is the first standard issued as part of a larger project to replace IAS 39, as many financial statements' users and other stakeholders considered that requirements included in IAS 39 were difficult to understand, apply and interpret. To answer several requests to quickly improve financial instruments' accounting, IAS 39 replacement project was divided into three main stages: (i) classification and measuring of financial assets; (ii) impairment; and (iii) hedge accounting.
Accordingly, in November 2009, IFRS 9 chapters related to the classification and measurement of financial assets were issued and, in October 2010, requirements related to the classification and measurement of financial liabilities were added.
IFRS 9 simplifies the model of measurement for financial assets and establishes two main categories of measurement: (i) amortized cost and (ii) fair value. Classification basis depends on the business model of the entity and the contractual characteristics of financial asset cash flows. In relation to financial liabilities measurement and classification requirements, the most significant effect refers to the accounting of variations in the fair value of a financial liability measured at fair value through income. Changes to fair values of said liabilities attributable to changes in credit risks are now recognized in other comprehensive income, unless the recognition of these changes increases or create an income accounting mismatch.
Guidance included in IAS 39 on impairment of financial assets and hedge accounting continues to be applied. IFRS 9 is effective for annual periods beginning as of January 01, 2015.
Amendments to IAS 32 – Financial Instruments: Presentation –The changes to IAS 32 clarify that tax effect of a distribution to holders of equity instruments should be accounted for in accordance with IAS 12 Income Taxes.
Amendments to IAS 32 are effective for annual periods starting as of January 1, 2014.
The Group has decided not to adopt these changes in advance, and based on preliminary evaluation, were not identified potential impacts on its financial statements from the adoption of these standards.
5 – Significant accounting judgments, estimates and assumptions
The preparation of the consolidated financial statements in accordance with IFRS requires that the Management make judgments and estimates affecting the recognized amounts referring to assets, liabilities, income and expenses. Estimates and assumptions adopted are analyzed on a continuous basis, and revisions are carried out and recognized in the period in which the estimate is reevaluated, with prospective effects. The actual results obtained may be different from estimates used herein.
Taking into consideration that there are certain alternatives to accounting treatments, the results which are disclosed could be different, in the event a different treatment would have been chosen. Management considers that the choices made are appropriate and that the consolidated financial statements fairly present the consolidated financial position of BB Seguridade and the result of its operations in all material aspects.
Significant assets and liabilities subject to these estimates and assumptions encompass items for which measurement at fair value is necessary. The most relevant applications of the exercise on estimates judgments and usage occur in:
a) Fair value of financial instruments
When the fair value of financial assets and liabilities cannot be derived from an active market, it is determined through valuation techniques that include the use of mathematical models. These model variables are derived from data verifiable in the market whenever possible, but when market data is not available, judgment is necessary to determine fair value.
b) Impairment of financial assets available for sale
It is considered impairment of its financial assets available for sale exists when there is a significant or prolonged decline in its fair value to below cost. Such determination of what is significant or prolonged requires judgment in which is evaluated, among other factors, the ordinary volatility of prices of financial instruments. In addition, the recognition of impairment may be appropriate whenever there is evidence of a

Notes to the Financial Statements
35
negative impact in the financial health of the investee, the performance of the relevant economic sector, changes in technology and in financing and operating cash flows.
Additionally, the preparation of impairment valuations take into consideration market prices (mark to market) or valuation models (mark to model), which require use of certain assumptions or judgments in establishing fair value estimates.
c) Impairment of non-financial assets
Annually, is evaluated, based on internal and external sources of information, whether there is any indication that a non-financial asset may be impaired. If this indication exists, are used estimates to define the asset's recoverable value.
It is also evaluated, annually, if there is any indication that an impairment loss recognized in prior periods for an asset, except for goodwill due to expected future earnings, may not exist anymore or may have decreased. If there is indication of impairment, the recoverable amount of this asset is estimated.
Regardless of the indication of impairment losses, annually are conducted impairment tests on indefinite-lived intangible assets, including goodwill acquired in a business combination or on intangible assets not yet available for use.
Determining the recoverable amount upon valuation of non-financial assets impairment requires estimates based on market-quoted prices, present value calculations or other pricing techniques, or a combination of them, requiring that Management make subjective judgments and adopt assumptions.
d) Income taxes
Since the corporate object of the Group is to obtain profits, the income generated is subject to income tax payment in the various jurisdictions where performs its operating activities. Determination of the global amount of income taxes requires certain interpretations and estimates. There are several transactions and calculations for which determination of the final value of tax payable is uncertain during the ordinary cycle of business. Other interpretations and estimates could result in a different value of income taxes recognized in the period.
The Brazilian tax authorities may review the procedures adopted by the Group during a period of five years from the date in which taxes are deemed to be due. Hence, it is likely that such tax authorities may question procedures adopted by the Group, mainly those arising from differences in interpreting tax legislation. However, Management believes that there will be no significant adjustments in the income taxes stated in the consolidated financial statements.
e) Deferred taxes
Deferred tax assets are calculated on temporary differences and on tax loss carryforwards, and are accounted for whenever BB Seguridade expects to generate taxable profit in subsequent years in amounts sufficient to off-set such values. The expected realization of BB Seguridade tax credit is based on the projection of future income and on technical analysis, in line with prevailing tax legislation.
The estimates considered by BB Seguridade for the recognition and valuation of deferred taxes are reviewed based on current expectations and projections of future events and trends. Major assumptions identified by BB Seguridade that may affect these estimates are related to factors such as: (i) changes in government regulation related to fiscal matters; (ii) changes in interest rates; (iii) changes in inflation rates; (iv) lawsuits or legal disputes with an adverse impact; (v) credit and market risks, as well as other risks arising from investment activities; and (vi) changes in internal and external economic conditions.
f) Provisions and contingent liabilities
Contingent liabilities are recognized in the financial statements when, based on the opinion of legal counsel and Management, the risk of loss of a judicial or administrative proceeding is considered probable, with a probable outflow of resources to settle the obligations and the amounts involved can be reliably measured, quantified when the citation/notice is received, and reviewed monthly.

Notes to the Financial Statements
36
6 – Risk Management
The Corporate Risk Management covers the following categories: Underwriting, Market, Credit, Legal and Operations. BB Seguridade has corporate governance that manages the risks mentioned above. Each subsidiary and affiliate also have governance bodies that manage their risks in the same way that the BB Seguridade. In this context, although the Group has a distinct risk management, there is uniformity among the Group, subsidiaries and affiliates, to obtain the same criteria in the management of these risks as a whole. The following describes the main risks of BB Seguridade and how they are administered, as well as risk management, sensitivity analysis and risk assessments in the context of other subsidiaries and affiliates.
Underwriting Risk
It is the risk arising from an adverse economic situation which is contrary to the Company's expectations as of the preparation of their underwriting policy and the uncertainties in estimating provisions.
Insurance contracts that transfer significant risk are those where insurers have the obligation to pay a significant additional benefit to its policyholders in scenarios that have commercial substance, classified by comparing scenarios in which the event occurs, affecting policyholders adversely and scenarios where the event does not occur. Due to the nature of an insurance contract, your risk is somewhat accidental and therefore subject to fluctuations.
For a group of insurance contracts where the theory of probability is applied to pricing and provisioning, insurers understand that the main risk transferred to them is the risk that reported claims and benefit payments resulting from these events exceed the carrying value of liabilities of insurance contracts. Such situations arise in practice when the frequency and severity of claims and benefits to policyholders are larger than previously estimated, according to the methodology of calculating these liabilities.
To reduce these risks, strategies are used to diversify risks and reinsurance programs with reinsurers that have credit risk rating of high quality, so that the adverse outcome of atypical and major events is minimized. Nevertheless, part of the credit and underwriting risks to which insurance companies are exposed is minimized due to the fact that the smaller portion of the accepted risks represent large insured amounts.
Market Risk
Market risk is defined as the possibility of financial or economic losses occurring as a result of fluctuations in the market values of positions held by the Company. Includes the risks of transactions subject to foreign exchange, interest rate (which includes the risk of fluctuations in the pre-fixed interest rates, foreign currency coupons, price indices coupons and other interest rates coupons), stock prices, inflation rates and commodities prices.
Credit Risk
It is defined as a measure of uncertainty related to the probability of the counterparty to a transaction, or a debt issuer, not honor, wholly or partially, its financial commitments.
Credit risk can arise through the following facts:
(i) Losses arising from default, failure to pay premiums or installments thereof by the policyholders;
(ii) The possibility of an issuer of private securities failing to make payment as expected on the maturity date;
(iii) The inability or impossibility of recouping commissions paid to brokers when policies are canceled; and
(iv) The collapse or deterioration in the credit capacity of co-insurers, reinsurers, intermediaries or other counterparties.
For the classification of this risk, each institution or fund that conducts financial transactions with BB Seguridade receives a rating (score) in relation to their credit risk.
For each business segment are set maximum exposure limits for investments in institutions or private funds, and maximum exposure limits for each of the scores.
In the insurance business, risk acceptance limits are established considering the credit history of the insured and risk exposure in each operation. And for reinsurance transactions were determined rules of cession, consolidated exposure limits for each business, cession limits by rating and credit limits per reinsurer, within the regulatory limits. Finally, the conclusion of any contract of reinsurance follows internal rules established by the Finance and Risk Committee.

Notes to the Financial Statements
37
Legal Risk
Legal risk is the level of uncertainty related to the returns of an institution for lack of a comprehensive legal foundation of its operations, loss of reputation and poorly formalized operations.
To reduce these risks, the companies belonging to the Group BB Seguridade have legal structure responsible for reviewing insurance contracts in order to mitigate legal risk, and provide support for the lawsuits.
Operational Risk
Operational risk is defined as the possibility of losses resulting from failure, deficiency or inadequacy of internal processes, people and systems or from external events, except those related to market risks, credit, legal and underwriting.
In insurance, private pension plans and capitalization plans companies, the operational risk management is carried out with focus on the control, monitoring, and reducing internal and external threats, strategic objectives and operations. Thus, societies keep updated control activities to prevent unacceptable risks and detection of residual risks.
With the use of specific tools and methodologies, various risk factors are previously identified, distributed by type of risk, by risk areas and operational processes and subprocesses. Each of the risk factors is evaluated regularly by most managers, through a process of control self-assessment, resulting in risk maps that let you see variables as probability of occurrence, relative importance and degree of control of each risk assessed.
From there, actions are set to keep in balance the levels of the three variables, set in five steps (from very low to very high). Besides being obtained by risk type, by process or sub-process, risk maps can also be viewed from a business segment (Auto, Life, Casualty, Warranty, Private Pension Plans, etc..), an activity backoffice (Human Resources, Legal, Controller Department, Investments, etc..) or even a consolidated position of the group, passing in each of the companies within the Group.
Risk Management
The Management of BB Seguridade adopts a conservative policy in its risk management process. Cash, cash equivalents and financial investments are entered into with its related party, BB Gestão de Recursos - Distribuidora de Títulos e Valores Mobiliários S.A., which carries on its business in accordance with the policies and guidelines established by BB Seguridade. In addition, the Financial Committee periodically monitors the situation so as to evaluate the need for occasional adjustments to the risk management process. The risk management process involving transactions with financial instruments and insurance contracts are published in the financial statements of its joint ventures.
Risk management is essential in all business activities, and it is used in order to add value to the business insofar as it provides support to the business areas in their activities planning, maximizing the use of in-house and third-party resources.
The risk management process counts on the participation of all layers covered within the scope of the corporate governance, which extends from the senior management, to the different business and products areas in detecting, dealing with and monitoring those risks.
The management of all risks inherent to the activities of an integrated mode is included in a process supported on Internal Controls and Risk Management structure. This approach enables the risk management models to be continually enhanced, minimizing the existing gaps that might adversely affect the proper detection and correction of the risks.
Corporate risk management is based on statistical tools such as adequacy testing of liabilities, sensitivity analysis, calculation of VaR and capital adequacy indicators, among others. Added to these tools is the qualitative aspect of risk management, using the results risk self-evaluation, the gathering of information about losses and the analyses of the results of testing and controls, and audits. Integrating these tools enables a complete and across-the-board analysis of the corporate risks.
In the case of a group of insurance contracts where probability theory is applied to pricing and provisioning, BB Seguridade understands that the principal risk transferred to insurance companies is the risk that advised claims and payments of benefits resulting from such events exceed the book value of the liabilities of the insurance contracts. In practice these situations occur when the frequency and severity of claims and benefits to policyholders exceed previous estimates, according to the methodology for calculating these liabilities. The track record shows that the greater the group of contracts with similar risks, the lower the variability of the cash flows that insurance companies would incur in order to meet claim events.

Notes to the Financial Statements
38
Insurance companies employ risk diversification strategies and reinsurance programs from reinsurance companies with a high-quality credit rating, so as to mitigate the adverse effect of atypical big-ticket events. Nevertheless, part of the credit and underwriting risks to which insurance companies are exposed is minimized due to the fact that the smaller portion of accepted risks represent large insured amounts.
The Group relies on a risk management system that is being constantly improved and which adheres to the guidelines of international models. In line with current regulations and the global corporate policies of the shareholders, the system is based on the integrated management of each business process and on the adaptation of the level of risk to the established strategic objectives.
For purposes of risk management assets were considered the statutory accounting (individual).
In order to ensure a unified approach to the risk management process, BB Seguridade is in final stage constitution of the following committees:
• Finance and Risk Committee: Constituted with the lead character of the analysis and evaluation of issues relating to financial aspects. This Committee is responsible for monitoring financial performance and proposing, for consideration by the Board of Directors, among others, policies and limits for management of financial risks.
• Audit Committee: Statutory body to advise the Board of Directors whose function, inter alia, review the financial statements in light of the accounting practices; assess the quality of the internal control system in the light of current regulations and internal codes; evaluate the effectiveness of internal and independent audits, and recommend to the Board the improvement of policies, practices and procedures identified in the course of their duties.
The relationship of the committees with senior management respects the hierarchical levels defined under the normative system, but the level of required autonomy for technical analyses is always respected. The internal rules of the committees define their responsibilities and reporting lines.
Also with a view to managing the risks to which the Grupo BB Seguridade is exposed, the internal audit department plays an important role. The independence of its activities and the continuous nature of the examinations it undertakes ensure that risk management is appropriate for the Group’s profile. Internal audits produce analyses, reports, recommendations, opinions and information regarding the activities it examines, leading to effective control at a reasonable cost.
The scope of internal audits is to examine and evaluate the adequacy and efficacy of the internal control system, in addition to the quality of the performance in complying with attributions and responsibilities.
BB MAPFRE SH1 and MAPFRE BB SH2
Insurance Risk Management
In the case of a group of insurance contracts where probability theory is applied to pricing and provisioning, it is understood that the principal risk transferred to Grupo BB Seguridade is the risk that advised claims and payments of benefits resulting from such events exceed the book value of the liabilities of the insurance contracts. In practice these situations occur when the frequency and severity of claims and benefits to policyholders exceed previous estimates, according to the methodology for calculating these liabilities. The track record shows that the greater the group of contracts with similar risks, the lower the variability of the cash flows that the Group would incur in order to meet claim events.
The BB MAPFRE SH1 and MAPFRE BB SH2 insurance companies’ line employs risk diversification strategies and reinsurance programs from reinsurance companies with a high-quality credit rating, so as to mitigate the adverse effect of atypical big-ticket events. Nevertheless, part of the credit and underwriting risks to which the companies is exposed is mitigated due to the fact that the smaller portion of accepted risks represents large insured amounts.
Concentration of risk
Potential exposures to concentration of risk are monitored by analyzing certain concentrations in certain geographical regions, using a series of assumptions regarding the potential characteristics of the threat. The tables below illustrate concentration of risk within the scope of the business by region and insurance products, based on the net amount of the companies’ reinsurance premium, according to the regulator.

Notes to the Financial Statements
39
Companhia de Seguros Aliança do Brasil
Reinsurance Gross R$ thousand
Geographical region Sep 30, 2013
Others % DPVAT % LIFE % Total %
Mid-west 261,743 7% 7,391 0% 405,827 11% 674,961 18%
Northeast 73,749 2% 14,376 0% 484,922 13% 573,047 15%
North 26,444 1% 4,329 0% 135,344 3% 166,117 4%
Southeast 273,485 7% 38,561 1% 1,231,037 32% 1,543,083 40%
South 434,656 11% 14,534 0% 461,275 12% 910,465 23%
Total 1,070,077 28% 79,191 1% 2,718,405 71% 3,867,673 100%
R$ thousand
Geographical region Dec 31, 2012
Others % DPVAT % LIFE % Total %
Mid-west 203,341 5% 7,983 0% 455,756 12% 667,080 17%
Northeast 48,004 2% 14,241 0% 515,472 13% 577,717 15%
North 17,718 0% 4,732 0% 136,130 4% 158,580 4%
Southeast 235,528 6% 39,428 1% 1,292,639 33% 1,567,595 40%
South 386,575 10% 16,662 0% 533,822 14% 937,059 24%
Total 891,166 23% 83,046 1% 2,933,819 76% 3,908,031 100%
Reinsurance Net R$ thousand
Geographical region Sep 30, 2013
Others % DPVAT % LIFE % Total %
Mid-west 154,304 4% 7,391 0% 405,141 12% 566,836 16%
Northeast 47,773 1% 14,376 1% 484,840 14% 546,989 16%
North 21,409 1% 4,329 0% 135,275 4% 161,013 5%
Southeast 204,049 6% 38,561 1% 1,227,001 35% 1,469,611 42%
South 276,802 8% 14,534 0% 461,673 13% 753,009 21%
Total 704,337 20% 79,191 2% 2,713,930 78% 3,497,458 100%
R$ thousand
Geographical region Dec 31, 2012
Others % DPVAT % LIFE % Total %
Mid-west 136,642 4% 7,983 0% 455,465 12% 600,090 16%
Northeast 37,707 1% 14,241 0% 515,551 14% 567,499 15%
North 16,259 0% 4,732 0% 136,027 4% 157,018 4%
Southeast 199,854 5% 39,428 1% 1,292,507 36% 1,531,789 42%
South 278,390 9% 16,662 0% 534,042 14% 829,094 23%
Total 668,852 19% 83,046 1% 2,933,592 80% 3,685,490 100%
Vida Seguradora S.A.
Reinsurance Gross R$ thousand
Geographical region Sep 30, 2013
DPVAT % LIFE % Total %
Mid-west 535 0% 1,857 1% 2,392 1%
Northeast 1,991 1% 1,416 1% 3,407 2%
North 241 0% 397 0% 638 0%
Southeast 41,182 18% 159,487 71% 200,669 89%
South 2,402 1% 14,757 7% 17,159 8%
Total 46,351 20% 177,914 80% 224,265 100%

Notes to the Financial Statements
40
R$ thousand
Geographical region Dec 31, 2012
DPVAT % LIFE % Total %
Mid-west 3,007 1% 1,864 1% 4,871 2%
Northeast 6,453 3% 1,507 1% 7,960 4%
North 941 0% 418 0% 1,359 0%
Southeast 23,317 10% 181,061 74% 204,378 84%
South 8,059 3% 17,720 7% 25,779 10%
Total 41,777 17% 202,570 83% 244,347 100%
Reinsurance Net R$ thousand
Geographical region Sep 30, 2013
DPVAT % LIFE % Total %
Mid-west 535 0% 1,777 1% 2,312 1%
Northeast 1,991 1% 1,353 1% 3,344 2%
North 241 0% 385 0% 626 0%
Southeast 41,182 19% 157,232 71% 198,414 90%
South 2,402 1% 14,131 6% 16,533 7%
Total 46,351 21% 174,878 79% 221,229 100%
R$ thousand
Geographical regionDec 31, 2012
DPVAT % LIFE % Total %
Mid-west 3,007 1% 1,792 1% 4,799 2%
Northeast 6,453 3% 1,436 1% 7,889 4%
North 941 0% 407 0% 1,348 0%
Southeast 23,317 10% 178,658 74% 201,975 84%
South 8,059 3% 16,965 7% 25,024 10%
Total 41,777 17% 199,258 83% 241,035 100%
MAPFRE Vida S.A.
Reinsurance Gross R$ thousand
Geographical region Sep 30, 2013
DPVAT % LIFE % LIFE %
Mid-west 150 0% 11,303 3% 11,453 3%
Northeast 294 0% 10,824 3% 11,118 3%
North 101 0% -- 0% 101 0%
Southeast 34,215 10% 288,510 79% 322,725 89%
South 1,014 0% 17,249 5% 18,263 5%
Total 35,774 10% 327,886 90% 363,660 100%
R$ thousand
Geographical region Dec 31, 2012
DPVAT % VGBL % LIFE % Total %
Mid-west 3,253 1% 332 0% 67,572 13% 71,157 14%
Northeast 5,328 1% 1,505 0% 24,840 5% 31,673 6%
North 2,006 0% -- 0% -- 0% 2,006 0%
Southeast 31,070 6% 36,373 7% 315,565 60% 383,008 73%
South 7,235 1% 4,152 1% 23,217 5% 34,604 7%
Total 48,892 9% 42,362 8% 431,194 83% 522,448 100%

Notes to the Financial Statements
41
Reinsurance Net R$ thousand
Geographical region Sep 30, 2013
DPVAT % LIFE % LIFE %
Mid-west 150 0% 9,343 3% 9,493 3%
Northeast 294 0% 10,805 3% 11,099 3%
North 101 0% -- 0% 101 0%
Southeast 34,215 10% 278,770 79% 312,985 89%
South 1,014 0% 17,158 5% 18,172 5%
Total 35,774 10% 316,076 90% 351,850 100%
R$ thousand
Geographical region Dec 31, 2012
DPVAT % VGBL % LIFE % Total %
Mid-west 3,253 1% 332 0% 67,572 13% 71,157 14%
Northeast 5,328 1% 1,505 0% 24,840 5% 31,673 6%
North 2,006 0% -- 0% -- 0% 2,006 0%
Southeast 31,070 6% 36,373 7% 302,373 61% 369,816 74%
South 7,235 1% 4,152 1% 20,583 4% 31,970 6%
Total 48,892 9% 42,362 8% 415,368 83% 506,622 100%
Brasilveículos Companhia de Seguros
Reinsurance Gross
R$ thousand
Geographical region Sep 30, 2013
AUTO % DPVAT % Total %
Mid-west 172,981 12% 4,351 0% 177,332 12%
Northeast 245,833 18% 8,831 1% 254,664 19%
North 55,652 4% 2,585 0% 58,237 4%
Southeast 624,372 45% 25,368 2% 649,740 47%
South 232,352 17% 9,092 1% 241,444 18%
Total 1,331,190 96% 50,227 4% 1,381,417 100%
R$ thousand
Geographical regionDec 31, 2012
AUTO % DPVAT % Total %
Mid-west 415,993 32% 5,290 0% 421,283 32%
Northeast 220,293 16% 9,364 1% 229,657 17%
North 46,165 4% 3,160 0% 49,325 4%
Southeast 392,637 30% 25,022 2% 417,659 32%
South 184,592 14% 11,020 1% 195,612 15%
Total 1,259,680 96% 53,856 4% 1,313,536 100%
Reinsurance Net R$ thousand
Geographical region Sep 30, 2013
AUTO % DPVAT % Total %
Mid-west 172,981 12% 4,351 0% 177,332 12%
Northeast 245,833 18% 8,831 1% 254,664 19%
North 55,652 4% 2,585 0% 58,237 4%
Southeast 624,372 45% 25,368 2% 649,740 47%
South 232,352 17% 9,092 1% 241,444 18%
Total 1,331,190 96% 50,227 4% 1,381,417 100%

Notes to the Financial Statements
42
R$ thousand
Geographical regionDec 31, 2012
AUTO % DPVAT % Total %
Mid-west 415,993 32% 5,290 0% 421,283 32%
Northeast 220,293 16% 9,364 1% 229,657 17%
North 46,165 4% 3,160 0% 49,325 4%
Southeast 392,628 30% 25,022 2% 417,650 32%
South 184,592 14% 11,020 1% 195,612 15%
Total 1,259,671 96% 53,856 4% 1,313,527 100%
Aliança do Brasil Seguros S.A.
Reinsurance Gross R$ thousand
Geographical region Sep 30, 2013
Others % DPVAT % Total %
Mid-west 61,052 11% 2,706 1% 63,758 12%
Northeast 92,066 17% 5,333 1% 97,399 18%
North 30,885 6% 1,588 0% 32,473 6%
Southeast 227,218 42% 15,121 3% 242,339 45%
South 95,186 18% 5,430 1% 100,616 19%
Total 506,407 94% 30,178 6% 536,585 100%
R$ thousand
Geographical regionDec 31, 2012
Others % DPVAT % Total %
Mid-west 62,693 12% 3,308 1% 66,001 13%
Northeast 94,100 17% 5,869 1% 99,969 18%
North 32,694 6% 1,972 0% 34,666 6%
Southeast 230,164 42% 15,750 3% 245,914 45%
South 91,230 17% 6,896 1% 98,126 18%
Total 510,881 94% 33,795 6% 544,676 100%
Reinsurance Net R$ thousand
Geographical region Sep 30, 2013
Others % DPVAT % Total %
Mid-west 56,163 12% 2,706 1% 58,869 13%
Northeast 87,081 18% 5,333 1% 92,414 19%
North 29,106 6% 1,588 0% 30,694 6%
Southeast 201,361 41% 15,121 3% 216,482 44%
South 82,753 17% 5,430 1% 88,183 18%
Total 456,464 94% 30,178 6% 486,642 100%
R$ thousand
Geographical regionDec 31, 2012
Others % DPVAT % Total %
Mid-west 55,592 11% 3,308 1% 58,900 12%
Northeast 88,756 18% 5,869 1% 94,625 19%
North 31,007 6% 1,972 0% 32,979 6%
Southeast 203,439 41% 15,750 3% 219,189 44%
South 83,313 17% 6,896 2% 90,209 19%
Total 462,107 93% 33,795 7% 495,902 100%

Notes to the Financial Statements
43
MAPFRE Seguros Gerais S.A.
Reinsurance Gross R$ thousand
Geographical region Sep 30, 2013
AUTO % Others % DPVAT % LIFE % Total %
Mid-west 93,703 3% 43,879 1% 1,042 0% 79 0% 138,703 4%
Northeast 126,092 4% 30,838 1% 1,945 0% 8,447 0% 167,322 5%
North 23,218 1% 8,901 0% 458 0% 16 0% 32,593 1%
Southeast 1,284,146 41% 1,024,660 32% 67,582 2% 11,162 1% 2,387,550 76%
South 322,586 10% 112,180 4% 3,974 0% 216 0% 438,956 14%
Total 1,849,745 59% 1,220,458 38% 75,001 2% 19,920 1% 3,165,124 100%
R$ thousand
Geographical region Dec 31, 2012
AUTO % Others % DPVAT % LIFE % Total %
Mid-west 199,641 4% 66,981 1% 6,897 0% 475 0% 273,994 5%
Northeast 298,017 6% 47,862 1% 12,313 0% 18,981 0% 377,173 7%
North 59,497 1% 11,937 0% 3,712 0% 71 0% 75,217 1%
Southeast 2,658,207 51% 1,176,250 23% 45,166 1% 14,393 0% 3,894,016 75%
South 485,069 9% 184,367 3% 14,335 0% 397 0% 684,168 12%
Total 3,700,431 71% 1,487,397 28% 82,423 1% 34,317 0% 5,304,568 100%
Reinsurance Net R$ thousand
Geographical region Sep 30, 2013
AUTO % Others % DPVAT % LIFE % Total %
Mid-west 93,677 4% 17,510 1% 1,042 0% 64 0% 112,293 5%
Northeast 126,064 5% 18,937 1% 1,945 0% 8,423 0% 155,369 6%
North 23,218 1% 4,779 0% 458 0% 13 0% 28,468 1%
Southeast 1,281,840 50% 505,122 20% 67,582 3% 10,256 0% 1,864,800 73%
South 322,515 12% 80,341 3% 3,974 0% 167 0% 406,997 15%
Total 1,847,314 72% 626,689 25% 75,001 3% 18,923 0% 2,567,927 100%

Notes to the Financial Statements
44
R$ thousand
Geographical region Dec 31, 2012
AUTO % Others % DPVAT % LIFE % Total %
Mid-west 199,289 4% 24,857 1% 6,897 0% 462 0% 231,505 5%
Northeast 297,746 7% 27,929 1% 12,313 0% 18,971 0% 356,959 8%
North 59,469 1% 6,912 0% 3,712 0% 70 0% 70,163 1%
Southeast 2,653,444 59% 521,322 12% 45,166 1% 12,748 0% 3,232,680 72%
South 484,848 11% 121,899 3% 14,335 0% 352 0% 621,434 14%
Total 3,694,796 82% 702,919 17% 82,423 1% 32,603 0% 4,512,741 100%
MAPFRE Affinity Seguradora S.A.
Reinsurance Gross R$ thousand
Geographical region Sep 30, 2013
Others % DPVAT % LIFE % Total %
Mid-west 5,516 1% 765 0% 5,388 1% 11,669 2%
Northeast 6,689 1% 2,287 0% 7,155 1% 16,131 2%
North -- 0% 482 0% -- 0% 482 0%
Southeast 42,680 7% 43,253 8% 442,276 78% 528,209 93%
South 7,372 1% 2,760 1% 2,910 1% 13,042 3%
Total 62,257 10% 49,547 9% 457,729 81% 569,533 100%
R$ thousand
Geographical regionDec 31, 2012
Others % DPVAT % LIFE % Total %
Mid-west 4,021 1% 2,916 0% 5,204 1% 12,141 2%
Northeast 8,826 1% 4,931 1% 9,355 1% 23,112 3%
North -- 0% 2,190 0% -- 0% 2,190 0%
Southeast 58,166 8% 32,131 4% 602,477 81% 692,774 93%
South 3,022 0% 5,911 1% 3,490 1% 12,423 2%
Total 74,035 10% 48,079 6% 620,526 84% 742,640 100%
Reinsurance Net R$ thousand
Geographical region Sep 30, 2013
Others % DPVAT % LIFE % Total %
Mid-west 5,516 1% 765 0% 5,388 1% 11,669 2%
Northeast 6,689 1% 2,287 0% 7,155 1% 16,131 2%
North -- 0% 482 0% -- 0% 482 0%
Southeast 42,680 8% 43,253 8% 441,462 78% 527,395 94%
South 7,372 1% 2,760 0% 2,910 1% 13,042 2%
Total 62,257 11% 49,547 8% 456,915 81% 568,719 100%
R$ thousand
Geographical region Dec 31, 2012
Others % DPVAT % LIFE % Total %
Mid-west 4,021 1% 2,916 0% 5,204 1% 12,141 2%
Northeast 8,826 1% 4,931 1% 9,355 1% 23,112 3%
North -- 0% 2,190 0% -- 0% 2,190 0%
Southeast 58,166 8% 32,131 4% 602,265 82% 692,562 94%
South 3,022 0% 5,911 1% 3,490 0% 12,423 1%
Total 74,035 10% 48,079 6% 620,314 84% 742,428 100%
Insurance risk sensitivity
The sensitivity test was developed to present how the Result and Equity shall be affected in case of reasonable possible changings on the risk variables regarding the Statement date.
The technical provisions account for a significant amount of the liabilities, representing the various future financial commitments of the insurance companies to their clients.

Notes to the Financial Statements
45
Given the magnitude of the financial amount and the uncertainties involving the calculation of provisions, the analysis took into account the most relevant variables for each type of business.
The following variables were chosen as risk factors for each of the insurance companies as shown below:
Companhia de Seguros Aliança do Brasil
September 30, 2013
a) Technical provisions
i) Provision for IBNR: We simulated how a possible and reasonable increase in the delay between the report date and the date when the claims occurred could affect the balance of the provision for IBNR and consequently income and shareholders’ equity as of September 30, 2013. The sensitivity parameter used took into account deterioration in the IBNR factors regarding the development of claims, based on the average variability of those factors. The factor used for this company based on the studies carried out was 7.50%.
ii) Provision for PIP premium deficiency for long-term insurance – Ouro Vida Revisado – Provision made to withstand the expected claims, given the aging of the insured group and sealing of new entrants (discontinued marketing).
We simulated how a deterioration of 5% in the mortality table used for calculating the PIP might have affected the PIP balance and consequently income and shareholders’ equity as of September 30, 2013.
We simulated how a deterioration of 1% in the discount rate used for calculating the PIP might have affected the PIP balance and consequently income and shareholders’ equity as of September 30, 2013.
b) Loss ratio: We simulated how a 5% increase in the portfolio loss ratio would have affected income and shareholders’ equity as of September 30, 2013.
December 31, 2012
a) Technical provisions
i) Provision for IBNR: We simulated how a possible and reasonable increase in the delay between the report date and the date when the claims occurred could affect the balance of the provision for IBNR and consequently income and shareholders’ equity as of December 31, 2012. The sensitivity parameter used took into account deterioration in the IBNR factors regarding the development of claims, based on the average variability of those factors. The factor used for this company based on the studies carried out was 10.44%.
ii) Provision for PIP premium deficiency for long-term insurance – Ouro Vida Revisado – Provision made to withstand the expected claims, given the aging of the insured group and sealing of new entrants (discontinued marketing).
We simulated how a deterioration of 5% in the mortality table used for calculating the PIP might have affected the PIP balance and consequently income and shareholders’ equity as of December 31, 2012.
We simulated how a deterioration of 1% in the discount rate used for calculating the PIP might have affected the PIP balance and consequently income and shareholders’ equity as of December 31, 2012.
b) Loss ratio: We simulated how a 5% increase in the portfolio loss ratio would have affected income and shareholders’ equity as of December 31, 2012.
Bearing in mind the assumptions described above, the amounts obtained were:

Notes to the Financial Statements
46
R$ thousand
Risk Factor Sensitivity Impact on Shareholders' Equity / Profit
Sep 30, 2013 Dec 31, 2012
a. Technical provisions Total Change in the principal assumptions for technical provisions (156,271) (162,639)
a1. IBNR Increase Coefficient of variation in IBNR Factors (15,197) (17,900)
a2. Long-term PIP Increase Reduction
5% deterioration in the Mortality Table
1% reduction in the PIP discount rate
(33,586) (32,138)
(107,488) (112,601)
b. Loss ratio Increase How an increase of 5% in the loss ratio would affect income for the year
(49,584) (40,586)
Vida Seguradora S.A.
September 30, 2013
a) Technical provisions:
i) Provision for IBNR: We simulated how a possible and reasonable increase in the delay between the date when the claims occurred and the report date could affect the balance of the provision for IBNR and consequently income and shareholders’ equity as of September 30, 2013. The sensitivity parameter used took into account a deterioration in the IBNR factors regarding the development of claims, based on the average variability of those factors. The factor used for this Group based on the studies carried out was 12.92%.
b) Loss ratio: We simulated how a 5% increase in the portfolio loss ratio would have affected income and shareholders’ equity as of September 30, 2013.
December 31, 2012
a) Technical provisions:
i) Provision for IBNR: We simulated how a possible and reasonable increase in the delay between the date when the claims occurred and the report date could affect the balance of the provision for IBNR and consequently income and shareholders’ equity as of December 31, 2012. The sensitivity parameter used took into account a deterioration in the IBNR factors regarding the development of claims, based on the average variability of those factors. The factor used for this Group based on the studies carried out was 13.35%.
b) Loss ratio: We simulated how a 5% increase in the portfolio loss ratio would have affected income and shareholders’ equity and result as of December 31, 2012.
Bearing in mind the assumptions described above, the amounts obtained were:
R$ thousand
Risk Factor Sensitivity Impact on Shareholders' Equity/Profit
Sep 30, 2013 Dec 31, 2012
a. Technical provisions Total Change in the principal assumptions for technical provisions (3,678) (2,098)
a1. IBNR Increase Coefficient of variation in IBNR Factors (3,678) (2,098)
b. Loss ratio Increase How an increase of 5% in the loss ratio would affect income for the year (7,284) (6,403)
MAPFRE Vida S.A.
September 30, 2013
a) Technical provisions:
i) Provision for IBNR: We simulated how a possible and reasonable increase in the delay between the report date and the date when the claims occurred could affect the balance of the provision for IBNR and consequently income and shareholders’ equity as of September 30, 2013. The sensitivity parameter used took into account a deterioration in the IBNR factors regarding the development of claims, based on the average variability of those factors. The factor used for this Group based on the studies carried out was 8.05%.
b) Loss ratio: We simulated how a 5% increase in the portfolio loss ratio would have affected income and shareholders’ equity as of September 30, 2013.
December 31, 2012
a) Technical provisions:

Notes to the Financial Statements
47
i) Provision for IBNR: We simulated how a possible and reasonable increase in the delay between the report date and the date when the claims occurred could affect the balance of the provision for IBNR and consequently income and shareholders’ equity as of December 31, 2012. The sensitivity parameter used took into account a deterioration in the IBNR factors regarding the development of claims, based on the average variability of those factors. The factor used for this Group based on the studies carried out was 11.70%.
b) Loss ratio: We simulated how a 5% increase in the portfolio loss ratio would have affected income and shareholders’ equity as of December 31, 2012.
Bearing in mind the assumptions described above, the amounts obtained were:
R$ thousand
•
Risk Factor Sensitivity Impact on Shareholders' Equity/Profit
Sep 30, 2013 Dec 31, 2012
•
•a. Technical provisions Total Change in principal assumptions for technical provisions (4,441) (6,531)
a1. IBNR Increase Coefficient of variation of the IBNR factors (4,441) (6,531)
b. Loss ratio Increase How an increase of 5% in the loss ratio would affect income for the year
(16,314) (14,044)
Brasilveículos Companhia de Seguros
September 30, 2013
a) Technical provisions:
i) Provision for IBNR: We simulated how a possible and reasonable increase in the delay between the report date and the date when the claims occurred could affect the balance of the provision for IBNR and consequently income and shareholders’ equity as of September 30, 2013. The sensitivity parameter used took into account a deterioration in the IBNR factors regarding the development of claims, based on the average variability of those factors. The factor used for this Group based on the studies carried out was 4.25%.
b) Loss ratio: We simulated how a 5% increase in the portfolio loss ratio would have affected income and shareholders’ equity as of September 30, 2013.
December 31, 2012
a) Technical provisions:
i) Provision for IBNR: We simulated how a possible and reasonable increase in the delay between the report date and the date when the claims occurred could affect the balance of the provision for IBNR and consequently income and shareholders’ equity as of December 31, 2012. The sensitivity parameter used took into account a deterioration in the IBNR factors regarding the development of claims, based on the average variability of those factors. The factor used for this Group based on the studies carried out was 7.54%.
b) Loss ratio: We simulated how a 5% increase in the portfolio loss ratio would have affected income and shareholders’ equity as of December 31, 2012.
Bearing in mind the assumptions described above, the amounts obtained were:
R$ thousand
•
Risk Factor Sensitivity Impact on Shareholders' Equity/Profit
Sep 30, 2013 Dec 31, 2012
••a. Technical provisions Total Change in principal assumptions for technical provisions (2,286) (1)
a1. IBNR Increase Coefficient of variation of the IBNR factors (2,286) (1)
b. Loss ratio Increase How an increase of 5% in the loss ratio would affect income for the year
(52,164) (22,714)
Aliança do Brasil Seguros S.A.
September 30, 2013
a) Technical provisions:
i) Provision for IBNR: We simulated how a possible and reasonable increase in the delay between the report date and the date when the claims occurred could affect the balance of the provision for IBNR and consequently income and shareholders’ equity as of September 30, 2013. The

Notes to the Financial Statements
48
sensitivity parameter used took into account a deterioration in the IBNR factors regarding the development of claims, based on the average variability of those factors. The factor used for this Group based on the studies carried out was 13.78%.
b) Loss ratio: We simulated how a 5% increase in the portfolio loss ratio would have affected income and shareholders’ equity as of September 30, 2013.
December 31, 2012
a) Technical provisions:
i) Provision for IBNR: We simulated how a possible and reasonable increase in the delay between the report date and the date when the claims occurred could affect the balance of the provision for IBNR and consequently income and shareholders’ equity as of December 31, 2012. The sensitivity parameter used took into account a deterioration in the IBNR factors regarding the development of claims, based on the average variability of those factors. The factor used for this Group based on the studies carried out was 15.18%.
b) Loss Ratio: We simulated how an increase of 5% in the loss ratio of the portfolio would have impacted Income and Shareholders' Equity as of December 31, 2012.
Using the assumptions described above, the amounts calculated are:
R$ thousand
Risk Factor Sensitivity Impact on Shareholders' Equity / Profit
Sep 30, 2013 Dec 31, 2012
•a. Technical provisions Total Change in principal assumptions for technical provisions (2,077) (2,695)
a1. IBNR Increase Coefficient of variation of the IBNR factors (2,077) (2,695)
b. Loss ratio Increase How an increase of 5% in the loss ratio would affect income for the year
(8,027) (7,880)
MAPFRE Seguros Gerais S.A.
September 30, 2013
a) Technical provisions:
i) Provision for IBNR: We simulated how a possible and reasonable increase in the delay between the report date and the date when the claims occurred could affect the balance of the provision for IBNR and consequently income and shareholders’ equity as of September 30, 2013. The sensitivity parameter used took into account a deterioration in the IBNR factors regarding the development of claims, based on the average variability of those factors. The factor used for this Group based on the studies carried out was 17.50%.
b) Loss ratio: We simulated how a 5% increase in the portfolio loss ratio would have affected income and shareholders’ equity as of September 30, 2013.
December 31, 2012
a) Technical provisions:
i) Provision for IBNR: We simulated how a possible and reasonable increase in the delay between the report date and the date when the claims occurred could affect the balance of the provision for IBNR and consequently income and shareholders’ equity as of December 31, 2012. The sensitivity parameter used took into account a deterioration in the IBNR factors regarding the development of claims, based on the average variability of those factors. The factor used for this Group based on the studies carried out was 22.31%.
b) Loss ratio: We simulated how a 5% increase in the portfolio loss ratio would have affected income and shareholders’ equity as of December 31, 2012.
Using the assumptions described above, the amounts calculated are:

Notes to the Financial Statements
49
R$ thousand
Risk Factor Sensitivity Impact on Shareholders' Equity / Profit
Sep 30, 2013 Dec 31, 2012
•a. Technical provisions Total Change in principal assumptions for technical provisions (16,760) (21,366)
a1. IBNR Increase Coefficient of variation of the IBNR factors (16,760) (21,366)
b. Loss ratio Increase How an increase of 5% in the loss ratio would affect income for the year
(91,904) (103,848)
MAPFRE Affinity Seguradora S.A.
September 30, 2013
a) Technical provisions:
i) Provision for IBNR: We simulated how a possible and reasonable increase in the delay between the report date and the date when the claims occurred could affect the balance of the provision for IBNR and consequently income and shareholders’ equity as of September 30, 2013. The sensitivity parameter used took into account a deterioration in the IBNR factors regarding the development of claims, based on the average variability of those factors. The factor used for this Group based on the studies carried out was 15.36%.
b) Loss ratio: We simulated how a 5% increase in the portfolio loss ratio would have affected income and shareholders’ equity as of September 30, 2013.
December 31, 2012
a) Technical provisions:
i) Provision for IBNR: We simulated how a possible and reasonable increase in the delay between the report date and the date when the claims occurred could affect the balance of the provision for IBNR and consequently income and shareholders’ equity as of December 31, 2012. The sensitivity parameter used took into account a deterioration in the IBNR factors regarding the development of claims, based on the average variability of those factors. The factor used for this Group based on the studies carried out was 15.99%.
b) Loss ratio: We simulated how a 5% increase in the portfolio loss ratio would have affected income and shareholders’ equity as of December 31, 2012.
Using the assumptions described above, the amounts calculated are:
R$ thousand
•
Risk Factor Sensitivity Impact on Shareholders' Equity / Profit
Sep 30, 2013 Dec 31, 2012
••a. Technical Provisions Total Change in principal assumptions for technical provisions (5,735) (5,441)
a1. IBNR Increase Coefficient of variation of the IBNR factors (5,735) (5,441)
b. Loss ratio Increase How an increase of 5% in the loss ratio would affect income for the year
(12,025) (10,111)
Exposure to insurance credit risk
Exposure to credit risk for premiums receivable differs as between the lines of risk in the future and in the past, in the sense that for past lines of risk the exposure is greater since cover precedes payment of the insurance premium.
Management is of the view that, in relation to insurance transactions, there is a significant credit risk exposure, since the Group offers a wide range of different products. Management adopts conservative control policies in analyzing credit.
In respect of reinsurance operations, the Group is exposed to risk concentration for individual reinsurers, due to the nature of the reinsurance market and the narrow range of reinsurers with acceptable credit ratings. The Group’s policy is to manage exposure to counterparties for reinsurance, working only with reinsurance companies of high credit quality as reflected in the ratings attributed by rating agencies. Some operations have been undertaken with reinsurance company of the MAPFRE Group.
As of September 30, 2013, the Group’s reinsurance partners were:
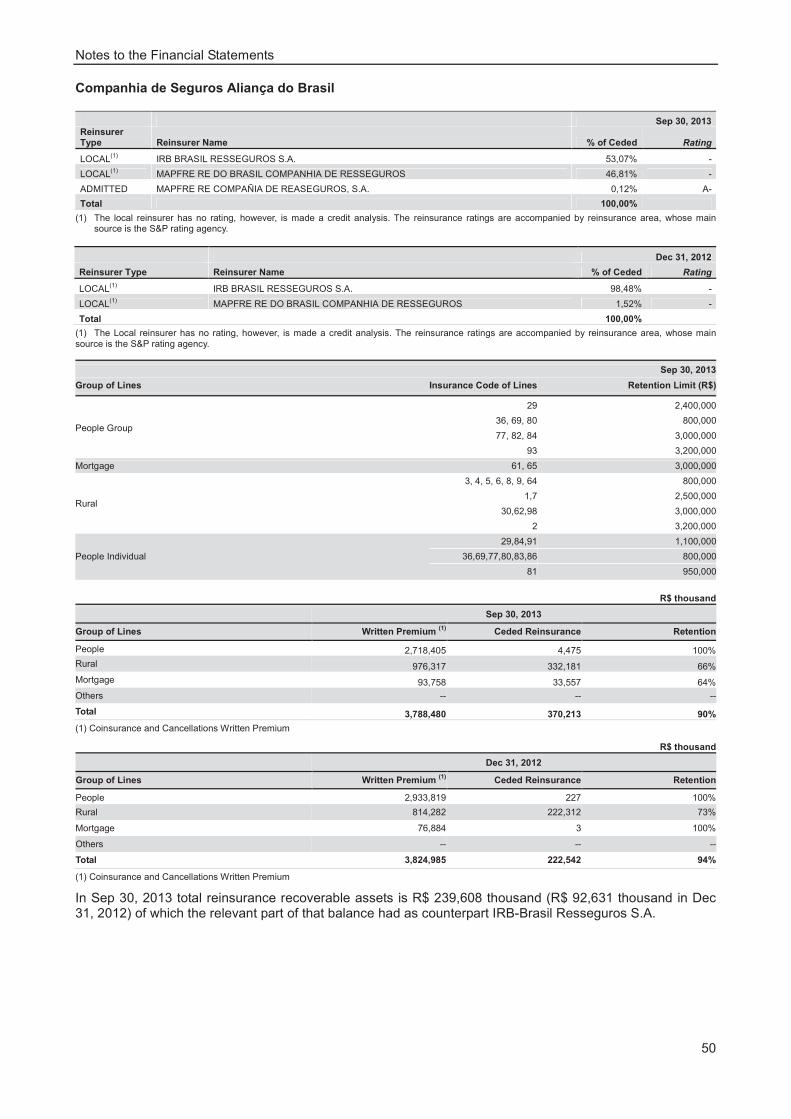
Notes to the Financial Statements
50
Companhia de Seguros Aliança do Brasil
Sep 30, 2013Reinsurer Type Reinsurer Name % of Ceded Rating
LOCAL(1) IRB BRASIL RESSEGUROS S.A. 53,07% -
LOCAL(1) MAPFRE RE DO BRASIL COMPANHIA DE RESSEGUROS 46,81% -
ADMITTED MAPFRE RE COMPAÑIA DE REASEGUROS, S.A. 0,12% A-
Total 100,00%
(1) The local reinsurer has no rating, however, is made a credit analysis. The reinsurance ratings are accompanied by reinsurance area, whose main source is the S&P rating agency.
Dec 31, 2012
Reinsurer Type Reinsurer Name % of Ceded Rating
LOCAL(1) IRB BRASIL RESSEGUROS S.A. 98,48% -
LOCAL(1) MAPFRE RE DO BRASIL COMPANHIA DE RESSEGUROS 1,52% -
Total 100,00%
(1) The Local reinsurer has no rating, however, is made a credit analysis. The reinsurance ratings are accompanied by reinsurance area, whose main source is the S&P rating agency.
Sep 30, 2013
Group of Lines Insurance Code of Lines Retention Limit (R$)
People Group
29 2,400,000
36, 69, 80 800,000
77, 82, 84 3,000,000
93 3,200,000
Mortgage 61, 65 3,000,000
Rural
3, 4, 5, 6, 8, 9, 64 800,000
1,7 2,500,000
30,62,98 3,000,000
2 3,200,000
People Individual
29,84,91 1,100,000
36,69,77,80,83,86 800,000
81 950,000
R$ thousand
Sep 30, 2013
Group of Lines Written Premium (1) Ceded Reinsurance Retention
People 2,718,405 4,475 100%
Rural 976,317 332,181 66%
Mortgage 93,758 33,557 64%
Others -- -- --
Total 3,788,480 370,213 90%
(1) Coinsurance and Cancellations Written Premium
R$ thousand
Dec 31, 2012
Group of Lines Written Premium (1) Ceded Reinsurance Retention
People 2,933,819 227 100%
Rural 814,282 222,312 73%
Mortgage 76,884 3 100%
Others -- -- --
Total 3,824,985 222,542 94%
(1) Coinsurance and Cancellations Written Premium
In Sep 30, 2013 total reinsurance recoverable assets is R$ 239,608 thousand (R$ 92,631 thousand in Dec 31, 2012) of which the relevant part of that balance had as counterpart IRB-Brasil Resseguros S.A.

Notes to the Financial Statements
51
Vida Seguradora S.A.
Set 30, 2013
Reinsurer Type Reinsurer Name % of Ceded Rating
Local(1) IRB BRASIL RESSEGUROS S.A. 30% -
Local(1) MAPFRE RE DO BRASIL COMPANHIA DE RESSEGUROS 70% -
Total 100%
(1) The Local reinsurer has no rating, however, is made a credit analysis. The reinsurance ratings are accompanied by reinsurance area, whose main source is the S&P rating agency.
Dec 31, 2012
Reinsurer Type Reinsurer Name % of Ceded Rating
Local(1) IRB BRASIL RESSEGUROS S.A. 4% -
Local(1) MAPFRE RE DO BRASIL COMPANHIA DE RESSEGUROS 91% -
Admitted SCOR REINSURANCE COMPANY 5% A+
Total 100%
(1) The Local reinsurer has no rating, however, is made a credit analysis. The reinsurance ratings are accompanied by reinsurance area, whose main source is the S&P rating agency.
Sep 30, 2013
Group of Lines Insurance Code of Lines Retention Limit (R$)
Vehicles 88 1,200,000
People Group 29, 77, 82, 84, 90, 93 1,500,000
80 500,000
People Individual 29, 77, 81, 90, 91 1,500,000
Exposure to insurance credit risk
R$ thousand
Sep 30, 2013
Group of Lines Written Premium (1) Ceded Reinsurance Retention
People Group 80,984 3,036 96%
People Individual 96,930 -- 100%
Total 177,914 3,036 98%
(1) Coinsurance and Cancellations Written Premium R$ thousand
Dec 31, 2012
Group of Lines Written Premium (1) Ceded Reinsurance Retention
People Group 175,774 6,627 96%
People Individual 229,368 -- 100%
Total 405,142 6,627 98%
(1) Coinsurance and Cancellations Written Premium

Notes to the Financial Statements
52
MAPFRE Vida S.A.
Set 30, 2013
Reinsurer Type Reinsurer Name % of Ceded Rating
Local(1) IRB BRASIL RESSEGUROS S.A. 30% -
Local(1) MAPFRE RE DO BRASIL COMPANHIA DE RESSEGUROS 70% -
Total 100%
(1) The Local reinsurer has no rating, however, is made a credit analysis. The reinsurance ratings are accompanied by reinsurance area, whose main source is the S&P rating agency.
Dec 31, 2012
Reinsurer Type Reinsurer Name % of Ceded Rating
Local(1) IRB BRASIL RESSEGUROS S.A. 99.86% -
Local(1) MAPFRE RE DO BRASIL COMPANHIA DE RESSEGUROS 0.14% -
Total 100%
(1) The Local reinsurer has no rating, however, is made a credit analysis. The reinsurance ratings are accompanied by reinsurance area, whose main source is the S&P rating agency.
Sep 30, 2013
Group of Lines Insurance Code of Lines Retention Limit (R$)
Vehicle 88 1,413,000
People Group
29, 69, 83, 84, 86, 87, 94 1,413,000
77, 82 1,993,289
80 2,391,947
93 2,790,604
People Individual
29, 69, 83, 84, 86, 87, 91, 92 1,413,000
81 1,594,631
77 1,993,289
80 2,391,947
Exposure to insurance credit risk
R$ thousand
Sep 30, 2013
Group of Lines Written Premium (1) Ceded Reinsurance Retention
People Group 327,886 11,810 96%
Total 327,886 11,810 96%
(1) Coinsurance and Cancellations Written Premium
R$ thousand
Dec 31, 2012
Group of Lines Written Premium (1) Ceded Reinsurance Retention
People Group 431,194 15,823 96%
People Individual -- -- 0%
Total 431,194 15,823 96%
(1) Coinsurance and Cancellations Written Premium
Brasilveículos Companhia de Seguros
Sep 30, 2013
Group of Lines Insurance Code of Lines Retention Limit (R$)
Vehicle
20 2,000,000
25 1,800,000
31,42,88 1,250,000
53 3,600,000
Property 14 1,250,000
People Group 29 1,250,000
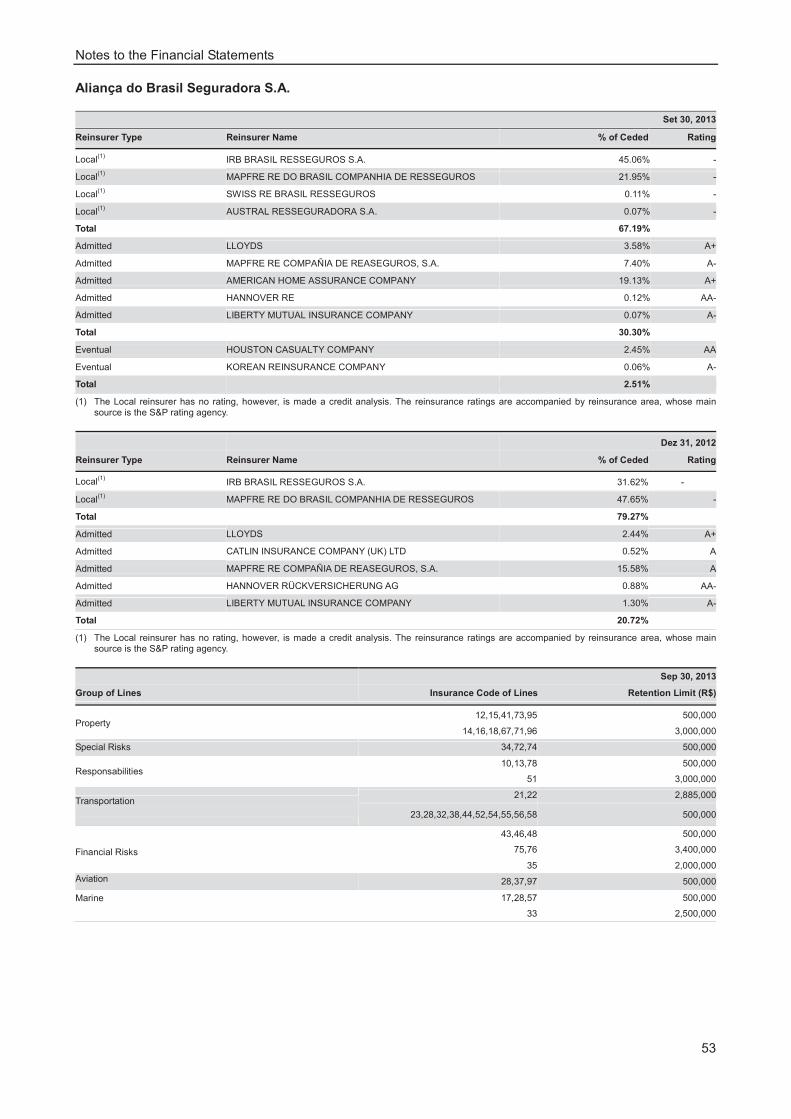
Notes to the Financial Statements
53
Aliança do Brasil Seguradora S.A.
Set 30, 2013
Reinsurer Type Reinsurer Name % of Ceded Rating
Local(1) IRB BRASIL RESSEGUROS S.A. 45.06% -
Local(1) MAPFRE RE DO BRASIL COMPANHIA DE RESSEGUROS 21.95% -
Local(1) SWISS RE BRASIL RESSEGUROS 0.11% -
Local(1) AUSTRAL RESSEGURADORA S.A. 0.07% -
Total 67.19%
Admitted LLOYDS 3.58% A+
Admitted MAPFRE RE COMPAÑIA DE REASEGUROS, S.A. 7.40% A-
Admitted AMERICAN HOME ASSURANCE COMPANY 19.13% A+
Admitted HANNOVER RE 0.12% AA-
Admitted LIBERTY MUTUAL INSURANCE COMPANY 0.07% A-
Total 30.30%
Eventual HOUSTON CASUALTY COMPANY 2.45% AA
Eventual KOREAN REINSURANCE COMPANY 0.06% A-
Total 2.51%
(1) The Local reinsurer has no rating, however, is made a credit analysis. The reinsurance ratings are accompanied by reinsurance area, whose main source is the S&P rating agency.
Dez 31, 2012
Reinsurer Type Reinsurer Name % of Ceded Rating
Local(1)IRB BRASIL RESSEGUROS S.A. 31.62% -
Local(1) MAPFRE RE DO BRASIL COMPANHIA DE RESSEGUROS 47.65% -
Total 79.27%
Admitted LLOYDS 2.44% A+
Admitted CATLIN INSURANCE COMPANY (UK) LTD 0.52% A
Admitted MAPFRE RE COMPAÑIA DE REASEGUROS, S.A. 15.58% A
Admitted HANNOVER RÜCKVERSICHERUNG AG 0.88% AA-
Admitted LIBERTY MUTUAL INSURANCE COMPANY 1.30% A-
Total 20.72%
(1) The Local reinsurer has no rating, however, is made a credit analysis. The reinsurance ratings are accompanied by reinsurance area, whose main source is the S&P rating agency.
Sep 30, 2013
Group of Lines Insurance Code of Lines Retention Limit (R$)
Property 12,15,41,73,95 500,000
14,16,18,67,71,96 3,000,000
Special Risks 34,72,74 500,000
Responsabilities 10,13,78 500,000
51 3,000,000
Transportation 21,22 2,885,000
23,28,32,38,44,52,54,55,56,58 500,000
43,46,48 500,000
Financial Risks 75,76 3,400,000
35 2,000,000
Aviation 28,37,97 500,000
Marine 17,28,57 500,000
33 2,500,000

Notes to the Financial Statements
54
Reinsurance
R$ thousand
Sep 30, 2013
Group of Lines Written Premium (1) Ceded Reinsurance Retention
Property 447,632 37,044 92%
Financial Risks / Credit 36,408 6,117 83%
Responsabilities 5,826 356 94%
Transportation 9,904 56 99%
Marine / Aviation / Vessel 6,638 6,371 4%
Total 506,408 49,944 90%
(1) Coinsurance and Cancellations Written Premium
R$ thousand
Dec 31, 2012
Group of Lines Written Premium (1) Ceded Reinsurance Retention
Property 440,028 36,661 92%
Financial Risks / Credit 48,257 8,160 83%
Responsabilities 5,912 427 93%
Transportation 8,633 222 97%
Marine / Aviation / Vessel 8,053 3,306 59%
Total 510,883 48,776 90%
(1) Coinsurance and Cancellations Written Premium
In September 30, 2013, the total amount of reinsurance assets recoverable was R$ 106,102 thousand (R$ 60,007 thousand at Dec 31, 2012), with a significant part of this balance having IRB-Brasil Resseguros S.A. as the counterparty.
MAPFRE Seguros Gerais S.A.
Sep 30, 2013
Group of Lines Insurance Code of Lines Retention Limit (R$)
Property 73,95 2,500,000
12,14,15,16,18,41,67,71 3,000,000
96 6,000,000
Special Risks 34 2,500,000
Responsabilities 10,78 2,500,000
13,51 3,000,000
Vehicle 20,24,25,31,88 2,500,000
42,53 3,000,000
Transportation 21,22,32,38,44,52,54,55,56 5,000,000
28 3,000,000
Financial Risks 46 2,500,000
48,75,76 10,000,000
People Group 29,93 2,500,000
82 3,000,000
84,87 800,000
Mortgage 61,65 3,000,000
Rural 1,7 2,500,000
3 2,000,000
30,62 3,000,000
People Individual 29,81 2,500,000
84,87 800,000
Marine 17,33 2,500,000
28 3,000,000
Aviation 28 3,000,000
35,37,97 2,500,000

Notes to the Financial Statements
55
R$ thousand
Sep 30, 2013
Group of Lines Written Premium (1) Ceded Reinsurance Retention
Vehicle 1,849,745 2,431 100%
Property 561,064 283,399 49%
Transportation 188,434 14,136 92%
Marine / Aviation 172,042 136,790 20%
Rural 174,283 74,533 57%
Others 144,554 85,907 41%
Total 3,090,122 597,196 81%
(1) Coinsurance and Cancellations Written Premium
R$ thousand
Dec 31, 2012
Group of Lines Written Premium (1) Ceded Reinsurance Retention
Vehicle 3,700,430 5,635 100%
Property 743,933 413,234 44%
Transportation 275,951 38,720 86%
Marine / Aviation 28,274 27,987 1%
Rural 161,375 78,405 51%
Others 161,242 100,414 38%
Total 5,071,205 664,395 87%
(1) Coinsurance and Cancellations Written Premium
MAPFRE Affinity Seguradora S.A.
Set 30, 2013
Reinsurer Type Reinsurer Name % of Ceded
Local(1) IRB BRASIL RESSEGUROS S.A. 30%
Local(1) MAPFRE RE DO BRASIL COMPANHIA DE RESSEGUROS 70%
Total 100%
(1) The Local reinsurer has no rating, however, is made a credit analysis. The reinsurance ratings are accompanied by reinsurance area, whose main source is the S&P rating agency.
Dec 31, 2012
Reinsurer Type Reinsurer Name % of Ceded
Local(1) IRB BRASIL RESSEGUROS S.A. 32%
Local(1) MAPFRE RE DO BRASIL COMPANHIA DE RESSEGUROS 68%
Total 100%
(1) The Local reinsurer has no rating, however, is made a credit analysis. The reinsurance ratings are accompanied by reinsurance area, whose main source is the S&P rating agency.
Sep 30, 2013
Group of Lines Insurance Code of Lines Retention Limit (R$)
Property 71 1,500,000
Vehicle 88 1,500,000
Financial Risks 46,48 2,200,000
76 1,500,000
People Group9880
29,77,82,84,87,93
1,500,000 500,000
1,500,000
Rural 98 1,500,000
People Individual 29,77,84,87 1,500,000
Responsabilities 51 3,000,000
R$ thousand

Notes to the Financial Statements
56
Sep 30, 2013
Group of Lines Written Premium (1) Ceded Reinsurance Retention
People 457,729 814 100%
Credit / Financial Risks 62,257 -- 100%
Total 519,986 814 100%
(1) Coinsurance and Cancellations Written Premium
R$ thousand
Dec 31, 2012
Group of Lines Written Premium (1) Ceded Reinsurance Retention
People (556) -- 100%
Credit / Financial Risks 696,291 212 100%
Total 695,735 212 100%
(1) Coinsurance and Cancellations Written Premium
Management of credit risk
Reinsurance companies are subject to a process of credit risk analysis on a continuous basis to ensure that the objectives of minimizing insurance and credit risk are attained.
Some aspects of credit risk that require care are: avoiding a concentration of business with reinsurance companies, with groups of customers, with a single business group or even in geographic regions.
The reinsurance guidelines also help to monitor insurance credit risk and are determined by internal rules.
The financial policy provides for diversification of the investment portfolio (financial assets), with the setting of exposure limits for each issuer and the requirement of a minimum “A” rating for allocation.
Credit risk management for financial instruments includes the monitoring of credit risk exposure on the part of individual counterparties in relation to credit classifications by risk assessors, such as Fitch Ratings, Standard & Poor’s and Moody’s.
The companies use a variety of sensitivity analyses and stress tests as tools for managing financial risks. The results of such analyses are used to minimize risk and to understand the impact on the Group’s income and shareholders’ equity under normal conditions and under conditions of stress. These tests take into account past scenarios and scenarios of market conditions that are forecast for future periods. Their results are used in the planning and decision-making process and also to identify specific risks arising from the financial assets and liabilities held by the Group.

Notes to the Financial Statements
57
Companhia de Seguros Aliança do Brasil
Credit Risk Rating
Sep 30, 2013
Issuer Financial SecurityAccounting Value /
Fair ValueRating
BCO DO NORDESTE DO BRASIL S.A. Time Deposit (CDB) 21,766 AAA (bra) (Fitch
Ratings)
BCO BONSUCESSO Time Deposit (CDB-DPGE) 16,266 A3.br (Moody´s)
BCO TRICURY Time Deposit (CDB-DPGE) 16,246 BBB+ (Austin Ratings)
BCO MERCANTIL DO BRASIL Time Deposit (CDB-DPGE) 16,205 Aa3.br (Moody´s)
BCO INDUSVAL Time Deposit (CDB-DPGE) 12,977 A2.br (Moody´s)
BCO PINE Time Deposit (CDB-DPGE) 12,877 A1.br (Moody´s)
BCO PINE Time Deposit (CDB-DPGE) 12,845 A1.br (Moody´s)
BIC BANCO Time Deposit (CDB-DPGE) 12,230 Baa3 (Moody's)
FIBRA Time Deposit (CDB-DPGE) 12,181 Ba3 (Moody's)
SOFISA Time Deposit (CDB-DPGE) 12,162 Ba2 (Moody's)
BCO MERCANTIL DO BRASIL S.A. Time Deposit (CDB-DPGE) 7,707 Aa3.br (Moody´s)
BNDES PARTICIPAÇÕES S.A. BNDESPAR Debentures 28,467 brAAA (S&P)
BRASIL TELECOM Debentures 25,396 Aaa.br (Moody´s)
BR MALLS PARTICIPAÇÕES S.A. Debentures 20,576 brAA (S&P)
NOVA DUTRA - CONCESSIONÁRIO ROV. PRES. DUTRA Debentures 17,005 AA-(bra) (Fitch Ratings)
COMPANHIA DE TRANSMISSÃO DE ENERGIA ELÉTRICA PAULISTA
Debentures 10,917 AA+ (bra) (Fitch
Ratings)BANDEIRANTE ENERGIA S.. Debentures 10,296 Aa1.br ( Moody´s)
BRASIL TELECOM Debentures 10,161 Aaa.br (Moody´s)
EVEN CONSTRUTORA E INCORPORADORA S.A. Debentures 10,080 A2.br (Moody´s)
COMPANHIA SIDERÚRGICA NATIONAL Debentures 10,078 brAAA (S&P)
BROOKFIELD INCORPORAÇÕES S.A. Debentures 10,053 Aa3.br (Moody’s)
CONC. SISTEMA ANHANGUERA-BANDEIRANTES S.A. Debentures 10,043 brAAA (S&P)
AES SUL DISTR. GAÚCHA DE ENERGIA S.A. Debentures 10,040 brAA- (S&P)
TELEMAR NORTE LESTE S.A.. Debentures 9,397 brAAA (S&P)
SANEAMENTO BÁSICO DO ESTADO DE SÃO PAULO - SABESP Debentures 7,088 brAA+ (S&P)
AES TIETÊ Debentures 6,993 Aa1.br (Moody's)
COMPANHIA DE SANEAMENTO DE MINAS GERAIS COPASA MG
Debentures 6,041 Aa2.br (Moody's)
LOCALIZA RENT CAR Debentures 4,296 Aa1.br (Moody’s)
INTERVIAS S.A. Debentures 3,569 Aa1.br (Moody´s)
AUTOVIAS S.A. Debentures 3,560 Aa2.br (Moody´s)
AMPLA ENERGIA E SERVIÇOS S.A. Debentures 1,704 brAA- (S&P)
CONCESS. DA RODOV. OSÓRIO PORTO ALEGRE - CONCEPA Debentures 1,701 AA-.bra (Moody´s)
CEMIG GERAÇÃO E TRANSMISSÃO Debentures 341 brAA- (S&P)
CHEMICAL VII - BRASKEM S.A. Receivables Investment Fund 30,132 Aaa.br/Baa3 (Moody's)
INSUMOS BÁSICO DA INDÚSTRIA PETROQUÍMICA Receivables Investment Fund 17,263 brAAA (S&P)
PETROQUÍMICA Receivables Investment Fund 10,022 brAAA (S&P)
CHEMICAL VI - BRASKEM S.A. Receivables Investment Fund 8,206 Ba1.br (Moody's)
BCO DAYCOVAL Financial Bills 46,592 Aa1 (Moody's)
BCO ABC BRASIL Financial Bills 33,481 brAA+/Estável/brA-1
(S&P)
BCO HSBC Financial Bills 31,629 Baa2 (S&P)
BCO ITAÚ UNIBANCO Financial Bills 28,742 Aaa.br (Moody´s)
BCO SANTANDER Financial Bills 17,647 Aaa.br (Moody´s)
BCO BRADESCO Financial Bills 17,621 Aaa.br (Moody´s)
CAIXA ECONÔMICA FEDERAL Financial Bills 11,717 Aaa.br (Moody´s)
BCO SANTANDER Financial Bills 11,387 Aaa.br (Moody´s)
BCO BANRISUL Financial Bills 10,144 Aaa.br (Moody´s)
TOTAL 645,847

Notes to the Financial Statements
58
MAPFRE Seguros Gerais S.A.
Rating reinsurers facultative contracts
Sep 30, 2013
Reinsurer Type Reinsurer Name % of Ceded Rating
Local/Contract IRB - INSTITUTO DE RESSEGUROS DO BRASIL 42.16% -Local/Contract MAPFRE RE DO BRASIL COMPANHIA DE RESSEGU 57.84% -Local/Contract MUNICH RE DO BRASIL RESSEGURADORA S.A. 0.00% -Total 100.00%
Local/Facultative ACE RESSEGURADORA S.A. 1.95% -Local/Facultative AIG RESSEGUROS BRASIL 0.07% -Local/Facultative ALLIANZ GLOBAL RESSEGUROS BRASIL S.A. 7.09% -Local/Facultative AUSTRAL RESSEGURADORA S.A. 0.38% -Local/Facultative IRB - INSTITUTO DE RESSEGUROS DO BRASIL 80.72% -Local/Facultative MAPFRE RE DO BRASIL COMPANHIA DE RESSEGU 4.75% -Local/Facultative MUNICH RE DO BRASIL RESSEGURADORA S.A. 3.74% -Local/Facultative SWISS RE BRASIL RESSEGURADORA S.A. 0.73% -Local/Facultative TERRA BRASIS RESSEGUROS S.A. 0.57% -Total 100.00%
Admitted ACE TEMPEST REINSURANCE LTD. 0.07% AA-Admitted ACE UNDERWRITING AGENCIES LTD - 2488 2.89% A+Admitted ADVENT UNDERWRITING LIMITED - 780 0.00% A+Admitted AEGIS MANAGING AGENCY LIMITED - 1225 0.16% A+Admitted ALLIANZ GLOBAL CORPORATE & SPECIALTY AG 3.10% AAAdmitted ALTERRA AT LLOYDS LTF - 1400 0.19% A+Admitted AMERICAN HOME ASSURANCE COMPANY 9.24% A+Admitted AMLIN UNDERWRITING LIMITED - 2001 3.70% A+Admitted AMLIN UNDERWRITING LIMITED - 6106 0.22% A+Admitted ANTARES MANAGING AGENCY LTD - 1274 0.32% A+Admitted ARCH UNDERWRITING AT LLOYDS LTD - 2012 0.14% A+Admitted ARGENTA SYNDICATE MANAGEMENT - 1965 0.27% A+Admitted ARGENTA SYNDICATE MANAGEMENT LMI - 2121 0.26% A+Admitted ARGENTA SYNDICATE MANAGEMENT LTD - 1110 0.02% A+Admitted ARGO MANAGING AGENCY LTD - 1200 1.55% A+Admitted ARK SYNDICATE MANAGEMENT LTD - 3902 0.04% A+Admitted ARK SYNDICATE MANAGEMENT LTD - 4020 0.26% A+Admitted ARK SYNDICATE MANAGEMENT LTD - 6105 0.01% A+Admitted ASCOT UNDERWRITING LIMITED - 1414 0.50% A+Admitted ASPEN MANAGING AGENCY LTD - 4711 2.19% A+Admitted ATRIUM UNDERWRITERS LIMITED - 570 0.20% A+Admitted ATRIUM UNDERWRITERS LIMITED - 609 0.25% A+Admitted BEAUFORT UNDERWRITING AGENCY LTD - 1318 0.62% A+Admitted BEAUFORT UNDERWRITING AGENCY LTD - 318 0.05% A+Admitted BEAZLEY FURLONGE LTD - 2623 0.76% A+Admitted BEAZLEY FURLONGE LTD - 623 0.13% A+Admitted BRIT SYNDICATES LIMITED - 2987 0.77% A+Admitted CANOPIUS MANAGING AGENTS LTD - 4444 0.19% A+Admitted CANOPIUS MANAGING LTD - 260 0.00% A+Admitted CATHEDRAL UNDERWRITING LIMITED - 2010 0.27% A+Admitted CATLIN UNDERWRITING AGENCIES LTD 3002 0.01% A+Admitted CATLIN UNDERWRITING AGENCIES LTD - 2003 3.67% A+Admitted CHAUCER SYNDICATES LTD - 1084 0.70% A+Admitted CHAUCER SYNDICATES LTD - 1301 0.35% A+Admitted CHUBB MANAGING AGENCY LTD - 1882 0.14% A+Admitted FACTORY MUTUAL INSURANCE COMPANY 25.19% A+Admitted FARADAY UNDERWRITING LIMITED - 435 1.36% A+Admitted FEDERAL INSURANCE COMPANY 0.42% AAAdmitted FLAGSTONE SYNDICATE MANAGEMENT LTD 1861 0.45% A+Admitted FLAGSTONE SYNDICATE MANAGEMENT LTD 1969 0.68% A+Admitted HANNOVER RÜCKVERSICHERUNG AG 7.81% AA-Admitted HARDY (UNDERWRITING AGENCIES) LTD - 382 1.25% A+Admitted HCC UNDERWRITING AGENCY LIMITED - 4040 0.04% A+Admitted HCC UNDERWRITING AGENCY LIMITED - 4141 -0.07% A+

Notes to the Financial Statements
59
Admitted HISCOX SYNDICATES LIMITED - 33 1.23% A+Admitted HISCOX SYNDICATES LTD - 3624 0.12% A+Admitted HISCOX SYNDICATES LTD - 6104 0.03% A+Admitted LIBERTY MUTUAL INSURANCE COMPANY 0.67% A-Admitted LIBERTY SYNDICATE MANAGEMENT LTD - 4472 1.83% A+Admitted MANAGING AGENCY PARTNERS LTD - 2791 0.06% A+Admitted MAPFRE RE COMPAÑIA DE REASEGUROS S.A. -6.61% A-Admitted MARKEL SYNDICATE MANAGEMENT LTD - 3000 0.29% A+Admitted MITSUI SUMITOMO INSURANCE COMPANY, LIMITED 3.76% A+Admitted MITSUI SUMITOMO INSURANCE UTG AT - 3210 0.60% A+Admitted MONTPELIER UNDERWRITING AGENCIES - 5151 0.23% A+Admitted MUNICH RE UNDERWRITING LTD - 457 0.48% A+Admitted NAVIGATORS UNDERWRITING AGENCY - 1221 0.63% A+Admitted NOVAE SYNDICATES LTD - 2007 0.08% A+Admitted ODYSSEY AMERICA REINSURANCE CORPORATION 0.29% A-Admitted PARTNER REINSURANCE EUROPE LIMITED 1.37% A+Admitted PEMBROKE MANAGING AGENCY LTD - 4000 0.14% A+Admitted QBE UNDERWRITING LIMITED - 1036 0.06% A+Admitted QBE UNDERWRITING LIMITED - 1886 1.31% A+Admitted QBE UNDERWRITING LIMITED - 5555 0.46% A+Admitted QBE UNDERWRITING LIMITED - 386 0.15% A+Admitted R J KILN AND CO LTD - 1880 0.03% A+Admitted R J KILN AND CO LTD - 308 0.01% A+Admitted R J KILN AND CO LTD - 557 0.01% A+Admitted R J KILN AND CO LTD - 510 1.90% A+Admitted SCOR GLOBAL LIFE U.S. REINSURANCE COMPANY 0.06% A+Admitted SCOR REINSURANCE COMPANY 1.02% A+Admitted STARR MANAGING AGENTS LIMITED - 1919 2.84% A+Admitted STARR MANAGING AGENTS LIMITED - 2243 0.53% A+Admitted SWISS REINSURANCE AMERICA CORPORATION 0.20% AA-Admitted SWISS REINSURANCE COMPANY 3.35% AA-Admitted TALBOT UNDERWRITING LTD - 1183 2.57% A+Admitted TORUS SPECIALITY INSURANCE COMPANY 2.71% A-Admitted TRANSATLANTIC REINSURANCE COMPANY 0.34% A+Admitted TRAVELERS SYNDICATE MANAGEMENT - LLOYDS 0.33% A+Admitted TRAVELERS SYNDICATE MANAGEMENT LLOYDS (5000) 2.34% A+Admitted WHITTINGTON CAPITAL MANAGEMENT LTD - 1910 0.00% A+Admitted WHITTINGTON CAPITAL MANAGEMENT LTD 1967 1.54% A+Admitted WHITTINGTON CAPITAL MANAGEMENT LTD 2015 0.04% A+Admitted XL LONDON MARKET LIMITED - 1209 1.84% A+Admitted XL RE LATIN AMERICA LTD 0.00% AAdmitted ZURICH INSURANCE COMPANY 0.79% AA-Total 100.00%
Eventual ASPEN INSURANCE UK LIMITED 1.90% A
Eventual ASSICURAZIONI GENERALI S.P.A. 0.62% A-Eventual AXA CORPORATE SOLUTIONS ASSURANCE 7.54% A+
Eventual AXIS RE LIMITED 0.05% A+
Eventual AXIS REINSURANCE COMPANY 7.32% A+
Eventual GENERAL INSURANCE CORPORATION OF INDIA 12.99% A-
Eventual HDI-GERLING INDUSTRIE VERSICHERUNG AG 8.20% A+
Eventual HOUSTON CASUALTY COMPANY 10.73% AA
Eventual INFRASSURE LTD 2.18% A-Eventual KOREAN REINSURANCE COMPANY 0.45% A-
Eventual LIBERTY MUTUAL INSURANCE EUROPE LIMITED 2.56% A-
Eventual MAPFRE EMPRESAS, COMPAÑIA DE SEGUROS Y R 1.35% A-
Eventual MAPFRE RE CIA. DE RESSEGUROS S.A. 0.00% A-
Eventual MITSUI SUMITOMO INSURANCE COMPANY OF AME 1.12% A+Eventual MUNCHENER RUCKVERSICHERUNGS-GESELLSCHAFT 14.31% AA-
Eventual NATIONAL LIABILITY & FIRE INSURANCE COMPANY 9.36% AA+
Eventual NAVIGATORS INSURANCE COMPANY 2.07% A
Eventual SAMSUNG FIRE & MARINE INSURANCE CO., LTD 0.00% AA-
Eventual SCOR SWITZERLAND AG 0.14% A+
Eventual SIRIUS INTERNATIONAL INSURANCE CORPORATION 1.87% A-

Notes to the Financial Statements
60
Eventual SOMPO JAPAN INSURANCE INC. 0.29% A+
Eventual TOKIO MARINE & NICHIDO FIRE INSURANCE CO 1.12% AA-
Eventual TOKIO MARINE GLOBAL LTD. 2.10% AA-
Eventual W.R. BERKLEY INSURANCE (EUROPE) LIMITED 1.45% A+Eventual XL INSURANCE COMPANY LIMITED 0.53% A
Eventual ZURICH INSURANCE PUBLIC LIMITED COMPANY 9.75% AA-
Total 100.00%
Insured and Reinsured Limits
Companhia de Seguros Aliança do Brasil
Sep 30, 2013
Insurance Code of Lines Reinsurance Type Type of contract Priority Range
1 automatic Stop loss 150% 250%
1; 29; 69; 77; 80; 81; 82; 84; 91; 93; 98 automatic Excess Risk Damage 500 4,500
29, 61, 65, 68, 69, 77, 80, 81, 82, 84, 91, 93, 98 automatic Catastrophe 2,000 40,000
30, 61, 62, 63, 65, 68 automatic Catastrophe 10,000 90,000
Vida Seguradora S.A.
Sep 30, 2013
Insurance Code of Lines Reinsurance Type Type of contract Priority Range
1; 29; 69; 77; 80; 81; 82; 84; 91; 93; 98 automatic Excess Risk Damage 500 4,500
29, 69, 77, 80, 81, 82, 84, 91, 93, 98 automatic Catastrophe 2,000 40,000
MAPFRE Vida S.A.
Sep 30, 2013
Insurance Code of Lines Reinsurance Type Type of contract Priority Range
1; 29; 69; 77; 80; 81; 82; 84; 91; 93; 98 automatic Excess Risk Damage 500 4,500
29, 69, 77, 80, 81, 82, 84, 91, 93, 98 automatic Catastrophe 2,000 40,000
Aliança do Brasil Seguros
Sep 30, 2013
Insurance Code of Lines Reinsurance Type Type of contract Priority Range Currency
14, 16, 18, 41, 71, 96 automatic Excess Risk Damage 3,000 15,750 Real
11, 14, 16, 18, 30, 41, 62, 63, 67, 71, 96 automatic Catastrophe 10,000 90,000 Real
67 automatic Excess Risk Damage 3,000 1,000 Real
51 automatic Excess Risk Damage 1,500 2,000 Real
21, 22, 32, 38, 52, 54, 55, 56, 33 automatic Excess Risk Damage 1,000 49,000 Dollar
48 automatic Excess Risk Damage 500 2,000 Real
49 automatic Excess Risk Damage 100 400 Dollar
75, 76 automatic Excess Risk Damage 3,500 6,500 Real
MAPFRE Seguros Gerais S.A.
Sep 30, 2013
Insurance Code of Lines Reinsurance Type Type of contract Priority Range Currency
1 automatic Stop loss 100% 50% Real
1 automatic Stop loss 150% 250% Real
30, 61, 62, 63, 65, 68 automatic Catastrophe 10,000 90,000 Real
11, 14, 16, 18, 41, 71, 96 automatic Excess Risk Damage 3,000 15,750 Real
11, 14, 16, 18, 30, 41, 62, 63, 67, 71, 96 automatic Catastrophe 10,000 90,000 Real
1, 29, 69, 77, 80, 81, 82, 84, 91, 93, 98 automatic Excess Risk Damage 500 4,500 Real
35 automatic Excess Risk Damage 250 750 Dollar
67 automatic Excess Risk Damage 3,000 1,000 Real51 automatic Excess Risk Damage 1,500 2,000 Real
21, 22, 32, 38, 52, 54, 55, 56, 33 automatic Excess Risk Damage 1,000 49,000 Dollar
48 automatic Excess Risk Damage 500 2,000 Real
49 automatic Excess Risk Damage 100 400 Dollar
75, 76 automatic Excess Risk Damage 3,500 6,500 Real

Notes to the Financial Statements
61
MAPFRE Affinity Seguradora S.A.
Sep 30, 2013
Insurance Code of Lines Reinsurance Type Type of contract Priority Range
1, 29, 69, 77, 80, 81, 82, 84, 91, 93, 98 automatic Excess Risk Damage 500 4,500
29, 69, 77, 80, 81, 82, 84, 91, 93, 98 automatic Catastrophe 2,000 40,000
Liquidity risk exposure
Liquidity risk is limited by reconciling the cash flow of our investment portfolio with the corresponding liabilities. For this purpose, actuarial methods are used to estimate the liabilities arising from insurance contracts.
Liquidity risk management
Liquidity risk management involves a set of controls, principally in regard to the establishment of technical limits, with the positions taken and financial instruments used being under constant assessment. Each year the Executive Board approves minimum liquidity levels to be maintained, and the instruments that may be used to manage liquidity, on the basis of the assumptions contained in the Investment Policy, which is approved by the Board of Directors.
The management of liquidity risk is designed to control the different mismatched settlement terms of rights and obligations. Are monitored through assets and liabilities management (ALM), the entries and disbursements future, in order to maintain the liquidity risk at acceptable levels and, if necessary, point out in advance of any need redirection of investment.
Another important aspect of liquidity risk management is the matching of cash flows of assets and liabilities. For a significant proportion of life insurance contracts, the cash flow is linked both directly and indirectly with the assets underlying these contracts. For other insurance contracts, the aim is to select assets and securities with maturities compatible with the cash flow expected to be required for claims/benefits of these lines.
All revenue from holdings in which BB Seguridade has ownership interest comes from dividends and equity. Events that cause reductions in earnings of subsidiaries or suspensions in the payment of dividends may eventually affect the financial condition of the holding companies and their ability to meet the payment obligations.
Estimates used to determine the approximate amounts and periods for paying indemnities and benefits are revised monthly.
These estimates are by their nature subjective, and may have a direct impact on the capacity to maintain a balance between assets and liabilities.
Companhia de Seguros Aliança do Brasil
R$ thousand
Sep 30, 2013 Maturing in
up to 1 yearMaturing between
1 and 3 yearsMaturing more
than 3 yearsTotal
Cash and cash equivalents 786,079 -- -- 786,079
Fair value through income 49,485 621,577 222,496 893,558
Available for sale 136,912 367,818 198,952 703,682
Held to maturity 277,092 267,644 771,814 1,316,550
Insurance and reinsurance operations credits 1,300,492 544,257 -- 1,844,749
Other assets 177,622 98 -- 177,720
Total financial assets 2,727,682 1,801,394 1,193,262 5,722,338
Financial assets related to court and tax deposits, R$ 642,590 thousand, have not been classified in the above table due to the uncertain forecast of the timing of the corresponding court decisions.

Notes to the Financial Statements
62
R$ thousand
Dec 31, 2012 Maturing in
up to 1 yearMaturing between
1 and 3 yearsMaturing more
than 3 yearsTotal
Cash and cash equivalents 123,931 -- -- 123,931
Fair value through income 484,855 395,209 347,587 1,227,651
Available for sale 81,004 279,388 169,974 530,366
Held to maturity 190,149 411,075 214,703 815,927
Insurance and reinsurance operations credits 584,981 367,038 -- 952,019
Other assets 155,514 96 -- 155,610
Total financial assets 1,620,434 1,452,806 732,264 3,805,504
Financial assets related to court and tax deposits, R$ 623,007 thousand, have not been classified in the above table due to the uncertain forecast of the timing of the corresponding court decisions.
Vida Seguradora S.A.
R$ thousand
Sep 30, 2013 Maturing in
up to 1 yearMaturing between
1 and 3 yearsMaturing more
than 3 yearsTotal
Cash and cash equivalents 246,675 -- -- 246,675
Fair value through income -- 102,961 -- 102,961
Available for sale -- 16,469 -- 16,469
Held to maturity 81,331 132,077 -- 213,408
Insurance and reinsurance operations credits 54,192 -- -- 54,192
Other assets 5,566 217 -- 5,783
Total financial assets 387,764 251,724 -- 639,488
Financial assets related to court and tax deposits, R$ 9,651 thousand, have not been classified in the above table due to the uncertain forecast of the timing of the corresponding court decisions.
R$ thousand
Dec 31, 2012 Maturing in
up to 1 yearMaturing between
1 and 3 yearsMaturing more
than 3 yearsTotal
Cash and cash equivalents 783 -- -- 783
Fair value through income 355,719 42,202 -- 397,921
Held to maturity -- 198,441 -- 198,441
Insurance and reinsurance operations credits 28,876 -- -- 28,876
Other assets 10,891 -- -- 10,891
Total financial assets 396,269 240,643 -- 636,912
Financial assets related to court and tax deposits R$ 8,123 thousand, have not been classified in the above table due to the uncertain forecast of the timing of the corresponding court decisions.
MAPFRE Vida S.A.
R$ thousand
Sep 30, 2013 Maturing in
up to 1 yearMaturing between
1 and 3 yearsMaturing more
than 3 yearsTotal
Cash and cash equivalents 131,938 -- -- 131,938
Fair value through income -- 82,657 -- 82,657
Available for sale -- 33,174 -- 33,174
Held to maturity 49,134 196,258 -- 245,392
Insurance and reinsurance operations credits 111,357 -- -- 111,357
Other assets 43,893 889 -- 44,782
Total financial assets 336,322 312,978 -- 649,300
Financial assets related to court and tax deposits, R$ 339 thousand, have not been classified in the above table due to the uncertain forecast of the timing of the corresponding court decisions.

Notes to the Financial Statements
63
R$ thousand
Dec 31, 2012 Maturing in
up to 1 yearMaturing between
1 and 3 yearsMaturing more
than 3 yearsTotal
Cash and cash equivalents 24,946 -- -- 24,946
Fair value through income 206,437 19,567 -- 226,004
Available for sale -- -- -- --
Held to maturity 17,957 251,341 -- 269,298
Insurance and reinsurance operations credits 141,742 -- -- 141,742
Other assets 35,253 487 -- 35,740
Total financial assets 426,335 271,395 -- 697,730
Financial assets related to court and tax deposits, R$ 358 thousand, have not been classified in the above table due to the uncertain forecast of the timing of the corresponding court decisions.
Brasilveículos Companhia de Seguros
R$ thousand
Sep 30, 2013 Maturing in
up to 1 yearMaturing between
1 and 3 yearsMaturing more
than 3 yearsTotal
Cash and cash equivalents 255,181 -- -- 255,181
Fair value through income 74,046 173,101 134,422 381,569
Available for sale 31,825 99,319 56,630 187,774
Held to maturity -- -- 404,406 404,406
Insurance and reinsurance operations credits 583,252 5,963 -- 589,215
Other assets 188,090 -- -- 188,090
Total financial assets 1,132,394 278,383 595,458 2,006,235
Financial assets related to court and tax deposits, R$ 457,649 thousand, have not been classified in the above table due to the uncertain forecast of the timing of the corresponding court decisions.
R$ thousand
Dec 31, 2012 Maturing in
up to 1 yearMaturing between
1 and 3 yearsMaturing more
than 3 yearsTotal
Cash and cash equivalents 2,062 -- -- 2,062
Fair value through income 231,069 -- -- 231,069
Available for sale 106,972 33,710 -- 140,682
Insurance and reinsurance operations credits 9,038 -- -- 9,038
Other assets 78,035 -- -- 78,035
Total financial assets 427,176 33,710 -- 460,886
Financial assets related to court and tax deposits R$ 412,471 thousand, have not been classified in the above table due to the uncertain forecast of the timing of the corresponding court decisions.
Aliança do Brasil Seguros S.A.
R$ thousand
Sep 30, 2013 Maturing in
up to 1 yearMaturing between
1 and 3 yearsMaturing more
than 3 yearsTotal
Cash and cash equivalents 176,022 -- -- 176,022
Fair value through income 28,519 45,403 -- 73,922
Available for sale 11,751 50,312 27,459 89,522
Held to maturity 16,204 23,634 91,611 131,449
Insurance and reinsurance operations credits 292,176 -- -- 292,176
Other assets 28,875 -- -- 28,875
Total financial assets 553,547 119,349 119,070 791,966
Financial assets related to court and tax deposits, R$ 17,798 thousand, have not been classified in the above table due to the uncertain forecast of the timing of the corresponding court decisions.

Notes to the Financial Statements
64
R$ thousand
Dec 31, 2012 Maturing in
up to 1 yearMaturing between
1 and 3 yearsMaturing more
than 3 yearsTotal
Cash and cash equivalents 39,214 -- -- 39,214
Fair value through income 99,331 41,638 67,095 208,064
Available for sale 21,321 5,154 50,078 76,553
Held to maturity 32,794 39,191 -- 71,985
Insurance and reinsurance operations credits 187,769 -- -- 187,769
Other assets 9,026 -- -- 9,026
Total financial assets 389,455 85,983 117,173 592,611
Financial assets related to court and tax deposits, R$ 18,496 thousand, have not been classified in the above table due to the uncertain forecast of the timing of the corresponding court decisions.
MAPFRE Seguros Gerais S.A.
R$ thousand
Sep 30, 2013 Maturing in
up to 1 yearMaturing between
1 and 3 yearsMaturing more
than 3 yearsTotal
Cash and cash equivalents 748,988 -- -- 748,988
Fair value through income 92,159 190,230 140,637 423,026
Available for sale -- -- 97,766 97,766
Held to maturity 176,207 40,391 596,253 812,851
Insurance and reinsurance operations credits 2,067,888 106,789 -- 2,174,677
Other assets 473,560 13,494 -- 487,054
Total financial assets 3,558,802 350,904 834,656 4,744,362
Financial assets related to court and tax deposits, R$ 10,369 thousand, have not been classified in the above table due to the uncertain forecast of the timing of the corresponding court decisions.
R$ thousand
Dec 31, 2012 Maturing in
up to 1 yearMaturing between
1 and 3 yearsMaturing more
than 3 yearsTotal
Cash and cash equivalents 42,623 -- -- 42,623
Fair value through income 1,913,047 -- -- 1,913,047
Available for sale -- -- -- --
Held to maturity 25,439 663,802 -- 689,241
Insurance and reinsurance operations credits 2,168,762 129,656 -- 2,298,418
Other assets 296,097 688 -- 296,785
Total financial assets 4,445,968 794,146 -- 5,240,114
Financial assets related to court and tax deposits, R$ 8,970 thousand have not been classified in the above table due to the uncertain forecast of the timing of the corresponding court decisions.
MAPFRE Affinity Seguradora S.A.
R$ thousand
Sep 30, 2013 Maturing in
up to 1 yearMaturing between
1 and 3 yearsMaturing more
than 3 yearsTotal
Cash and cash equivalents 2,488 -- -- 2,488
Fair value through income 113,596 27,579 38,972 180,147
Available for sale -- -- 30,798 30,798
Held to maturity 49,629 6,098 84,631 140,358
Insurance and reinsurance operations credits 168,508 4,225 -- 172,733
Other assets 165,038 268 -- 165,306
Total financial assets 499,259 38,170 154,401 691,830
Financial assets related to court and tax deposits, R$ 105,472 thousand, have not been classified in the above table due to the uncertain forecast of the timing of the corresponding court decisions.

Notes to the Financial Statements
65
R$ thousand
Dec 31, 2012 Maturing in
up to 1 yearMaturing between
1 and 3 yearsMaturing more
than 3 yearsTotal
Cash and cash equivalents 7,201 -- -- 7,201
Fair value through income 198,460 17,329 -- 215,789
Available for sale -- -- -- --
Held to maturity 1,496 130,340 -- 131,836
Insurance and reinsurance operations credits 199,467 4,225 -- 203,692
Other assets 126,196 760 -- 126,956
Total financial assets 532,820 152,654 -- 685,474
Financial assets related to court and tax deposits, R$ 84,131 thousand, have not been classified in the above table due to the uncertain forecast of the timing of the corresponding court decisions.
Market Risk Management
Companhia de Seguros Aliança do Brasil, Brasilveículos Companhia de Seguros and Aliança do Brasil Seguros S.A manage market risk exposure prudently. Market risk is calculated by the Banco do Brasil Risk Department on the basis of stress scenarios, past experience and the Value at Risk (VaR) methodology. To the Companies Vida Seguradora S.A., MAPFRE Vida S.A., MAPFRE Seguros Gerais S.A. and MAPFRE Affinity Seguradora S.A., the VaR calculating is made by MAPFRE DTVM Superintendência de Risco eCompliance team. The Financial Department of these Companies, BB-DTVM and MAPFRE DTVM, monitor the VaR result each day and make regular reports to meetings of the Finance Committee, so as to identify reallocation needs. The method adopted for calculating VaR uses the past 150-day series, with a 95% confidence level and a time horizon of 1 business day.
Financial investments assets are subject to active management with an approach that strikes a balance between quality, diversification, liquidity and return on investment. The main purpose of the investment process is to perfect the relationship between rate, risk and return, aligning investments with the cash flow of liabilities. For this purpose strategies are used that take into consideration acceptable risk levels, terms, profitability, sensitivity, liquidity and assets concentration limits by issuer and credit risk.
In the case of Companhia de Seguros Aliança do Brasil, taking into account the effect of diversification between risk factors, the possibility of loss estimated by the VaR model for a 1-day interval is R$ 11,530 thousand. In the year under analysis, the positions that contributed most in terms of risk were related to paper indexed to price indices.
At Aliança do Brasil Seguros S.A, for its part, taking into account the effect of diversification between risk factors, the possibility of loss estimated by the VaR model for a 1-day interval is R$ 1,140 thousand. In the year under analysis, the positions that contributed most in terms of risk were related to paper indexed to price indices and pre-fixed interest rates.
In case of Brasilveículos Companhia de Seguros, taking into account the effect of diversification between risk factors, the possibility of loss estimated by the VaR model for a 1-day interval is R$ 5,087 thousand. In the year under analysis, the positions that contributed most in terms of risk were related to paper indexed to price indices and pre-fixed interest rates.
For MAPFRE Vida S.A., taking into account the effect of diversification between risk factors, the possibility of loss estimated by the VaR model for a 1-day interval is R$ 1,255 thousand. In the year under analysis, the positions that contributed most in terms of risk were related to paper indexed to pre-fixed interest rates.
In case of Vida Seguradora S.A., taking into account the effect of diversification between risk factors, the possibility of loss estimated by the VaR model for a 1-day interval is R$ 1,399 thousand. In the year under analysis, the positions that contributed most in terms of risk were related to paper indexed to pre-fixed interest rates.
At MAPFRE Seguros Gerais S.A., taking into account the effect of diversification between risk factors, the possibility of loss estimated by the VaR model for a 1-day interval is R$ 4,086 thousand. In the year under analysis, the positions that contributed most in terms of risk were related to paper indexed to price indices and pre-fixed interest rates.
MAPFRE Affinity Seguradora S.A., taking into account the effect of diversification between risk factors, the possibility of loss estimated by the VaR model for a 1-day interval is R$ 779 thousand. In the year under analysis, the positions that contributed most in terms of risk were related to paper indexed to pre-fixed interest rates.
It should be stressed that the Banco do Brasil Insurance Group and MAPFRE adopt strict control policies and strategies approved in advance by the Finance Committee and Management, which make it possible to reduce market risk exposure. Operations are controlled with the use of Stress Testing and Value At Risk tools

Notes to the Financial Statements
66
and subsequently compared with the Stop Loss risk control policy adopted. TheBB Seguridade monitors the VaR of the investment portfolio on a daily basis, using information supplied by MAPFRE DTVM and BB DTVM. Portfolio risk is submitted to meetings of the Finance Committee, in order to identify any need for reallocating portfolio assets.
Sensitivity to interest rate
In this sensitivity analysis, the following risk factors are taken into account: (i) interest rates, and (ii) securities indexed to inflation indices (INPC, IGP-M, and IPCA), due to their relevance in the Group’s asset and liability positions.
The quantitative parameters used in the sensitivity analysis (100 basis points for interest rate and inflation coupons) were defined based on an analysis of recent historical variations of interest rates and the assumption of maintenance of inflation expectations curves, which affect these securities as much as the interest rates.
Historically, companies do not redeem assets in advance, and such assets are held to maturity. Accordingly, securities placed in this category were excluded from the base for sensitivity analysis, as Management considers that it is not sensitive to interest rate variations in the case of these securities, given its policy of holding them to maturity.
Companhia de Seguros Aliança do Brasil
Sep 30, 2013
Out of the total of R$ 3,517,014 thousand in financial assets, including repo transactions, R$ 1,316,550 thousand derived from the sensitivity analysis base because they were categorized as “held to maturity,” R$ 106,828 thousand were related to DPVAT positions. Therefore, the sensitivity analysis was carried out for a financial volume of R$ 2,093,636 thousand.
In order to develop the sensitivity analysis, the financial assets existing as of the balance sheet base date were taken into account.
R$ thousand
Risk Factor
Interest Rate
Sep 30, 2013
Impact on Shareholders’ Equity
Rate Increase (19,111)
Rate Reduction 19,659
Parameters:
a) 100 basis points for interest rate structures existing as of September 30, 2013.
b) 100 basis points for coupon rate structures existing as of September 30, 2013.
Dec 31, 2012
Out of the total of R$ 2,573,944 thousand in financial assets, including repo transactions, R$ 815,927 thousand derived from the sensitivity analysis base because they were categorized as “held to maturity,” R$ 80,847 thousand and R$ 22 million were related to DPVAT positions and non-exclusive funds, respectively. Therefore, the sensitivity analysis was carried out for a financial volume of R$ 1,655,170 thousand, of which R$ 986,889 thousand are pre- and post-fixed federal government securities, as well as securities indexed to price indexes. Considering the total amount analyzed, pre-fixed securities (NTN-F and LTN) represent 37.5%, while price indexes (IPCA) represent 12.1%, and post-fixed, 10.0%, totaling 59.6% of government securities out of the total analyzed. Based on the assumptions adopted, it became clear that income is negatively affected whenever interest rates increase, bearing in mind that most of the Group’s portfolio is based on pre-fixed assets and price indexes (and these were considered pre-fixed assets in the sensitivity analysis). Nevertheless, a decrease in interest rates leads to a positive income considering the concentration in pre-fixed rates.
In order to develop the sensitivity analysis, the financial assets existing as of the balance sheet base date were taken into account.
R$ thousand
Risk Factor
Interest Rate
Dec 31, 2012
Impact on Shareholders’ Equity
Rate Increase (17,413)
Rate Reduction 18,519
Parameters:
a) 100 basis points for interest rate structures existing as of December 31, 2012.
b) 100 basis points for coupon rate structures existing as of December 31, 2012.

Notes to the Financial Statements
67
Vida Seguradora S.A.
Sep 30, 2013
Out of a total of R$ 577,688 thousand in financial assets, including repo transactions, R$ 216,594 thousand derived from the sensitivity analysis base because they were classified as “held to maturity,” R$ 61,898 thousand were related to DPVAT positions. Therefore, the sensitivity analysis was carried out for a financial volume of R$ 299,196 thousand.
In order to develop the sensitivity analysis, the financial assets existing as of the balance sheet base date were taken into account.
R$ thousand
Risk Factor
Interest Rate
Sep 30, 2013
Impact on Shareholders’ Equity
Rate Increase (516)
Rate Reduction 626
Parameters:
a) 100 basis points for interest rate structures existing as of September 30, 2013.
b) 100 basis points for coupon rate structures existing as of September 30, 2013.
Dec 31, 2012
Out of a total of R$ 597,377 thousand in financial assets, including repo transactions, R$ 198,441 thousand derived from the sensitivity analysis base because they were classified as “held to maturity,” R$ 48,302 thousand were related to DPVAT positions and R$ 1,016 thousand derived from investments in non-exclusive funds. Therefore, the sensitivity analysis was carried out for a financial volume of R$ 349,618 thousand.
In order to develop the sensitivity analysis, the financial assets existing as of the balance sheet base date were taken into account.
R$ thousand
Risk Factor
Interest Rate
Dec 31, 2012
Impact on Shareholders’ Equity
Rate Increase (260)
Rate Reduction 290
Parameters:
a) 100 basis points for interest rate structures existing as of December 31, 2012.
b) 100 basis points for coupon rate structures existing as of December 31, 2012.
MAPFRE Vida S.A.
Sep 30, 2013
Out of a total of R$ 487,243 thousand in financial assets, including repo transactions, R$ 247,679 thousand derived from the sensitivity analysis base because they were classified as “held to maturity,” R$ 44,777 thousand were related to DPVAT positions and R$ 112 thousand derived from investments in non-exclusive funds. Therefore, the sensitivity analysis was carried out for a financial volume of R$ 194,675 thousand.
In order to develop the sensitivity analysis, the financial assets existing as of the balance sheet base date were taken into account:
R$ thousand
Risk Factor
Interest Rate
Sep 30, 2013
Impact on Shareholders’ Equity
Rate Increase (222)
Rate Reduction 262
Parameters:
a) 100 basis points for interest rate structures existing as of September 30, 2013.
b) 100 basis points for coupon rate structures existing as of September 30, 2013.
Dec 31, 2012
Out of the total of R$ 449,334 thousand in financial assets, including repo transactions, R$ 269,298 thousand derived from the sensitivity analysis base because they were classified as “held to maturity,” and investments related to DPVAT Agreement. Therefore, the sensitivity analysis was carried out for a financial volume of R$ 185,230 thousand.

Notes to the Financial Statements
68
In order to develop the sensitivity analysis, the financial assets existing as of the balance sheet base date were taken into account:
R$ thousand
Risk Factor
Interest Rate
Dec 31, 2012
Impact on Shareholders’ Equity
Rate Increase (144)
Rate Reduction 154
Parameters:
a) 100 basis points for interest rate structures existing as of December 31, 2012.
b) 100 basis points for coupon rate structures existing as of December 31, 2012.
Brasilveículos Companhia de Seguros
Sep 30, 2013
Out of a total of R$ 1,228,577 thousand in financial assets, including repo transactions, R$ 404,406 thousand derived from the sensitivity analysis base because they were classified as “held to maturity,” R$ 64,755 thousand were related to DPVAT positions. Therefore, the sensitivity analysis was carried out for a financial volume of R$ 759,416 thousand.
In order to develop the sensitivity analysis, the financial assets existing as of the balance sheet base date were taken into account:
R$ thousand
Risk Factor
Interest Rate
Sep 30, 2013
Impact on Shareholders’ Equity
Rate Increase (7,477)
Rate Reduction 7,772
Parameters:
a) 100 basis points for interest rate structures existing as of September 30, 2013.
b) 100 basis points for coupon rate structures existing as of September 30, 2013.
Dec 31, 2012
Of the total assets of R$ 371,826 thousand, are considered assets categorized as “Financial assets at fair value through income” and “Financial assets available for sale”, which are marked to market in accordance with the pricing methodologies and risk calculation used by Banco do Brasil, less R$ 54,867 thousand regarding investments related to DPVAT Agreement. Therefore, the sensitivity analysis was carried out for a financial volume of R$ 316,959 thousand.
The quantitative parameters used in the sensitivity analysis (100 basis points for interest rate and inflation coupons) were defined based on an analysis of recent historical variations for interest rates and the assumption of maintenance of inflation expectations curves, which affect these securities as much as the interest rates.
Considering the assumptions adopted, the amounts calculated are:
R$ thousand
Risk Factor
Interest Rate
Dec 31, 2012
Impact on Shareholders’ Equity
Rate Increase (2,599)
Rate Reduction 2,777
Parameters:
a) 100 basis points for interest rate structures existing as of December 31, 2012. b) 100 basis points for coupon rate structures existing as of December 31, 2012.
Aliança do Brasil Seguros S.A.
Sep 30, 2013
Out of a total of R$ 441,174 thousand in financial assets, including repo transactions, R$ 131,449 thousand derived from the sensitivity analysis base because they were classified as “held to maturity,” R$ 38,138 thousand were related to DPVAT positions. Therefore, the sensitivity analysis was carried out for a financial volume of R$ 271,587 thousand.
In order to develop the sensitivity analysis, the financial assets existing as of the balance sheet base date were taken into account.

Notes to the Financial Statements
69
R$ thousand
Risk Factor
Interest Rate
Sep 30, 2013
Impact on Shareholders’ Equity
Rate Increase (1,102)
Rate Reduction 1,172
Parameters:
a) 100 basis points for interest rate structures existing as of September 30, 2013
b) 100 basis points for coupon rate structures existing as of September 30, 2013.
Dec 31, 2012
Out of the total of R$ 356,602 thousand in financial assets, including repo transactions, R$ 71,986 thousand derived from the sensitivity analysis base because they were classified as “held to maturity,” as well as R$ 34,091 thousand related to investments in DPVAT and R$ 11,691 thousand related to non-exclusive funds. Therefore, the sensitivity analysis was carried out for a financial volume of R$ 238,834 thousand, so that R$ 152,574 thousand are pre- and post-fixed federal government securities, as well as securities indexed to price indexes. As shown in the table below, Shareholders’ Equity is negatively affected whenever interest rates increase, which can be explained basically by the exposure to securities with payment linked to price indexes and pre-fixed rates.
In order to develop the sensitivity analysis, the financial assets existing as of the balance sheet base date were taken into account.
R$ thousand
Risk Factor
Interest Rate
Dec 31, 2012
Impact on Shareholders’ Equity
Rate Increase (2,279)
Rate Reduction 2,419
Parameters:
a) 100 basis points for interest rate structures existing as of December 31, 2012.
b) 100 basis points for coupon rate structures existing as of December 31, 2012.
MAPFRE Seguros Gerais S.A.
Sep, 2013
Of the total amount of R$ 2,006,992 thousand in financial assets, including repo transactions, R$ 812,737 thousand derived from the base of the sensitivity analysis since they are classified as “held to maturity” and R$ 110,751 thousand refer to investments relating to the DPVAT Agreement and R$ 692 thousand refer to investment in others applications. Therefore, the sensitivity analysis was carried out for the financial amount of R$ 1,082,812 thousand.
R$ thousand
Risk Factor
Interest Rate
Sep 30, 2013
Impact on Shareholders’ Equity
Rate Increase (1,836)
Rate Reduction 2,094
Parameters:
a) 100 basis points for interest rate structures existing as of September 30, 2013. b) 100 basis points for coupon rate structures existing as of September 30, 2013.
Dec 31, 2012
Of the total amount of R$ 2,455,669 thousand in financial assets, including repo transactions, R$ 689,241 million derived from the base of the sensitivity analysis since they are classified as “held to maturity”, R$ 84,607 thousand refer to the DPVAT Agreement and R$ 1,805 thousand refer to investment in non-exclusive fund. Therefore, the sensitivity analysis was carried out for the financial amount of R$ 1,680,016 thousand.
R$ thousand
Risk Factor
Interest Rate
Dec 31, 2012
Impact on Shareholders’ Equity
Rate Increase (16,945)
Rate Reduction 18,454
Parameters:
a) 100 basis points for interest rate structures existing as of December 31, 2012. b) 100 basis points for coupon rate structures existing as of December 31, 2012.

Notes to the Financial Statements
70
MAPFRE Affinity Seguradora S.A.
Sep 30, 2013
Of the total amount of R$ 351,353 thousand in financial assets, including repo transactions, R$ 140,423 thousand derived from the base of the sensitivity analysis since they are classified as “held to maturity” and R$ 62,726 thousand refer to investments relating to the DPVAT Agreement. Therefore, the sensitivity analysis was carried out for the financial amount of R$ 148,204 thousand.
To prepare the sensitivity analysis, financial assets existing as of the date of the closing of the financial statements were taken into consideration.
R$ thousand
Risk Factor
Interest Rate
Sep 30, 2013
Impact on Shareholders’ Equity
Rate Increase (200)
Rate Reduction 233
Parameters:
a) 100 basis points for interest rate structures existing as of September 30, 2013. b) 100 basis points for coupon rate structures existing as of September 30,2013
Dec 31, 2012
Of the total amount of R$ 369,713 thousand in financial assets, including repo transactions, R$ 131,837 thousand derived from the base of the sensitivity analysis since they are classified as “held to maturity”, R$ 55,415 thousand refer to investments relating to the DPVAT Agreement and R$ 22,089 thousand refer to investment in non-exclusive fund. Therefore, the sensitivity analysis was carried out for the financial amount of R$ 160,372 thousand.
To prepare the sensitivity analysis, financial assets existing as of the date of the closing of the financial statements were taken into consideration.
R$ thousand
Risk Factor
Interest Rate
Dec 31, 2012
Impact on Shareholders’ Equity
Rate Increase (81)
Rate Reduction 87
Parameters:
a) 100 basis points for interest rate structures existing as of December 31, 2012. b) 100 basis points for coupon rate structures existing as of December 31, 2012.
Operational risk management – BB MAPFRE SH1 and MAPFRE BB SH2
The main responsibility for the development and implementation of controls to address operational risks is assigned to senior management within each business unit. The responsibility is supported by the development of general standards for operational risks management in the following areas:
• requirements for proper segregation of duties, including independent authorization for transactions; • requirements for transactions reconciliation and monitoring; • compliance with legal and regulatory requirements;• documentation of controls and procedures; • requirements for periodic assessment of existing operational risks and adequacy of controls and
procedures to address identified risks; • requirements to report operational losses and corrective actions proposed; • preparation of contingency plans; • professional development and training; • ethical and business standards; and • risk mitigation, including insurance, when effective.
Within such scenario, Grupo Segurador Banco do Brasil and MAPFRE have mechanisms to assess their internal compliance system in order to avoid any losses caused by breach, violation or non-compliance with the internal instructions and rules.
The internal control environment also contributes for operational risk management whereby the corporate risk matrix is updated regularly based on self-assessments of risks and controls, internal and external audits, control review system tests and improvements implemented in several areas. Additionally, a program of
Notes to the Financial Statements
71
periodic analyses under the responsibility of Internal Audit is approved annually by the Board of Directors jointly with the Audit Committee. The analyses of the Internal Audit results are submitted to the Audit Committee and the Board of Directors.
Limitations of sensitivity analysis
It is worth mentioning that for Companhia de Seguros Aliança do Brasil, Aliança do Brasil Seguros S.A. and MAPFRE Seguros Gerais S.A., the sensitivity analyses does not take into account the fact that assets and liabilities are highly managed and controlled. Additionally, the financial position may vary upon the occurrence of any variation in the market. As investment markets move on through different levels, management actions may include selling investments and changing portfolio allocation, among other protective measures.
Other limitations on sensitivity analyses include the use of hypothetical market variations to demonstrate a potential risk that only represents the Group's view of possible changes in the market in the near future, which cannot be forecast with any certainty, and the assumption that all interest rates vary on an identical basis.
Capital management – BB MAPFRE SH1 and MAPFRE BB SH2
The main purpose of the Group in relation to capital management is to maintain sufficient capital levels to meet the regulatory requirements established by CNSP and SUSEP, and to optimize shareholders return.
During this year and in prior years, the Group did not report capital level below the minimum regulatory requirements.
The Minimum Required Capital for the Group operation is composed of basis capital (a fixed amount of capital) and additional capital (variable amount) which, together, aim to protect the risks inherent to the operations.
The Group calculate the Minimum Required Capital (MRC) in accordance with the regulations issued by CNSP and SUSEP, as per the tables below:

Notes to the Financial Statements
72
Companhia de Seguros Aliança do Brasil
R$ thousand
Sep 30, 2013
Stockholders’ Equity 1,338,506
Equity in associated and subsidiary companies (5,921)
Prepaid expenses not related to reinsurance (3,744)
Intangible Assets (30,975)
Works of art (5)
Adjusted Stockholders’ Equity (a) 1,297,861
Minimum required stockholders’ equity - per premium 929,488
Minimum required stockholders’ equity - per claim 275,448
Solvency Margin (b) 929,488
Basis Capital – BC 15,000
Risk Capital (Underwriting, Credit and Operational) (RC) 982,812
Underwriting Risk Capital 875,874
Credit Risk Capital 164,713
Correlation between Underwriting and Credit Capitals (71,797)
Operational Risk Capital 14,022 Minimum Required Capital - (c) 982,812
Capital Adequacy (d = a - c) 315,049
Capital Adequacy (d/c) 32.06%
R$ thousand
Dec 31, 2012
Stockholders’ Equity 974,565
Equity in associated and subsidiary companies (4,067)
Prepaid Expenses not related to reinsurance (1,191)
Intangible Assets (14,306)
Works of art (5)
Adjusted Stockholders’ Equity (a) 954,996
Minimum required stockholders’ equity - per premium 742,993
Minimum required stockholders’ equity - per claim 242,601
Solvency Margin (b) 742,993
Basis Capital – BC 15,000
Risk Capital (Underwriting, Credit and Operational) (RC) 760,927
Additional Underwriting Capital 691,637
Additional Credit Capital 123,478
Correlation between Additional Capitals (54,188)
Minimum Required Capital (c) 775,927
Capital Requirement (d) - higher among (b) and (c) 775,927
Capital Adequacy (d = a - c) 179,069
Capital Adequacy (d/c) 23.08%

Notes to the Financial Statements
73
Vida Seguradora S.A.
R$ thousand
Sep 30, 2013
Stockholders’ Equity 421,153
Equity in associated and subsidiary companies (456)
Prepaid expenses not related to reinsurance (6)
Deferred Tax Assets from Tax Losses (4,801)
Intangible Assets (765)
Works of art (7)
Adjusted Stockholders’ Equity (a) 415,118
Minimum required stockholders’ equity - per premium 32,602 Minimum required stockholders’ equity - per claim 32,362 Solvency Margin (b) 32,602
Basis Capital – BC 15,000
Risk Capital (Underwriting, Credit and Operational) (RC) 47,616
Underwriting Risk Capital 40,480
Credit Risk Capital 10,349
Correlation between Underwriting and Credit Capitals (4,303)
Operational Risk Capital 1,090 Minimum Required Capital (c) 47,616
Capital Adequacy (d = a – c) 367,502
Capital Adequacy (d/c) 771.80%
R$ thousand
Dec 31, 2012
Stockholders’ Equity 421,331
Equity in associated and subsidiary companies (401)
Prepaid expenses not related to reinsurance (27)
Deferred Tax Assets from Tax Losses (13,167)
Intangible Assets --
Works of art (7)
Adjusted Stockholders’ Equity (a) 407,729
0,2 times the revenues of premium issued in the last 12 months 48,331
0,33 times the annual average of the revenues of retained losses in the last 36 months 30,261
Solvency Margin (b) 48,331
Basis Capital – BC 15,000
Total Additional Capital (Underwriting and Credit) 34,757
Additional Underwriting Capital 24,112
Additional Credit Capital 15,728
Correlation between Additional Capitals (5,084)
Basis Capital + Additional Capital (c) 49,757
Minimum Required Capital (d) (higher among (b) and (c)) 49,757
Capital Adequacy (e = a – d) 357,972
Capital Adequacy (e/d) 719.44%

Notes to the Financial Statements
74
MAPFRE Vida S.A.
R$ thousand
Sep 30, 2013
Stockholders’ Equity 184,837
Equity in associated and subsidiary companies (186)
Prepaid expenses not related to reinsurance (64)
Deferred Tax Assets from Tax Losses (12,335)
Intangible Assets (10,826)Works of art (3)Adjusted Stockholders’ Equity (a) 161,423
Last 12 months (a1) 91,398
Retained last 36 months (a2) 98,449 Solvency Margin (b) 98,449 Basis Capital – BC 15,000
Risk Capital – RC (Underwriting, Credit and Operational) 146,351
Underwriting Risk Capital 126,343
Credit Risk Capital 31,953
Correlation between Underwriting and Credit Capitals (13,311)
Operational Risk Capital 1,366 Minimum Required Capital (c) 146,351
Capital Adequacy (d = a – c) 15,072
Capital Adequacy (d/c) 10.30%
R$ thousand
Dec 31, 2012
Stockholders’ Equity 209,574
Equity in associated and subsidiary companies (205)
Prepaid expenses not related to reinsurance (60)
Intangible Assets (10,131)
Works of art (3)
Adjusted Stockholders’ Equity (a) 199,175
Last 12 months (a1) 94,450
Retained last 36 months (a2) 94,041
Solvency Margin (b) 94,450
Basis Capital – BC 15,000
Total Additional Capital (Underwriting and Credit) - AC 140,740
Additional Underwriting Capital - AUC 120,775
Additional Credit Capital - ACC 33,781
Correlation between Additional Capitals (13,816)
Basis Capital + Additional Capital (c) 155,740
Capital Adequacy (d = a – c) 43,435
Capital Adequacy (d/c) 27.89%

Notes to the Financial Statements
75
Brasilveículos Companhia de Seguros
R$ thousand
Sep 30, 2013
Stockholders’ Equity 497,763
Equity in associated and subsidiary companies (266)
Prepaid expenses not related to reinsurance (1,660)
Deferred Tax Assets from tax losses (4,887)
Deferred Assets (19,744)
Intangible Assets --
Works of art (1)
Adjusted Stockholders’ Equity (a) 471,205
0.2 times the net revenues of premium issued in the last 12 months (a1) 388,350
0.33 times the annual average of total retained claims the last 36 months (a.2) 351,625
Solvency Margin (b) (higher among (b1) and (b2)) 388,350
Basis Capital – BC 15,000
Risk Capital – RC (Underwriting, Credit and Operational) 423,961
Underwriting Risk Capital 380,298
Credit Risk Capital 63,161
Correlation between Underwriting and Credit Capitals (27,964)
Operational Risk Capital 8,466
Minimum Capital Required (c) 423,961
Capital Adequacy (d = a – c) 47,244
Capital Adequacy (d/c) 11.14%
R$ thousand
Dec 31, 2012
Stockholders’ Equity 469,608
Equity in associated and subsidiary companies (275)
Prepaid Expenses not related to reinsurance (2,242)
Deferred Tax Assets from Tax Losses (18,121)
Deferred Assets (127)
Intangible Assets (6,331)
Works of art (1)
Adjusted Stockholders’ Equity (a) 442,511
0.2 times the net revenues of premium issued in the last 12 months (a1) 2,798
0.2 times the revenues of retained losses in the last 36 months (a2) 282,786
Solvency Margin (b) (higher among (b1) and (b2)) 282,786
Basis Capital – BC 15,000
Total Additional Capital (Underwriting and Credit) - AC 91,237
Additional Underwriting Capital - AUC 76,462
Additional Credit Capital - ACC 24,534
Correlation between Additional Capitals (9,759)
Basis Capital + Additional Capital (c) 106,237
Minimum Capital Required (d) (higher among (b) and (c)) 282,786
Capital Adequacy (e = a – d) 159,725
Capital Adequacy (e/d) 56.48%
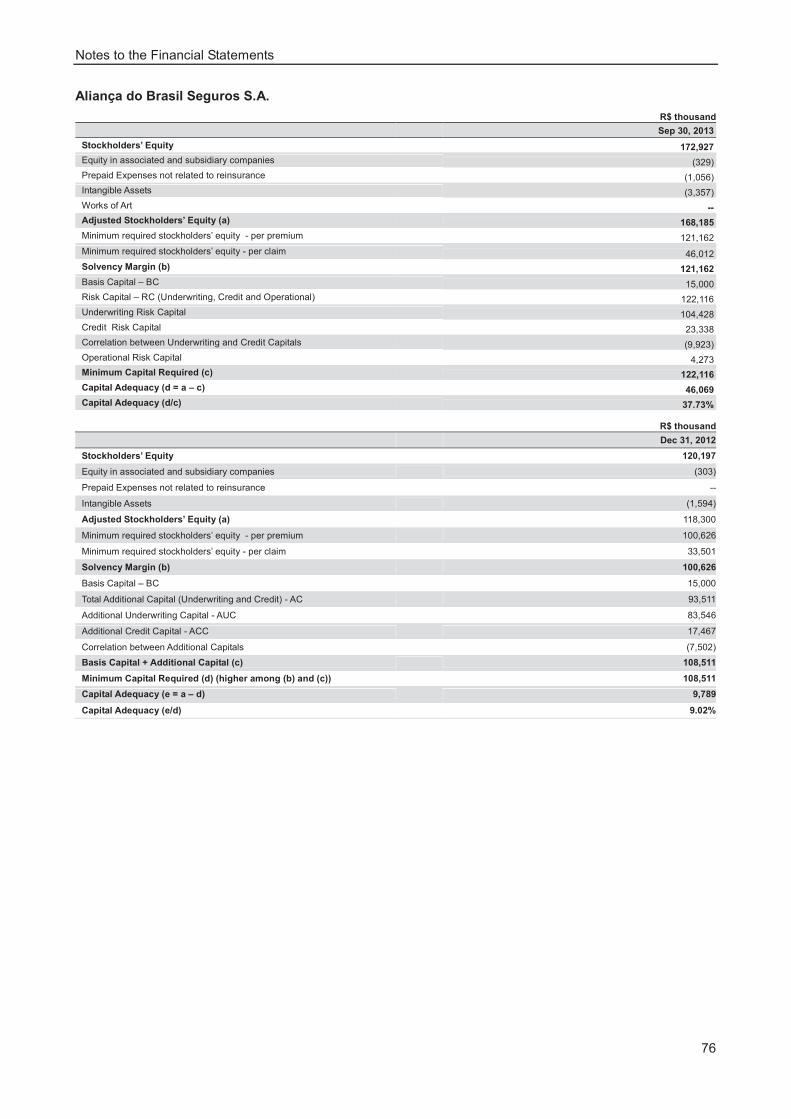
Notes to the Financial Statements
76
Aliança do Brasil Seguros S.A.
R$ thousand
Sep 30, 2013
Stockholders’ Equity 172,927
Equity in associated and subsidiary companies (329)
Prepaid Expenses not related to reinsurance (1,056)
Intangible Assets (3,357)
Works of Art --
Adjusted Stockholders’ Equity (a) 168,185
Minimum required stockholders’ equity - per premium 121,162
Minimum required stockholders’ equity - per claim 46,012 Solvency Margin (b) 121,162
Basis Capital – BC 15,000 Risk Capital – RC (Underwriting, Credit and Operational) 122,116
Underwriting Risk Capital 104,428
Credit Risk Capital 23,338
Correlation between Underwriting and Credit Capitals (9,923)
Operational Risk Capital 4,273 Minimum Capital Required (c) 122,116
Capital Adequacy (d = a – c) 46,069
Capital Adequacy (d/c) 37.73%
R$ thousand
Dec 31, 2012
Stockholders’ Equity 120,197
Equity in associated and subsidiary companies (303)
Prepaid Expenses not related to reinsurance --
Intangible Assets (1,594)
Adjusted Stockholders’ Equity (a) 118,300
Minimum required stockholders’ equity - per premium 100,626
Minimum required stockholders’ equity - per claim 33,501
Solvency Margin (b) 100,626
Basis Capital – BC 15,000
Total Additional Capital (Underwriting and Credit) - AC 93,511
Additional Underwriting Capital - AUC 83,546
Additional Credit Capital - ACC 17,467
Correlation between Additional Capitals (7,502)
Basis Capital + Additional Capital (c) 108,511
Minimum Capital Required (d) (higher among (b) and (c)) 108,511
Capital Adequacy (e = a – d) 9,789
Capital Adequacy (e/d) 9.02%

Notes to the Financial Statements
77
MAPFRE Seguros Gerais S.A.
R$ thousand
Sep 30, 2013
Stockholders’ Equity 1,616,276
Equity in associated and subsidiary companies (449,399)
Prepaid Expenses not related to reinsurance (4,945)Deferred Tax Assets from tax Losses --
Intangible Assets (159,403)
Works of art (148)Adjusted Stockholders’ Equity (a) 1,002,381
Minimum required stockholders’ equity - per premium 708,751 Minimum required stockholders’ equity - per claim 573,016 Solvency Margin (b) 708,751
Basis Capital – BC 15,000
Risk Capital – RC (Underwriting, Credit and Operational) 747,175
Underwriting Risk Capital 639,839
Credit Risk Capital 132,944
Correlation between Underwriting and Credit Capitals (57,150)Operational Risk Capital 31,542 Minimum Capital Required (c) 747,175
Capital Adequacy (d = a – c) 255,206
Capital Adequacy (d/c) 34.16%
R$ thousand
Dec 31, 2012
Stockholders’ Equity 1,545,498
Equity in associated and subsidiary companies (422,335)
Prepaid Expenses not related to reinsurance (1,778)
Intangible Assets (118,463)
Works of art (148)
Adjusted Stockholders’ Equity (a) 1,002,775
Minimum required stockholders’ equity - per premium 929,920
Minimum required stockholders’ equity - per claim 574,879
Solvency Margin (b) 929,920
Basis Capital – BC 15,000
Total Additional Capital (Underwriting and Credit) - AC 961,359
Additional Underwriting Capital - AUC 887,269
Additional Credit Capital - ACC 134,099
Correlation between Additional Capitals (60,009)
Basis Capital + Additional Capital (c) 976,359
Minimum Capital Required (c) 976,359
Capital Requirement – CR (higher among (b) and (c)) 976,359
Capital Adequacy (d = a - c) 26,416
Capital Adequacy (d/c) 2.71%

Notes to the Financial Statements
78
MAPFRE Affinity Seguradora S.A. R$ thousand
Sep 30, 2013
Stockholders’ Equity 447,033
(-) Equity in associated and subsidiary companies (335)
(-) Prepaid Expenses not related to reinsurance (7)
(-) Deferred Tax Assets from tax losses (1,171)
(-) Intangible Assets (2,630)Adjusted Stockholders’ Equity (a) 442,890
0.2 times the net revenues of premium issued in the last 12 months (b.1) 151,319
0.33 times the annual average of total retained claims the last 36 months (b.2) 67,077 Solvency Margin (b) (higher among (b1) and (b2)) 151,319
Basis Capital – BC 15,000 Risk Capital – RC (Underwriting, Credit and Operational) 172,250
Underwriting Risk Capital 152,022
Credit Risk Capital 30,892
Correlation between Underwriting and Credit Capitals (13,323)
Operational Risk Capital 2,659 Minimum Capital Required (c) 172,250
Capital Adequacy (d = a – c) 270,640
Capital Adequacy (d/c) 157.12%
R$ thousand
Dec 31, 2012
Stockholders’ Equity 420,126
(-) Equity in associated and subsidiary companies (300)
(-) Prepaid expenses not related to reinsurance --
(-) Deferred tax assets from tax losses (1,171)
(-) Intangible Assets (1,416)
Adjusted Stockholders’ Equity (a) 417,239
0.2 times the net revenues of premium issued in the last 12 months (b.1) 150,980
0.2 times the net revenues of retained claims in the last 36 months (b.2) 34,914
Solvency Margin (b) (higher among (b1) and (b2)) 150,980
Basis Capital – BC 15,000
Total Additional Capital (Underwriting and Credit) - AC 171,099
Additional Underwriting Capital 155,861
Additional Credit Capital 27,213
Correlation between Additional Capitals (11,976)
Basis Capital + Additional Capital (c) 186,098
Minimum Capital Required (d) (higher among (b) and (c)) 186,098
Capital Adequacy (e = a – d) 231,141
Capital Adequacy (e/d) 124.20%

Notes to the Financial Statements
79
Capitalization Plans (Special Savings) Line
Brasilcap Capitalização S.A.
Risk governance
Risk management in the Group includes credit, market, liquidity, legal and operational risks.
The corporate risk governance model adopted by the company involves a structure of committees that, together, include representatives of the partners, president, chief financial officer and managers of various areas of the company. Currently, such structure comprises the following bodies:
a. Financial Committee
b. Audit Committee
c. Product Committee
In principle and subject to the best practices of risk management, governance processes and structure include the following aspects:
• Segregation of duties: business x risk; • Special structure for assessment and monitoring of risks; • Joint decisions; • Investment management rules and risk management rules in an internal institutional document; and • Reference to the best management practices.
Risk management process
The company considers risk and capital management as the main vectors for the decision-making process.
The risk management process involves a continuous flow of information, in compliance with the following phases:
Preparation: phase of collection and analysis data. At this stage, the risks are analyzed and mitigation actions are proposed for discussion and resolution by the Financial Committee and, if necessary, the Board of Directors;
Decision: decisions are taken jointly by the competent levels and communicated to the intervening areas;
Enforcement: the areas involved enforce the decisions taken under the coordination of the Risk Management or Internal Controls;
Monitoring/Management: control carried out by the Risk Department by assessing compliance with the decisions and their impact on the Group and communicating the status of such actions to the competent forum (Chief Financial Officer or Financial Committee). Daily control and monthly reports on risks provide greater speed and efficiency to the decision-making process, as well as improving the Group’s management process.
Internal Audit is responsible for analyzing and issuing regular reports on the Company processes and risks. Aspects identified by the Auditors may generate administrative and management measures for addressing the causes and effects of each risk observed, correcting and improving processes.
Action, Contingency and Business Continuity Plans: The Company Internal Controls Department is responsible for monitoring the milestones and audit points requiring regular periodic or extraordinary actions. It is the main body responsible for the preparation and maintenance of the contingency and business continuity plans.
Market risk policy
The market risk policy for all financial assets and the use of derivative financial instruments, approved by the Board of Directors, are part of the strategic documents relating to the management of financial assets held by the company, which includes hedging policy and diversification.
The Risk Department is in charge of monitoring and checking compliance of the portfolio with internal and external standards, as well as with risk exposure limits approved by the Company. The information used for monitoring risk exposure, as well as any noncompliance, are reported to investment portfolio managers and directly informed to the Senior Management. Reports on risk management are presented at the monthly meetings of the Financial Committee. Market risks are monitored on a daily basis through the VaR – Value at

Notes to the Financial Statements
80
Risk, which is calculated based on historical simulations for one business day and offers a confidence level of 95%.
In addition to daily monitoring, stress tests are carried out each month for marked-to-market assets, while sensitivity analyses are performed on a half-yearly basis and detailed herein in the “Sensitivity Analysis” item.
Exposure
The demonstration of exposure to market risks of the Company in recent periods can be seen in the table below:
R$ thousand
Risk Factors Sep 30, 2013 Dec 31, 2012
Pre-fixed Interest Rate 4,924,432 57.1% 3,101,112 46.3%
Derivatives for Hedging (Adjustments) 1,123 -- (49) --
Post-fixed Interest Rate 2,100,861 24.4% 1,891,519 28.3%
IPCA Coupon 1,589,804 18.5% 1,696,599 25.3%
Assets TR 2,438 -- 3,712 0.1%
Cash / 1-day Repos 302 -- 298 --
Total 8,618,960 100.0% 6,693,191 100.0%
Part of the Assets exposed to pre-fixed interest rates is hedged against market changes through derivative transactions. Exposure variations are shown in the table below:
Hedge effects on Market Risk Exposure R$ thousand
Risk Factors Sep 30, 2013 Dec 31, 2012
Pre-fixed Interest Rate 4,924,432 57.1% 3,101,112 46.3%
Hedge effects on Pre-fixed exposure (1,501,174) (17.4)% (656,765) (9.8)%
Total Exposure to Pre Risk 3,423,258 39.7% 2,444,347 36.5%
Post-fixed Interest Rate 2,100,861 24.4% 1,891,519 28.3%
Hedge effects on Post-fixed exposure 1,501,174 17.4% 656,765 9.8%
Total Exposure to Post Risk 3,602,035 41.8% 2,548,284 38.1%
The other market risk factors, such as those relating to commodity prices and foreign exchange, are not included in the portfolio of financial assets that are used as collateral by the company.
Sensitivity Analysis
In order to prepare the sensitivity analysis of the company assets and liabilities, we considered a possible scenario in which the basic interest rate and interest rate coupons of securities indexed to inflation rates would increase or reduce by 100 basis points (+/- 1 percentage point). The test results of the last periods are shown in the following table:
R$ thousand
Sep 30, 2013
Increase by 1 p.a. in Interest Rate Reduction by 1 p.a. in Interest Rate
Share holders’ Equity after taxation and
profit Sharing
Income for the period Before taxation and
profit Sharing
Share holders’ Equity after taxation and
profit Sharing
Income for the period Before taxation and
profit Sharing
Pre-fixed Interest Rate (27,984) (46,639) 28,801 48,002
Post-fixed Interest Rate 113 188 (117) (194)
IPCA Coupon (23,755) (39,592) 24,730 41,217
Asset TR -- -- -- --
Liabilities TR (Bank Saving Certificates) 46,452 77,421 (49,295) (82,158)
Total (5,174) (8,622) 4,119 6,867

Notes to the Financial Statements
81
R$ thousand
Dec 31, 2012
Increase by 1 p.a. in Interest Rate Reduction by 1 p.a. in Interest Rate
Share holders’ Equity after taxation
and profit sharing
Income for the period Before taxation and
profit sharing
Share holders’ Equity after taxation
and profit sharing
Income for the period Before taxation and
profit sharing
Pre-fixed Interest Rate (25,660) (42,767) 26,543 44,238
Post-fixed Interest Rate 472 786 (480) (801)
IPCA Coupon (28,539) (47,564) 29,994 49,990
Asset TR (1) (1) 1 1
Liabilities TR (Bank Saving Certificates) 42,301 70,501 (50,255) (83,758)
Total (11,427) (19,045) 5,803 9,670
Part of the financial assets of the Company's investment portfolio is marked on the curve, classified as Held to Maturity, according to Banco Central do Brasil (Central Bank of Brazil) Circular 3068/2001. Thus, the registry values of these assets on the balance sheet of the Company are unchanged from changes in interest rates and market prices.
The table below shows the results of the sensitivity test, considering only the assets classified as Category I - Trading securities:
R$ thousand
Sep 30, 2013
Increase by 1 p.a. in Interest Rate Reduction by 1 p.a. in Interest Rate
Share holders’ Equity after taxation
and profit sharing
Income for the period Before taxation and profit
sharing
Share holders’ Equity after taxation and
profit sharing
Income for the period Before taxation and profit
sharing
Share holders’ Equity after taxation and profit Sharing)Pre-fixed Interest Rate (7,101) (11,835) 7,316 12,194
Post-fixed Interest Rate 113 188 (117) (194)
IPCA Coupon (6,336) (10,560) 6,694 11,157
Asset TR -- -- -- --
Liabilities TR (Bank Saving Certificates)
46,452 77,421 (49,295) (82,158)
Total 33,128 55,214 (35,402) (59,001)
R$ thousand
Dec 31, 2012
Increase by 1 p.a. in Interest Rate Reduction by 1 p.a. in Interest Rate
Share holders’ Equity after taxation
and profit sharing
Income for the period Before taxation and
profit sharing
Share holders’ Equity after taxation and
profit sharing
Income for the period Before taxation and
profit sharing
Pre-fixed Interest Rate (11,938) (19,897) 12,349 20,582
Post-fixed Interest Rate 472 786 (480) (801)
IPCA Coupon (18,119) (30,199) 19,102 31,836
Asset TR (1) (1) 1 1
Liabilities TR (Bank Saving Certificates)
42,301 70,501 (50,255) (83,758)
Total 12,715 21,190 (19,283) (32,140)
The table below describes the composition of assets and liabilities:
R$ thousand
Sep 30, 2013
Total Assets 9,330,135 100.0% Total Liabilities 9,330,135 100.0%
Investments 8,618,926 92.4% Technical Provisions 8,482,254 90.9%
“Fundo BB CAP Ações” + BB600mil (1) 65,841 0.7% Tax Litigation Liabilities 513,006 5.5%
Court Deposits - Taxes (2) 478,209 5.1% Other Liabilities (3) 84,101 0.9%
Other Assets (2) 167,159 1.8% Shareholders' Equity 250,774 2.7%

Notes to the Financial Statements
82
R$ thousand
Dec 31, 2012
Total Assets 7,280,738 100.0% Total Liabilities 7,280,738 100.0%
Investments 6,693,192 91.9% Technical Provisions 6,458,577 88.7%
“Fundo BB CAP Ações” + BB600mil (1) 56,194 0.8% Tax Litigation Liabilities 456,511 6.3%
Court Deposits - Taxes (2) 413,037 5.7% Other Liabilities (3) 130,260 1.8%
Other Assets (2) 118,315 1.6% Shareholders' Equity 235,390 3.2%
The returns from “Fundo BB Cap Ações (1)” did not affect the Company income, given that the profitability of this portfolio is entirely transferred to holders of Ourocap Flex products as bonuses. As a result, any changes in asset prices do not constitute a risk for the Company.
The Company evaluated the risk exposure of other assets (2) and liabilities (3) and concluded that there was no need for effecting testing sensitivity analysis, given the small representation in both the ownership structure and business operations.
Liquidity risk management
The company liquidity risk management uses the actuarial analysis to assess the exposure levels and the mismatch of maturities of assets and liabilities, as defined in the Circular SUSEP 272/04.
The terms for redemption of special saving bonds issued by the Company are regularly compared with the terms for securities included in the portfolio that guarantees said certificates, and any mismatching points that may lead to liquidity risks are identified. Due to the possibility of early redemptions, these are considered in future liability flows based on the same distributions observed in the history of each funding product.
On the other hand, most collateral assets have an active market, that enables their sale prior to maturity dates, allowing the Company meet its cash needs through any mismatches.
Credit risk policy
The policy approved by the Board of Directors applies to all transactions involving credit risk and complies with all legal restrictions, as well as with asset portfolio management. Currently, the credit risk exposure limit applicable to private entities is 30% of total assets, including securities of financial and non-financial institutions.
Measurement systems
The Company also assesses any expected losses regarding the asset portfolio, based on rating grades and the terms of private securities, as per its own methodology. The table below shows the percentages used by the company for assessing these risks:
Maturity (years) X Rating AAA AA A BBB BB B CCC/C
1 0.02% 0.04% 0.10% 0.49% 0.74% 1.11% 1.66%
3 0.14% 0.28% 1.08% 3.88% 5.82% 8.73% 13.09%
5 0.34% 0.68% 2.27% 6.61% 9.91% 14.87% 22.30%
7 0.50% 1.00% 3.00% 7.92% 11.88% 17.82% 26.72%
30 0.92% 1.84% 4.44% 9.59% 14.38% 21.58% 32.36%
(*) Local Rating Scale - The table above shows the local level risk scale (Brazil) used to evaluate the investment portfolio’s private credit risk. The assignment of this classification is performed by BB DTVM, hired as administrator of the company investment funds and assets’ portfolios.
The table below indicates the estimated default amounts by base date:
R$ thousand
RatingSep 30, 2013 Dec 31, 2012
Exposure Credit Risk Exposure Credit Risk
AAA 686,217 883 921,765 1,042
AA 585,430 2,111 511,488 2,074
A 187,105 1,881 172,953 2,365
Total 1,458,752 4,875 1,606,206 5,481

Notes to the Financial Statements
83
The results of this analysis are monitored by the Investments Manager and disclosed during the meetings of the Financial Committee, being communicated to the Financial Department, upon the occurrence of any changes in the portfolio.
Mitigation policy
When engaging in any transaction subject to credit risk, the company adopts a conservative approach by using restrictive exposure and concentration limits in order to keep compliance with the limits established by SUSEP, based on the Minimum Required Capital and taking into account the best practices in asset management.
Concentration
Credit risk management strategies guide the operational activities. The strategic decisions include, among other aspects, the materialization of the Company risk appetite and the definition of limits for risk exposure, concentration and estimated losses.
As defined in the Investment Policy, the Company establishes concentration limits for credit risk exposures based on the issuer or on the tranches issued. In the most recent base dates, the percentages of the companies’ securities with credit risk were recorded as follows:
Sep 30, 2013 Dec 31, 2012
Federal Government Bonds 83.1% 76.0%
Corporate Bonds 16.9% 24.0%
The company investment policy only considers financial investments in companies or securities that are classified in the national scale with rating grades ranging from AAA to BBB, that is, investment grade ratings, according to the standards in effect for the Brazilian private pension, insurance and savings plan sector.
The table below describes the distribution of private securities according to domestic ratings:
Private Risk Rating Sep 30, 2013 Dec 31, 2012
AAA 8.0% 13.8%
AA 6.8% 7.6%
A 2.2% 2.6%
Total 100% 100%
Stages of operational risk management
The Risk Department accounts for the identification, analysis, measurement, mitigation, control and monitoring of all operational risks. The management process includes the use of a dedicated software that registers and analyses all operational risk records and controls by area and by process.
The Internal Control Department is responsible for maintaining the quality of internal controls and for accrediting practices and products according to external regulations and norms, and internal standards. The optimization of this management process relies on the use of various methodologies and tools, such as Compliance Tests and Agents, programs for dissemination of a culture of internal controls, Internal and External Audits, and a Programa Gestão de Continuidade dos Negócios (Business Continuity Management – BCM).
With regard to the Business Continuity Management (BCM), it is maintained a reserved physical space that is located outside the head office and furnished with computer hardware, furniture, files and training programs intended to mitigate the risk of involuntary interruptions in the operating systems of the head office or the lack of physical access to it, thus avoiding longer interruptions in major critical processes that may result in losses for the Company.

Notes to the Financial Statements
84
Private Pension Plans Line
Brasilprev Seguros e Previdência S.A.
The Company is exposed to all risks that are inherent to insurance and private pension plans activities. In order to mitigate such risks and protect the participants of pension plans and the shareholders, it monitors our exposure levels on a daily basis and maintain a regular analysis of the possible impacts from various scenarios and adverse events, adopting all the controls needed to permanently comply with the highest economic, financial and actuarial security standards, with the purpose of preserving the liquidity, the solvency and the balance of the private pension plans.
Capital management includes monitoring of the limits required (minimum required capital), as provided for in CNSP Resolutions nº 280/2013, 282/2013 e 283/2013 issued by SUSEP. Said monitoring is carried out periodically aiming at ensuring maintenance of a sound capital base that guarantees the operations and risks assumed by the Company, whether under normal market conditions or in extreme situations.
a) Credit risk
Credit risk is the possibility of incurring losses arising out of any breach by the counterparty of their financial obligations under the agreed terms, or deterioration of their credit conditions.
Credit risk management follows economic, financial and regulatory assessments, and the company’s cash and financial assets are only invested (or reinvested) in counterparties with high quality credit ratings.
The table below includes all financial assets held by the company distributed according to the credit ratings informed by renowned ratings agencies. The assets included in the “Other” category substantially include variable income assets, repo transactions, and other receivable and payable amounts recorded in the investment funds.
R$ thousand
Sep 30, 2013
Federal Bonds AAA AA A BBB Others (1) Total
Investment Fund - 5,513,258 90,008 -- -- -- 430,586 6,033,852
Securitized Mortgage -- 39,147 -- -- -- -- 39,147
Future Contracts -- -- -- -- -- 297 297
Debentures -- 4,924 -- -- -- -- 4,924
Brazilian Treasury Bills (LTN) 432,426 -- -- -- -- -- 432,426
Mortgage -- 41,956 -- -- -- -- 41,956
Brazilian Treasury Notes (NTN-B) 1,873,097 -- -- -- -- -- 1,873,097
Brazilian Treasury Notes (NTN-C) 3,109,109 -- -- -- -- -- 3,109,109
Brazilian Treasury Notes (NTN-F) 98,626 -- -- -- -- -- 98,626
Repurchase Agreement Transactions -- -- -- -- -- 439,666 439,666
Quotes of Securitization -- -- -- -- -- -- --
Financial Bills -- 3,981 -- -- -- -- 3,981
Others(*) -- -- -- -- -- (9,377) (9,377)
FIFES linked to PGBL and VGBL 42,919,130 12,535,571 4,970,120 411,630 34,631 7,974,263 68,845,345
Stocks -- -- -- -- -- 2,046,714 2,046,714
Time Deposit -- 1,033,657 80,609 -- -- -- 1,114,266
Securitized Mortgage -- 5,148 -- -- -- -- 5,148
Future -- -- -- -- -- 7,799 7,799
Future -- -- -- -- -- (4,114) (4,114)
Debentures -- 1,657,715 4,463,325 375,983 10,675 -- 6,507,698
Garanteed Time Deposit -- -- 36,644 35,647 23,956 -- 96,247
Brazilian Treasury Bills (LTN) 20,363,955 -- -- -- -- -- 20,363,955
Financial Bills 3,720,637 -- -- -- -- -- 3,720,637
Brazilian Treasury Notes (NTN-B) 9,753,835 -- -- -- -- -- 9,753,835
Brazilian Treasury Notes (NTN-F) 9,080,703 -- -- -- -- -- 9,080,703
Repurchase Agreement Transactions -- -- -- -- -- 5,916,771 5,916,771
Quotes of Securitization -- 543,813 257,479 -- -- -- 801,292
Promissory Notes -- 103,245 26,000 -- -- -- 129,245
Financial Bills -- 9,191,993 106,063 -- -- -- 9,298,056
Others(*) -- -- -- -- -- 7,093 7,093

Notes to the Financial Statements
85
Own Portfolio 3,017,581 216,208 16,563 -- -- -- 3,250,352
Securitized Mortgage -- 50,119 -- -- -- -- 50,119
Debentures -- 5,824 16,563 -- -- -- 22,387
Mortgage -- 137,442 -- -- -- -- 137,442
Brazilian Treasury Notes (NTN-B) 1,086,092 -- -- -- -- -- 1,086,092
Brazilian Treasury Notes (NTN-C) 1,931,489 -- -- -- -- -- 1,931,489
Brazilian Treasury – Rural Credit Resources -- -- -- -- -- -- --
Financial Bills -- 22,823 -- -- -- -- 22,823
Total 51,449,969 12,841,787 4,986,683 411,630 34,631 8,404,849 78,129,549
(1) Include cash, investment funds receivables and payables, stocks, repo transactions, and other financial instruments with no rating assignment.
R$ thousand
Dec 31, 2012
Federal Bonds AAA AA A BBB Others (1) Total
Investment Fund - 5,377,144 105,488 -- -- -- 105,460 5,588,092
Securitized Mortgage -- 45,508 -- -- -- -- 45,508
Future Contracts -- -- -- -- -- (51) (51)
Debentures -- 5,435 -- -- -- -- 5,435
Brazilian Treasury Notes (LTN) 194,245 -- -- -- -- -- 194,245
Mortgage -- 47,377 -- -- -- -- 47,377
Brazilian Treasury Notes (NTN-B) 2,014,775 -- -- -- -- -- 2,014,775
Brazilian Treasury Notes (NTN-C) 3,059,930 -- -- -- -- -- 3,059,930
Brazilian Treasury Notes (NTN-F) 108,194 -- -- -- -- -- 108,194
Repurchase Agreement Transactions -- -- -- -- -- 113,756 113,756
Quotes of Securitization -- 3,416 -- -- -- -- 3,416
Financial Bills -- 3,752 -- -- -- -- 3,752
Others(*) -- -- -- -- -- (8,245) (8,245)
FIFES linked to PGBL and VGBL 39,106,660 9,483,831 4,397,857 523,863 69,576 5,484,317 59,066,104
Stocks -- -- -- -- -- 2,247,014 2,247,014
Time Deposit -- 1,737,404 193,801 70,711 13,560 -- 2,015,476
Securitized Mortgage -- 5,081 -- -- -- -- 5,081
Future -- -- -- -- -- (7,323) (7,323)
Future -- -- -- -- -- 1,586 1,586
Debentures -- 1,770,499 3,679,444 406,022 16,516 -- 5,872,481
Garanteed Time Deposit -- -- 34,429 47,130 39,500 -- 121,059
Brazilian Treasury Notes (LTN) 14,490,199 -- -- -- -- -- 14,490,199
Financial Bills 6,817,511 -- -- -- -- -- 6,817,511
Brazilian Treasury Notes (NTN-B) 8,120,672 -- -- -- -- -- 8,120,672
Brazilian Treasury Notes (NTN-F) 9,678,278 -- -- -- -- -- 9,678,278
Repurchase Agreement Transactions -- -- -- -- -- 3,198,362 3,198,362
Quotes of Securitization -- 447,004 318,304 -- -- -- 765,308
Promissory Notes -- -- 145,266 -- -- -- 145,266
Financial Bills -- 5,523,843 26,613 -- -- -- 5,550,456
Others(*) -- -- -- -- -- 44,678 44,678
Own Portfolio 2,706,232 195,574 18,275 -- -- -- 2,920,081
Securitized Mortgage -- 11,439 -- -- -- -- 11,439
Debentures -- 7,571 18,275 -- -- -- 25,846
Mortgage -- 155,100 -- -- -- -- 155,100
Brazilian Treasury Notes (NTN-B) 815,193 -- -- -- -- -- 815,193
Brazilian Treasury Notes (NTN-C) 1,891,030 -- -- -- -- -- 1,891,030
Brazilian Treasury – Rural Credit Resources 9
-- -- -- -- --9
Financial Bills -- 21,464 -- -- -- -- 21,464
Total 47,190,036 9,784,893 4,416,132 523,863 69,576 5,589,777 67,574,277
(1) Include cash, investment funds receivables and payables, stocks, repo transactions, and other financial instruments with no rating assignment.

Notes to the Financial Statements
86
The next table shows the ratings of the positions taken according to the sectoral profile:
R$ thousand
Sep 30, 2013
Federal Bonds AAA AA A BBB Others (1) Total
Investment Fund - FIF 5,513,258 90,007 - - - 430,587 6,033,852
Electric power -- 4,396 -- -- -- -- 4,396
Structured Finance -- 39,147 -- -- -- -- 39,147
Financial -- 45,936 -- -- -- -- 45,936
Infrastructure and Transportation -- 528 -- -- -- -- 528
Oil and Gas -- -- -- -- -- -- -- Government Bonds 5,513,258 -- -- -- -- -- 5,513,258
Without Rating -- -- -- -- -- 430,587 430,587
FIFES linked to PGBL and VGBL 42,919,129 12,535,572 4,970,120 411,629 34,631 7,974,264 68,845,345
Administration and Participation -- 467,284 -- -- -- -- 467,284
Aviation and Transport -- -- 109,707 20,837 -- -- 130,544
Foods and Beverages -- -- -- -- 10,675 -- 10,675
Construction and Incorporation -- 23,513 327,360 125,989 -- -- 476,862
Consumer and Retail -- -- 365,481 51,441 -- -- 416,922
Education -- -- 3,364 -- -- -- 3,364
Electric power -- 286,156 1,642,274 125,330 -- -- 2,053,760
Structured Finance -- 548,961 257,479 -- -- -- 806,440
Financial -- 10,225,650 223,316 35,647 23,956 -- 10,508,569
Infrastructure and Logistics -- -- 186,158 52,385 -- -- 238,543
Infrastructure and Transportation -- 181,024 100,351 -- -- -- 281,375
Mining -- 29,900 -- -- -- -- 29,900
Without Rating -- -- -- -- -- 7,974,264 7,974,264
Water services -- -- 299,913 -- -- -- 299,913
Steel and Metallurgy -- 253,595 255,768 -- -- -- 509,363
Telecommunications -- 519,489 1,003,732 -- -- -- 1,523,221
Health / Pharmaceutical -- -- 159,821 -- -- -- 159,821
Financial Services -- -- 35,396 -- -- -- 35,396
Government Bonds 42,919,129 -- -- -- -- -- 42,919,129
--
Own Portfolio 3,017,581 216,208 16,563 -- -- -- 3,250,352
Structured Finance -- 50,119 -- -- -- -- 50,119
Financial -- 160,265 -- -- -- -- 160,265
Infrastructure and Transportation -- 5,577 -- -- -- -- 5,577
Mining -- 247 -- -- -- -- 247
Telecommunications -- -- 16,563 -- -- -- 16,563
Government Bonds 3,017,581 -- -- -- -- -- 3,017,581
Total Applications 51,449,968 12,841,787 4,986,683 411,629 34,631 8,404,851 78,129,549
(1) Represent cash, receivables and payables of investment funds, shares, repurchase agreements and other financial instruments without specific rating of the issue.
b) Liquidity risk
Liquidity risk is the possibility of incurring losses arising from the lack of sufficient resources to fulfillment of commitments in dates specified.
Liquidity risk management includes studies on the financial transaction flows expected for various scenarios, as well as a conservative analysis of the minimum limits to be maintained for net funds. In addition to this strategy, the best reinvestment options are analyzed so as to maximize the funds available.
The table below includes the financial assets and liabilities held by the Company and classified according to contractual maturity terms of cash flows.
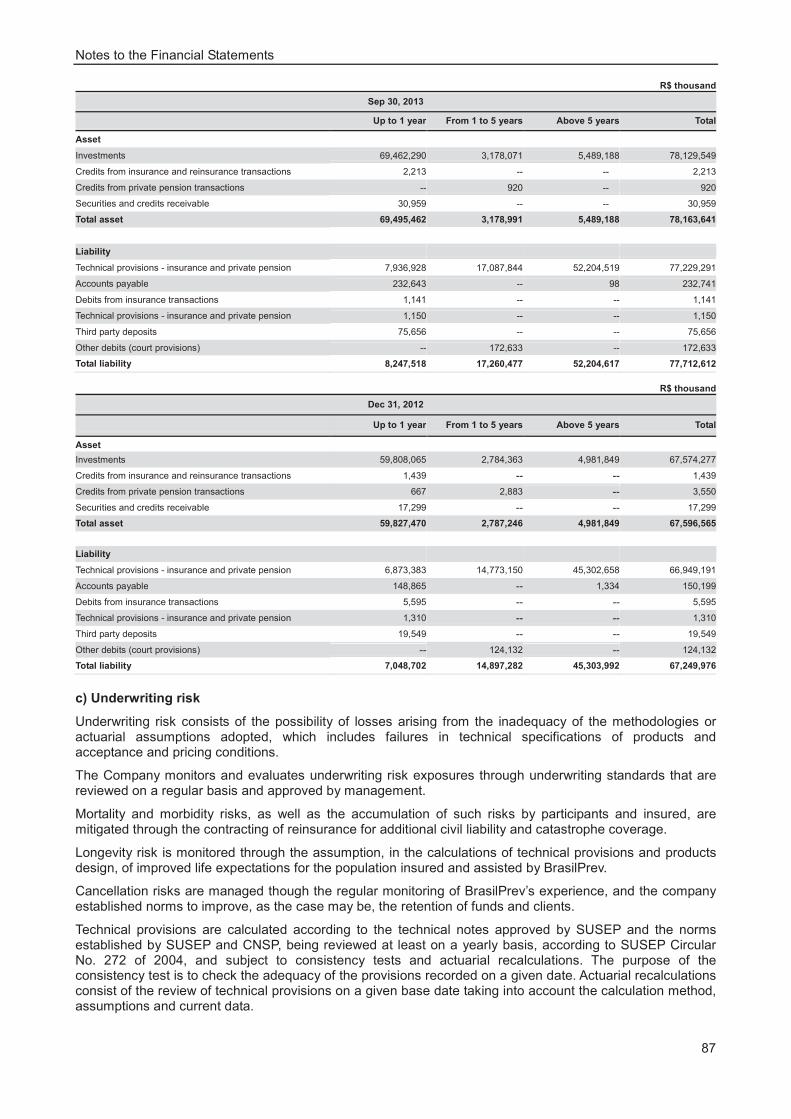
Notes to the Financial Statements
87
R$ thousand
Sep 30, 2013
Up to 1 year From 1 to 5 years Above 5 years Total
Asset
Investments 69,462,290 3,178,071 5,489,188 78,129,549
Credits from insurance and reinsurance transactions 2,213 -- -- 2,213
Credits from private pension transactions -- 920 -- 920
Securities and credits receivable 30,959 -- -- 30,959
Total asset 69,495,462 3,178,991 5,489,188 78,163,641
Liability
Technical provisions - insurance and private pension 7,936,928 17,087,844 52,204,519 77,229,291
Accounts payable 232,643 -- 98 232,741
Debits from insurance transactions 1,141 -- -- 1,141
Technical provisions - insurance and private pension 1,150 -- -- 1,150
Third party deposits 75,656 -- -- 75,656
Other debits (court provisions) -- 172,633 -- 172,633
Total liability 8,247,518 17,260,477 52,204,617 77,712,612
R$ thousand
Dec 31, 2012
Up to 1 year From 1 to 5 years Above 5 years Total
Asset
Investments 59,808,065 2,784,363 4,981,849 67,574,277
Credits from insurance and reinsurance transactions 1,439 -- -- 1,439
Credits from private pension transactions 667 2,883 -- 3,550
Securities and credits receivable 17,299 -- -- 17,299
Total asset 59,827,470 2,787,246 4,981,849 67,596,565
Liability
Technical provisions - insurance and private pension 6,873,383 14,773,150 45,302,658 66,949,191
Accounts payable 148,865 -- 1,334 150,199
Debits from insurance transactions 5,595 -- -- 5,595
Technical provisions - insurance and private pension 1,310 -- -- 1,310
Third party deposits 19,549 -- -- 19,549
Other debits (court provisions) -- 124,132 -- 124,132
Total liability 7,048,702 14,897,282 45,303,992 67,249,976
c) Underwriting risk
Underwriting risk consists of the possibility of losses arising from the inadequacy of the methodologies or actuarial assumptions adopted, which includes failures in technical specifications of products and acceptance and pricing conditions.
The Company monitors and evaluates underwriting risk exposures through underwriting standards that are reviewed on a regular basis and approved by management.
Mortality and morbidity risks, as well as the accumulation of such risks by participants and insured, are mitigated through the contracting of reinsurance for additional civil liability and catastrophe coverage.
Longevity risk is monitored through the assumption, in the calculations of technical provisions and products design, of improved life expectations for the population insured and assisted by BrasilPrev.
Cancellation risks are managed though the regular monitoring of BrasilPrev’s experience, and the company established norms to improve, as the case may be, the retention of funds and clients.
Technical provisions are calculated according to the technical notes approved by SUSEP and the norms established by SUSEP and CNSP, being reviewed at least on a yearly basis, according to SUSEP Circular No. 272 of 2004, and subject to consistency tests and actuarial recalculations. The purpose of the consistency test is to check the adequacy of the provisions recorded on a given date. Actuarial recalculations consist of the review of technical provisions on a given base date taking into account the calculation method, assumptions and current data.

Notes to the Financial Statements
88
Sensitivity analysis
The underwriting risks considered herein are those linked to the formation of liabilities (technical provisions) from operations.
The principal risk involved in supplementary pension products is the transformation of the accumulated reserves into continuing income. In this sense, the selection of risk factors sought to include the possibilities associated with the expectations of materialization of this risk, as follows:
a) Cancellation assumptions reflect the expectations of redemption of accumulated reserves by the participants before their expected retirement dates. So, lower cancellation rates imply greater probabilities of transforming the accumulated reserves into continuing income;
b) The possibility of annuitization reflects the expectations of transformation, by the participants, of the accumulated reserves into continuing income on their retirement dates. So, greater annuitization rates imply greater risks associated with the payment of continuing income;
c) The possibility of longevity reflects the expectations on the length of time during which continuing income is paid. Accordingly, greater survival rates imply greater risks associated with the payment of continuing income.
R$ thousand
Impact in Sep 30, 2013 Impact in Dec 31, 2012
Risk Factors Sensitivity Equity Income Equity Income
Cancellation +100 bps 64,882 64,882 18,409 18,409
Cancellation -100 bps (80,571) (80,571) (21,202) (21,202)
Annuitization 10% (45,365) (45,365) (22,876) (22,876)
Annuitization -10% 41,756 41,756 22,876 22,876
Longevity 5% (18,624) (18,624) (26,399) (26,399)
Longevity -5% 17,198 17,198 25,046 25,046
The table above includes the sensitivity analysis calculated by the Company for the principal assumptions used in the actuarial calculations of the liabilities involved in the insurance contracts. The ‘sensitivity’ column indicates a variation rate reasonably expected by Management for the assumptions selected. The preparation of the sensitivity analyses conducted by the Company was based on the best estimates of changes in the assumptions considering usual market scenarios and conditions. The results shown in these analyses may be significantly different from the actual results obtained in future periods as a result of favorable or adverse situations during the course of Company business.
d) Market Risk
In order to control market risks, the company uses the set of metrics that is more suitable for each portfolio or fund. This analysis includes Tracking Error and Duration limits, as well as an "ad hoc" analysis of the volatility of the Group's own funds and of competition in asset portfolios linked to the accumulation stage of PGBL and VGBL products.
Additionally, the portfolios with interest rate guarantees (income for life and traditional products) are supported by a structured asset and liability management (ALM) model and process that includes the combination of indices and short- and long-term cash flows, as well as reinvestment simulations that take into account variations in economic scenarios.
Sensitivity analysis
This analysis considers the following risk factors: (i) interest rates and (ii) coupons of securities linked to inflation indices (IGP-M and IPCA) due to their importance for the assets and liabilities of the company.
The definition of quantitative parameters used in the sensitivity analysis (100 basis points for interest rates and inflation coupons) was based on the analysis of the historical variations in interest rates in a recent period, as well as on the assumption of non-variation in inflation expectations curves, which affect the relevant coupons as much as the interest rates. International standards were also complied with.
This analysis takes into account only the securities classified as “fair value through income” and “trading securities”, which are marked-to-market according to the pricing and risk calculation methodologies used by Brasilprev. All active plans, except PGBL and VGBL plans in phase of accumulation, were considered in this analysis.
The sensitivity analysis considered the isolated effects of each risk factor. The ‘‘sensitivity’ column indicates a change index that was deemed to be possible for the assumptions selected. The preparation of the
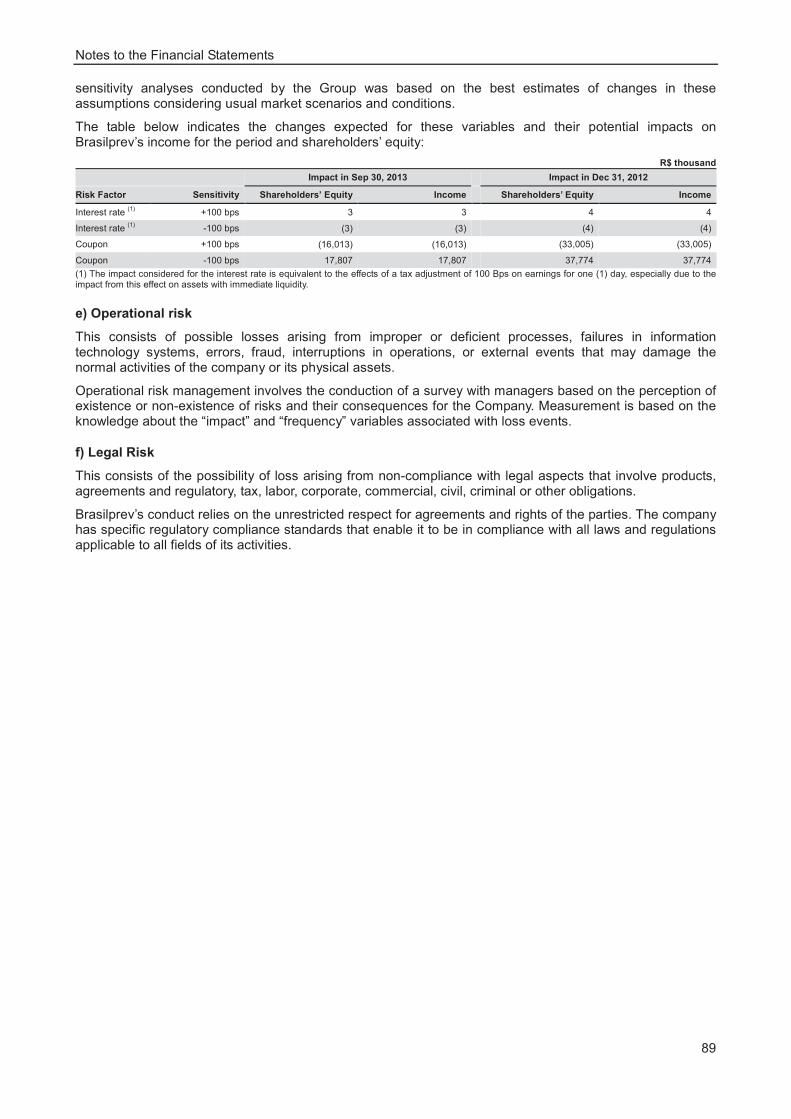
Notes to the Financial Statements
89
sensitivity analyses conducted by the Group was based on the best estimates of changes in these assumptions considering usual market scenarios and conditions.
The table below indicates the changes expected for these variables and their potential impacts on Brasilprev’s income for the period and shareholders’ equity:
R$ thousand
Impact in Sep 30, 2013 Impact in Dec 31, 2012
Risk Factor Sensitivity Shareholders’ Equity Income Shareholders’ Equity Income
Interest rate (1) +100 bps 3 3 4 4
Interest rate (1) -100 bps (3) (3) (4) (4)
Coupon +100 bps (16,013) (16,013) (33,005) (33,005)
Coupon -100 bps 17,807 17,807 37,774 37,774
(1) The impact considered for the interest rate is equivalent to the effects of a tax adjustment of 100 Bps on earnings for one (1) day, especially due to the impact from this effect on assets with immediate liquidity.
e) Operational risk
This consists of possible losses arising from improper or deficient processes, failures in information technology systems, errors, fraud, interruptions in operations, or external events that may damage the normal activities of the company or its physical assets.
Operational risk management involves the conduction of a survey with managers based on the perception of existence or non-existence of risks and their consequences for the Company. Measurement is based on the knowledge about the “impact” and “frequency” variables associated with loss events.
f) Legal Risk
This consists of the possibility of loss arising from non-compliance with legal aspects that involve products, agreements and regulatory, tax, labor, corporate, commercial, civil, criminal or other obligations.
Brasilprev’s conduct relies on the unrestricted respect for agreements and rights of the parties. The company has specific regulatory compliance standards that enable it to be in compliance with all laws and regulations applicable to all fields of its activities.

Notes to the Financial Statements
90
IRB-Brasil Re
Risk Management
Risk Management in IRB-Brasil Re is considered an essential tool for optimizing the use of capital and selecting the best business opportunities in order to obtain better risk/return for its shareholders. The supervision activity of Risk Management in IRB-Brasil Re is made by the Board and by the Board of Directors, with the support of the Risk Management Committee and other advisory or deliberative bodies. After review, happened in December 2012, the rating A- (excellent) was confirmed by AM Best rating agency, headquartered in the United States, which reflects, in the opinion of that agency, a level of capital strongly appropriate to the Company risks.
Main Risk Types
The Corporate Risk Management covers the following risk categories: Conjuncture, Operational, Reputation, Underwriting, Market, Credit and Liquidity, which in turn are composed of several subcategories.
The Company believes that these categories represent its main exhibitions, but are not exhaustive, since many risks can affect it. To dealing with these risks, the Company uses several methodologies and strategies, such as Balanced Scorecard (BSC), development of a Business Continuity Management, creating a Risk Management Plan – aimed at the identification, analysis, measurement, addressing and reporting, focused on operational risks – addressing of operational incident, monitoring of counterparties credit risk and the VaR (Value at risk) of the investment portfolio, among others.
Underwriting risk
The underwriting risk comes from fluctuations that may arise from internal and external factors to the Company, contrary to the expectations of the Reinsurer in relation to financial and actuarial assumptions adopted in the pricing of reinsurance contracts and the establishment of technical provisions. In order to reduce exposure to risk, the IRB-Brasil Re works with a diversified reinsurance portfolios. Additionally, the evolution of risks is monitored, as the actuarial assumptions and underwriting and accepting risks policies and monitoring of technical provisions are constantly reviewed.
Monitoring of reinsurance liabilities by business line
The Company calculates its technical provisions following the standards of the Conselho National de Seguros Privados (CNSP) and the Superintendência de Seguros Privados (SUSEP). The table below shows liabilities (PSL, IBNR, IBNER, PET, PPNG) gross and net by business line.
R$ thousand
Retrocession Liabilities Retrocession Assets
Group Sep 30, 2013 Sep 30, 2013
Property 2,978,345 (1,859,226)
Special Risks 303,354 (231,576)
Responsibilities 688,945 (245,299)
Vessel 542,158 (432,811)
Vehicle 275,444 (7,215)Transportation 292,016 (158,396)Financial Risks 753,795 (433,321)
Credit 49,433 (22,542)
People 172,291 (40,543)
Mortgage 66,729 (851)
Rural 421,444 (102,388)
Marine 88,714 (10,148)Aviation 169,231 (88,960)
Run-off (Londres) 212,240 --
Others 573,886 (54,300)
Total 7,588,025 (3,687,576)

Notes to the Financial Statements
91
The following tables present the development of the Company's claims, per year of subscription.
Claims Gross of Retrocession R$ thousand
Year of Subscription 2006 2007 2008 2009 2010 2011 2012 2013 Total
Estimate of accumulated claimsAt the end of underwriting year 586,014 720,059 777,939 738,882 340,142 200,595 342,520 626,879
After one year 2,039,724 2,654,451 1,782,336 1,241,026 845,278 516,906 892,103
After two years 2,162,859 2,634,264 1,833,735 1,374,800 750,949 755,729
After three years 1,935,371 2,616,710 1,858,580 1,433,714 703,584
After four years 1,877,525 2,842,356 2,180,920 1,403,797
After five years 1,933,092 3,310,992 2,333,359
After six years 2,045,442 3,497,991
After seven years 2,166,591
Current estimate of 2,166,591 3,497,991 2,333,359 1,403,797 703,584 755,729 892,103 626,879 12,380,033
accumulated claims
Cumulative payments (1,830,957) (2,932,458) (1,776,967) (1,250,467) (530,371) (317,932) (293,809) (83,118) (9,016,079)
to date basis
Liability recognized in the balance
335,634 565,533 556,392 153,330 173,213 437,797 598,294 543,761 3,363,954
Liability�in relation to 1,521,020
years prior to 2006
IBNER 342,682
Total liabilities included in the balance* 5,227,656
* The analysis does not consider the provision of unsettled claims of London branch.
Claims Net of Retrocession R$ thousand
Year of Subscription 2006 2007 2008 2009 2010 2011 2012 2013 Total
Estimate of accumulated claims
At the end of underwriting year 395,132 391,819 500,531 458,107 257,280 146,828 212,493 272,220
After one year 932,904 1,689,640 1,088,423 835,580 648,986 283,846 559,519
After two years 1,296,897 1,912,946 1,209,256 1,051,953 550,314 433,452
After three years 1,353,357 1,992,197 1,237,117 1,052,361 471,698
After four years 1,385,260 2,075,394 1,380,918 1,024,299
After five years 1,416,582 2,339,360 1,406,970
After six years 1,521,486 2,322,015
After seven years 1,533,172
Current estimate of 1,533,172 2,322,015 1,406,970 1,024,299 471,698 433,452 559,519 272,220 8,023,345
accumulated claims
Cumulative payments (1,437,859) (2,205,339) (1,266,466) (958,155) (385,729) (195,530) (157,954) (72,075) (6,679,107)
to date basis
Liability recognized in the balance 95,313 116,676 140,504 66,144 85,969 237,922 401,565 200,145 1,344,238
Liability�in relation to 852,154
years prior to 2006
IBNER 189,884
Total liabilities included in the balance 2,386,276
Sensitivity analysis
The table below shows possible impact on result and shareholders’ equity, considering a 10% (ten percent) increase in claims.
R$ thousand
Gross effects Impact
Income and shareholders’ equity (89,737)
Income (%) (439.29)
Shareholders’ equity (%) (3.45)
Net effects Impact
Income and shareholders’ equity (50,131)

Notes to the Financial Statements
92
Market Risk
Can be defined as the risk arising from changes in prices and rates in the financial market, which may reflect the reduction in value of a financial security or portfolio of assets. The main variables linked to market risk are: interest rates, exchange rates and the liquidity of assets. Risk management from these variables involves different organizational units and includes a series of guidelines and strategies considered appropriate by management, aiming at risk management arising from those variables. For this purpose the following techniques are used: definition of maximum limits of VaR (Value at Risk) and construction of stress scenarios, market monitoring, and preventive management of losses.
Value at Risk Analysis
The measurement of market risk, made through the VaR, estimates the potential loss in profit before income tax for a given time horizon given a specific probability of occurrence, considering the market volatilities and the risk diversification by recognizing compensatory positions and correlations between the product and the market. The daily VaR of the portfolio of assets of the Reinsurer, registered on September 30, 2013, was R$ 9.4 million, which represents a loss of 0.17% of the total portfolio of assets, according to the not-parametric method – historical daily VaR with significance level of 5% and mobile observation period of 150 business days.
Sensitivity Analysis for Foreign Currency
The reinsurer is mainly exposed to the currency of the United States, however having exposure to a lesser extent the Euro. The following table details the sensitivity of Reinsurer to the change rates for the two currencies, considering the prognosis of the U.S. dollar to December 31, 2013, presented by Relatório Focus published by the Bacen on October 4, 2013 (R$ 2.23 / U.S. $ 1.00), and for the Euro, it was decided to apply the same percentage change in the dollar, which represents the most likely scenarios:
R$ thousand
Based scenario – Dec 31, 2013
Change in dollars surplus 17,876
Change in Euro surplus 621
Consonant the scenario highlighted above, it is possible to conclude that the Dollar appreciation converge in a positive surplus for the Company. Considering the same movement to the Euro currency, there would be a positive surplus. The consolidation of the surplus, in this scenario, would result in a non-material financial gain for the Reinsurer.
Sensitivity Analysis to Interest Rate
The Company is exposed to interest rate risk, as it has, mainly, securities tied to change in interest rates. The following table details the sensitivity of the Reinsurer to the variation of 1% (100bp) in the Selic rate:
R$ thousand
Set 30, 2013 Impact +1% -1%
Sep 30, 2013 Sep 30, 2013
Change in pre-fixed securities (13,791) 13,829
Change in post-fixed securities (5,472) 5,446Income (19,263) 19,275
Parameters:
a) 100 basis points for interest rate structures existing as of December 31, 2012. b) Assuming for conservatism that the real interest rate (NTN-B coupon) evolved proportionally to the Selic rate.
After analysis, it is possible to conclude that the sensitivity to interest rate by 100bps implies a change in the value of exposed securities to about 0.13% for the rate reduction and -0.13% for the rate increase.
Income (%) (245.41)
Shareholders’ equity (%) (1.93)

Notes to the Financial Statements
93
Correlated Risk Management
The Company considers that the economic variables have no independent movement, there is a correlationbetween the main risk factors associated with investments. Considering these variables, well as their correlations, concluded that the associated risks are partially mitigated, given that the variables analyzed act in compensatory movement, which can generate a maximum loss of 7% in the period. About the stress scenarios analyzed, considering large global crises that have occurred in the last fifteen years, it was concluded that the maximum loss of your portfolio would be 6.5%.
Credit Risk
The IRB-Brasil Re understands that the main source of its credit risk - risk that a counterpart will not fulfill its contractual obligations with financial losses - are retrocession operations. To mitigate this risk, the Company adopted a policy of having retrocession transactions with companies that have at least half of the ratings on record, demonstrably, equal or higher than A- (S&P, Fitch and AM Best) or A3 (Moody's), and evaluates its retrocessionaires through an own classification. The Reinsurer's exposure is continuously monitored, being controlled by counterpart limits, that are reviewed and approved, at least annually, by the Security Committee. The quality of the current retrocession partners of protection contracts IRB-Brasil Re can be seen in the table below:
Range rating (%) of participants Reinsurance of contracts
and protection in force
AAA or equivalent 0
AA or equivalent 52.6
A or equivalent 36.8
BBB+ or equivalent 5.3
Local Reinsurer without rating 5.3
100
The credit risk on funds and derivative financial instruments is limited because the counterparts are represented by banks with high credit rating attributed by international rating agencies. The following techniques are used to control and mitigate credit risk: setting limits for retrocession by entity; monitoring changes and trends in the insurance and reinsurance market and financial market; and preventive management of losses.
Liquidity Risk
Liquidity risk is associated with the risk that the Company, although solvent, does not have resourcesavailable to fulfill its obligations in a timely manner, or that can fulfill them only through assets sale in unfavorable conditions, resulting in financial losses. To manage this risk, is used a model that combines the needs of funding and liquidity management in the short, medium and long term. This risk is continuously tracked by monitoring of expected and real cash flows, and by combination of the maturity profiles of financial assets and liabilities.
Currency Futures Contracts
As part of the investment policy of the Company, is expected the hiring hedge for the occurrence of surplus assets in foreign currency. On bases date September 30, 2013, the Company had no forward currency contracts or other foreign exchange hedging instrument.
Futures Contracts on Interest Rates – Fixed Income
On September 30, 2013, the Company owned all the quotes of the BB Exclusivo Extramercado 22 Fund and sharing in the quotes of the FAE1 and FAE2 - Fixed Income Funds. Both funds had no transactions with futures interest rate contracts on that date. Fund managers can adopt as hedge policy using derivative financial instruments, in order to protect the asset value in relation to unexpected movements in interest rates. On December 31, 2012 the manager did not maintain position or sold or purchased in interest rates in the future market of DI.

Notes to the Financial Statements
94
Valuation Techniques and Assumptions Applied for Determining the Fair Value
The determination of fair value of financial assets and liabilities is presented below:
(a) The fair value of financial assets and liabilities that have standard terms and conditions and are traded in active markets is determined based on observed prices in those markets.
(b) The fair value of derivative instruments is calculated using quoted prices. The foreign exchange forward contracts are measured based on the exchange rates and the yield curves obtained based on quotation and for the same maturities of the contracts.
(c) The fair value of other financial assets and liabilities (except those described above) is determined in accordance with generally accepted pricing models, based on analysis of discounted cash flows.
Fair value measurements recognized in the balance sheet
The following table provides an analysis of financial instruments that are measured at fair value after initial recognition, grouped into Levels 1 and 2 based on the observable level of fair value:
(a) Fair value measurement of Level 1 are obtained from quoted prices (unadjusted) in active markets for identical assets or liabilities.
(b) Fair value measurements of Level 2 are obtained by other variables than quoted prices included in Level 1, that are observable for the asset or liability directly (as prices) or indirectly (based in prices).
(c) Fair value measurement of Level 3 are obtained from valuation techniques that include variables for the asset or liability, but which are not based on observable market data (unobservable inputs).
R$ thousand
Financial assets at fair value by income Sep 30, 2013
Share of national companies Level 1 213,945
Financial Bills Level 1 520,887
Brazilian Treasury Notes (LTN) Level 1 368,777
Brazilian Treasury Notes (NTN) Level 1 217,713
Repurchase Agreement Transactions Level 2 311,030
Shares Investment Funds nonexclusive Level 2 796,962
Shares Investment Funds Overseas Level 2 13,775
Others Level 2 31
2,443,120
Finantial assets available for sale Sep 30, 2013
American Deposits Receipt Level 1 4,489
Sovereign debt Level 2 111,208
Fixed Income Securities Level 2 31,123
Brazilian Treasury Notes (NTN-B) Level 1 120,246
Financial Bills Level 1 2,182,520
2,449,586
Total 4,892,706

Notes to the Financial Statements
95
Minimum capital and additional
CNSP, on January 30, 2013, published new regulations about to the calculation of minimum capital required for authorization and operation of local reinsurers and risk capital, consubstantiated in the Resolutions CNSP nr 282 and 283/2013. The main changes were as follows:
1. The additional capital to risk is now called "risk capital";
2.The basis capital (fixed amount of R$ 60 million) to reinsurers becomes alternative and not supplementary to risk capital;
3. Introduction of operational risk capital;
4. The presentation of own model of capital market risk to SUSEP was permitted.
Continue in force, for the calculation of risk capital based on underwriting risk, the CNSP Resolutions 280/2013 and Circular SUSEP nr 414/2010, and CNSP Resolution nr 228/2010 for risk capital based on credit risk. The risk capital based on operational risk, regulated by CNSP Resolution nr 283/2013, is determined by weighting the values of premiums, claims and technical provisions.
The IRB-Brasil Re, on June 28, 2013, had not submitted its own model of market risk capital for SUSEP approval. Are considered, for the purposes of the aforementioned resolutions, the following concepts:
I – Minimum required capital: amount of capital that a local reinsurer must maintain at any time to operate, being equivalent to the higher of the base capital, risk capital, and the solvency margin.
II – Basis capital: fixed amount of capital, in the amount of R$ 60 million, a local reinsurer shall have, at any time.
III – Risk capital: variable amount of capital a local reinsurer shall have, at any time, in order to ensure the risks inherent in its operations, pursuant to specific regulation.
IV – Solvency margin: the greater of the following amounts: (a) 20% (twenty percent) of the total retained premiums in the past 12 (twelve) months, and (b) 33% (thirty-three percent) of the annual average of total retained losses in the last 36 (thirty six) months.
Capital calculation
The calculation made by IRB-Brasil Re, as provided in the aforementioned resolutions, did not identify the need for additional capital contribution. In September 31, 2012, it was observed that the value of adjusted stockholders’ equity is higher than the value of the minimum required capital.
R$ Thousand
Sep 30, 2013
Risk capital based on underwriting risk 330,765
Risk capital based on credit risk 310,488
Risk capital based on operational risk 31,111
Total additional capital (*) 586,544
Basis capital 60,000
Solvency margin 302,255
Minimum required capital 586,544
Adjusted stockholders’equity (**) 2,526,487
Sufficiency of adjusted stockholders’ equity 1,939,943
(*)Value obtained by weighting (**)Calculation of adjusted shareholders' equity
R$ Thousand
Sep 30, 2013
Stockholders’ equity 2,623,213
Deductions
Prepaid expenses (2,372)
Equity in associated and subsidiary companies (71,588)
Intangible (36,467)
Rights/obligations of foreign branches 13,751
Other deductions (50)
Adjusted Stockholders’ Equity 2,526,487

Notes to the Financial Statements
96
7 – Information by Segment
The information by segment was prepared considering the criteria used by the Administration to evaluate the performance in decision making regarding the allocation of funds for investment and other purposes, the regulatory environment and the similarities between goods and services.
The various management information used by Administration to evaluate performance and to make decision are prepared in accordance with the laws and standards applicable to insurance institutions, as determined by SUSEP.
The operations of BB Seguridade are divided into two segments: (i) insurance (insurance and reinsurance pension plans and capitalization) and (ii) brokerage.
Intersegment transactions are conducted under normal market conditions, substantially under the terms and conditions for comparable transactions, including interest rates and collateral. These transactions do not involve abnormal payment risks.
a) Insurance
In this segment, products and services offered are related to life, property and vehicle insurance, property and vehicle insurance, reinsurance heritage, rural, special risks and financial, transport, hooves, and housing people private pension plans and capitalization plans, private pension plans and capitalization plans.
The profit of this segment comes mainly from revenues of insurance and reinsurance premiums issued, contributions for private pension plans, capitalization bonds and investments in securities, net of commercialization expenses, technical provisions and expenses related to benefits and redemptions.
The recording of these results is made through equity investments in subsidiaries.
b) Brokerage
BB Corretora de Seguros e Administradora de Bens S.A (BB Corretora) is a wholly owned subsidiary of BB Seguridade, which aims at social brokerage and management, fulfillment, promotion and facilitation of business insurance and reinsurance casualty and life and capitalization plans, pension and health insurance.
c) Financial information by reportable segment R$ thousand
Jan 01, 2013 to Sep 30, 2013
Insurance Brokerage Total
Operating income 938,225 1,230,052 2,168,277
Commissions income -- 1,230,052 1,230,052
Share of profit of associate companies 938,225 -- 938,225
Other income and expenses 23,220 (282,041) (258,821)
Interest income from financial instruments 41,922 46,264 88,186
Personnel expenses (3,750) (7,782) (11,532)
Administrative expenses (984) (199,461) (200,445)
Other operating expenses (13,968) (121,062) (135,030)
Income before taxes 961,445 948,011 1,909,456
Income taxes (8,063) (323,295) (331,358)
Net income (1) 953,382 624,716 1,578,098
Total assets 6,223,582 1,405,093 7,628,675
Total liabilities 281,437 1,153,874 1,435,311
Total Equity 5,942,145 251,219 6,193,364
(1) The financial income and taxes expenses from parente statement of BB Seguridade and BB Cor are not included.

Notes to the Financial Statements
97
R$ thousand
3nd quarter/2013
Insurance Brokerage Total
Operating income 329,861 425,497 755,358
Commissions income -- 425,497 425,497
Share of profit of associate companies 329,861 -- 329,861
Other income and expenses 11,749 (94,747) (82,998)
Interest income from financial instruments 14,831 19,121 33,952
Personnel expenses (1,068) (2,565) (3,633)
Administrative expenses 121 (65,406) (65,285)
Other operating expenses (2,135) (45,897) (48,032)
Income before taxes 341,610 330,750 672,360
Income taxes (4,065) (112,934) (116,999)
Net income (1) 337,545 217,816 555,361
Total assets 6,223,582 1,405,093 7,628,675
Total liabilities 281,437 1,153,874 1,435,311
Total Equity 5,942,145 251,219 6,193,364
(1) The financial income and taxes expenses from parente statement of BB Seguridade and BB Cor are not included.
d) Insurance Segment Subdivision
Insurance Segment results are evaluated considering the following lines of business: (i) Insurance, (ii) Reinsurance, (iii) Private Pension Plans and (iv) Capitalization Plans.
Insurance
The sub segment comprises insurance products offered through BB MAPFRE SH1 Participações S.A and MAPFRE BB SH2 Participações S.A. It is formed by the life, mortgage life and rural insurance and property and casualty insurance.
Insurance – Life, Mortgage Life and Rural
It comprises the products offered by BB Mapfre SH1 (personal, property and rural insurance) and by MAPFRE BB SH2 (casualty and vehicle insurance). Income and expenses are recorded by the equity method and raises, mainly, from insurance premiums issued revenues and investments in securities, net of selling expenses, technical provisions and claims expenses.
Insurance – Property and Casualty
It comprises the products offered by Mapfre BB SH2 (casualty and vehicle insurance). Income and expenses are recorded by the equity method and arise, mainly, from insurance premiums issued revenues and investments in securities, net of selling expenses, technical provisions and claims expenses.
Reinsurance
It comprises the products offered by IRB Brasil Resseguros S.A. (reinsurance operations). Income and expenses are recorded by the equity method and arise, mainly, from reinsurance premiums issued in the country and abroad revenues and investments in securities, net of selling expenses, technical provisions and claims expenses.

Notes to the Financial Statements
98
Private Pension Plans
Brasilprev pension plans are offered in this segment. Income and expenses are recorded by the equity method and arise, mainly, from administration fees and investments in securities, net of selling expenses, technical provisions and expenses with benefits and redemption.
Capitalization Plans
Primarily responsible for offering Brasilcap capitalization plans. Income and expenses are recorded by the equity method and arise, mainly, from insurance premiums issued revenues and investments in securities, net of selling expenses, technical provisions and expenses with benefits and redemption.

Notes to the Financial Statements
99
e) Statement of income by sub segment R$ thousand
Jan 01, 2013 to Sep 30, 2013
Insurance
Life, Mortgage and Rural
Property and Casualty
Reinsurance Private
Pension Plans Capitalization
Plans
Insurance income
Earned premiums 3,477,145 5,466,404 1,918,899 -- --
Retained premiums 4,504,732 5,786,259 1,961,726 -- --
Change in technical provisions (1,027,587) (319,855) (42,827) -- --
Income insurance 4,783 (429) -- -- --
Retained claims (1,189,715) (2,990,511) (1,908,958) -- --
Costs acquisition (854,661) (1,168,051) (67,279) -- --
Reinsurance income (229,978) (253,671) 231,747 -- --
Other operation income (expenses) (189,139) (168,822) (2,991) -- --
Administrative expenses (190,727) (629,113) (151,671) -- --
Taxes expenses (110,977) (129,953) (55,789) -- --
Result from interest income 209,904 133,037 161,076 -- --
Interest income 280,475 263,718 603,427 -- --
Interest expenses (70,571) (130,681) (442,351) -- --
Private Pension Plans income -- -- -- 95,286 --
Retained contributions -- -- -- 15,627,081 --
Benefits provision -- -- -- (15,531,795) --
Change in technical provisions -- -- -- (44,674) --
Income from management fees and products -- -- -- 759,621 --
Benefits and redemption expenses -- -- -- (6,453) --
Retained benefits -- -- -- (34,307) --
Risk contributions -- -- -- 140,411 --
Selling expenses -- -- -- (178,190) --
Other operation income (expenses) -- -- -- (11,380) --
Administrative expenses -- -- -- (187,812) --
Taxes expenses -- -- -- (63,364) --
Capitalization Plans income -- -- -- --
Net securities capitalization -- -- -- -- 781,743
Fundraising with bonds -- -- -- -- 4,533,719
Change in provision for redemption -- -- -- -- (3,751,976)
Change in technical provisions -- -- -- -- 1,978
Raffle results -- -- -- -- (170,798)
Selling expenses -- -- -- -- (304,678)
Other operation income (expenses) -- -- -- -- (1,058)
Administrative expenses -- -- -- -- (54,451)
Taxes expenses -- -- -- -- (36,345)
Result from interest income -- -- -- 231,854 11,409
Interest income -- -- -- 1,593,704 415,915
Interest expenses -- -- -- (1,361,850) (404,506)
Equity in earnings (23,774) (5,021) (4,622) 7,140 21
Operating results 902,861 253,870 120,412 708,132 227,821
Non current assets results 32 (6) 8 52 --
Income before taxes 902,893 253,864 120,420 708,184 227,821
Interest taxes (299,095) (81,912) (99,992) (275,075) (91,968)
Results participation (8,002) (28,574) -- (7,637) (2,541)
Net income 595,796 143,378 20,428 425,472 133,312
Attributable to Group BB Seguridade 446,787 71,689 11,796 319,083 88,870
Attributable to other stockholders’ 149,009 71,689 8,632 106,389 44,442

Notes to the Financial Statements
100
R$ thousand
3nd quarter/2013
Insurance
Life, Mortgage and Rural
Property and Casualty
Reinsurance Private
Pension Plans Capitalization
Plans
Insurance income
Earned premiums 1,248,588 1,937,688 684,990 -- --
Retained premiums 1,520,681 2,122,109 764,400 -- --
Change in technical provisions (272,093) (184,421) (79,410) -- --
Income insurance 1,238 170 -- -- --
Retained claims (428,171) (1,021,427) (493,270) -- --
Costs acquisition (304,054) (400,362) (28,989) -- --
Reinsurance income (91,150) (190,561) 5,712 -- --
Other operation income (expenses) (74,083) (61,190) (6,182) -- --
Administrative expenses (65,812) (220,132) (54,976) -- --
Taxes expenses (36,221) (40,944) (17,971) -- --
Result from interest income 94,968 65,174 86,916 -- --
Interest income 113,845 120,079 322,357 -- --
Interest expenses (18,877) (54,905) (235,441) -- --
Private Pension Plans income -- -- -- 33,616 --
Retained contributions -- -- -- 3,694,345 --
Benefits provision -- -- -- (3,660,729) --
Change in technical provisions -- -- -- (12,068) --
Income from management fees and products -- -- -- 270,780 --
Benefits and redemption expenses -- -- -- (2,814) --
Retained benefits -- -- -- (14,103) --
Risk contributions -- -- -- 47,504 --
Selling expenses -- -- -- (61,446) --
Other operation income (expenses) -- -- -- (2,975) --
Administrative expenses -- -- -- (65,438) --
Taxes expenses -- -- -- (22,641) --
Capitalization Plans income -- -- -- --
Net securities capitalization -- -- -- -- 211,625
Fundraising with bonds -- -- -- -- 1,383,223
Change in provision for redemption -- -- -- -- (1,171,598)
Change in technical provisions -- -- -- -- (11,377)
Raffle results -- -- -- -- (57,775)
Selling expenses -- -- -- -- (92,841)
Other operation income (expenses) -- -- -- -- (1,233)
Administrative expenses -- -- -- -- (18,115)
Taxes expenses -- -- -- -- (7,283)
Result from interest income -- -- -- 80,604 24,398
Interest income -- -- -- 1,355,695 167,162
Interest expenses -- -- -- (1,275,091) (142,764)
Equity in earnings (6,848) (2,032) (14,287) 2,380 (50)
Operating results 338,455 66,384 161,943 253,399 47,349
Non current assets results (46) (82) 3 46 --
Income before taxes 338,409 66,302 161,946 253,445 47,349
Interest taxes (113,701) (18,093) (58,298) (97,487) (19,800)
Results participation (3,668) (9,022) -- (2,707) (881)
Net income 221,040 39,187 103,648 153,251 26,668
Attributable to Group BB Seguridade 165,756 19,594 11,796 114,931 17,783
Attributable to other stockholders’ 55,284 19,593 91,852 38,320 8,885

Notes to the Financial Statements
101
8 – Cash and cash equivalents
R$ thousand
Parent Consolidated
Sep 30, 2013 Dec 31, 2012 Sep 30, 2013 Dec 31, 2012
Cash 11 1,500 55 1,624
Cash Equivalents(1) 187,724 -- 1,014,878 1,326,307
Total 187,735 1,500 1,014,933 1,327,931
(1) Composed mainly for use in repurchase agreements backed by Brazilian Treasury Securities (LFT), with Banco do Brasil S.A, with remuneration indexed to 99% of CDI (Interbank deposit rate) and daily liquidity. These investments are used in order to fulfill short financial commitments.
9 – Financial Instruments
a) Financial assets at fair value through profit or loss R$ thousand
Parent Consolidated
Sep 30, 2013 Dec 31, 2012 Sep 30, 2013 Dec 31, 2012
Cost
Value
Fair
Value
Cost
Value
Fair
Value
Cost
Value
Fair
Value
Cost
Value
Fair
Value
Debt instruments
Securities issued by financial companies -- -- -- -- 2,910 2,933 286 291
b) Financial assets available for sale R$ thousand
Parent Consolidated
Sep 30, 2013 Dec 31, 2012 Sep 30, 2013 Dec 31, 2012
Cost
Value
Fair
Value
Cost
Value
Fair
Value
Cost
Value
Fair
Value
Cost
Value
Valor de mercado/
Contábil
Debt instruments
Investments in mutual funds -- -- -- -- 1,850 83 1,850 107

Note
s to
the
Fin
anci
al S
tate
ments
102
10 –
In
vestm
en
t in
Asso
cia
tes
a)
Info
rmati
on
ab
ou
t in
vestm
en
t in
as
so
cia
tes
R
$ t
ho
usa
nd
Co
mp
an
yC
ap
ital
Sto
ck
ho
lders
' eq
uit
y a
dju
ste
d (1
)
Pare
nt
Co
nso
lid
ate
d
Carr
yin
g
am
ou
nt
Mo
vem
en
ts
Ja
n 0
1, 2
01
3 t
o S
ep
30
, 2
01
3
Carr
yin
g
am
ou
nt
Sh
are
of
pro
fit
Carr
yin
g
am
ou
nt
Carr
yin
g
am
ou
nt
Dec 3
1,
20
12
D
ivid
en
ds
Eq
uit
y V
alu
ati
on
A
dju
stm
en
ts
Oth
er
eve
nts
Sh
are
of
pro
fit
Ju
n 3
0,
20
13
Ja
n 0
1, 2
01
3
to S
ep
30
, 201
3
Ju
n 3
0,
20
13
Dec 3
1,
20
12
BB
Seg
uro
s P
art
icip
aç
õe
s S
.A.
3,1
03,2
01
5,9
42,1
44
5,6
03,3
30
(60
0,0
00
)(1
4,5
68)
--953
,38
25,9
42,1
44
----
--
BB
Ma
pfre
SH
1 P
artic
ipaç
ões
S.A
. (2
)2,
050
,19
82,
468
,48
52,
674
,81
5(5
34,
679
)(9
,569
)2,
856
446
,78
72,
580
,21
044
6,7
87
2,5
80,2
10
2,6
74,8
15
Ma
pfre
BB
SH
2 P
artic
ipaç
ões
S.A
. (3
) 1,
968
,38
02,
447
,49
11,
679
,32
3--
(45
0)--
71,6
891,
750
,56
271
,689
1,7
50,5
62
1,6
79,3
23
Bra
silp
rev
Seg
uros
e P
revi
dên
cia
S.A
.
409
,49
81,
300
,33
679
9,0
19
(16
9,2
43)
19--
319
,08
394
8,8
78
319
,08
394
8,8
78
799
,01
9
Bra
silc
ap
Cap
italiz
açã
o S
.A.
(4)
79,0
5425
0,7
74
232
,38
6(4
3,3
29)
----
88,8
5827
7,9
15
88,8
58
277
,91
523
2,3
86
IRB
Bra
sil R
esse
gur
os S
.A. (5
)1,
453
,08
02,
434
,57
3--
--(5
,272
)54
8,1
16
11,7
9655
4,6
40
11,7
9655
4,6
40
--
BB
Cap
italiz
açã
o S
.A.
5,4
005,
528
5,5
21(6
)--
--12
5,5
27--
----
BB
Co
r P
art
icip
aç
õe
s S
.A.
36,2
11259
,78
733,5
44
(39
9,5
63
)(2
1)
1,0
80
624
,74
7259
,78
7--
----
BB
Cor
reto
ra d
e S
egu
ros
e A
dmin
istr
ado
ra d
e B
ens
S.A
.26
,918
251
,21
933
,424
(40
6,9
00)
(21
)--
624
,71
625
1,2
19
----
--
Tota
l 5,6
36,8
74
(99
9,5
63
)(1
4,5
89)
1,0
80
1,5
78,1
29
6,2
01,9
31
938
,21
36,1
12,2
05
5,3
85,5
43
(1
) S
tock
hol
ders
' eq
uity
not
adj
uste
d b
y th
e p
erc
enta
ge
of e
quity
inte
rest
hel
d b
y th
e G
roup
.
(2)
Thi
s in
clud
es, i
n th
e ca
rryi
ng
amo
unt o
f the
inve
stm
ent a
s of
Sep
30
, 201
3 an
d a
s of
Dec
emb
er 3
1, 2
012,
the
am
oun
t of
R$
693
,83
6 th
ous
and
rel
ate
d to
the
goo
dw
ill a
risin
g fr
om t
he p
art
ner
ship
with
Ma
pfre
.
(3)
Thi
s in
clud
es, i
n th
e ca
rryi
ng
amo
unt o
f the
inve
stm
ent a
s of
Sep
30
, 201
3 an
d a
s of
Dec
emb
er 3
1, 2
012,
the
am
oun
t of
R$
97,
704
thou
san
d re
late
d to
th
e g
ood
will
aris
ing
from
the
part
ners
hip
with
Ma
pfre
.
(4)
Thi
s in
clud
es, i
n th
e ca
rryi
ng
amo
unt o
f the
inve
stm
ent a
s of
Sep
30
, 201
3 an
d a
s of
Dec
emb
er 3
1, 2
012,
the
am
oun
t of
R$
110,
749
thou
san
d re
latin
g to
the
goo
dw
ill a
risin
g fr
om t
he a
cqui
sitio
n of
Sul
aca
p b
y B
B S
egu
ros,
oc
curr
ed in
Jul
y 2
2, 2
011
.
(5)
Incl
ude
s th
e ca
rryi
ng a
mo
unt
of t
he in
vest
men
t bal
ance
of R
$ 5
8,1
50 th
ousa
nd
rela
ted
to g
ood
will
on
acq
uisi
tion
of t
he I
RB
hel
d on
Ag
o 2
7, 2
013
, as
not
e 2.

Note
s to
the
Fin
anci
al S
tate
ments
103
R$ t
ho
usa
nd
Co
mp
an
yC
ap
ital
Sto
ck
ho
lders
' eq
uit
y a
dju
ste
d (1
)
Pare
nt
Co
nso
lid
ate
d
Carr
yin
g
am
ou
nt
Mo
vem
en
ts
Ju
l 01
, 2
01
3 t
o S
ep
30,
20
13
C
arr
yin
g
am
ou
nt
Sh
are
of
pro
fit
Carr
yin
g
am
ou
nt
Carr
yin
g
am
ou
nt
Ju
n 3
0,
20
13
D
ivid
en
ds
Eq
uit
y V
alu
ati
on
A
dju
stm
en
tsO
ther
eve
nts
Sh
are
of
pro
fit
Sep
30,
20
13
3n
d
qu
art
er/
20
13
S
ep
30,
20
13
Ju
n 3
0,
20
13
BB
Seg
uro
s P
art
icip
aç
õe
s S
.A.
3,1
03,2
01
5,9
42,1
44
5,6
10,8
32
--(6
,233
)--
337
,54
55,9
42,1
44
----
--
BB
Ma
pfre
SH
1 P
artic
ipaç
ões
S.A
. (2
)2,
050
,19
82,
468
,48
52,
950
,75
0(5
34,
679
)(1
,617
)--
165
,75
62,
580
,21
016
5,7
56
2,5
0,2
102,
950
,75
0
Ma
pfre
BB
SH
2 P
artic
ipaç
ões
S.A
. (3
) 1,
968
,38
02,
447
,49
11,
731
,02
2--
(54
)--
19,5
941,
750
,56
219
,594
1,7
50,5
62
1,7
31,
022
Bra
silp
rev
Seg
uros
e P
revi
dên
cia
S.A
.
409
,49
81,
300
,33
693
1,8
84
(97
,94
2)5
--11
4,93
194
8,8
78
114,
931
948
,87
893
1,8
84
Bra
silc
ap
Cap
italiz
açã
o S
.A. (
4)
79,0
5425
0,7
74
260
,15
1--
----
17,7
6427
7,9
15
17,7
6427
7,9
15
260
,15
1
IRB
Bra
sil R
esse
gur
os S
.A. (
5)1,
453
,08
02,
434
,57
3--
--
(
5,2
72)
548
,11
611
,796
554
,64
011
,796
554
,64
0--
BB
Cap
italiz
açã
o S
.A.
5,4
005,
528
5,5
08--
----
195,
527
----
--
BB
Co
r P
art
icip
aç
õe
s S
.A.
36,2
11259
,78
741,8
53
--(8
)--
217
,94
2259
,78
7--
----
BB
Cor
reto
ra d
e S
egu
ros
e A
dmin
istr
ado
ra d
e B
ens
S.A
.26
,918
251
,21
933
,411
--(8
)--
217
,81
625
1,2
19
----
--
Tota
l 5,6
52,6
85
--(6
,241
)--
555
,48
76,2
01,9
31
329
,84
16,1
12,2
05
5,8
73,8
07
(1)
Sto
ckh
olde
rs' e
qui
ty n
ot a
djus
ted
by
the
pe
rce
nta
ge
of e
quity
inte
rest
hel
d b
y th
e G
roup
.
(2)
Thi
s in
clud
es, i
n th
e ca
rryi
ng
amo
unt o
f the
inve
stm
ent a
s of
Sep
30
, 201
3 an
d a
s of
Dec
emb
er 3
1, 2
012,
the
am
oun
t of
R$
693
,83
6 th
ous
and
rel
ate
d to
the
goo
dw
ill a
risin
g fr
om t
he p
art
ner
ship
with
Ma
pfre
.
(3)
Thi
s in
clud
es, i
n th
e ca
rryi
ng
amo
unt o
f the
inve
stm
ent a
s of
Sep
30
, 201
3 an
d a
s of
Dec
emb
er 3
1, 2
012,
the
am
oun
t of
R$
97,
704
thou
san
d re
late
d to
th
e g
ood
will
aris
ing
from
the
part
ners
hip
with
Ma
pfre
.
(4)
Thi
s in
clud
es, i
n th
e ca
rryi
ng
amo
unt o
f the
inve
stm
ent a
s of
Sep
30
, 201
3 an
d a
s of
Dec
emb
er 3
1, 2
012,
the
am
oun
t of
R$
110,
749
thou
san
d re
latin
g to
the
goo
dw
ill a
risin
g fr
om t
he a
cqui
sitio
n of
Sul
aca
p b
y B
B S
egu
ros,
oc
curr
ed in
Jul
y 2
2, 2
011
.
(5)
Incl
ude
s th
e ca
rryi
ng a
mo
unt
of t
he in
vest
men
t bal
ance
of R
$ 5
8,1
50 th
ousa
nd
rela
ted
to g
ood
will
on
acq
uisi
tion
of t
he I
RB
hel
d on
Ag
o 2
7, 2
013
, as
not
e 2.
b)
Oth
er
info
rmati
on
Div
idends
an
d i
nte
rest
on e
qu
ity r
ece
ived f
rom
inve
stm
ents
were
R$ 8
67,2
38 t
housa
nd a
s of
Septe
mber
30,
201
3 a
nd $
590,1
97 t
ho
usa
nd a
s of
Dece
mber
31, 2
012
.
The s
hare
s of
the in
vest
men
ts m
entio
ned a
bove
are
not re
gu
larl
y tr
ade
d o
n s
tock
exc
hang
es.
An
y of
inve
stm
ents
mentio
ned a
bo
ve p
rese
nte
d s
ign
ifica
nt
rest
rict
ions
to t
ransf
er
reso
urc
es
in d
ivid
ends
by
cash
or
to r
epa
y lo
ans
or
adva
nce
s in
the t
hird
quart
er
of
2013.
There
are
no d
isco
ntin
ued o
pera
tions
in in
vest
ment
in a
ssoci
ate
s.

Note
s to
the
Fin
anci
al S
tate
ments
104
c)
Desc
rip
tio
n o
f th
e o
pera
tio
nal co
nte
xt
of
eq
uit
y i
nv
estm
en
ts, b
y b
usin
es
s s
eg
men
t
Seg
me
nt/
Lin
e o
f b
usin
es
s
Descri
pti
on
% o
f to
tal
sh
are
Sep
30,
20
13
Tota
l C
om
mo
n
Ins
ura
nc
e, P
rivate
Pe
nsio
n P
lan
s a
nd
Ca
pit
aliza
tio
n
Seg
me
nt
Ins
ura
nc
e –
Lif
e,
Mo
rtg
ag
e l
ife i
ns
ura
nce a
nd
Ru
ral
BB
Ma
pfre
SH
1 P
artic
ipaç
ões
S.A
.
Act
ing
as a
hol
ding
com
pan
y fo
r th
e o
ther
com
pani
es w
hich
de
al w
ith li
fe, re
al s
tate
and
ag
ricul
tura
l ins
ura
nce
. 74
,99
49
,99
Ma
pfre
Vid
a S
.A
Act
ing
in t
he li
fe in
sura
nce
seg
me
nt in
gen
eral
and
priv
ate
pen
sion
, inc
ome
an
d a
nnui
ty.
74,9
9
49,9
9
Vid
a S
egu
rad
ora
S.A
Act
ing
in t
he li
fe in
sura
nce
seg
me
nt in
gen
eral
.74
,99
49
,99
Com
panh
ia d
e S
egu
ros
Alia
nça
do
Bra
sil
Act
ing
in t
he p
ers
ona
l ris
k se
gme
nt,
rura
l and
hou
sin
g in
sura
nce.
74
,99
49
,99
Ins
ura
nc
e –
Pro
pert
y a
nd
Ca
su
alt
y
Ma
pfre
BB
SH
2 P
artic
ipaç
ões
S.A
.
Act
ing
as a
hol
ding
com
pan
y fo
r ot
her
com
pani
es w
hich
dea
l with
dam
age
insu
ranc
e, i
nclu
ding
veh
icle
insu
ran
ce a
nd
exc
ludi
ng
real
st
ate
and
ag
ricul
tura
l in
sura
nce.
50
,00
49
,00
Ma
pfre
Affi
nity
Se
gura
dora
S.A
. A
ctin
g in
the
insu
ranc
e an
d co
insu
ranc
e se
gmen
t (li
fe a
nd n
on-
life
insu
ranc
e).
50,0
0
49,0
0
Bra
silv
eíc
ulos
Com
panh
ia d
e S
egu
ros
Act
ing
in t
he d
ama
ge in
sura
nce
segm
ent
, ski
lled
in v
ehic
le m
odal
ity.
50,0
0
49,0
0
Ma
pfre
Se
guro
s G
era
is S
.A.
Act
ing
in t
he in
sura
nce
and
coin
sura
nce
segm
ent
(life
and
no
n-lif
e in
sura
nce)
50
,00
49
,00
Ma
pfre
Ass
istê
ncia
S.A
24
hou
rs a
ssis
tan
ce o
per
ato
r fo
cuse
d o
n d
amag
e in
sura
nce
segm
ent.
50
,00
49
,00
Alia
nça
do
Bra
sil S
egu
ros
S.A
Act
ing
in t
he li
fe in
sura
nce
seg
me
nt in
gen
eral
.50
,00
49
,00
Rein
su
ran
ce
IRB
Bra
sil R
esse
gur
os S
.A.
Act
ing
in t
he r
eins
ura
nce
seg
me
nt in
the
coun
try
and
abr
oad
. 20
,51
20
,51
Cap
italiza
tio
n
Bra
silc
ap
Cap
italiz
açã
o S
.A.
Dea
ls w
ith c
apita
lizat
ion
plan
s a
nd o
the
r p
rod
ucts
and
ser
vice
s th
at c
apita
liza
tion
com
pani
es a
re a
llow
ed t
o p
rovi
de.
66
,66
49
,99
BB
Cap
italiz
açã
o S
.A.
Issu
e a
nd t
radi
ng
of c
api
taliz
atio
n pl
ans
in a
ccor
da
nce
with
the
legi
slat
ion
10
0,0
0
100
,00
Pri
vate
Pe
nsio
n P
lan
s
Bra
silp
rev
Seg
uros
e P
revi
dên
cia
S.A
.D
eals
with
life
insu
ran
ce w
ith s
urvi
vor
cove
rag
e a
nd
with
pri
vate
ret
irem
ent
an
d b
ene
fit p
lans
.
74,9
9
49,9
9
Ma
pfre
Nos
sa C
aixa
Vid
a e
Pre
vidê
ncia
S.A
. B
usin
ess
foc
us o
n li
fe in
sura
nce
an
d pr
ivat
e re
tirem
ent
an
d b
enef
its p
lans
. 74
,99
49
,99
Bro
kera
ge S
eg
me
nt
BB
Cor
reto
ra d
e S
egu
ros
e A
dm. d
e B
ens
S.A
B
roke
rage
of
heal
th,
life
and
non
-life
insu
ranc
e, c
apita
liza
tion
pla
ns,
priv
ate
retir
eme
nt p
lans
and
ass
et m
anag
emen
t.
100
,00
10
0,0
0

Note
s to
the
Fin
anci
al S
tate
ments
105
d)
Bre
akd
ow
n o
f in
co
me b
y seg
men
t in
ac
co
rdan
ce w
ith
In
tern
ati
on
al F
inan
cia
l R
ep
ort
Sta
nd
ard
s
d.1
) In
su
ran
ce, p
riv
ate
pen
sio
n p
lan
s a
nd
cap
itali
zati
on
seg
men
t: In
su
ran
ce –
Lif
e,
mo
rtg
ag
e l
ife in
su
ran
ce a
nd
Ru
ral
R$
th
ou
sa
nd
Ja
n 0
1, 2
01
3 t
o S
ep
30
, 2
01
3
Map
fre V
ida S
.AM
ap
fre
Part
icip
aç
õe
sV
ida S
eg
ura
do
raB
B A
lia
nç
a P
art
icip
aç
õe
sC
ia.
de S
eg
uro
s A
lia
nça
d
o B
rasil
BB
Ma
pfr
e S
H1
Ad
justm
en
ts/
Elim
ina
tio
ns
Tota
l
Issu
ed
prem
ium
s 35
5,6
98
--22
5,8
22
--3,
923
,21
2--
--4,
504
,73
2
Ris
k co
ntri
butio
n
----
----
----
----
Tech
nica
l pro
visi
ons
var
iatio
n
6--
18,9
05--
(1,0
46,4
98)
----
(1,0
27,5
87)
Earn
ed
pre
miu
ms
355
,70
4--
244
,72
7--
2,8
76,7
14
----
3,4
77,1
45
Inco
me
insu
ranc
e
(10
8)--
----
4,8
91--
--4,
783
Ret
ainn
ed c
laim
s (2
60,
136
)--
(12
2,6
56)
--(8
06,
923
)--
--(1
,189
,715
)
Cos
ts a
cqui
sitio
n
(10
1,2
79)
--(2
9,9
45)
--(7
23,
437
)--
--(8
54,
661
)
Oth
er
inco
me/
exp
ense
s (1
0,7
45)
--2,
972
--(1
81,
444
)78
--(1
89,
139
)
rein
sura
nce
inco
me
(2
,611
)--
21--
(22
7,3
88)
----
(22
9,9
78)
Adm
inis
trat
ive
exp
ens
es(2
7,9
54)
--(1
6,4
64)
--(1
45,
229
)(1
,080
)--
(19
0,7
27)
Taxe
s e
xpe
nses
(6
,500
)--
(9,0
91)
--(9
5,0
88)
(29
8)--
(110
,977
)
Inte
res
t in
co
me
16,5
06
--26,0
21
--140
,62
526,7
52
--209
,90
4
Inte
rest
inco
me
28
,957
--31
,928
--19
2,2
02
27,3
88--
280
,47
5
Inte
rest
exp
ens
e
(12
,45
1)--
(5,9
07)
--(5
1,5
77)
(63
6)--
(70
,57
1)
Eq
uit
y in
earn
ing
s
(58
)--
----
110
568
,57
2(5
92,3
98
)(2
3,7
74)
Op
era
tin
g r
es
ult
s
(37
,18
1)
--95,5
85
--842
,83
1594
,02
4(5
92,3
98
)902
,86
1
Non
cur
rent
ass
ets
res
ults
34
----
--(2
)--
--32
Inc
om
e/(
los
s)
be
fore
tax
es
(3
7,1
47)
--95,5
85
--842
,82
9594
,02
4(5
92,3
98
)902
,89
3
Inco
me
tax
10,4
99--
(23
,66
2)--
(15
0,4
60)
(49
4)(9
58)
(16
5,0
75)
Soc
ial C
ontr
ibut
ion
tax
6,4
01--
(14
,37
6)--
(12
5,9
12)
442
(57
5)(1
34,
020
)
Res
ults
par
ticip
atio
n
(4,2
89)
--(8
6)
--(3
,627
)--
--(8
,002
)
Net
inc
om
e/(
los
s)
(24
,53
6)
--57,4
61
--562
,83
0593
,97
2(5
93,9
31
)595
,79
6
Attr
ibut
abl
e to
Gru
po B
B S
egu
rida
de(1
8,4
00)
--43
,090
--42
2,0
66
445
,42
0(4
45,
389
)44
6,7
87
Attr
ibut
abl
e to
oth
er s
tock
hold
ers
(6,1
36)
--14
,371
--14
0,7
64
148
,55
2(1
48,
542
)14
9,0
09

Note
s to
the
Fin
anci
al S
tate
ments
106
R$ t
ho
usa
nd
3n
d q
uart
er/
201
3
Map
fre V
ida S
.AV
ida S
eg
ura
do
raC
ia.
de S
eg
uro
s A
lia
nça
d
o B
rasil
BB
Ma
pfr
e S
H1
Ad
justm
en
ts/
Elim
ina
tio
ns
Tota
l
Issu
ed
prem
ium
s 11
0,10
258
,130
1,3
52,4
49
----
1,5
20,6
81
Ris
k co
ntri
butio
n
----
----
----
Tech
nica
l pro
visi
ons
var
iatio
n
1,0
8113
,895
(28
7,0
69)
----
(27
2,0
93)
Earn
ed
pre
miu
ms
11
1,1
83
72,0
25
1,0
65,3
80
----
1,2
48,5
88
Inco
me
insu
ranc
e
(32
)--
1,2
70--
--1,
238
Ret
ainn
ed c
laim
s (8
5,5
21)
(37
,61
5)(3
05,
035
)--
--(4
28,
171
)
Cos
ts a
cqui
sitio
n
(30
,99
4)(1
0,6
14)
(26
2,4
46)
----
(30
4,0
54)
Oth
er
inco
me/
exp
ense
s (2
,347
)2,
023
(73
,83
7)78
--(7
4,0
83)
rein
sura
nce
inco
me
1,
641
1,5
14(9
4,3
05)
----
(91
,15
0)
Adm
inis
trat
ive
exp
ens
es(8
,133
)(4
,074
)(5
3,1
28)
(47
7)--
(65
,81
2)
Taxe
s e
xpe
nses
(1
,846
)(2
,492
)(3
1,7
55)
(12
8)--
(36
,22
1)
Inte
res
t in
co
me
6,2
20
10,8
57
72,9
48
4,9
43
--94,9
68
Inte
rest
inco
me
11
,101
12,4
7085
,317
4,9
57--
113,
845
Inte
rest
exp
ens
e
(4,8
81)
(1,6
13)
(12
,36
9)(1
4)
--(1
8,8
77)
Eq
uit
y in
earn
ing
s
(19
)--
37
215
,71
3(2
22,5
79
)(6
,848
)
Op
era
tin
g r
es
ult
s
(9,8
48
)31,6
24
319
,12
9220
,12
9(2
22,5
79
)338
,45
5
Non
cur
rent
s as
sets
res
ult
34--
(2)
(78
)--
(46
)
Inc
om
e/(
los
s)
be
fore
tax
es
(9
,814
)31,6
24
319
,12
7220
,05
1(2
22,5
79
)338
,40
9
Inco
me
tax
2,7
64(7
,501
)(5
8,0
71)
633
(95
8)(6
3,1
33)
Soc
ial C
ontr
ibut
ion
tax
1,6
58(4
,762
)(4
7,4
09)
520
(57
5)(5
0,5
68)
Res
ults
par
ticip
atio
n
(1,3
42)
(29
)(2
,297
)--
--(3
,668
)
Net
inc
om
e/(
los
s)
(6,7
34
)19,3
32
211
,35
0221
,20
4(2
24,1
12
)221
,04
0
Attr
ibut
abl
e to
Gru
po B
B S
egu
rida
de(5
,050
)14
,497
158
,49
016
5,8
81
(16
8,0
62)
165
,75
6
Attr
ibut
abl
e to
oth
er s
tock
hold
ers
(1,6
84)
4,8
3552
,860
55,3
23(5
6,0
50)
55,2
84

Note
s to
the
Fin
anci
al S
tate
ments
107
d.2
) In
su
ran
ce, p
riv
ate
pe
nsio
n p
lan
s a
nd
cap
italiza
tio
n s
eg
men
t: In
su
ran
ce
– P
rop
ert
y a
nd
casu
alt
y
R$ t
ho
usa
nd
Ja
n 0
1, 2
01
3 t
o S
ep
30
, 2
01
3
Ali
an
ça d
o B
rasil
S
eg
uro
sB
rasil
veíc
ulo
sM
ap
fre S
eg
uro
s
Gera
isM
ap
fre A
ffin
ity
Seg
ura
do
raM
ap
fre
Assis
tên
cia
Map
fre B
B S
H2
Ad
justm
en
ts/
Elim
ina
tio
ns
Tota
l
Issu
ed
prem
ium
53
4,4
61
1,3
81,7
25
3,2
98,3
28
571
,74
5--
----
5,7
86,2
59
----
----
----
----
Ris
k co
ntri
butio
n
----
----
----
----
Tech
nica
l pro
visi
ons
var
iatio
n
(82
,94
6)(3
7,7
47)
(21
3,2
78)
14,1
16--
----
(31
9,8
55)
Earn
ed
pre
miu
ms
451
,51
51,3
43,9
78
3,0
85,0
50
585
,86
1--
----
5,4
66,4
04
Inco
me
insu
ranc
e
1,7
17(8
14)
(1,3
34)
2--
----
(42
9)
Ret
ainn
ed c
laim
s (1
28,
516
)(8
30,
079
)(1
,835
,449
)(1
96,
467
)--
----
(2,9
90,5
11)
Cos
ts a
cqui
sitio
n
(16
8,11
6)(1
46,
051
)(5
89,
722
)(2
64,
162
)--
----
(1,1
68,0
51)
Oth
er
inco
me/
exp
ense
s (2
5,6
30)
(64
,16
5)(6
6,5
75)
(15
,28
4)2,
832
----
(16
8,8
22)
rein
sura
nce
inco
me
(3
5,8
82)
--(2
17,
024
)(7
65)
----
--(2
53,
671
)
Adm
inis
trat
ive
exp
ens
es(3
8,3
98)
(19
4,7
45)
(32
5,7
45)
(66
,60
7)(2
,482
)(1
,136
)--
(62
9,11
3)
Taxe
s e
xpe
nses
(1
6,1
01)
(28
,44
5)(6
0,1
73)
(22
,69
5)(2
,411
)(1
28)
--(1
29,
953
)
Inte
res
t in
co
me
21,0
80
21,5
26
72,6
05
17,3
75
96
355
--133
,03
7
Inte
rest
inco
me
33
,476
50,3
4415
4,9
51
24,4
9696
355
--26
3,7
18
Inte
rest
exp
ens
e
(12
,39
6)(2
8,8
18)
(82
,34
6)(7
,121
)--
----
(13
0,6
81)
Eq
uit
y in
earn
ing
s
--89
21,3
25
(3)
--143
,16
4(1
69,5
96
)(5
,021
)
Op
era
tin
g r
es
ult
s
61,6
69
101
,29
482,9
58
37,2
55
(1,9
65
)142
,25
5(1
69,5
96
)253
,87
0
Non
cur
rent
ass
ets
res
ults
(1
)--
(5)
----
----
(6)
Inc
om
e/(
los
s)
be
fore
tax
es
61,6
68
101
,29
482,9
53
37,2
55
(1,9
65
)142
,25
5(1
69,5
96
)253
,86
4
Inco
me
tax
(15
,64
8)(2
2,9
34)
(2,8
04)
(8,9
63)
489
1,3
0527
1(4
8,2
84)
Soc
ial C
ontr
ibut
ion
tax
(9,4
89)
(14
,07
1)(5
,336
)(5
,629
)17
655
816
3(3
3,6
28)
Res
ults
par
ticip
atio
n
1,3
85(3
,139
)(2
6,6
87)
(13
3)--
----
(28
,57
4)
Net
inc
om
e/(
los
s)
37,9
16
61,1
50
48,1
26
22,5
30
(1,3
00
)144
,11
8(1
69,1
62
)143
,37
8
Attr
ibut
abl
e to
Gru
po B
B S
egu
rida
de18
,958
30,5
7524
,063
11,2
65(6
50)
72,0
59(8
4,5
81)
71,6
89
Attr
ibut
abl
e to
oth
er s
tock
hold
ers
18,9
5830
,575
24,0
6311
,265
(65
0)72
,059
(84
,58
1)71
,689

Note
s to
the
Fin
anci
al S
tate
ments
108
R$ t
ho
usa
nd
3n
d q
uart
er/
201
3
Ali
an
ça d
o B
rasil
S
eg
uro
sB
rasil
veíc
ulo
sM
ap
fre S
eg
uro
s
Gera
isM
ap
fre A
ffin
ity
Seg
ura
do
raM
ap
fre
Assis
tên
cia
MA
PF
RE
BB
S
H2
Ad
justm
en
ts/
Elim
ina
tio
ns
Tota
l
Issu
ed
prem
ium
s 16
6,1
41
478
,32
71,
280
,15
819
7,4
83
----
--2,
122
,10
9
Ris
k co
ntri
butio
n
----
----
----
----
Tech
nica
l pro
visi
ons
var
iatio
n
(10
,93
6)(2
8,7
40)
(13
8,8
49)
(5,8
96)
----
--(1
84,
421
)
Earn
ed
pre
miu
ms
155
,20
5449
,58
71,1
41,3
09
191
,58
7--
----
1,9
37,6
88
Inco
me
insu
ranc
e
454
(45
)(2
39)
----
----
170
Ret
ainn
ed c
laim
s (4
9,2
99)
(28
5,6
79)
(61
4,7
26)
(71
,72
3)--
----
(1,0
21,4
27)
Cos
ts a
cqui
sitio
n
(55
,17
9)(4
9,1
72)
(20
7,0
89)
(88
,92
2)--
----
(40
0,3
62)
Oth
er
inco
me/
exp
ense
s (8
,196
)(2
1,7
52)
(24
,65
2)(7
,515
)92
5--
(61
,19
0)
rein
sura
nce
inco
me
(1
3,8
93)
--(1
76,
457
)(2
11)
----
--(1
90,
561
)
Adm
inis
trat
ive
exp
ens
es(1
3,1
91)
(63
,76
0)(1
19,9
32)
(22
,03
3)(8
17)
(39
9)--
(22
0,1
32)
Taxe
s e
xpe
nses
(5
,707
)(9
,215
)(1
8,2
80)
(6,8
42)
(84
4)(5
6)
--(4
0,9
44)
Inte
res
t in
co
me
10,4
06
20,3
17
27,1
64
7,1
63
52
72
--65,1
74
Inte
rest
inco
me
13
,495
30,9
8165
,435
10,0
4452
72--
120
,07
9
Inte
rest
exp
ens
e
(3,0
89)
(10
,66
4)(3
8,2
71)
(2,8
81)
----
--(5
4,9
05)
Eq
uit
y in
earn
ing
s
----
567
(1)
--38,9
54
(41
,55
2)
(2,0
32
)
Op
era
tin
g r
es
ult
s
20,6
00
40,2
81
7,6
65
1,5
03
(68
4)
38,5
71
(41
,55
2)
66,3
84
Non
cur
rent
ass
ets
res
ults
(1
)--
(81
)--
----
--(8
2)
Inc
om
e/(
los
s)
be
fore
tax
es
20,5
99
40,2
81
7,5
84
1,5
03
(68
4)
38,5
71
(41
,55
2)
66,3
02
Inco
me
tax
(5,6
14)
(7,9
57)
2,6
51(6
2)
169
453
271
(10
,08
9)
Soc
ial C
ontr
ibut
ion
tax
(3,3
72)
(5,0
77)
310
(28
1)61
192
163
(8,0
04)
Res
ults
par
ticip
atio
n
1,8
34(1
,541
)(9
,281
)(3
4)
----
--(9
,022
)
Net
inc
om
e/(
los
s)
13,4
47
25,7
06
1,2
64
1,1
26
(45
4)
39,2
16
(41
,11
8)
39,1
87
Attr
ibut
abl
e to
Gru
po B
B S
egu
rida
de6,
724
12,8
5363
256
3(2
27)
19,6
08(2
0,5
59)
19,5
94
Attr
ibut
abl
e to
oth
er s
tock
hold
ers
6,7
2312
,853
632
563
(22
7)19
,608
(20
,55
9)19
,593

Note
s to
the
Fin
anci
al S
tate
ments
109
d.3
) In
su
ran
ce, p
riv
ate
pe
nsio
n p
lan
s a
nd
cap
italiza
tio
n s
eg
men
t: R
ein
su
ran
ce
R
$ t
ho
usa
nd
IRB
– B
rasil
Re
ss
eg
uro
s S
.A.
Ju
l 01
, 2
01
3 t
o S
ep
30,
20
13
3n
d q
uart
er/
201
3
Issu
ed
prem
ium
s 1.
961
.72
676
4,4
00
Ris
k co
ntri
butio
n
----
Tech
nica
l pro
visi
ons
var
iatio
n
(42
.82
7)(7
9,4
10)
Earn
ed
pre
miu
ms
1.9
18.8
99
684
,99
0
Inco
me
insu
ranc
e
----
Ret
ainn
ed c
laim
s (1
.908
.958
)(4
93,
270
)
Cos
ts a
cqui
sitio
n
(67
.27
9)(2
8,9
89)
Oth
er
inco
me/
exp
ense
s (2
.991
)(6
,182
)
Inco
me
from
ret
roce
ssio
n
231
.74
75,
712
Adm
inis
trat
ive
exp
ens
es(1
51.
671
)(5
4,9
76)
Taxe
s e
xpe
nses
(5
5.7
89)
(17
,97
1)
Inte
res
t in
co
me
161
.07
686,9
16
Inte
rest
inco
me
60
3.4
27
322
,35
7
Inte
rest
exp
ens
e
(44
2.3
51)
(23
5,4
41)
Eq
uit
y in
earn
ing
s
(4.6
22
)(1
4,2
87)
Op
era
tin
g r
es
ult
s
120
.41
2161
,94
3
Non
cur
rent
ass
ets
res
ults
8
3
Inc
om
e/(
los
s)
be
fore
tax
es
120
.42
0161
,94
6
Inco
me
tax
(62
.15
4)(3
6,2
33)
Soc
ial C
ontr
ibut
ion
tax
(37
.83
8)(2
2,0
65)
Res
ults
par
ticip
atio
n
----
Net
inc
om
e/(
los
s)
20.4
28
103
,64
8
Attr
ibut
abl
e to
Gru
po B
B S
egu
rida
de11
.796
11,7
96
Attr
ibut
abl
e to
oth
er s
tock
hold
ers
8.6
3291
,852

Note
s to
the
Fin
anci
al S
tate
ments
110
d.4
) In
su
ran
ce, p
riv
ate
pe
nsio
n p
lan
s a
nd
cap
italiza
tio
n s
eg
men
t: C
ap
itali
zati
on
R
$ t
ho
usa
nd
Ja
n 0
1, 2
01
3 t
o S
ep
30
, 2
01
3
Bra
sil
ca
p C
ap
italiza
çã
o S
.A.
BB
Ca
pit
ali
zaçã
oA
dju
stm
en
ts/
Elim
ina
tio
ns
Tota
l
Col
lect
ion
with
sav
ings
bo
nds
4,5
33,7
19
----
4,5
33,7
19
Tech
nica
l pro
visi
ons
var
iatio
n to
red
empt
ion
(3
,751
,976
)--
--(3
,751
,976
)
Net
se
cu
riti
es c
ap
italiza
tio
n
781
,74
3--
--781
,74
3
Tech
nica
l pro
visi
on
cha
nge
s 1,
978
----
1,9
78
Raf
fle r
esu
lts
(17
0,7
98)
----
(17
0,7
98)
Sel
ling
exp
ense
s (3
04,
678
)--
--(3
04,
678
)
Res
ult
s
308
,24
5--
--308
,24
5
Oth
er
inco
me/
(exp
ens
es)
(9
50)
(10
8)--
(1,0
58)
Adm
inis
trat
ive
exp
ens
es(5
4,3
33)
(118
)--
(54
,45
1)
Tax
exp
ens
es
(36
,29
3)(5
2)
--(3
6,3
45)
Cap
italiza
tio
n r
es
ult
s
216
,66
9(2
78)
--216
,39
1
Fin
an
cia
l re
su
lts
11
,109
300
--11
,409
Inte
rest
inco
me
41
5,6
15
300
--41
5,9
15
Inte
rest
exp
ens
e
(40
4,5
06)
----
(40
4,5
06)
Eq
uit
y in
earn
ing
s
21
----
21
Op
era
tin
g i
nc
om
e
227
,79
922
--227
,82
1
Non
cur
rent
ass
ets
res
ults
--
----
--
Inc
om
e/(
los
s)
be
fore
tax
es
227
,79
922
--227
,82
1
Inco
me
tax
(52
,26
5)(5
)--
(52
,27
0)
Soc
ial C
ontr
ibut
ion
tax
(39
,69
3)(5
)--
(39
,69
8)
Res
ults
par
ticip
atio
n
(2,5
41)
----
(2,5
41)
Net
inc
om
e/(
los
s)
133
,30
012
--133
,31
2
Attr
ibut
abl
e to
Gru
po B
B S
egu
rida
de
88,8
5812
--88
,870
Attr
ibut
abl
e to
oth
er s
tock
hold
ers
44,4
42--
--44
,442

Note
s to
the
Fin
anci
al S
tate
ments
111
R$ T
ho
usa
nd
3n
d q
uart
er/
201
3
Bra
sil
ca
p C
ap
italiza
çã
o S
.A.
BB
Ca
pit
ali
zaçã
oA
dju
stm
en
ts/
Elim
ina
tio
ns
Tota
l
Col
lect
ion
with
sav
ings
bo
nds
1,3
83,2
23
----
1,3
83,2
23
Tech
nica
l pro
visi
ons
var
iatio
n to
red
empt
ion
(1
,171
,598
)--
--(1
,171
,598
)
Net
se
cu
riti
es c
ap
italiza
tio
n
211
,62
5--
--211
,62
5
Tech
nica
l pro
visi
on
cha
nge
s (1
1,37
7)--
--(1
1,37
7)
Raf
fle r
esu
lts
(57
,77
5)--
--(5
7,7
75)
Sel
ling
exp
ense
s (9
2,8
41)
----
(92
,84
1)
Res
ult
s
49,6
32
----
49,6
32
Oth
er
inco
me/
(exp
ens
es)
(1
,166
)(6
7)
--(1
,233
)
Adm
inis
trat
ive
exp
ens
es(1
8,1
11)
(4)
--(1
8,1
15)
Tax
exp
ens
es
(7,2
67)
(16
)--
(7,2
83)
Cap
italiza
tio
n r
es
ult
s
23,0
88
(87
)--
23,0
01
Fin
an
cia
l re
su
lts
24,2
84
114
--24,3
98
Inte
rest
inco
me
16
7,0
49
113
--16
7,1
62
Inte
rest
exp
ens
e
(14
2,7
65)
1--
(14
2,7
64)
Eq
uit
y in
earn
ing
s
(50
)--
--(5
0)
Op
era
tin
g i
nc
om
e
47,3
22
27
--47,3
49
Non
cur
rent
ass
ets
res
ults
--
----
--
Inc
om
e/(
los
s)
be
fore
tax
es
47,3
22
27
--47,3
49
Inco
me
tax
(7,5
26)
(3)
--(7
,529
)
Soc
ial C
ontr
ibut
ion
tax
(12
,26
6)(5
)--
(12
,27
1)
Res
ults
par
ticip
atio
n
(88
1)--
--(8
81)
Net
inc
om
e/(
los
s)
26,6
49
19
--26,6
68
Attr
ibut
abl
e to
Gru
po B
B S
egu
rida
de17
,764
19--
17,7
83
Attr
ibut
abl
e to
oth
er s
tock
hold
ers
8,8
85--
--8,
885
d.5
) In
su
ran
ce,
Pri
vate
Pe
nsio
n P
lan
s a
nd
Cap
italiza
tio
n S
eg
men
t: P
riv
ate
Pen
sio
n P
lan
s
R$ t
ho
usa
nd
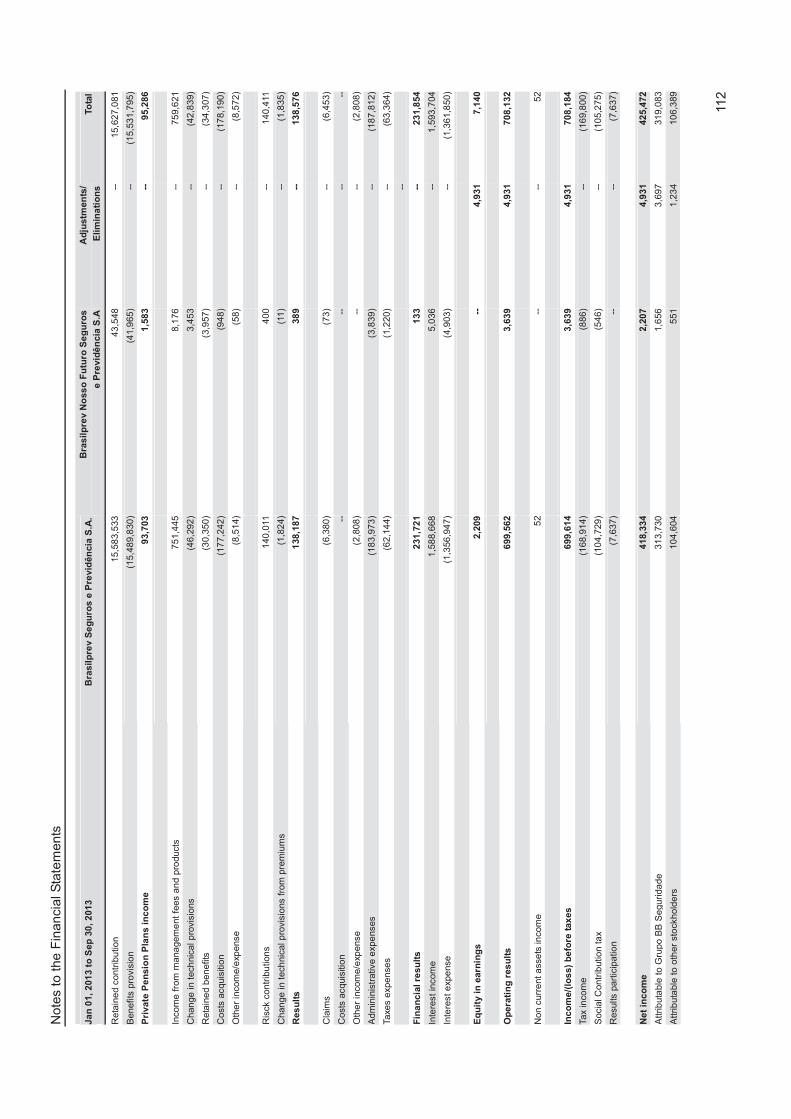
Note
s to
the
Fin
anci
al S
tate
ments
112
Ja
n 0
1, 2
01
3 t
o S
ep
30
, 2
01
3
Bra
sil
pre
v S
eg
uro
s e
Pre
vid
ên
cia
S.A
.B
rasil
pre
v N
oss
o F
utu
ro S
eg
uro
s
e P
revi
dê
ncia
S.A
Ad
justm
en
ts/
Elim
ina
tio
ns
Tota
l
Ret
aine
d co
ntrib
utio
n
1
5,58
3,5
33
43,5
48
-
-
15
,62
7,0
81
Ben
efits
pro
visi
on
(
15,4
89,
830
)
(4
1,9
65)
-
-
(15
,53
1,7
95)
Pri
vate
Pe
nsio
n P
lan
s i
nc
om
e
9
3,7
03
1,5
83
-
-
95,2
86
Inco
me
from
man
age
me
nt f
ees
and
pro
duct
s
75
1,44
5
8
,176
--
759,
621
Cha
nge
in t
ech
nica
l pro
visi
ons
(46,
292
)
3,4
53
-
-
(4
2,8
39)
Ret
aine
d b
enef
its
(30,
350
)
(
3,9
57)
-
-
(3
4,3
07)
Cos
ts a
cqui
sitio
n
(1
77,
242
)
(9
48)
-
-
(1
78,
190
)
Oth
er
inco
me/
exp
ense
(8,5
14)
(58
)
--
(8,
572
)
Ris
ck c
ontr
ibu
tion
s
1
40,0
11
400
--
140
,411
Cha
nge
in t
ech
nica
l pro
visi
ons
from
pre
miu
ms
(1
,82
4)
(11
)
--
(1
,835
)
Res
ult
s
1
38,1
87
38
9
-
- 1
38,5
76
Cla
ims
(6,
380
)
(
73)
-
-
(
6,4
53)
Cos
ts a
cqui
sitio
n
--
--
--
--
Oth
er
inco
me/
exp
ense
(
2,80
8)
--
--
(2,
808
)
Adm
inin
istr
ativ
e e
xpe
nses
(1
83,
973
)
(
3,8
39)
-
-
(1
87,
812
)
Taxe
s e
xpe
nses
(
62,1
44)
(1,
220
) -
-
(6
3,3
64)
-
-
Fin
an
cia
l re
su
lts
2
31,7
21
13
3
-
- 2
31,8
54
Inte
rest
inco
me
1
,58
8,66
8
5,
036
--
1,5
93,7
04
Inte
rest
exp
ens
e
(1,3
56,9
47)
(4,
903
)
--
(1,3
61,
850
)
Eq
uit
y in
earn
ing
s
2
,209
--
4,9
31
7
,140
Op
era
tin
g r
es
ult
s
699,5
62
3,6
39
4,9
31
7
08,1
32
Non
cur
rent
ass
ets
inco
me
5
2
--
-
-
52
Inc
om
e/(
los
s)
be
fore
tax
es
6
99,6
14
3,6
39
4,9
31
7
08,1
84
Tax
inco
me
(1
68,9
14)
(
886
)
--
(
169,
800
)
Soc
ial C
ontr
ibut
ion
tax
(1
04,
729
)
(5
46)
-
-
(10
5,2
75)
Res
ults
par
ticip
atio
n
(7,
637
)
--
-
-
(
7,6
37)
Net
inc
om
e
4
18,3
34
2,2
07
4,9
31
4
25,4
72
Attr
ibut
abl
e to
Gru
po B
B S
egu
rida
de
31
3,73
0
1
,656
3
,69
7
31
9,0
83
Attr
ibut
abl
e to
oth
er s
tock
hold
ers
104,
604
5
51
1
,23
4
10
6,3
89

Note
s to
the
Fin
anci
al S
tate
ments
113
R$ t
ho
usa
nd
3n
d q
uart
er/
201
3
Bra
sil
pre
v S
eg
uro
s e
Pre
vid
ên
cia
S.A
.B
rasil
pre
v N
oss
o F
utu
ro S
eg
uro
s
e P
revid
ên
cia
S.A
Ad
justm
en
ts/
Elim
ina
tio
ns
Tota
l
Ret
aine
d co
ntrib
utio
n
3,6
80,
420
1
3,9
25
-
-
3,
694
,34
5
Ben
efits
pro
visi
on
(3
,647
,314
)
(1
3,41
5)
-
-
(3,
660
,72
9)
Pri
vate
Pe
nsio
n P
lan
s i
nc
om
e
33,1
06
51
0
-
-
33,6
16
Inco
me
from
man
age
me
nt f
ees
and
pro
duct
s
26
7,97
1
2,
809
--
270
,780
Cha
nge
in t
ech
nica
l pro
visi
ons
(13
,73
4)
1,7
59
-
-
(
11,9
75)
Ret
aine
d b
enef
its
(11
,86
9)
(
2,2
34)
-
-
(
14,
103
)
Cos
ts a
cqui
sitio
n
(61
,25
1)
(1
95)
-
-
(6
1,4
46)
Oth
er
inco
me/
exp
ense
(2,2
17)
(34
)
--
(2
,251
)
Ris
ck c
ontr
ibu
tion
s
4
7,37
7
127
--
47
,504
Cha
nge
in t
ech
nica
l pro
visi
ons
from
pre
miu
ms
(8
9)
(4
)
--
(9
3)
Res
ult
s
4
7,2
88
12
3
-
-
47,4
11
Cla
ims
(2
,81
4)
--
-
-
(2,8
14)
Cos
ts a
cqui
sitio
n
--
--
--
--
Oth
er
inco
me/
exp
ense
(
724)
--
--
(724
)
Adm
inin
istr
ativ
e e
xpe
nses
(
64,1
49)
(1,
289
)
--
(65
,438
)
Taxe
s e
xpe
nses
(2
2,25
0)
(391
)
--
(22,
641
)
Fin
an
cia
l re
su
lts
8
0,2
37
36
7
-
-
80,6
04
Inte
rest
inco
me
1
,35
2,40
3
3,
292
--
1,3
55,6
95
Inte
rest
exp
ens
e
(1,
272
,16
6)
(
2,9
25)
-
-
(1
,27
5,0
91)
Eq
uit
y in
earn
ing
s
856
--
1,5
24
2
,380
Op
era
tin
g r
es
ult
s
250,4
50
1,4
25
1,5
24
2
53,3
99
Non
cur
rent
ass
ets
inco
me
4
6
--
-
-
46
Inc
om
e/(
los
s)
be
fore
tax
es
250,4
96
1,4
25
1,5
24
2
53,4
45
Tax
inco
me
(5
9,03
7)
(
356
)
--
(59
,393
)
Soc
ial C
ontr
ibut
ion
tax
(37,
880
)
(2
14)
-
-
(3
8,0
94)
Res
ults
par
ticip
atio
n
(2,
707
)
--
-
-
(
2,7
07)
Net
inc
om
e
1
50,8
72
85
5
1,5
24
153,2
51
Attr
ibut
abl
e to
Gru
po B
B S
egu
rida
de
1
13,1
46
642
1,1
43
11
4,9
31
Attr
ibut
abl
e to
oth
er s
tock
hold
ers
37,
726
2
13
38
1
3
8,3
20
d.6
) B
rok
era
ge S
eg
men
t

Note
s to
the
Fin
anci
al S
tate
ments
114
R$ t
ho
usa
nd
BB
Co
rre
tora
de S
eg
uro
s e
Ad
m.
de B
en
s
Ju
l 01
, 2
01
3 t
o S
ep
30,
20
13
3n
d q
uart
er/
201
3
Op
era
tin
g i
nc
om
e
1,2
30,0
52
425
,49
7
Bro
kera
ge in
com
e
1,2
27,8
48
425
,49
7
Oth
er
ope
ratin
g in
com
e
2,2
04--
Op
era
tin
g e
xp
en
se
s
(31
6,9
64
)(1
06,9
13
)
Adm
inis
trat
ive
exp
ens
es(2
09,
068
)(6
7,9
70)
Oth
er
ope
ratin
g e
xpe
nses
(1
07,
896
)(3
8,9
43)
Op
era
tin
g i
nc
om
e
913
,08
8318
,58
4
Inte
res
t in
co
me
34,9
24
12,1
66
Inte
rest
inco
me
46
,263
19,1
20
Inte
rest
exp
ens
e
(11,
339)
(6,9
54)
Inc
om
e/(
los
s)
be
fore
tax
es
948
,01
2330
,75
0
Taxe
s (3
23,
296
)(1
12,9
34)
Net
inc
om
e
624
,71
6217
,81
6
Attr
ibut
abl
e to
Gru
po B
B S
egu
rida
de62
4,7
16
217
,81
6
Attr
ibut
abl
e to
oth
er s
tock
hold
ers
----
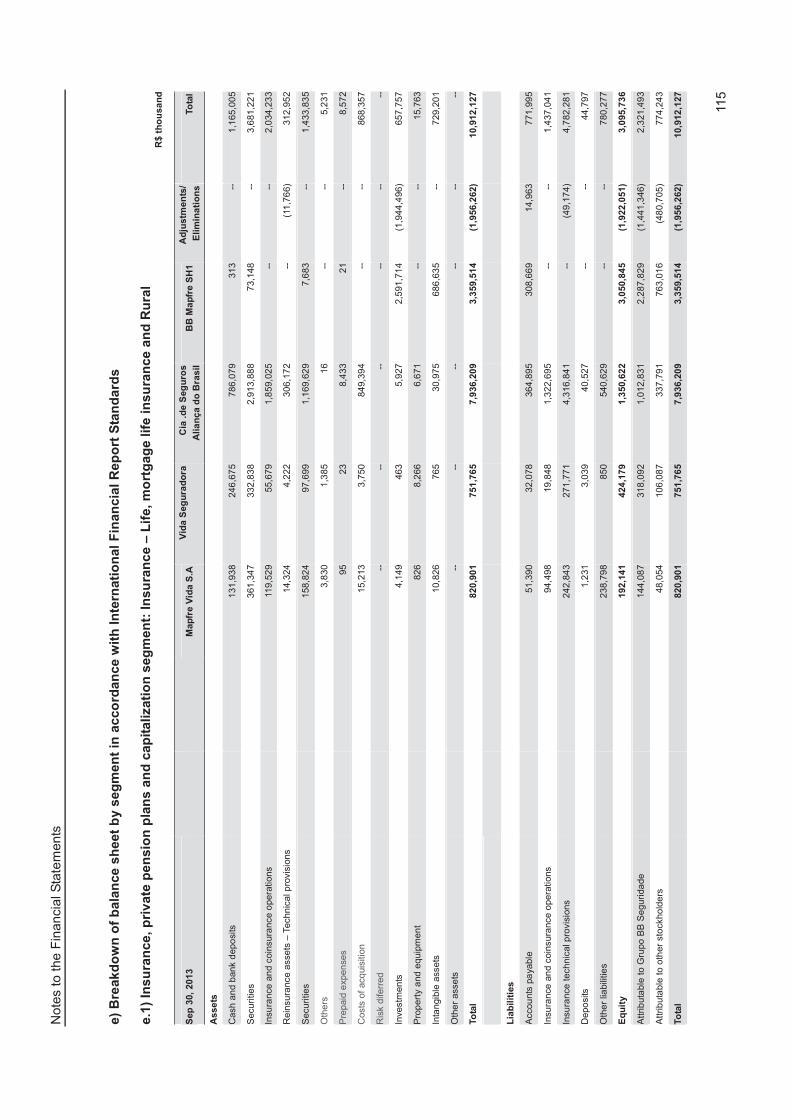
Note
s to
the
Fin
anci
al S
tate
ments
115
e)
Bre
akd
ow
n o
f b
ala
nce s
heet
by
seg
men
t in
acco
rdan
ce w
ith
In
tern
ati
on
al
Fin
an
cia
l R
ep
ort
Sta
nd
ard
s
e.1
) In
su
ran
ce
, p
riv
ate
pe
nsio
n p
lan
s a
nd
cap
italiza
tio
n s
eg
men
t: In
su
ran
ce
– L
ife, m
ort
gag
e lif
e in
su
ran
ce
an
d R
ura
l R
$ t
ho
usa
nd
Sep
30,
20
13
M
ap
fre V
ida S
.AV
ida S
eg
ura
do
raC
ia .
de S
eg
uro
s
Ali
an
ça d
o B
rasil
BB
Ma
pfr
e S
H1
Ad
justm
en
ts/
Elim
ina
tio
ns
Tota
l
Asse
ts
Cas
h an
d b
ank
dep
osi
ts
131
,93
824
6,6
75
786
,07
931
3--
1,1
65,0
05
Sec
uriti
es
361
,34
733
2,8
38
2,9
13,8
88
73,1
48--
3,6
81,2
21
Insu
ranc
e an
d co
insu
ranc
e o
pera
tions
11
9,52
955
,679
1,8
59,0
25
----
2,0
34,2
33
Rei
nsur
anc
e as
sets
– T
echn
ical
pro
visi
ons
14,3
244,
222
306
,17
2--
(11,
766)
312
,95
2
Sec
uriti
es
158
,82
497
,699
1,1
69,6
29
7,6
83--
1,4
33,8
35
Oth
ers
3,
830
1,3
8516
----
5,2
31
Pre
paid
exp
ense
s 95
238,
433
21--
8,5
72
Cos
ts o
f ac
qui
sitio
n
15,2
133,
750
849
,39
4--
--86
8,3
57
Ris
k di
ferr
ed
----
----
----
Inve
stm
ents
4,
149
463
5,9
272,
591
,71
4(1
,944
,496
)65
7,7
57
Pro
per
ty a
nd e
qui
pmen
t 82
68,
266
6,6
71--
--15
,763
Inta
ngib
le a
sset
s 10
,826
765
30,9
7568
6,6
35
--72
9,2
01
Oth
er
asse
ts
----
----
----
Tota
l 820
,90
1751
,76
57,9
36,2
09
3,3
59,5
14
(1,9
56
,262)
10,9
12
,127
Lia
bil
itie
s
Acc
ount
s pa
yabl
e51
,390
32,0
7836
4,8
95
308
,66
914
,963
771
,99
5
Insu
ranc
e an
d co
insu
ranc
e o
pera
tions
94
,498
19,8
481,
322
,69
5--
--1,
437
,04
1
Insu
ranc
e te
chni
cal p
rovi
sion
s 24
2,8
43
271
,77
14,
316
,84
1--
(49
,17
4)4,
782
,28
1
Dep
osi
ts
1,2
313,
039
40,5
27--
--44
,797
Oth
er
liabi
litie
s 23
8,7
98
850
540
,62
9--
--78
0,2
77
Eq
uit
y
192
,14
1424
,17
91,3
50,6
22
3,0
50,8
45
(1,9
22
,051)
3,0
95,7
36
Attr
ibut
abl
e to
Gru
po B
B S
egu
rida
de14
4,0
87
318
,09
21,
012
,83
12,
287
,82
9(1
,441
,346
)2,
321
,49
3
Attr
ibut
abl
e to
oth
er s
tock
hold
ers
48,0
5410
6,0
87
337
,79
176
3,0
16
(48
0,7
05)
774
,24
3
Tota
l 820
,90
1751
,76
57,9
36,2
09
3,3
59,5
14
(1,9
56
,262)
10,9
12
,127

Note
s to
the
Fin
anci
al S
tate
ments
116
R$ t
ho
usa
nd
Dec 3
1,
20
12
M
ap
fre V
ida S
.AV
ida S
eg
ura
do
raC
ia.
de S
eg
uro
s A
lia
nça
d
o B
rasil
BB
Ma
pfr
e S
H1
Ad
justm
en
ts/
Elim
ina
tio
ns
Tota
l
Asse
ts
Cas
h an
d b
ank
dep
osi
ts
24,9
4678
312
3,9
31
17--
149
,67
7
Sec
uriti
es
499
,33
559
7,3
77
2,5
74,0
40
679
,36
7--
4,3
50,1
19
Insu
ranc
e an
d co
insu
ranc
e o
pera
tions
14
1,7
43
36,1
6495
2,0
20
----
1,1
29,9
27
Rei
nsur
anc
e as
sets
– T
echn
ical
pro
visi
ons
11,3
232,
229
213
,04
7--
(10
,41
3)21
6,1
86
Rec
eiva
bles
14
0,4
07
118,
242
1,1
60,6
73
20,5
56--
1,4
39,8
78
Oth
ers
pro
pert
ies
3,4
318,
784
209
----
12,4
24
Pre
paid
exp
ense
s 60
283,
701
----
3,7
89
Diff
erre
d co
sts
12,7
224,
663
565
,41
4--
--58
2,7
99
Diff
erre
d -
risk
----
----
----
Inve
stm
ent
4,2
2640
84,
072
2,2
52,6
87
(1,6
05,4
69)
655
,92
4
Pro
per
ty a
nd e
qui
pmen
t 70
12,
504
15,7
00--
--18
,905
Inta
ngib
le a
sset
s 10
,131
--14
,306
686
,63
5--
711,
072
Oth
ers
--
----
----
--
Tota
l 849
,02
5771
,18
25,6
27,1
13
3,6
39,2
62
(1,6
15
,882)
9,2
70,7
00
Lia
bil
itie
s
Pa
yabl
e a
cco
unts
57
,836
73,2
0040
4,8
36
472
,55
312
,601
1,0
21,0
26
Insu
ranc
e an
d re
insu
ranc
e d
ebts
75
,306
10,0
1662
6,7
48
----
712
,07
0
Tech
nica
l pro
visi
on
22
8,6
99
260
,07
03,
079
,82
2--
(41
,91
6)3,
526
,67
5
Dep
osi
ts
44,6
164,
007
9,2
54--
--57
,877
Oth
er
liabi
litie
s 22
5,7
50
808
521
,98
0--
--74
8,5
38
Eq
uit
y
216
,81
8423
,08
1984
,47
33,1
66,7
09
(1,5
86
,567)
3,2
04,5
14
Attr
ibut
abl
e to
Gru
po B
B S
egu
rida
de16
2,5
92
317
,26
873
8,2
56
2,3
74,7
15
(1,1
89,7
67)
2,4
03,0
64
Attr
ibut
abl
e to
oth
er s
tock
hold
ers
54,2
2610
5,8
13
246
,21
779
1,9
94
(39
6,8
00)
801
,45
0
Tota
l 849
,02
5771
,18
25,6
27,1
13
3,6
39,2
62
(1,6
15
,882)
9,2
70,7
00

Note
s to
the
Fin
anci
al S
tate
ments
117
e.2
) In
su
ran
ce
, p
riv
ate
pe
nsio
n p
lan
s a
nd
cap
italiza
tio
n s
eg
men
t: In
su
ran
ce
– P
rop
ert
y a
nd
casu
alt
y
R
$ t
ho
usa
nd
Sep
30,
20
13
A
lia
nç
a d
o B
rasil
S
eg
uro
sB
rasil
veíc
ulo
sM
ap
fre S
eg
uro
s
Gera
isM
ap
fre A
ffin
ity
Seg
ura
do
raM
ap
fre
Assis
tên
cia
Map
fre
BB
SH
2
Ad
justm
en
ts/
Elim
ina
tio
ns
Tota
l
Asse
ts
Cas
h an
d b
ank
dep
osi
ts
176
,02
225
5,1
81
748
,98
811
8,87
06,
605
70--
1,3
05,7
36
Sec
uriti
es
295
,12
797
3,8
58
1,3
34,5
38
234
,97
11,
661
3,8
59--
2,8
44,0
14
Insu
ranc
e an
d co
insu
ranc
e o
pera
tions
29
8,0
48
600
,78
02,
313
,94
020
9,5
35
----
--3,
422
,30
3
Rei
nsur
anc
e as
sets
– T
echn
ical
pro
visi
ons
119,
267
--95
3,9
74
304
----
(17
,42
5)1,
056
,12
0
Sec
uriti
es
72,3
0374
6,7
13
499
,49
730
6,7
08
3,8
4089
4--
1,6
29,9
55
Oth
ers
20
72,0
1917
6,8
96
1,5
25--
----
250
,46
0
Pre
paid
exp
ense
s 5,
664
1,6
604,
943
16--
15--
12,2
98
Cos
ts o
f ac
qui
sitio
n
79,8
5810
8,2
15
412
,34
527
0,6
98
----
--87
1,1
16
Ris
k di
ferr
ed
----
----
----
----
Inve
stm
ents
32
91,
774
456
,311
358
--2,
542
,44
5(2
,735
,891
)26
5,3
26
Pro
per
ty a
nd e
qui
pmen
t 61
31,
273
92,0
0230
6--
----
94,1
94
Inta
ngib
le a
sset
s 3,
357
19,7
4415
9,4
03
2,6
30--
64,7
39--
249
,87
3
Oth
er
asse
ts
----
----
----
----
Tota
l 1,0
50,6
08
2,7
81,2
17
7,1
52,8
37
1,1
45,9
21
12,1
06
2,6
12,0
22
(2,7
53
,315)
12,0
01
,396
Lia
bil
itie
s
Acc
ount
s pa
yabl
e88
,172
218
,17
532
9,4
67
72,7
2110
,215
55,9
6716
,529
791
,24
6
Insu
ranc
e an
d co
insu
ranc
e o
pera
tions
16
8,7
95
296
,76
377
9,0
70
106
,24
8--
----
1,3
50,8
76
Insu
ranc
e te
chni
cal p
rovi
sion
s 58
1,9
19
1,3
49,3
27
3,5
79,7
17
398
,08
9--
--(5
8,7
46)
5,8
50,3
06
Dep
osi
ts
13,3
1223
,285
212
,93
51,
673
----
--25
1,2
05
Oth
er
liabi
litie
s 24
,772
395
,63
262
6,2
39
105
,48
0--
----
1,1
52,1
23
Eq
uit
y
173
,63
8498
,03
51,6
25,4
09
461
,71
01,8
91
2,5
56,0
55
(2,7
11,0
98)
2,6
05,6
40
Attr
ibut
abl
e to
Gru
po B
B S
egu
rida
de86
,819
249
,01
881
2,7
05
230
,85
594
61,
278
,02
8(1
,355
,549
)1,
302
,82
2
Attr
ibut
abl
e to
oth
er s
tock
hold
ers
86,8
1924
9,0
17
812
,70
423
0,8
55
945
1,2
78,0
27
(1,3
55,5
49)
1,3
02,8
18
Tota
l 1,0
50,6
08
2,7
81,2
17
7,1
52,8
37
1,1
45,9
21
12,1
06
2,6
12,0
22
(2,7
53
,315)
12,0
01
,396
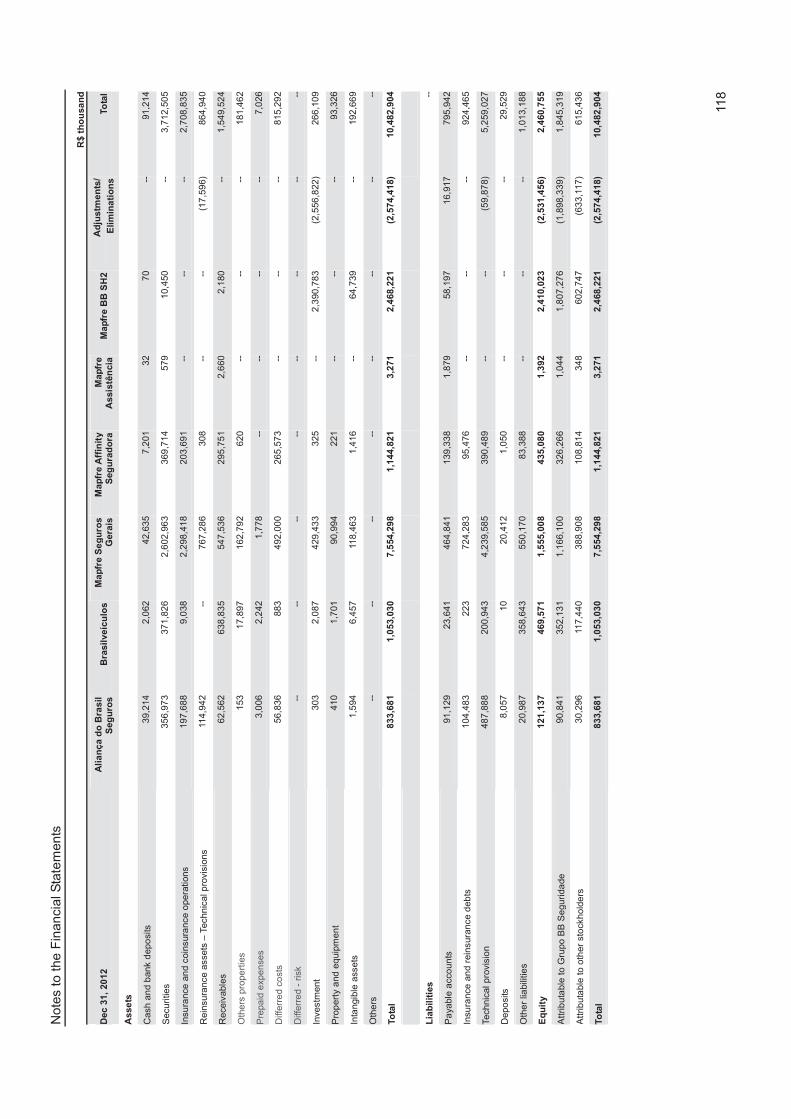
Note
s to
the
Fin
anci
al S
tate
ments
118
R$ t
ho
usa
nd
Dec 3
1,
20
12
A
lia
nç
a d
o B
rasil
S
eg
uro
sB
rasil
veíc
ulo
sM
ap
fre S
eg
uro
s
Gera
isM
ap
fre A
ffin
ity
Seg
ura
do
raM
ap
fre
Assis
tên
cia
Map
fre B
B S
H2
Ad
justm
en
ts/
Elim
ina
tio
ns
Tota
l
Asse
ts
Cas
h an
d b
ank
dep
osi
ts
39,2
142,
062
42,6
357,
201
3270
--91
,214
Sec
uriti
es
356
,97
337
1,8
26
2,6
02,9
63
369
,71
457
910
,450
--3,
712
,50
5
Insu
ranc
e an
d co
insu
ranc
e o
pera
tions
19
7,6
88
9,0
382,
298
,41
820
3,6
91
----
--2,
708
,83
5
Rei
nsur
anc
e as
sets
– T
echn
ical
pro
visi
ons
114,
942
--76
7,2
86
308
----
(17
,59
6)86
4,9
40
Rec
eiva
bles
62
,562
638
,83
554
7,5
36
295
,75
12,
660
2,1
80--
1,5
49,5
24
Oth
ers
pro
pert
ies
153
17,8
9716
2,7
92
620
----
--18
1,4
62
Pre
paid
exp
ense
s 3,
006
2,2
421,
778
----
----
7,0
26
Diff
erre
d co
sts
56,8
3688
349
2,0
00
265
,57
3--
----
815
,29
2
Diff
erre
d -
risk
----
----
----
----
Inve
stm
ent
303
2,0
8742
9,4
33
325
--2,
390
,78
3(2
,556
,822
)26
6,1
09
Pro
per
ty a
nd e
qui
pmen
t 41
01,
701
90,9
9422
1--
----
93,3
26
Inta
ngib
le a
sset
s 1,
594
6,4
5711
8,46
31,
416
--64
,739
--19
2,6
69
Oth
ers
--
----
----
----
--
Tota
l 833
,68
11,0
53,0
30
7,5
54,2
98
1,1
44,8
21
3,2
71
2,4
68,2
21
(2,5
74
,418)
10,4
82
,904
Lia
bil
itie
s
--
Pa
yabl
e a
cco
unts
91
,129
23,6
4146
4,8
41
139
,33
81,
879
58,1
9716
,917
795
,94
2
Insu
ranc
e an
d re
insu
ranc
e d
ebts
10
4,4
83
223
724
,28
395
,476
----
--92
4,4
65
Tech
nica
l pro
visi
on
48
7,8
88
200
,94
34,
239
,58
539
0,4
89
----
(59
,87
8)5,
259
,02
7
Dep
osi
ts
8,0
5710
20,4
121,
050
----
--29
,529
Oth
er
liabi
litie
s 20
,987
358
,64
355
0,1
70
83,3
88--
----
1,0
13,1
88
Eq
uit
y
121
,13
7469
,57
11,5
55,0
08
435
,08
01,3
92
2,4
10,0
23
(2,5
31
,456)
2,4
60,7
55
Attr
ibut
abl
e to
Gru
po B
B S
egu
rida
de90
,841
352
,13
11,
166
,10
032
6,2
66
1,0
441,
807
,27
6(1
,898
,339
)1,
845
,31
9
Attr
ibut
abl
e to
oth
er s
tock
hold
ers
30
,296
117,
440
388
,90
810
8,8
14
348
602
,74
7(6
33,
117)
615
,43
6
Tota
l 833
,68
11,0
53,0
30
7,5
54,2
98
1,1
44,8
21
3,2
71
2,4
68,2
21
(2,5
74
,418)
10,4
82
,904

Note
s to
the
Fin
anci
al S
tate
ments
119
e.3
) In
su
ran
ce
, P
riv
ate
Pe
nsio
n P
lan
s a
nd
Cap
italiza
tio
n S
eg
men
t: R
ein
su
ran
ce
R
$ t
ho
usa
nd
IB
R –
Bra
sil R
es
se
gu
ros S
.A
3n
d q
uart
er/
201
3
Asse
ts
Cas
h an
d b
ank
dep
osi
ts
15,5
41
Sec
uriti
es
5,4
09,0
38
Insu
ranc
e an
d co
insu
ranc
e o
pera
tions
2,
548
,95
2
Rei
nsur
anc
e as
sets
– T
echn
ical
pro
visi
ons
3,6
87,5
75
Rec
eiva
bles
77
4,2
38
Oth
ers
pro
pert
ies
--
Pre
paid
exp
ense
s 2,
372
Diff
erre
d co
sts
--
Diff
erre
d -
risk
--
Inve
stm
ent
239
,71
3
Pro
per
ty a
nd e
qui
pmen
t 32
,520
Inta
ngib
le a
sset
s 36
,467
Oth
ers
--
Tota
l 12,7
46
,417
Lia
bil
itie
s
Pa
yabl
e a
cco
unts
600
,86
1
Insu
ranc
e an
d re
insu
ranc
e d
ebts
1,
546
,82
5
Tech
nica
l pro
visi
on
7,
588
,84
1
Dep
osi
ts
32,8
59
Oth
er
liabi
litie
s 35
3,8
17
Eq
uit
y
2,6
23,2
13
Attr
ibut
abl
e to
Gru
po B
B S
egu
rida
de53
8,0
39
Attr
ibut
abl
e to
oth
er s
tock
hold
ers
2,
085
,17
4
Tota
l 12,7
46
,417

Note
s to
the
Fin
anci
al S
tate
ments
120
e.4
) In
su
ran
ce
, P
riv
ate
Pe
nsio
n P
lan
s a
nd
Cap
italiza
tio
n S
eg
men
t: C
ap
italiza
tio
n
R$ t
ho
usa
nd
Sep
30,
20
13
B
rasil
ca
p C
ap
italiza
çã
oB
B C
ap
itali
zaçã
oA
dju
stm
en
ts/
Elim
ina
tio
ns
Tota
l
Asse
ts
Cas
h an
d b
ank
dep
osi
ts
190
----
190
Sec
uriti
es
8,6
84,7
67
5,5
51--
8,6
90,3
18
Insu
ranc
e an
d co
insu
ranc
e o
pera
tions
62
0,7
71
----
620
,77
1
Pre
paid
exp
ense
s 3,
904
----
3,9
04
Inve
stm
ents
and
go
odw
ill
1,2
77--
--1,
277
Pro
per
ty a
nd e
qui
pmen
t 6,
917
----
6,9
17
Inta
ngib
le a
sset
s 8,
050
----
8,0
50
Oth
er
asse
ts
4,2
595
--4,
264
Tota
l 9,3
30,1
35
5,5
56
--9,3
35,6
91
Lia
bil
itie
s
Tax
liabi
litie
s 80
,558
6--
80,5
64
Cap
italiz
atio
n te
chni
cal p
rovi
sio
ns
3,2
2513
--3,
238
Pro
visi
ons
8,
482
,25
4--
--8,
482
,25
4
Oth
er
liabi
litie
s 51
3,3
24
9--
513
,33
3
Eq
uit
y
250
,77
45,5
28
--256
,30
2
Attr
ibut
abl
e to
Gru
po B
B S
egu
rida
de16
7,1
66
5,5
28--
172
,69
4
Attr
ibut
abl
e to
oth
er s
tock
hold
ers
83,6
08--
--83
,608
Tota
l 9,3
30,1
35
5,5
56
--9,3
35,6
91

Note
s to
the
Fin
anci
al S
tate
ments
121
R$ t
ho
usa
nd
Dec 3
1,
20
12
B
rasil
ca
p C
ap
italiza
çã
oB
B C
ap
itali
zaçã
oA
dju
stm
en
ts/
Elim
ina
tio
ns
Tota
l
Asse
ts
Cas
h an
d b
ank
dep
osi
ts
2,3
78--
--2,
378
Sec
uriti
es
6,7
49,3
86
5,5
63--
6,7
54,9
49
Insu
ranc
e an
d co
insu
ranc
e o
pera
tions
66
8,0
32
----
668
,03
2
Pre
paid
exp
ense
s 1,
436
----
1,4
36
Inve
stm
ents
and
go
odw
ill
1,2
93--
--1,
293
Pro
per
ty a
nd e
qui
pmen
t 9,
173
----
9,1
73
Inta
ngib
le a
sset
s 8,
638
----
8,6
38
Oth
er
asse
ts
----
----
Tota
l 7,4
40,3
36
5,5
63
--7,4
45,8
99
Lia
bil
itie
s
Tax
liabi
litie
s 34
1,7
82
30--
341
,81
2
Cap
italiz
atio
n te
chni
cal p
rovi
sio
ns
493
----
493
Pro
visi
ons
6,
458
,57
7--
--6,
458
,57
7
Oth
er
liabi
litie
s 45
7,0
10
26--
457
,03
6
Eq
uit
y
182
,47
45,5
07
--187
,98
1
Attr
ibut
abl
e to
Gru
po B
B S
egu
rida
de12
1,6
37
5,5
07--
127
,14
4
Attr
ibut
abl
e to
oth
er s
tock
hold
ers
60
,837
----
60,8
37
Tota
l 7,4
40,3
36
5,5
63
--7,4
45,8
99

Note
s to
the
Fin
anci
al S
tate
ments
122
e.5
) In
su
ran
ce
, p
riv
ate
pe
nsio
n p
lan
s a
nd
cap
italiza
tio
n s
eg
men
t: P
riv
ate
pe
nsio
n p
lan
s
R$ t
ho
usa
nd
Sep
30,
20
13
B
rasil
pre
v S
eg
uro
s e
Pre
vid
ên
cia
S.A
.M
ap
fre N
oss
a C
aix
a V
ida e
Pre
vid
ên
cia
Ad
justm
en
ts/
Elim
ina
tio
ns
Tota
l
Asse
ts
Cas
h an
d b
ank
dep
osi
ts
4,9
6411
2--
5,0
76
Sec
uriti
es
78,1
31,6
9741
0,5
58
--78
,542
,255
Insu
ranc
e an
d co
insu
ranc
e o
pera
tions
2,
214
3,9
59--
6,1
73
Rec
eiva
bles
25
4,5
22
4,8
05(4
02)
258
,92
5
Oth
er
pro
pert
ies
----
----
Pre
paid
exp
ense
s 2,
392
----
2,3
92
Cos
ts a
cqui
sitio
ns
427
,55
4--
--42
7,5
54
Pen
sio
n pl
an c
redi
ts
3,9
80--
--3,
980
Inve
stm
ents
23
,139
--(2
3,1
39)
--
Pro
per
ty a
nd e
qui
pmen
t 17
,175
----
17,1
75
Inta
ngib
le a
sset
s 16
2,0
83
----
162
,08
3
Tota
l 79,0
29
,720
419
,43
4(2
3,5
41)
79,4
25
,613
Lia
bil
itie
s
Acc
ount
s pa
yabl
e24
9,5
14
7,4
87(4
02)
256
,59
9
Insu
ranc
e an
d re
insu
ranc
e d
ebts
1,
141
1,2
81--
2,4
22
Pen
sio
n pl
an d
ebt
s 1,
150
----
1,1
50
Dep
osi
ts
75,6
5664
5--
76,3
01
Tech
nica
l pro
visi
ons
49
,906
,847
258
,00
3--
50,1
64,8
50
Tech
nica
l pro
visi
ons
- P
ens
ion
plan
s 27
,322
,443
128
,56
7--
27,4
51,0
10
Oth
er
liabi
litie
s 17
2,6
33
312
--17
2,9
45
Eq
uit
y
1,3
00,3
36
23,1
39
(23
,13
9)
1,3
00,3
36
Attr
ibut
abl
e to
Gru
po B
B S
egu
rida
de97
5,1
22
17,3
52(1
7,3
52)
975
,12
2
Attr
ibut
abl
e to
oth
er s
tock
hold
ers
325
,21
45,
787
(5,7
87)
325
,21
4
Tota
l 79,0
29
,720
419
,43
4(2
3,5
41)
79,4
25
,613

Note
s to
the
Fin
anci
al S
tate
ments
123
R$ t
ho
usa
nd
Dec 3
1,
20
12
B
rasil
pre
v S
eg
uro
s e
Pre
vid
ên
cia
S.A
.M
ap
fre N
oss
a C
aix
a V
ida e
Pre
vid
ên
cia
Ad
justm
en
ts/
Elim
ina
tio
ns
Tota
l
Asse
ts
Cas
h an
d b
ank
dep
osi
ts
4643
6--
483
Sec
uriti
es
67,5
38,7
5742
5,7
33
--67
,964
,489
Insu
ranc
e an
d co
insu
ranc
e o
pera
tions
1,
439
----
1,4
39
Rec
eiva
bles
24
3,8
04
4,2
63(1
,796
)24
6,2
71
Toth
er p
rop
ertie
s --
3,9
37--
3,9
37
Pre
paid
exp
ense
s 31
3--
--31
3
Cos
ts a
cqui
sitio
ns
364
,36
5--
--36
4,3
65
Pen
sion
pla
n cr
edits
3,
543
21--
3,5
64
Inve
stm
ents
24
,954
--(2
4,9
54)
--
Pro
per
ty a
nd e
qui
pmen
t 18
,115
----
18,1
15
Inta
ngib
le a
sset
s 17
6,4
52
----
176
,45
2
Tota
l 68,3
71
,789
434
,39
0(2
6,7
50)
68,7
79
,429
Lia
bil
itie
s
Acc
ount
s pa
yabl
e16
4,6
48
7,2
96(1
,796
)17
0,1
49
Insu
ranc
e an
d re
insu
ranc
e d
ebts
5,
595
----
5,5
95
Pen
sio
n pl
an d
ebt
s 1,
309
298
--1,
607
Dep
osi
ts
19,5
4968
9--
20,2
39
Tech
nica
l pro
visi
ons
40
,786
,803
267
,59
4--
41,0
54,3
97
Tech
nica
l pro
visi
ons
- P
ens
ion
plan
s 26
,161
,692
130
,62
9--
26,2
92,3
22
Oth
er
liabi
litie
s 12
4,1
32
2,9
29--
127
,06
0
Eq
uit
y
1,1
08,0
61
24,9
54
(24
,95
4)
1,1
08,0
61
Attr
ibut
abl
e to
Gru
po B
B S
egu
rida
de83
0,9
35
18,7
13(1
8,7
13)
830
,93
5
Attr
ibut
abl
e to
oth
er s
tock
hold
ers
27
7,1
26
6,2
41(6
,241
)27
7,1
26
Tota
l 68,3
71
,789
434
,39
0(2
6,7
50)
68,7
79
,429

Note
s to
the
Fin
anci
al S
tate
ments
124
e.6
) B
rokera
ge S
eg
men
t
R$ t
ho
usa
nd
BB
Co
rre
tora
de S
eg
uro
s e
Ad
m.
de B
en
s
Sep
30,
20
13
Dec 3
1,
20
12
Asse
ts
Cas
h an
d b
ank
dep
osi
ts
729
,66
462
2,8
48
Sec
uriti
es
3,0
1639
8
Tax
ass
ets
66
,407
17,8
15
Rec
eiva
bles
60
6,0
06
434
,79
4
Oth
er
ass
ets
1,4
05,0
93
1,0
75,8
55
Lia
bil
itie
s
Div
ide
nds
paya
ble
--
287
,10
1
Pov
isio
ns
8,1
545,
718
Tax
liabi
litie
s 19
2,6
15
88,9
44
Oth
er
liabi
litie
s 95
3,1
05
660
,66
8
Eq
uit
y
251
,21
933,4
24
Attr
ibut
abl
e to
Gru
po B
B S
egu
rida
de25
1,2
19
33,4
24
Attr
ibut
abl
e to
oth
er s
tock
hold
ers
----
Tota
l 1,4
05,0
93
1,0
75,8
55

Notes to the Financial Statements
125
f) Insurance and reinsurance receivables of equity method investments. R$ thousand
Sep 30, 2013 Dec 31, 2012
Insurance business operations – Life, mortgage life and rural 1,588,084 1,213,284
Premiums 1,186,007 981,754
Insurance business operations 37,809 26,949
Reinsurance business operations 398,138 235,230
Credit risk impairment losses (33,870) (30,649)
Insurance business operations – Property and casualty 3,660,969 3,286,045
Premiums 2,426,949 2,225,947
Insurance business operations 64,822 130,179
Reinsurance business operations 1,236,597 979,714
Credit risk impairment losses (67,399) (49,795)
Reinsurance 2,207,971 --
Premiums 1,775,939 --
Insurance business operations 543,203 --
Credit risk impairment losses (111,171) --
Other credits 612,740 150,935
Total 8,069,764 4,650,264
Attributable to the Grupo BB Seguridade 3,759,410 2,743,655
Attributable to other stockholders’ 4,310,354 1,906,609

Notes to the Financial Statements
126
g) Balance of liabilities from insurance contracts and technical provisions for capitalization of equity method investments.
R$ thousand
Sep 30, 2013 Dec 31, 2012
Insurance – Life, mortgage life and rural 54,708,995 44,646,476
Mathematical provision for future benefits 49,952,542 40,901,827
Provision for unearned premiums 2,753,583 1,993,954
Provision for unsettled claims 997,233 883,931
Incurred but not reported reserve – IBNR 416,029 378,499
Provision for premium insufficiency 350,956 313,700
Mathematical provision for vested benefits 47,044 30,331
Other provisions 191,608 144,234
Insurance – Property and casualty 4,877,499 5,421,188
Provision for unearned premiums 3,232,726 3,325,292
Provision for unsettled claims 1,241,565 1,621,520
Incurred but not reported reserve – IBNR -- 323,476
Other provisions 403,208 150,900
Reinsurance 3,900,450 --
Provision for unearned premiums 1,041,696 --
Provision for unsettled claims 2,386,276 --
Incurred but not reported reserve – IBNR 448,380
Other provisions 24,098 --
Private Pension Plans 27,451,011 26,343,788
Mathematical provision for future benefits 24,575,301 23,555,210
Mathematical provision for vested benefits 1,254,214 1,684,912
Provision for financial surplus 583,459 571,022
Reserve for unexpired risks 8,469 16,023
Incurred but not reported reserve – IBNR 10,422 11,152
Provision for insufficiency of contributions 566,196 9,683
Other provisions 452,950 495,786
Capitalization Plans 8,482,255 6,370,384
Mathematical provision for redemptions 8,244,322 6,044,898
Provision for sweepstakes and redemptions 156,664 225,686
Other provisions 81,269 99,800
Total 99,420,210 82,781,836
Attributable to the Grupo BB Seguridade 70,504,791 60,195,738
Attributable to other stockholders’ 28,915,419 22,586,098

Notes to the Financial Statements
127
h) Balance of liabilities from insurance contracts and technical provisions for capitalization by products of equity method investments.
R$ thousand
Sep 30, 2013 Dec 31, 2012
Insurance – Life, mortgage life and rural 54,708,995 44,646,476
Living benefits life insurance - VGBL 50,164,850 41,002,959
Life 3,732,142 2,756,584
Property/casualty 598,548 746,665
Dpvat 213,455 140,268
Insurance – Property and casualty 4,877,499 5,421,188
Auto 2,927,947 3,163,390
Life 78,592 419,801
Property/casualty 1,332,873 1,560,700
Dpvat 538,087 277,297
Reinsurance 3,900,450 --
Living benefits life insurance - VGBL -- --
Auto 267,442 --
Life 131,748 --
Property/casualty 3,500,472 --
Dpvat 788 --
Private Pension Plans 27,451,011 26,343,788
Free benefit generating plan - PGBL 19,531,262 18,846,829
Traditional plans 7,919,749 7,496,959
Capitalization Plans 8,482,255 6,370,384
Total 99,420,210 82,781,836
Attributable to the Grupo BB Seguridade 74,565,158 60,195,738
Attributable to other stockholders’ 24,855,052 22,586,098
i) Guarantee of liabilities from insurance contracts and technical provisions for capitalization of equity method investments.
R$ thousand
Sep 30, 2013
Life, Mortgage life and Rural
Property and Casualty
Private Pension Plans
Capitalization Plans
ReinsuranceTotal
Shares in investment funds (VGBL e PGBL) 44,488,957 -- 24,384,223 -- -- 68,873,180
Shares in investment funds (except VGBL e PGBL) 7,382,875 1,688,553 2,517,405 3,581,059 -- 15,169,892
Federal Government bonds 2,276,739 33,912 1,067,572 3,647,361 3,702,664 10,728,248
Corporate bonds 770,383 395,949 82,351 1,363,183 213,945 2,611,866
Credit rights 1,117,326 1,209,685 -- 93,165 -- 2,420,176
Property 3,960 17,460 -- -- -- 21,420
Deposits held at IRB and judicial deposits 7,996 775 -- -- -- 8,771
Total 56,048,236 3,346,334 28,051,551 8,684,768 3,916,609 100,047,498
Attributable to the Grupo BB Seguridade 42,030,572 1,673,167 21,037,260 5,789,266 983,068 71,513,333
Attributable to other stockholders’ 14,017,664 1,673,167 7,014,291 2,895,502 2,933,541 28,534,165

Notes to the Financial Statements
128
R$ thousand
Dec 31, 2012
Life, Mortgage life and Rural
Property and Casualty
Private Pension Plans
Capitalization Plans
Total
Shares in investment funds (VGBL e PGBL) 35,961,427 -- 23,500,099 -- 59,461,526
Shares in investment funds (except VGBL e PGBL) 5,302,226 3,649,473 2,185,874 3,309,457 14,447,030
Federal Government bonds 2,421,331 89,895 1,088,899 1,837,304 5,437,429
Corporate bonds 534,509 610,557 83,651 1,500,107 2,728,824
Credit rights 607,356 1,321,589 -- 102,517 2,031,462
Property -- 21,613 -- -- 21,613
Deposits held at IRB and judicial deposits -- 2,726 -- -- 2,726
Total 44,826,849 5,695,853 26,858,523 6,749,385 84,130,610
Attributable to the Grupo BB Seguridade 33,615,654 2,847,927 20,141,206 4,499,140 61,103,927
Attributable to other stockholders’ 11,211,195 2,847,926 6,717,317 2,250,245 23,026,683
j) Liability Adequacy Test
The Group should perform the Liability Adequacy Test for all contracts that fulfill the definition of an insurance contract, which are effective on the execution date, in order to determine the sufficiency or insufficiency of the balances recorded in the balance sheet.
This test corresponds to the comparison of the net book value of technical and mathematics provisions, called Net Carrying Amount (NCA), net of deferred acquisition costs and intangible assets related, to the actuarial calculation of future cash flows’ current estimates of insurance and pension plan contracts.
If there is a deficiency in this comparison, i.e., the value of future cash flows exceeds the NCA, these deficiencies will be recognized by a provision.
The assumptions used by the insurance subsidiaries and joint ventures are set out below:
a) discount rates used to discount the cash flows: risk-free interest rate, obtained from the extrapolated yield curve of government bonds, considered risk-free credit, available on the Brazilian financial market,
b) claims, administrative and operational costs, deferred acquisition costs, cancellation, future contributions, partial redemptions and conversions to income based on historical behavior, and
c) mortality and survival, following the biometric tables built considering the experience in the Brazilian insurance market.
The Liability Adequacy Test did not indicate adjustments in technical provisions.

Notes to the Financial Statements
129
11 – Tax
a) Current and deferred tax assets R$ thousand
Parent Consolidated
Sep 30, 2013 Dec 31, 2012 Sep 30, 2013 Dec 31, 2012
Current Tax Assets 1,373 -- 87,083 18,098
Deferred Tax Assets – Tax credit -- -- 6,602 5,762
Total 1,373 -- 93,685 23,860
b) Deferred tax assets R$ thousand
Parent Consolidated
Sep 30, 2013 Dec 31, 2012 Sep 30, 2013 Dec 31, 2012
Deferred assets
Amortization of goodwill -- -- 3,053 3,052
Liabilities provision -- -- 2,906 2,073
Negative mark to market of securities -- -- 159 157
Other provision -- -- 484 480
Total -- -- 6,602 5,762
c) Expected realization of deferred tax assets R$ thousand
Nominal Value Present Value
2013 1,392 1,323
2014 1,179 1,029
2015 1,112 887
2016 1,118 823
2017 673 457
From 2018 288 180
Total 5,762 4,699
Expected realization of deferred tax assets (tax credits), related to BB Seguros and BB Corretora is supported by a technical study prepared as of December 31, 2012, being the present value calculated based on the average funding rate.
During 2013, there was a realization of tax credits in the amount of R$ 58 thousand, corresponding of 4,17% of the planned in the period.

Notes to the Financial Statements
130
d) Liabilities current tax R$ thousand
Parent Consolidated
Sep 30, 2013 Dec 31, 2012 Sep 30, 2013 Dec 31, 2012
Current tax
Income tax suspension -- -- 76,588 55,412
Income Tax -- -- 81.697 21,980
Social contribution tax -- -- 30.887 10,426
COFINS -- -- 5,705 4,248
PASEP -- -- 927 690
ISS -- -- 3,662 --
Total -- -- 199,466 92,756
e) Liabilities deferred tax R$ thousand
Parent Consolidated
Sep 30, 2013 Dec 31, 2012 Sep 30, 2013 Dec 31, 2012
Deferred tax liabilities
From partnership with MAPFRE -- -- 262,882 269,123
Arising from amortization of Brasilcap’s goodwill -- -- 6,946 --
Positive mark to market of financial assets -- -- -- (531)
Other timing differences -- -- 1,062 1,062
Total -- -- 270,890 269,654
f) Reconciliation of income tax expense R$ thousand
Parent Consolidated
3nd quarter/2013
Jan 01, 2013 to Sep 30, 2013
3nd quarter/2013
Jan 01, 2013 to Sep 30, 2013
Income before taxes and equities 547,832 1,570,142 664,849 1,901,521
Income taxes (34%) (186,263) (533,848) (226,049) (646,517)
Equity in earnings of subsidiaries and associates 188,866 536,564 112,146 318,992
Other (2,603) (2,716) (3,114) (3,854)
Income taxes expense -- -- (117,017) (331,379)
12 – Other assets
R$ thousand
Parent Consolidated
Sep 30, 2013 Dec 31, 2012 Sep 30, 2013 Dec 31, 2012
Receivable income (1) -- -- 467,788 381,550
Judicial deposits -- -- 134,489 128,848
Prepaid taxes -- -- -- 44,201
Other -- -- 267 280
Total -- -- 602,544 554,879
(1) This refers mainly to commissions received from affiliated companies. As of Dec 31, 2012 includes dividends receivable.
Commissions receivable from insurance companies refer to segment of automobile, life and elementary, as demonstrated by company in the following table:

Notes to the Financial Statements
131
R$ thousand
Parent Consolidated
Sep 30, 2013 Dec 31, 2012 Sep 30, 2013 Dec 31, 2012
Aliança do Brasil -- -- 382,648 194,303
Mapfre Seguros Gerais -- -- 56,681 50,052
Aliança do Brasil Seguros -- -- 28,455 17,200
Brasilveículos -- -- 4 11
Total -- -- 467,788 261,566
13 – Dividends payable R$ Thousand
Parent Consolidated
ConsolidadoSep 30, 2013 Dec 31, 2012 Sep 30, 2013 Dec 31, 2012
Dividends payable (1) 180 -- 180 624,698
(1) Dividends payable to minority shareholders not located.
14 – Provisions and Contingent Liabilities
Tax Lawsuits
Tax lawsuits derived mainly from assessments of municipal tax and refer to ISSQN (Service Tax).
Civil Lawsuits
The most significant civil lawsuits are the indemnity claims (material damage, moral damage etc.), disputes regarding the payment of claims and applicability of the consumer’s protection code.
a) Provision
In accordance with IAS 37, the BB Seguridade recognizes provisions for civil and tax lawsuits classified as “probable”.
Provisions for civil and tax lawsuits classified as probable:
R$ thousand
Parent Consolidated
Set 30, 2013 Dec 31, 2012 Set 30, 2013 Dec 31, 2012
Tax lawsuits
Initial balance -- -- 1,245 561
Constitution -- -- 1,479 1,246
Reversal of the provision -- -- (562)
Balance at the end of period -- -- 2,724 1,245
Civil lawsuits
Initial balance -- -- 4,473 1,610
Constitution -- -- 1,762 5,688
Reversal of the provision -- -- (256) (2,825)
Balance at the end of period -- -- 5,979 4,473
Total -- -- 8,703 5,718

Notes to the Financial Statements
132
b) Contingent Liabilities
The tax and civil lawsuits classified as “possible” are not recorded in the balance sheet but disclosed based on IAS 37.
The balances of contingent liabilities classified as possible are the following:
R$ thousand
Parent Consolidated
Set 30, 2013 Dec 31, 2012 Set 30, 2013 Dec 31, 2012
Tax lawsuits(1) -- -- 4 5
Civil lawsuits -- -- 6,145 6,035
Total -- -- 6,149 6,040
(1) BB Security Group disputes the non-aproval of claims for compensation for income tax, social contribution, PIS and Cofins made between the years 1999 and 2003, due to non-recognition of the negative balance of 1995 and 1997 and the deduction of social contribution values of the basis for calculation of income tax, decision issued by justice on a preliminary basis. There are deposits in guarantee of R$ 28,128 thousand. The possibility of success of demand is classified as possible, being unnecessary provisioning values.
c) Deposits in guarantee of funds
The balances of escrow deposits formed for contingencies probable, possible and/or remote are:
R$ thousand
Parent Consolidated
Set 30, 2013 Dec 31, 2012 Set 30, 2013 Dec 31, 2012
Tax lawsuits (1) -- -- 100,083 122,783
Civil lawsuits -- -- 6,278 6,065
Total -- -- 106,361 128,848
(1) Refers to tax lawsuit aiming to annul the administrative decision that not endorsed statements to offset negative average of IRPJ with owned taxes. The value of this deposit is R$ 100,083 thousand (R$ 95,184 thousand as of December 31, 2012), and it is updated by SELIC index.
15 – Other liabilities
R$ thousand
Parent Consolidated
Sep 30, 2013 Dec 31, 2012 Set 30, 2013 Dec 31, 2012
Unearned commissions -- -- 911,613 504,428
Sundry creditors - domestic -- -- 14,066 146,635
Taxes -- -- -- 8,122
Labor charges and obligations -- -- -- 1,483
Payable to related companies 1,261 -- 28,934 --
Other 19 -- 2,952 743
Total 1,280 -- 957,565 661,411
16 – Equity
a) Capital
The capital of the Grupo BB Seguridade on amounted R$ 5,646,768 thousand (R$ 5,633,268 thousand as of Dec 31, 2012) and it is divided into 2,000,000,000 (two billions) of shares (470,563,927 shares as of Dec 31, 2012). The shareholders’ equity amounted R$ 6,389,579 thousand (R$ 5,638,374 thousand as of Dec 31, 2012), corresponding a book value per share of R$ 3.19 (R$ 12.00 per share as of Dec 31, 2012).
The BB Seguridade was created through capital subscribed of R$ 15,000 thousand and 10% paid in (R$ 1,500 thousand). The capital increases made by Banco do Brasil S.A., by transfer of investment in BB Cor Participações S.A. and BB Seguros Participações S.A., amounting to R$ 5,631,768 thousand, were performed on Dec 31, 2012. As of January 2013, there was a paid in of R$ 13,500 thousand in the capital.

Notes to the Financial Statements
133
b) Profit Reserves
R$ thousand
Parent Consolidated
Set 30, 2013 Dec 31, 2012 Set 30, 2013 Dec 31, 2012
Profit Reserves 204,462 -- 204,462 --
Legal Reserve 51,116 -- 51,116 --
Statutory reserve 153,346 -- 153,346 --
c) Accumulated Other Comprehensive Income
The other accumulated comprehensive income mainly derived from gains and losses related to fair value adjustments, net of tax effects, of available for sale financial assets, using in counterpart the appropriate asset account.
d) Dividends R$ thousand
Parent Consolidated
ConsolidadoSet 30, 2013 Dec 31, 2012 Set 30, 2013 Dec 31, 2012
Calculation Basis: 1,519,027 -- 1,519,027 --
- Net Income 1,570,142 -- 1,570,142 --
- Legal reserve in the period (51,115) -- (51,115) --
Dividends payable 817,848 -- 817,848 --
Statutory reserve 153,347 -- 153,347 --
Balance of net income after allocation 547,832 -- 547,832 --
The dividends declared in the 1st half of 2013 were approved by the Board of Directors on August 09, 2013 and paid on August 30, 2013 restated by the Selic rate.
17 – Financial income R$ thousand
Parent Consolidated
3nd quarter/201301.01 to
09.30.20133nd quarter/2013
01.01 to
09.30.2013
Financial investment operation 1,547 2,018 33,448 82,454
Judicial deposits income -- -- 1,730 4,623
Valuation of exclusive fund shares -- -- 114 300
Financial assets at fair value through profit or loss -- -- 25 35
Other interest income -- -- 365 3,174
Total 1,547 2,018 35,682 90,586
18 – Personnel expenses R$ thousand
Parent Consolidated
3nd quarter/2013 01.01 to 09.30.2013 3nd quarter/2013 01.01 to 09.30.2013
Salaries (1,933) (2,376) (4,287) (9,445)
Social security costs (833) (1,040) (2,010) (5,188)
Counselors fees (76) (207) (244) (726)
Benefits (67) (82) (95) (191)
Total (2,909) (3,705) (6,636) (15,550)

Notes to the Financial Statements
134
19 – Administrative expenses R$ thousand
Parent Consolidated
3nd quarter/2013
01.01 to 09.30.2013
3nd quarter/2013
01.01 to 09.30.2013
Operational support -- -- (33,913) (94,772)
Administrative cost of products -- -- (14,440) (52,069)
Data processing -- -- (16,798) (51,788)
Comnunication expenses -- -- (129) (602)
Outsoured services -- -- (180) (430)
Class association entities -- -- (158) (349)
Release expenses -- -- -- (290)
Operational provision -- -- 336 --
Other (164) (169) (179) (354)
Total (164) (169) (65,461) (200,654)
20 – Other operating income / expenses R$ thousand
Parent Consolidated
3nd
quarter/201301.01 to
09.30.20133nd
quarter/201301.01 to
09.30.2013
Taxes (4) (4) (30,991) (89,456)
Restatement of liabilities (11,728) (11,728) (26,014) (42,232)
Expenses of commissions -- -- (7,982) (18,749)
(Recording)/Reversal of provisions for labor, tax and civil lawsuits -- -- (1,416) (3,241)
Restatement of assets 5,600 5,600 11,303 11,303
Other 3 1 1,026 1,249
Total (6,129) (6,131) (54,074) (141,126)
21 – Commissions income R$ thousand
Parent Consolidated
3nd quarter/2013
01.01 to 09.30.2013
3nd quarter/2013
01.01 to 09.30.2013
SH1 -- -- 235,649 632,587
SH2 -- -- 79,568 224,719
Brasilcap -- -- 65,551 191,601
Brasilprev -- -- 42,578 172,838
Other companies -- -- 2,151 6,103
Provision of services for incentives to products sale -- -- -- 2,204
Total -- -- 425,497 1,230,052
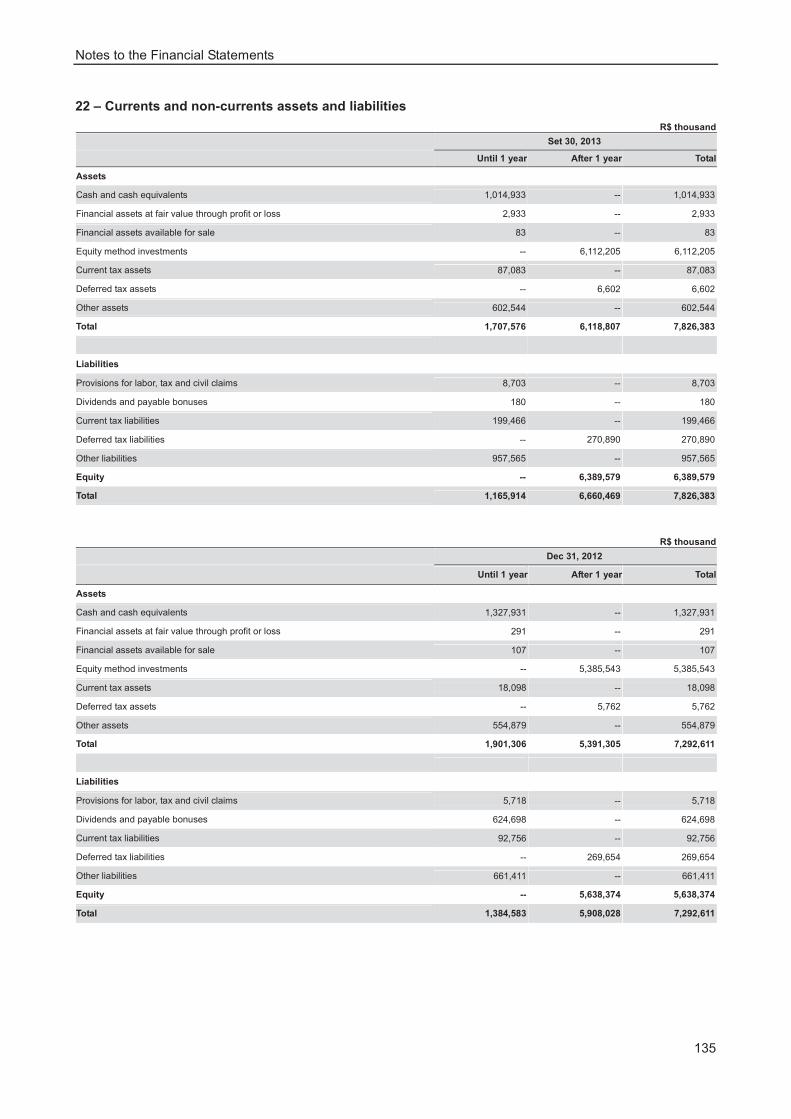
Notes to the Financial Statements
135
22 – Currents and non-currents assets and liabilities
R$ thousand
Set 30, 2013
Until 1 year After 1 year Total
Assets
Cash and cash equivalents 1,014,933 -- 1,014,933
Financial assets at fair value through profit or loss 2,933 -- 2,933
Financial assets available for sale 83 -- 83
Equity method investments -- 6,112,205 6,112,205
Current tax assets 87,083 -- 87,083
Deferred tax assets -- 6,602 6,602
Other assets 602,544 -- 602,544
Total 1,707,576 6,118,807 7,826,383
Liabilities
Provisions for labor, tax and civil claims 8,703 -- 8,703
Dividends and payable bonuses 180 -- 180
Current tax liabilities 199,466 -- 199,466
Deferred tax liabilities -- 270,890 270,890
Other liabilities 957,565 -- 957,565
Equity -- 6,389,579 6,389,579
Total 1,165,914 6,660,469 7,826,383
R$ thousand
Dec 31, 2012
Until 1 year After 1 year Total
Assets
Cash and cash equivalents 1,327,931 -- 1,327,931
Financial assets at fair value through profit or loss 291 -- 291
Financial assets available for sale 107 -- 107
Equity method investments -- 5,385,543 5,385,543
Current tax assets 18,098 -- 18,098
Deferred tax assets -- 5,762 5,762
Other assets 554,879 -- 554,879
Total 1,901,306 5,391,305 7,292,611
Liabilities
Provisions for labor, tax and civil claims 5,718 -- 5,718
Dividends and payable bonuses 624,698 -- 624,698
Current tax liabilities 92,756 -- 92,756
Deferred tax liabilities -- 269,654 269,654
Other liabilities 661,411 -- 661,411
Equity -- 5,638,374 5,638,374
Total 1,384,583 5,908,028 7,292,611

Notes to the Financial Statements
136
23 – Related party transactions
The costs of benefits granted to fiscal council of the Group were R$ 329 thousand in 3rd quarter of 2013 and R$ 811 thousand in the period from 01.01 to 09.30.2013.
The Group has banking transactions with its Controller, Banco do Brasil S.A., such as non-interest bearing current accounts and short-term investments. There are also service agreements, guarantee agreements and refunds of direct and indirect costs.
These transactions are conducted under normal market conditions, mainly under the terms and conditions for comparable transactions, including interest rates and collateral. These transactions do not involve unusual payment risks.
The Group does not grant loans to its Executive Committee or Fiscal Council members.
The tables below show the main transactions between the Group and related parties.
a) Summary of related party transactions R$ thousand
Sep 30, 2013
Parent(1) Subsidiaries(2) Associates(3) Total
Cash and cash equivalents 1,014,933 -- -- 1,014,933
Other assests -- 6 467,874 467,880
Commissions to be received -- -- 467,788 467,788
Dividends to be received(9) -- 6 -- 6
Other credits (6) -- -- 86 86
Liabilities
Dividends and bonuses to be paid -- -- -- --
Other liabilities 40,161 -- 911,613 951,774
Obligations with related parties 40,161 -- -- 40,161
Unearned Commissions -- -- 911,613 911,613
R$ thousand
01.01 to 09.30.2013
Parent(1) Subsidiaries(2) Associates(3) Other related parties (4) Total
Income
Income from financial instruments 90,286 300 -- -- 90,586
Income from commission -- -- 1,230,052 -- 1,230,052
Income from investments in associated –Administrative expenses (7) -- -- -- 42,459 42,459
Personnel expenses (15,550) -- -- -- (15,550)
Administrative expenses (8) (200,071) -- -- -- (200,071)
Monetary liabilities changes (22,356) -- -- -- (22,356)
R$ thousand
3nd quarter/2013
Parent(1) Subsidiaries(2) Associates(3) Other related parties (4) Total
Income
Income from financial instruments 35,569 113 -- -- 35,682
Income from commission -- -- 425,497 -- 425,497
Income from investments in associated –Administrative expenses (7) -- -- -- 16,102 16,102
Personnel expenses (6,636) -- -- -- (6,636)
Administrative expenses (8) (65,439) -- -- -- (65,439)
Monetary liabilities changes (7,439) -- -- -- (7,439)

Notes to the Financial Statements
137
R$ thousand
Dec 31, 2012
Parent(1) Subsidiaries(2) Associates(3) Total
Cash and cash equivalents 1,327,931 -- -- 1,327,931
Other assests -- 14 381,639 381,653
Commissions to be received -- -- 261,566 261,566
Dividends to be received -- 14 119,983 119,997
Other credits(6) -- -- 90 90
Liabilities
Dividends and bonuses to be paid 624,698 -- - 624,698
Other liabilities 55,334 -- 596,329 651,663
Obligations with related parties 55,334 -- - 55,334
Unearned Commissions -- -- 596,329 596,329
(1) Banco do Brasil S.A.
(2) BB Seguros S.A, BB Corretora, BB Cor S.A. e BB Capitalização S.A. on the financial position.
(3) Related companies BB MAPFRE SH1 Participações S.A. and its subsidiaries, MAPFRE BB SH2 Participações S.A and its subsidiaries, Brasilprev Seguros e Previdência S.A. and Brasilcap Capitalização S.A.
(4) Wholly owned subsidiaries of Banco do Brasil S.A., mainly BB Gestão de Recursos – Distribuidora de Títulos e Valores Mobiliários S.A. (BB DTVM)
(5) Executive Committee and Fiscal Council.
(6) Credit Rights of DPVAT agreement to be received from Brasilprev Seguros e Previdência S.A. due to the disposal of MAPFRE Nossa Caixa Vida e Previdência S.A.
(7) This includes administration services of financial investments portfolio by the BB DTVM to associated companies of the Group BB Seguridade.
(8) Refers to expenses as sharing contract customer data, use of staff, distribution network and resource materials technological and administrative, between the Bank and BB Corretora.
(9) Refers to dividends payable to BB Seguros coming from BB Capitalização.

Notes to the Financial Statements
138
Related Party Transaction
date Amount involved
Existing
balance Amount Duration
Loan or
other debt
Interest
rate
charged
Brasilcap, BB Corretora and
Banco do Brasil
Jul 14, 1999 R$ 89,727,403.98
(3nd Q 2013)
R$ 283,598,507.14
(01.01 to 09.30.2013)
-- Not applicable
Within 5 years from the date of its
signing. Automatically
renewed for
additional periods of five years.
No No
Relationship
with the issuer
Affiliates, Controled and Direct Controller, respectively.
Purpose of the
contract
Commercialization by BB Corretora of products from Brasilcap regarding the services of raising the OUROCAP bond plans and the reception of the respective parcels by the Brasicap, through the Banco do Brasil, within their respective mandates and in accordance with the conditions established in the contract. The OUROCAP products are commercialized exclusively by the BB Corretora, or by whom this indicate. The capitalization plans, their respective conditions, developed by Brasilcap, in agreement with the BB Corretora, operating agreements are subject to specific operating agrrements, integral parts of this contract, for each plan and are signed between the BB Corretora, the Banco do Brasil and the Brasilcap.
In the 3nd of 2013, the volume transacted between Brasilcap and BB Corretora was R$ 65,551,305.14 and between Brasilcap and Banco do Brasil was R$ 24,176,098.84. In 01.01 to 09.30.2013 the volume transacted between Brasilcap BB Corretora, through this agreement, was R$ 191,601,144.98 and between Brasilcap and Banco do Brasil was R$ 91,997,362.16.
Guarantee and
insurance No.
Rescission or
extinction
- The use by Brasilcap of the registration data of subscribers and holders of the plans marketed by BB Corretora,
without prior written consent, except in the cases provided for in the contract;
- The parties have the right to terminate the contract at any time, upon written notice at least 12 months in
advance.
Nature and
reason for the
operation Operating agreement for the commercialization of goods and services

Notes to the Financial Statements
139
Related
Party
Transaction
date Amount involved
Existing
balance Amount Duration
Loan or
other debt
Interest
rate
charged
Brasilprev, BB
Corretora and Banco do
Brasil
Oct 06, 1999 R$ 51,197,235.63
(3nd Q 2013)
R$ 233,198,395.72
(01.01 to 09.30.2013)
-- Not
applicable
Within 5 years
from the date of its signing.
Automatically
renewed for additional periods
of five years.
No No
Relationship
with the
issuer
Affiliates, Controled and Direct Controller, respectively.
Purpose of
the contract Commercialization and promotion by BB Corretora of the pension plans from Brasilprev and the provision of banking services through the Banco do Brasil, in the course of its atributions and in accordance with the conditions
established in the contract. The plans and the regulations developed by Brasilprev are subject to specific
operational agreements to each product, signed between Brasilprev, the BB Corretora and the Banco do Brasil.
As part of the strategic realignment of the Company, on 30 April 2010, was signed an operational Agreement,
supplementary to the terms of the Shareholders Agreement, in order to redefine the relevant aspects of the operationalization of the development and the commercialization of products of open private pension, aiming to
maximize the results of Brasilprev, its sustainability and competitiveness. In this Agreement, the terms of this
contract were kept.
In the 3nd quarter of 2013, the volume transacted between Brasilprev and BB Corretora was R$ 42,577,738.42 and
between Brasilprev and Banco do Brasil, R$ 8,619,497.21. In 01.01 to 09.30.2013, the volume transacted between
Brasilprev and BB Corretora was R$ 172,837,897.65 and between Brasilprev and Banco do Brasil R$ 60,360,498.07.
Guarantee
and
insurance
No
Rescission
or extinction
The parties have the right to terminate the contract at any time, upon written notice at least 12 months in advance.
The recission or denouncement does not oblige the promoter to any liens, damages or liabilities resulting from the
measure, except for the subsistence of the obligation of Brasilprev with plan participants.
Nature and
reason for
the
operation
Operating agreement for the commercialization of goods and services.
Related
Party
Transaction
date Amount involved
Existing
balance
Amount
(Reais) Duration
Loan or
other debt
Interest
rate
charged
Brasilprev
and BB-BI.
Nov 28, 1994 R$ 56,642,168.08
(3nd Q 2013)
R$ 161,362,652.76
(01.01 to 09.30.2013)
-- Not
applicable
Indefinite term No No
Relationship
with the
issuer
Affiliated and wholly owned subsidiary of the Banco do Brasil, respectively.
Purpose of
the contract The Provision by BB-BI to the Brasilprev of advisory services in financial management of the Brasilprev`s resources, according to the policy, guidelines and benefited segments defined by the Board of Directors of
Brasilprev upon proposal from its Financial Committee. The remuneration of the BB-BI is calculated on the daily
balance of the assets of the managed portfolio from the Traditional Plans and in accordance with regulations of the respective funds. The conditions of the contract and subsequent amendments were consolidated in a draft on May
20, 2009. As part of the strategic realignment of the Company, on April 30, 2010 was celebrated an Operatinal Agreement, complimentary to the terms of the Shareholders Agreement, in order to redefine the operational aspects
related to the development and commercialization of Open Private Pension products, in order to maximize the
results of Brasilprev, its sustainability and its competitiveness. In this Agreement, the terms of this agreement were kept.

Notes to the Financial Statements
140
Related
Party
Transaction
date Amount involved
Existing
balance Amount Duration
Loan or
other debt
Interest
rate
charged
Guarantee
and
insurance
No
Rescission or
extinction
The breach of contract may give rise to its immediate termination, besides causing the accountability of the defaulting party for damages, regardless of judicial and extrajudicial measures.
The Agreement may be terminated at any time, by either party, upon written notice in advance of 360 days.
Nature and
reason for the
operation
Not applicable.
Related Party Transaction
date Amount involved
Existing
balance Amount Duration
Loan or
other debt
Interest
rate
charged
Brasilcap and
BB-BI
Oct 20, 1995 R$21,086,601.00
(3nd Q2013)
R$ 54,399,744.83
(01.01 to 09.30.2013)
-- Not
applicable
Indefinite
term.
No No
Relationship
with the issuer
Affiliated and wholly owned subsidiary of the Banco do Brasil, respectively.
Purpose of the
contract
The provision by BB-BI to Brasilcap of the services of resources management from the securities portfolio, real
state values and metal ("securities portfolio"), within their respective mandates and in accordance with the
conditions established in the contract. The remuneration of the BB-BI is calculated from the management fee levied on the equity securities portfolio administered, calculated according to the methodology defined in the
contract. It is also planned at the end of each semester, a bonus equivalent to 20% of the amount exceeding
100% of CDI accumulated in the period, by way of performance, according to the rules defined in the contract. It is allowed to BB-BI to sign agreements and contracts with brokers or dealers in securities and real state values,
stock exchanges and financial institutions for execution or operationalization of the assignments granted to it. The
terms of the contract and their additives were consolidated in December 7, 2012.
Guarantee and
insurance
No.
Rescission or
extinction The breach of any terms of the contract may risk it`s immediate termination, besides causing defaulting party's liability for damages and regardless of judicial and extrajudicial measures. The contract may be terminated by
mutual agreement, subject to the terms of validity of ongoing operations.
Nature and
reason for the
operation
Not applicable

Notes to the Financial Statements
141
Related Party Transaction date Amount involved Existing
balance Amount Duration
Loan
or
other
debt
Interest
rate
charged
Banco do Brasil,
BB Corretora, MAPFRE
Participações,
Cia de Seguros Aliança do
Brasil, Brasilveículos
and AB Seguros.
Jun 30, 2011 R$ 346,310,106.12
(3nd Q 2013)
R$ 955,914,834.58
(01.01 to 09.30.2013)
-- Not
applicable
Within 20
years from the date of its
signing.
Automatically renewed for
additional periods of five
years.
No No
Relationship
with the issuer
Direct controller, controled and affiliates, respectively.
Purpose of the
contract Regulate the rights and obligations of the parties with respect to the development, dissemination, distribution and marketing of insurance products in the segments of people and elementary as defined in current or future applicable legislation. The distribution of insurance products from the insurers will be made exclusively in the banking channels of the Bank of Brazil, through BB Brokerage, nationwide. In both cases, the receipt and transfer to the insurers of their insurance premiums will be paid by the Banco do Brasil. The parties authorize the use, by any of the signatories, of the brands of the other parts of this agreement. The remuneration of the BB Corretora and the Banco do Brasil was set at varying percentages of the liquid net premiums.
In the 3nd of 2013, through this contract, Cia de Seguros Aliança do Brasil handled with the R$ 235,303,804.13 with BB Corretora R$ 11,589,672.30 with the Banco do Brasil. The Aliança do Brasil Seguros, in turn, transacted
R$ 30,673,391.01 and with the BB Corretora. MAPFRE Participações, transacted with BB Corretora R$
49,199,699.01 and with Banco do Brasil R$ 19,503,004.46. BB Corretora handled whit Brasilveículos R$ 40,535.21.
In 01.01 to 09.30.2013, by means of this agreement, the Cia de Seguros Aliança do Brasil transacted R$
631,563,884.07 with the BB Corretora and R$ 30,160,568.44 with the Banco do Brasil. The Aliança do Brasil Seguros, in turn, transacted R$ 80,486,692.27 with the BB Corretora and R$ 68,448,906.83 with the Banco do
Brasil. The BB Corretora, in turn, transacted R$ 139,346.05 with the Brasilveículo, in turn, MAPFRE Participações transacted R$ 145,115,436.92.
Guarantee and
insurance No
Rescission or
extinction The operating agreement may be terminated earlier:
(a) in relation to the Vida Seguradora and the Aliança do Brasil, if canceled or terminated the shareholders
agreement related to the SH1, signed by MAPFRE Brazil and BB Seguros in Jun 30, 2011;
(b) in relation to BrasilVeículos and AB Seguros, if canceled or terminated the shareholders agreement related
to the SH2, signed between MAPFRE Brasil and BB Seguros in Jun 30, 2011.
This Agreement may be terminated at the sole discretion of the other parties, regardless of an arbitration, in the
event of either party incurring extrajudicial liquidation, revocation of the operating permit by the competent organ,
bankruptcy, application for judicial recovery or similar proceeding or early extrajudicial recovery procedure or yet if the party has its intervention, bankruptcy or liquidation required and such situation is not remedied within 30
days from the date on which such party becomes aware of the event.
Nature and
reason for the
operation
Operating agreement for the commercialization of goods and services.

Notes to the Financial Statements
142
Related Party Transaction date Amount involved Existing
balance Amount Duration
Loan
or
other
debt
Interest
rate
charged
Banco do Brasil
and BB Corretora
Oct 25, 2011 R$ 65,439,014.68
(3nd Q 2013)
R$ 200,071,353.70
(01.01 to 09.30.2013)
-- Not
applicable
Period of 20
years. Automatically
renewable for
equal periods.
No No
Relationship
with the issuer
Direct controller and controlled, respectively.
Purpose of the
contract
To discipline the conditions, the calculation method and the frequency of reimbursements owed by the BB Corretora to the Banco do Brasil, related to costs and expenses arising from the use of staff, of material resources, and of technological and administrative assets from Banco do Brasil, needed for the BB Corretora to perform its own operational activities.
Guarantee and
insurance No
Rescission or
extinction
No prediction
Nature and
reason for the
operation Apportionment and reimbursement of expenses and direct and indirect costs

Notes to the Financial Statements
143
BB SEGURIDADE PARTICIPAÇÕES S.A.
MEMBERS OF THE MANAGEMENT BODIES
DIRECTOR PRESIDENT
Marcelo Augusto Dutra Labuto
DIRECTORS
Leonardo Giuberti Mattedi
Ângela Beatriz de Assis
André Luis Cortes Mussilli
BOARD OF DIRECTORS
Alexandre Corrêa Abreu (President)
Ivan de Souza Monteiro (Vice-President)
Fábio Franco Barbosa Fernandes
Francisca Lucileide de Carvalho
Guilherme Sodré Barros
José Henrique Paim Fernandes
FISCAL COUNCIL
Adriano Meira Ricci
Antonio Pedro da Silva Machado
ACCOUNTING DEPT.
Eduardo Cesar Pasa
General Accountant
Accountant CRC-DF 017.601/O-5
CPF 541.035.920-87

�
�
����
�
Appendix 01
ITR – Comments: Performance x Guidance – 3Q13
Dear Shareholders,
2013 Guidance
The 2013 Guidance is presented in the following table. The ROAE is calculated using the percentage observed in the period, calculated from the division of adjusted net income by average equity for the period, both under IFRS, as published by the Company in its quarterly MD&A report. Premiums and collection are calculated by growth percentage observed in comparison with the previous year.
The estimates are prepared for the entire year, so that the monitoring over the quarters may be adversely affected by specific events in the period.
At 9M13 , the following indicators showed deviation from the expected for the entire year:
a) Adjusted ROAE : BB Seguridade pays dividends on a semiannually basis. The performance reached in the first nine months of 2013 does not consider the distribution of dividends for the third quarter. If it were considered a possible dividend in the quarter - 80 % of net income - the adjusted ROAE would be 37.2 %, in line with the Guidance.
b ) Premiums Written - BB Mapfre SH1 - Segments of Life , Housing and Rural: the performance was mainly impacted by lower than expected sales in the traditional life policies (does not include credit life) . However, the estimates for the year are maintained based on the budget and sales forecast for 4Q13.
c ) Collection from Pension Plans: The performance was impacted by the volatility in the future yield curve, which impacted the profitability of investment funds and pension products, leading to a more challenging conjectural scenario for new businesses, which explain growth below the Guidance range. The estimates for the end of 2013 are maintained based on the budget and forecasted sales for 4Q13.
������������������� �
�� ��������������
�������������������������
�������������� ���������� �������� �����
����������������������������� !"����#�� ������$� �����
�������������������������� !"�������#%� �����%&� �'���
(�))�*������������������������)��� �&����&� %'���
(�))�*��������������������������� �&���'�� '&���
* Considering the distribution of dividends, the adjusted ROAE would be 37,2%.
� �
�
145
���������������� ���������������� ���������������� ���������������� ������������������������������������������� !�"�����#�$��%����&��$�#�&���'����!()( $*!!�$����&����$���$�'�&�����
"��+�,))��-�.)/ $ !!!��0�������
Uma empresa-membro da Ernst & Young Global Limited
A free translation from Portuguese into English of independent auditor’s review report on individual interim financial information prepared in Brazilian currency in accordance with accounting practices adopted in Brazil and on consolidated interim financial information prepared in Brazilian currency in accordance with accounting practices adopted in Brazil and with International Financial Reporting Standards (IFRS) issued by the International Accounting Standards Board – IASB and specific CVM rules
Independent Auditor’s Report on Review of Quarterly Financial Information - ITR
The The Board of Directors and Shareholders BB Seguridade Participações S.A.
Introduction
We have reviewed the accompanying individual and consolidated interim financial information of BB Seguridade Participações S.A. (“Company”) contained in the Quarterly Information Form – ITR for the quarter ended September 30, 2013, which comprises the balance sheet as at September 30, 2013 and the related income statements and statements of comprehensive income for the three and nine-month periods then ended, and the statement of changes in equity and cash flow statement for the nine-month period then ended, including explanatory information.
Management is responsible for the preparation of the individual interim financial information in accordance with Accounting Pronouncement CPC 21 (R1) – Interim Financial Reporting, and of the consolidated interim financial information in accordance with CPC 21 (R1) and IAS 34 – Interim Financial Reporting, issued by the International Accounting Standards Board – IASB, as well as for the fair presentation of these information in conformity with the standards issued by the Brazilian Securities and Exchange Commission (CVM) applicable to the preparation of Quarterly Financial Information (ITR). Our responsibility is to express a conclusion on this interim financial information based on our review.
Scope of the review
We conducted our review in accordance with Brazilian and International Standards on Review Engagements (NBC TR 2410 and ISRE 2410 - Review of Interim Financial Information Performed by the Independent Auditor of the Entity, respectively). A review of interim financial information consists of making inquiries, primarily of persons responsible for financial and accounting matters, and applying analytical and other review procedures. A review is substantially less in scope than an audit conducted in accordance with International Standards on Auditing and consequently does not enable us to obtain assurance that we would become aware of all significant matters that might be identified in an audit. Accordingly, we do not express an audit opinion.

146
Conclusion on the individual interim financial information
Based on our review, nothing has come to our attention that causes us to believe that the accompanying individual interim financial information included in the quarterly information referred to above is not prepared, in all material respects, in accordance with CPC 21 (R1) applicable to the preparation of Quarterly Financial Information (ITR), consistently with the rules issued by the Brazilian Securities and Exchange Commission - CVM.
Conclusion on the consolidated interim financial information
Based on our review, nothing has come to our attention that causes us to believe that the accompanying consolidated interim financial information included in the quarterly information referred to above is not prepared, in all material respects, in accordance with CPC 21 (R1) and IAS 34 applicable to the preparation of Quarterly Financial Information (ITR), consistently with the rules issued by the Brazilian Securities and Exchange Commission - CVM.
Other matters
Interim value added information
We have also reviewed the individual and consolidated Interim Value Added Information for the nine-month period ended September 30, 2013, prepared under the responsibility of the Company’s management, the presentation of which in the interim information is required by the rules issued by the Brazilian Securities and Exchange Commission (CVM) applicable to the preparation of Quarterly Financial Information (ITR), and as supplemental information under IFRS, whereby no statement of value added presentation is required. These statements have been subject to the same review procedures previously described and, based on our review, nothing has come to our attention that causes us to believe that they are not prepared, in all material respects, according to the overall individual and consolidated interim financial statements.
São Paulo, November 8, 2013
ERNST & YOUNG Auditores Independentes S.S. CRC-2SP015199/O-6 “F” DF
Patricia di Paula da Silva Paz Accountant CRC-1SP198827/O-3 – “S” – DF


![Survey ingl[1]](https://static.fdocuments.us/doc/165x107/549b1bd4b479593d098b46b9/survey-ingl1.jpg)