Online Resources For Writers Luigi Benetton and Malene Jorgensen.
Development of Decision Support Matrices for Climate Change Adaptation Planning Jay S. GreggMalene KauffmannKirsten Halsnæs
1

Risø DTU, Danmarks Tekniske Universitet
Outline
• I. Decision making within the context of climate adaptation
• Identifying risk areas and adaptation options
• Establishing decision making criteria
• Assessing options
• II. Building a hypothetical decision support matrix
2
Risø DTU, Danmarks Tekniske Universitet
Outline
• I. Decision making within the context of climate adaptation
• Identifying risk areas and adaptation options
• Establishing decision making criteria
• Assessing options
• II. Building a hypothetical decision support matrix
3

Risø DTU, Danmarks Tekniske Universitet
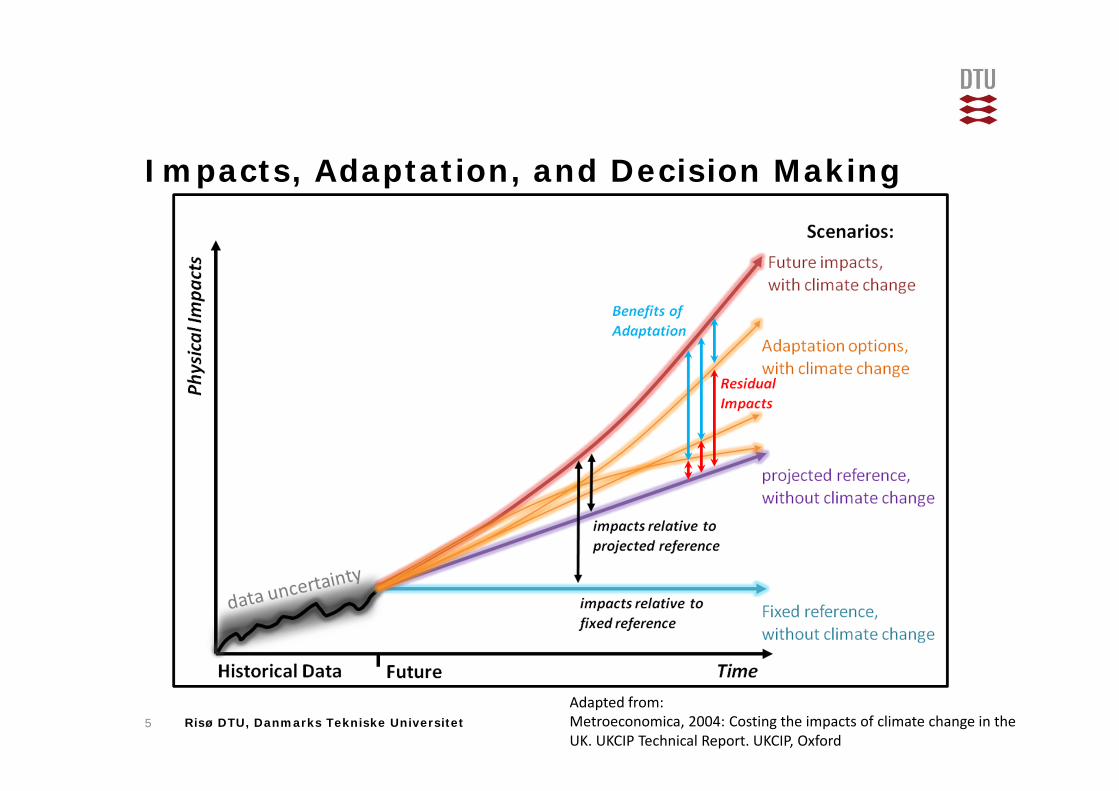
Impacts, Adaptation, and Decision Making
4Adapted from:Metroeconomica, 2004: Costing the impacts of climate change in the UK. UKCIP Technical Report. UKCIP, Oxford
Risø DTU, Danmarks Tekniske Universitet
Impacts, Adaptation, and Decision Making
5Adapted from:Metroeconomica, 2004: Costing the impacts of climate change in the UK. UKCIP Technical Report. UKCIP, Oxford

Risø DTU, Danmarks Tekniske Universitet
Adaptation Strategies and Decision Making:Actors and Process
Define Problem
Identify Risk Areas
Identify Options
Assess Options
Establish Decision Making Criteria
Make and Implement Decision
Monitor and
Re‐assess
Create Reference and Impact Scenarios
Stakeholders Natural Scientists
EconomistsPolicy Makers
6
Decision Support Matrix
Risø DTU, Danmarks Tekniske Universitet
Outline
• I. Decision making within the context of climate adaptation
• Identifying risk areas and adaptation options
• Establishing decision making criteria
• Assessing options
• II. Building a hypothetical decision support matrix
7

Risø DTU, Danmarks Tekniske Universitet
Identifying Risk Areas and Adaptation Options:How are these defined?• Climate change can increase the
probability of a number of different impacts
• Therefore, decision makers should explore a suite of adaptation options, rather than one.
• so...
• How do we decide what these options are?
• And how do we assess them in terms of residual impacts?
8

Risø DTU, Danmarks Tekniske Universitet
Identifying risks and impactsImpact Physical measure Cost Consequences beyond
costFlooding of basement in houses
Number of houses and area
Repair Loss of irreplaceable objects
Erosion of road Distance of road Repair Traffic congestion and delay
Illness from water pollution
Number of person days with sickness
Lost salary, Lost productivity
General loss of wellbeingloss of life
Flooding of local lake Impacts on life in the lake water level
Clean up, restoration Esthetic value,loss of recreational areaillness
Flooding of unique historical building
Physical character of the building
Repair and replacement Esthetic values
Traffic delay Time Lost salary, Lost productivity
Worker morale, lost time for leisure
Loss of recreational areas Area inundated Reparation, clean up,replacement
Lost leisure,visual amenity
9
etc.

Risø DTU, Danmarks Tekniske Universitet
Causal Chain of Impacts
10
Climate Change
Global sea level rise Increased probability of storm surges
Increased probability of
extreme precipitation events
Increased probability of urban flooding Sewer Damage
Basement flooding
House floodingBuilding flooding
Power line damage
Increased fire risk
Loss of productivity
Traffic delays
Road damageLoss of recreational
areas
Loss of visual amenity
Human health and morality
Environmental damage
Property loss
Resettlement

Risø DTU, Danmarks Tekniske Universitet11
Climate Change
Global sea level rise Increased probability of storm surges
Increased probability of
extreme precipitation events
Increased probability of urban flooding Sewer Damage
Basement flooding
House floodingBuilding flooding
Power line damage
Increased fire risk
Loss of productivity
Traffic delays
Road damageLoss of recreational
areas
Loss of visual amenity
Human health and morality
Environmental damage
Property loss
Resettlement
Improve filtering and runoffWetland restorationManage riparian zones
Improve infiltration network
Improve emergency response
Resilient power lines Retrofit buildings
Improve Sewer
Improve evacuation routes
Dams, dykes, levees, sewer
Mapping Adaptation Options

Risø DTU, Danmarks Tekniske Universitet
Outline
• I. Decision making within the context of climate adaptation
• Identifying risk areas and adaptation options
• Establishing decision making criteria
• Assessing options
• II. Building a hypothetical decision support matrix
12

Risø DTU, Danmarks Tekniske Universitet
Decision Criteria: Planning for the Future• We want to know how the extent of impacts and the effectiveness of
adaptation measures, given a value structure. But how do we decide?• How important will a given option be in the future relative to other
options? • How much will it cost and what will be the benefit?• Would adaptation occur anyway on a private level?• What will we learn in the mean time?
• Challenges of modeling the future:• Is it possible for a model to
predict the future?• Is it possible to test the model by running
from a past date to the present?

Risø DTU, Danmarks Tekniske Universitet
Differences between modelingphysical systems vs. conductingpolicy analysisFor policy analysis to make sense, we have two
philosophical assumptions:
1. Non-Determinism:• If we assume that whatever is going to happen is
already predestined, then policy has no role. We have to assume that policy has the power to change the course we are on.
2. Non-Nihilism:• We have to assume that some outcomes are better
than others and that there exists a criteria for deciding between the different outcomes. If not, policy again would have no purpose because every possible future would be equally desirable.
Risø DTU, Danmarks Tekniske Universitet
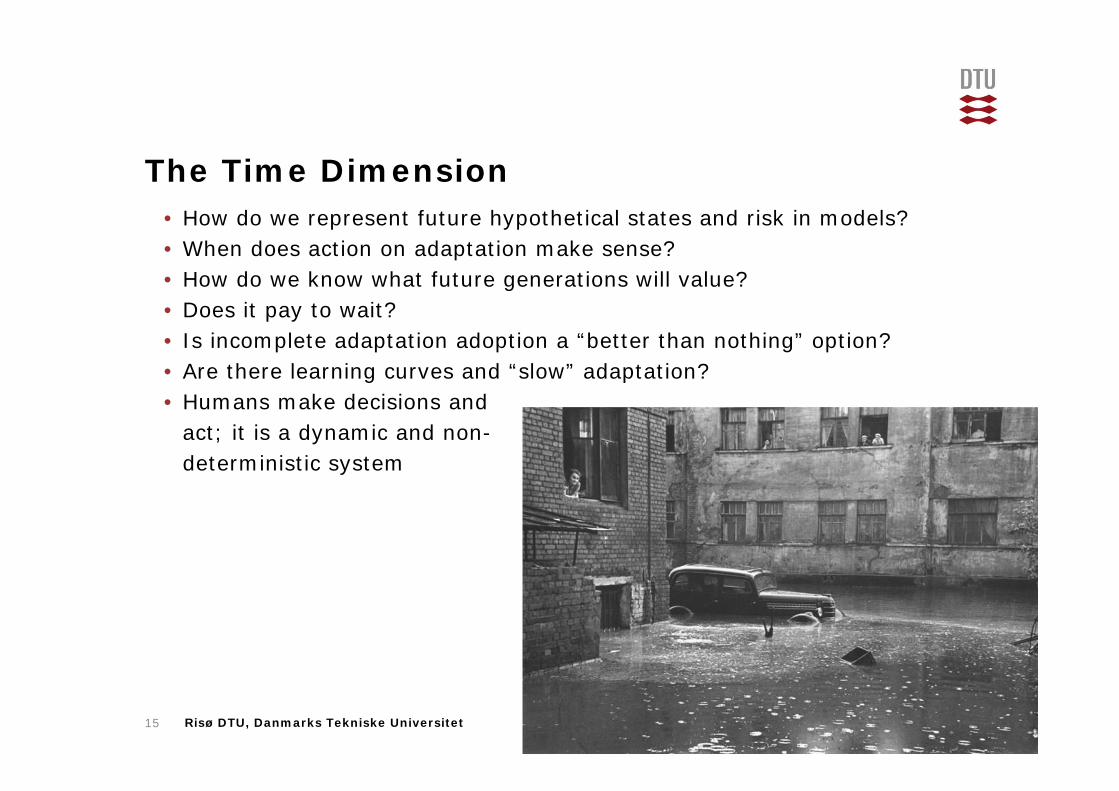
The Time Dimension• How do we represent future hypothetical states and risk in models?• When does action on adaptation make sense?• How do we know what future generations will value?• Does it pay to wait?• Is incomplete adaptation adoption a “better than nothing” option?• Are there learning curves and “slow” adaptation?• Humans make decisions and
act; it is a dynamic and non-deterministic system
15

Risø DTU, Danmarks Tekniske Universitet
Uncertaintye.g., Århus 2009 municipal plan: In the next 20 years:• +50,000 jobs• +10,000-15,000 students • +75,000 population • The council has made environmental and social sustainability a priority in
it vision for the future.
• How does this affect the analysis of future impacts?
• How does this change the decision making criteria?
16

Risø DTU, Danmarks Tekniske Universitet
Establishing Decision Making Criteria• Different sets of values and assumptions about the future will result in
different “optimal” decisions. In other words, there is no optimal decision.
• Different decisions makers will come to different decisions based upon attitudes toward risk, weighing of impacts, predefined non-negotiable constraints, and parallel/competing goals with existing and concurrent policies
17

Risø DTU, Danmarks Tekniske Universitet
Outline
• I. Decision making within the context of climate adaptation
• Identifying risk areas and adaptation options
• Establishing decision making criteria
• Assessing options
• II. Building a hypothetical decision support matrix
18

Risø DTU, Danmarks Tekniske Universitet
Assessing Adaptation Options
19
Define Problem
Identify Risk Areas
Identify Options
Assess Options
Establish Decision Making Criteria
Make and Implement Decision
Monitor and
Re‐assess
Create Reference and Impact Scenarios
Stakeholders Natural Scientists
EconomistsPolicy Makers

Risø DTU, Danmarks Tekniske Universitet
Decision Support Matrix• Goal- Define a tool that can:
• clarify the decision making process• highlight key uncertainties• identify critical assumptions• determine how different a priori values can influence the decision
outcome
20

Risø DTU, Danmarks Tekniske Universitet
Outline
• I. Decision making within the context of climate adaptation
• Identifying risk areas and adaptation options
• Establishing decision making criteria
• Assessing options
• II. Building a hypothetical decision support matrix
21

Risø DTU, Danmarks Tekniske Universitet
Building a Decision Support Matrix
Decision Support Matrix: A systematic way of comparing available choices and options (rows) on the basis of a set of criteria (columns) associated with each hypothetical outcome
22
Options Criterion a Probability (a) Criterion b Prob (b) ... Risk/Expected Cost
Option 1 a1 p(a1) b1 p(b1) ... a1*p(a1); b1*p(b1);...
Option 2 a2 p(a2) b2 p(b2) ... a2*p(a2); b2*p(b2);...
Option 3 a3 p(a3) b3 p(b3) ... a3*p(a3); b3*p(b3);...
: : : : : : :
Option n an p(an) bn p(bn) ... an*p(an); bn*p(bn);...

Risø DTU, Danmarks Tekniske Universitet
Building a Decision Support Matrix
Cost of implementation
Cost of climate event, given adaptation choice
p(extreme event) Expected Cost
Nothing 0 500 .16 0+500*.16= 80
adaptation level 1 10 50 .16 10+50*.16= 18
adaptation level 2 20 20 .16 20+20*.16=23.2
adaptation level 3 100 10 .16 100+10*.16=101.6
Consider a simple case, with one impact, and one adaptation option with 3 different levels of deployment. E.g., cost of building damage due to flooding versus building a sea wall at different heights.
Decision Maker: Can we provide more information on risk? How extreme is extreme?
23

Risø DTU, Danmarks Tekniske Universitet
Building a Decision Support Matrix
Cost of implementation
Cost of 10 year climate event, given adaptation choice
p(10 yr event)
Cost of 20 year climate event, given adaptation choice
p(20 yr event)
Cost of 100 year climate event, given adaptation choice
p(100 yr event)
Expected Cost
Nothing 0 500 .1 1000 .05 50000 .01 600
adaptation level 1 10 50 .1 500 .05 10000 .01 140
adaptation level 2 20 20 .1 200 .05 5000 .01 82
adaptation level 3 100 10 .1 100 .05 1000 .01 116
Now we add a more detailed description of risk, with a 10‐year event, 20‐year event and 100‐year event. In reality, this would be a continuous probability distribution, and we could integrate to find the expected cost.
Decision Maker: What if I want to consider two different adaptation options?24

Risø DTU, Danmarks Tekniske Universitet
Building a Decision Support MatrixNow we add two different options, at 3 discrete levels, and all the permutations. In reality, these would be a joint distribution.
Cost of implementation
Cost of 10 year climate event, given adaptation choice
p(10 yr event) Cost of 20 year climate event, given adaptation choice
p(20 yr event) Cost of 100 year climate event, given adaptation choice
p(100 yr event) Expected Cost
Nothing 0 500 0.1 1000 0.05 50000 0.01 600Sea wall level 1 10 50 0.1 500 0.05 10000 0.01 140Sea wall level 2 20 20 0.1 200 0.05 5000 0.01 82Sea wall level 3 100 10 0.1 100 0.05 1000 0.01 116Park level 1 1 400 0.1 900 0.05 40000 0.01 486Park level 2 5 300 0.1 800 0.05 9000 0.01 165Park level 3 10 200 0.1 700 0.05 4000 0.01 105SW 1, park 1 11 40 0.1 400 0.05 4000 0.01 75SW2, park 1 21 15 0.1 150 0.05 1500 0.01 45SW 3, park 1 101 8 0.1 80 0.05 800 0.01 113.8SW 1, park 2 5 30 0.1 300 0.05 3000 0.01 53SW 2, park 2 25 12 0.1 120 0.05 1200 0.01 44.2SW 3, park 2 105 5 0.1 50 0.05 500 0.01 113SW 1, park 3 20 10 0.1 100 0.05 1000 0.01 36SW 2, park 3 30 5 0.1 50 0.05 500 0.01 38SW 3, park 3 110 2 0.1 20 0.05 200 0.01 113.2
Decision Maker: What if I want to consider more than one type of impact, each with different units?25

Risø DTU, Danmarks Tekniske Universitet
Building a Decision Support MatrixNow we add two impacts, with different cost units (e.g., one monetary, one non‐monetary)
Cost of implementation
Cost of 10 year climate event, given adaptation choice
p(10 yr event) Cost of 20 year climate event, given adaptation choice
p(20 yr event) Cost of 100 year climate event, given adaptation choice
p(100 yr event) Expected Cost
Nothing 0 500 30 0.1 1000 50 0.05 50000 100 0.01 600 6.5Sea wall level 1 10 50 1 0.1 500 5 0.05 10000 15 0.01 140 10.5Sea wall level 2 20 20 0 0.1 200 2 0.05 5000 10 0.01 82 20.2Sea wall level 3 100 10 0 0.1 100 0 0.05 1000 5 0.01 116 100.1Park level 1 1 400 1 0.1 900 5 0.05 40000 20 0.01 486 1.55Park level 2 5 300 0 0.1 800 2 0.05 9000 10 0.01 165 5.2Park level 3 10 200 0 0.1 700 0 0.05 4000 9 0.01 105 10.09SW 1, park 1 11 40 0 0.1 400 3 0.05 4000 10 0.01 75 11.25SW2, park 1 21 15 0 0.1 150 1 0.05 1500 6 0.01 45 21.11SW 3, park 1 101 8 0 0.1 80 1 0.05 800 4 0.01 113.8 101.1SW 1, park 2 5 30 0 0.1 300 1 0.05 3000 8 0.01 53 5.13SW 2, park 2 25 12 0 0.1 120 0 0.05 1200 5 0.01 44.2 25.05SW 3, park 2 105 5 0 0.1 50 0 0.05 500 3 0.01 113 105SW 1, park 3 20 10 0 0.1 100 1 0.05 1000 6 0.01 36 20.11SW 2, park 3 30 5 0 0.1 50 0 0.05 500 2 0.01 38 30.02SW 3, park 3 110 2 0 0.1 20 0 0.05 200 1 0.01 113.2 110
Decision Maker: How do I decide between the two expected costs? What level of risk is acceptable across all variables?
26

Risø DTU, Danmarks Tekniske Universitet
Building a Decision Support Matrix
x11x12x13x14
W(x)
x10
x20
x30
x40
X1
X2
X3
X4
X0
x10x10x10x10
X1 W(X1, (A1))Value FunctionAltered StateOriginal State Preference
Function
ImpactsRisk = cost x p(event)
Hypothetical Adaptation Choice
Value Weights‐importance, constraints,
previous policies27
Risø DTU, Danmarks Tekniske Universitet
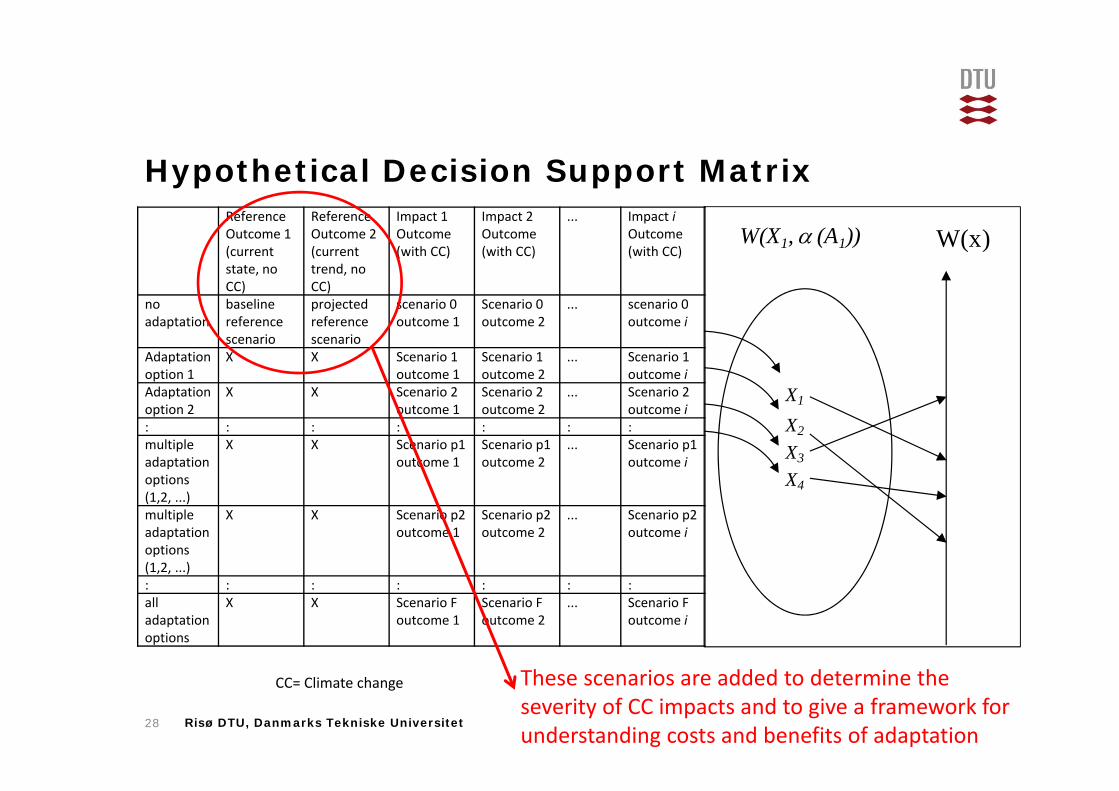
Hypothetical Decision Support MatrixReference Outcome 1(current state, no CC)
Reference Outcome 2(current trend, no CC)
Impact 1Outcome (with CC)
Impact 2 Outcome (with CC)
... Impact iOutcome (with CC)
no adaptation
baselinereference scenario
projectedreferencescenario
scenario 0outcome 1
Scenario 0 outcome 2
... scenario 0 outcome i
Adaptation option 1
X X Scenario 1 outcome 1
Scenario 1 outcome 2
... Scenario 1 outcome i
Adaptation option 2
X X Scenario 2 outcome 1
Scenario 2 outcome 2
... Scenario 2 outcome i
: : : : : : :multiple adaptation options (1,2, ...)
X X Scenario p1outcome 1
Scenario p1 outcome 2
... Scenario p1 outcome i
multiple adaptation options (1,2, ...)
X X Scenario p2 outcome 1
Scenario p2 outcome 2
... Scenario p2 outcome i
: : : : : : :all adaptation options
X X Scenario F outcome 1
Scenario F outcome 2
... Scenario F outcome i
CC= Climate change
W(x)
X1
X2
X3
X4
W(X1, (A1))
These scenarios are added to determine the severity of CC impacts and to give a framework for understanding costs and benefits of adaptation
28

Risø DTU, Danmarks Tekniske Universitet
Decision Support and the Decision Maker
29
Define Problem
Identify Risk Areas
Identify Options
Assess Options
Establish Decision Making Criteria
Make and Implement Decision
Monitor and
Re‐assess
Create Reference and Impact Scenarios
Stakeholders Natural Scientists
EconomistsPolicy Makers
Decision Support Matrix
The value function is dependent on the decision maker. Therefore, while the matrix can help clarify a decision, it cannot “tell us what we should do.” It is not normative.
Risø DTU, Danmarks Tekniske Universitet
Conclusions• A Decision Support Matrix is a tool to aid in decision making, but not
something that can make the decision itself
• It can become complex very quickly when considering adaptation planning: there are many possible options and timing
• One of the major challenges is to design a way to test different adaptation options iteratively and in multiple cost dimensions, and that represents plausible future scenarios
• The process of building the matrix can highlightsources of uncertainty and key assumptions
• The matrix can simplify the process of testing manydifferent future scenarios
30


![[PPT]Tema 2.- MATRICES - Open Course Ware Moodle 2.5 · Web viewMATRICES PRODUCTO DE MATRICES POTENCIAS NATURALES DE MATRICES CUADRADAS MATRICES SUMA DE MATRICES. PRODUCTO DE UN ESCALAR](https://static.fdocuments.us/doc/165x107/5c17a16c09d3f2c7368c2ad2/ppttema-2-matrices-open-course-ware-moodle-25-web-viewmatrices-producto.jpg)