
Development and Testing of Traffic Management and Control Measures
87
Cooperative Mobility Systems and Services for Energy Efficiency Project supported by European Union DG INFSO ICT-2009-6.1, ICT for Clean and Efficient mobility Project reference FP7-ICT-2009-4 IP Proposal - 247908 IP Manager Jean Charles Pandazis, ERTICO – ITS Europe Tel: +32 2 400 0714 E-mail: [email protected] D543.57 (D5.7) Development and Testing of Traffic Management and Control Measures SubProject No. SP5 SubProject Title EcoTraffic Management and Control Workpackage No. WP4 Workpackage Title Implementation Task No. T5.4.3 Task Title Develop the Simulation Environment for Testing and Evaluation Authors Jonas Lüßmann, Jaap Vreeswijk, Paul Mathias, Bart Netten, Robin Blokpoel, Frans van Waes, Frédéric Ambleton, Ronald van Katwijk, Matthias Mann Dissemination level PU/PP/RE/CO PU File Name 130416-DEL-SP5-D543.57-Development and Testing of Traffic Mgmnt & Control Measures Due date 31.03.2013 Delivery date 19.04.2013 Abstract This deliverable will contain: the instructions for setting up a simulation environment in which the systems can be tested and validated, basic data-sets and parameters for setting up the test-bed for the SP5 systems. It will also present the Traffic Management and Control Measures implemented within the eCoMove extended simulation environment and the test results.
Transcript of Development and Testing of Traffic Management and Control Measures
Cooperative Mobility Systems and Services for Energy Efficiency
Project supported by European Union DG INFSO ICT-2009-6.1, ICT for Clean and Efficient mobility
Project reference FP7-ICT-2009-4 IP Proposal - 247908 IP Manager Jean Charles Pandazis, ERTICO – ITS Europe
Tel: +32 2 400 0714E-mail: [email protected]
D543.57 (D5.7) Development and Testing of Traffic Management and Control Measures
SubProject No. SP5 SubProject Title EcoTraffic Management and Control
Workpackage No. WP4 Workpackage Title Implementation
Task No. T5.4.3 Task Title Develop the Simulation Environment for Testing and Evaluation
Authors Jonas Lüßmann, Jaap Vreeswijk, Paul Mathias, Bart Netten, Robin Blokpoel, Frans van Waes, Frédéric Ambleton, Ronald van Katwijk, Matthias Mann
Dissemination level PU/PP/RE/CO
PU
File Name 130416-DEL-SP5-D543.57-Development and Testing of Traffic Mgmnt & Control Measures
Due date 31.03.2013
Delivery date 19.04.2013
Abstract This deliverable will contain: the instructions for setting up a simulation environment in which the systems can be tested and validated, basic data-sets and parameters for setting up the test-bed for the SP5 systems. It will also present the Traffic Management and Control Measures implemented within the eCoMove extended simulation environment and the test results.
eCoMove D543.57(D5.7)- Development and Testing of Traffic Management and Control Measures
31/01/2013 II Version Final
Control sheet
Version history
Version Date Main author Summary of changes 0.1 24.05.2012 Matthias Mann Initial input
0.2 08.06.2012 Paul Mathias Robin Blokpoel Matthias Mann
Integration of partner contribution
0.3 13.06.2012 Matthias Mann Com Manager and Map Feeder
0.4 14.06.2012 Matthias Mann Improvement TS Munich
0.5 18.09.2012 Matthias Mann Frans van Waes Robin Blokpoel
Integration of partner contribution
0.6 18.09.2012 Matthias Mann Coen Bresser Jonas Lüssmann
Integration of partner contribution
0.7 18.10.2012 Matthias Mann Frédéric Ambleton Ronald van Katwijk Bart Netten
Integration of partner contribution
0.8 19.12.2012 Matthias Mann Integration of recommendations from peer review
0.9 20.12.2012 Matthias Mann Integration of partner contribution (TUM, MAT, PTV, ASFA, Technolution, ..)
1.0 31.01.2013 Matthias Mann Jaap Vreeswijk
Document ready Verified
Name Date Prepared Matthias Mann 31.01.2013 Reviewed Guillaume Vernet
Peter Huis in het Veld 29.11.2012
Authorized Jean-Charles Pandazis 18.04.2013 Verified Manuela Flachi 16.04.2013 Circulation
Recipient Date of submission xx-xx-xxxx
Project partners 08.03.2013 European Commission 19.04.2013

eCoMove D543.57(D5.7)- Development and Testing of Traffic Management and Control Measures
31/01/2013 3 Version Final
Table of Contents
1 INTRODUCTION .............................................................................................................. 9
1.1 SYSTEM OVERVIEW ........................................................................................... 9 1.2 BACKGROUND ................................................................................................... 9 1.3 DOCUMENT OVERVIEW ................................................................................... 10 1.4 DOCUMENT STRUCTURE .................................................................................. 10
2 FUNCTIONAL DESCRIPTION OF THE MICRO SIMULATION ADAPTER ............................................................................................................................... 11
2.1 ROLE OF SIMULATION IN ECOMOVE ................................................................ 11 2.2 FUNCTIONAL REQUIREMENTS ON MS ADAPTER .............................................. 11 2.3 OVERVIEW OF THE MS-ADAPTER .................................................................... 12 2.4 VISSIM INTERFACES ...................................................................................... 12
2.4.1 VISSIM Com Interface ............................................................................. 12 2.4.2 VISSIM Car2X Module ............................................................................ 13 2.4.3 VISSIM Driver Model DLL Interface ...................................................... 13 2.4.4 External Signal Control DLL Interface ................................................... 13 2.4.5 ANM file interface .................................................................................... 14
2.5 COMPONENTS OF THE MS-ADAPTER ............................................................... 14 2.5.1 VISSIM COM Adapter ............................................................................. 14 2.5.2 External Fixed Time Controller (‘extFTC’) ............................................ 14 2.5.3 ecoNetwork Prediction ............................................................................. 14 2.5.4 ecoMap NetState Adapter ........................................................................ 15 2.5.5 TLC Adapter ............................................................................................. 15 2.5.6 NetState Converter ................................................................................... 15 2.5.7 Virtual COM Manager ............................................................................. 15 2.5.8 Peek TLC .................................................................................................. 16 2.5.9 Subchapter on COMManager .................................................................. 16 2.5.10 Subchapter on Map Feeder .................................................................. 16
3 TEST SIDE MODELLING ............................................................................................. 17
3.1 HELMOND ........................................................................................................ 17 3.2 MUNICH ........................................................................................................... 18 3.3 FRENCH MOTORWAY ....................................................................................... 21
4 INSTALLATION INSTRUCTIONS FOR SETTING UP THE SIMULATION ENVIRONMENT ........................................................................................ 24
4.1 INTRODUCTION ................................................................................................ 24 4.2 PREREQUISITES ................................................................................................ 24 4.3 GENERAL ......................................................................................................... 24 4.4 ECOMAP .......................................................................................................... 24
4.4.1 Installation ............................................................................................... 24 4.4.2 Configuration ........................................................................................... 24 4.4.3 Start .......................................................................................................... 25 4.4.4 Remark ..................................................................................................... 25
4.5 KNOPFLERFISH ................................................................................................ 25 4.5.1 Configuration ........................................................................................... 25
eCoMove D543.57(D5.7)- Development and Testing of Traffic Management and Control Measures
31/01/2013 4 Version Final
4.5.2 restart.xargs .......................................................................................... 27 4.6 VISSIM ........................................................................................................... 28
4.6.1 Remarks .................................................................................................... 28 4.6.2 Start .......................................................................................................... 28 4.6.3 Operation ................................................................................................. 28
5 VERIFICATION OF ECOMOVE APPLICATION AND COMPONENTS ...................................................................................................................... 29
5.1 VERIFICATION OVERVIEW FOR ECONETWORK PREDICTION ............................. 29 5.1.1 Verification Test 2: Estimation of current and future traffic states ......... 29 5.1.2 Verification Test 3: Estimation of ideal / desired traffic states ............... 30
5.2 VERIFICATION OVERVIEW FOR ECOROUTEADVICE .......................................... 33 5.2.1 Verification Test Case 1: Generate eco routes for eCoMove vehicles .... 33 5.2.2 Evaluation of verification Test Case 1 ..................................................... 35
5.3 VERIFICATION OVERVIEW FOR ECOPARKADVICE ............................................ 35 5.3.1 Test case 1: Component test .................................................................... 35
5.4 VERIFICATION OVERVIEW FOR ECOGREEN WAVE ........................................... 39 5.4.1 Verification Test Case 1: Calculate offsets (and progressive speeds) for signal programs on coordinated intersections ...................................................... 39 5.4.2 Evaluation of verification Test Case 1 ..................................................... 41
5.5 VERIFICATION OVERVIEW FOR ECOBALANCED PRIORITY ................................ 42 5.5.1 Test case 1: Various tests in one simulation ............................................ 42 5.5.2 Test case 2: Various tests on the real test site ......................................... 45
5.6 VERIFICATION OVERVIEW FOR ECORAMP METERING ...................................... 46 5.6.1 Verification Test Case 1: Calculate time slots for eCoMove vehicles approaching the ramp metering. ........................................................................... 47 5.6.2 Verification Test Case 2: Virtual Stop Lines ........................................... 48 5.6.3 Verification Test Case 2: Truck Priority strategy .................................... 51
5.7 VERIFICATION OVERVIEW FOR ECOSPEED AND HEADWAY MANAGEMENT ...... 53 5.7.1 Verification Test Case 1: Prevent and mitigate shockwaves in traffic flow 53
5.8 VERIFICATION OVERVIEW FOR ECOTRUCK PARKING ....................................... 56 5.8.1 Verification Test Case A functional verifications “number of places available on the park must be properly assessed”: .............................................. 56 5.8.2 Verification Test Case B functional verifications “Status of the truck parking area must correspond to reality”: ........................................................... 57 5.8.3 Verification Test Case C functional verifications “vehicle is properly positioned on a road, with a correct direction”: .................................................. 58 5.8.4 Verification Test Case D functional verifications “Downstream Truck Parking Areas are sent to the OBU”: ................................................................... 58 5.8.5 Verification Test Case E functional verifications “The system should give the TruckParking information to the relevant truck”: .......................................... 60
5.9 VERIFICATION OVERVIEW FOR ECOTOLLING ................................................... 61 5.10 VERIFICATION OVERVIEW FOR DRIVER INFO SUPPORT AND DRIVER
DIALOGUE MANAGER ................................................................................................ 62 5.10.1 Verification Test 1: Location reference used is map independent and ecoMessages are map independently referenced .................................................. 63
eCoMove D543.57(D5.7)- Development and Testing of Traffic Management and Control Measures
31/01/2013 5 Version Final
5.10.2 Verification Test 2: Vehicles, fleet operators and navigation service provider can request tailored ecoMessages from the infrastructure service provider 67
5.11 VERIFICATION OVERVIEW FOR ECOAPPROACH ADVICE................................ 71 5.11.1 Verification Test 1: Calculate time slots and lane advice for eCoMove vehicles approaching an intersection .................................................................... 72
5.12 VERIFICATION OVERVIEW FOR ECOEMISSION ESTIMATION .......................... 75 5.12.1 Verification overview eCoMove CO2 Micro Emission Module ........... 75 5.12.2 Verification overview eCoMove CO2 Macro Emission Module .......... 78

eCoMove D543.57(D5.7)- Development and Testing of Traffic Management and Control Measures
31/01/2013 6 Version Final
FIGURES Figure 1: System overview with ‘NetState’ and ‘NetState Converter’. ....................... 12 Figure 2: roadside units in Helmond ............................................................................ 17 Figure 3: VISSIM model for Helmond ........................................................................ 17 Figure 4: VISSIM model of a complex intersection .................................................... 18 Figure 5: TS Munich .................................................................................................... 19 Figure 6: Example of Signal Plan ................................................................................ 20 Figure 7: VISUM macroscopic model for Munich ...................................................... 20 Figure 8: microscopic 3D model of an intersection ..................................................... 21 Figure 9: Tours ............................................................................................................. 22 Figure 10: VISSIM ramp ............................................................................................. 23 Figure 11: VISSIM up stream speed limits and Sorigny toll gate ............................... 23 Figure 12: All JAVA bundles (except for default Knopflerfish's) and their dependencies. ............................................................................................................... 26 Figure 13: The interplay of VISSIM, VISSIM COM Adapter and ecoNetwork Prediction. .................................................................................................................... 30 Figure 14: VISSIM test network with 4 local routing decisions that belong to the two different destinations. The green lines are speed decisions (40 km/h) that reduce the capacity of the respective links. ................................................................................... 31 Figure 15: The ecoNetwork Prediction model shows in its 3D visualization how the destination sub-flows are routed through the network: left=applied o-d-routes to the destination 1, right=applied o-d-routes to the destination 2. ....................................... 32 Figure 16: Example of a route definition with VISSIM IDs ....................................... 34 Figure 17: ecoParkAdvice application ......................................................................... 36 Figure 18: ecoParkAdvice configuration for Helmond ............................................... 37 Figure 19: Origin and destination used for verification ............................................... 37 Figure 20: Cooperative vehicle detection .................................................................... 43 Figure 21: Normal vehicle detection ............................................................................ 43 Figure 22: Green phase requested for signal group 08 ................................................ 44 Figure 23: Priority for SG on the west wins over conflicting traffic from the north ... 44 Figure 24: CPU load for application in the field RSU ................................................. 45 Figure 25: The ecoRamp Metering simulation environment. ...................................... 46 Figure 26: Virtual Stop Line strategy in operation in AIMSUN ................................. 49 Figure 27: Comparison of typical vehicles on on-ramp without and with VSL activated ....................................................................................................................... 50 Figure 28: Speed measures (black lines) along the route at 90 (left) and 120 (right) seconds, with vehicle speeds (blue dots). .................................................................... 55 Figure 29: Vehicle trajectories of vehicle location versus time with vehicle speed (color) in km/h. ............................................................................................................ 55 Figure 30: View of a test “2 oct 7h46.50” made southbound close to truck parking area of Lunel ................................................................................................................ 59 Figure 31: View of the 3 last positions of the OBU when the “2 oct 7h46.50” test occurred with Kilometric Point indication ................................................................... 60 Figure 32: Positions of Lunel Truck Area and of the OBU when the “2 oct 7h46.50” test occurred with Kilometric Point indication. ........................................................... 60 Figure 33: Toll area, driving direction from left to right ............................................. 61 Figure 34: Sample location in Bavaria (Intersection München Süd on highway A995) using AGORA-C as method for map independent location referencing ..................... 64

eCoMove D543.57(D5.7)- Development and Testing of Traffic Management and Control Measures
31/01/2013 7 Version Final
Figure 35: Sample location in Helmond (N270, Lagedijk, Engelseweg) using OpenLR as method for map independent location referencing .................................................. 65 Figure 36: TPEG-TEC message using OpenLR as method for location referencing .. 66 Figure 37: TPEG-TFP message using AGORA-C as method for location referencing ...................................................................................................................................... 67 Figure 38: post init request to ecoATS service ............................................................ 68 Figure 39: receive session id from ecoATS service ..................................................... 68 Figure 40: send get message request to ecoATS service ............................................. 69 Figure 41: get messages from ecoATS service ............................................................ 70 Figure 42: terminate session ........................................................................................ 70 Figure 43: Platoon shaping with the approach advice system. The brighter the colour, the higher the advised speed, vopt. .............................................................................. 72 Figure 44: Program sequence of the ecoApproachAdvice. ......................................... 73 Figure 45: Verification test network with distances between inersections in meter. ... 74 Figure 46: Effect of road inclination on additional vehicle load ................................. 75 Figure 47: Measured CO2 emissions compared to modelled CO2 emissions uphill (three minute ride) ........................................................................................................ 76 Figure 48: Measured CO2 emissions compared to modelled CO2 emissions uphill (11 seconds on relatively steep uphill) ............................................................................... 76 Figure 49: Example vehicle ride information for vehicle of type ‘car’ from a combined VISSIM/VERSIT+ simulation for a single lane roundabout with ‘high traffic’ density (1100 vehicles/hour) and ‘high truck’ traffic (10% trucks). ............... 82 Figure 50: Example vehicle ride information for vehicle of type ‘truck’ from a combined VISSIM/VERSIT+ simulation for a single lane roundabout with ‘high traffic’ density (1100 vehicles/hour) and ‘high truck’ traffic (10% trucks). ............... 83 Figure 51: Identification and derivation of macroscopic CO2 emission relation ER(Vm) for vehicles of type ‘car’ from the time dependent data simulated for a single lane roundabout with ‘high truck’ traffic (10% trucks) and three traffic intensities (400, 700 and 1100 vehicles/hour). Upper graph: averaging time 1 second. Lower graph: averaging time 10 minutes. ............................................................................... 84 Figure 52: Identification and derivation of macroscopic CO2 emission relation ER(Vm) for vehicles of type ‘truck’ from the time dependent data simulated for a single lane roundabout with ‘high truck’ traffic (10% trucks) and three traffic intensities (400, 700 and 1100 vehicles/hour). Upper graph: averaging time 1 second. Lower graph: averaging time 10 minutes. ................................................................... 85 Figure 53: Macroscopic CO2 emission relation tables ER(Vm|Sz) for vehicles of type ‘car’ (upper graph) and ‘truck’ (lower graph) on a single lane roundabout with a speed limit of 50 km/h. .......................................................................................................... 86 Figure 54: An example of the data as can be calculated with the eCoMove CO2 Macro Emission Module ‘CO2eCoMove _P’ and extracted and displayed with ‘Get2DPar’: the total CO2 emission per link (X-axis) per time period as a function of time (Y-axis). ............................................................................................................... 87

eCoMove D543.57(D5.7)- Development and Testing of Traffic Management and Control Measures
31/01/2013 8 Version Final
TABLES Table 1: Finalised eCoMove Deliverables ............. Error! Bookmark not defined. Table 2: Future eCoMove Deliverables ................. Error! Bookmark not defined. Table 3: eCoMove reference documents ................ Error! Bookmark not defined. Table 4: Data available at the SVN server ............. Error! Bookmark not defined. Table 5: Requirements on the Micro Simulation Adapter ..................................... 11 Table 6: Results of simulation ecoRamp Metering Application with different penetration rates of equipped cooperative vehicles ..................................................... 48 Table 7: Results for virtual stop line strategy ........................................................ 50 Table 8: results for truck priority strategy .............................................................. 52
TERMS AND ABBREVIATIONS Abbreviation Definition ANM Abstract Network Model CAM Cooperative Awareness Message CCOL Dutch standard used for traffic light control COM interface serial interface RS-232 DENM Decentralized Notification Message Enviver Model for CO2 emissions from TNO FTC Fixed Time Controller FVD KP Kilometric Point MS Adapter Micro Simulation Adapter OBU Onboard unit PM particle matter RSU Roadside Unit SC Signal Control SG Signal group TLC Traffic Light Controller TMC Traffic Management Centre TP Truck Priority VCOM VISSIM COM Adapter VISSIM Micro-simulation model from PTV-Group VSL Virtual Stop Line
eCoMove D543.57(D5.7)- Development and Testing of Traffic Management and Control Measures
31/01/2013 9 Version Final
1 Introduction 1.1 System Overview The eCoMove system is designed to tackle the problem of energy efficiency in road transport by applying the latest vehicle-to-infrastructure and vehicle-to-vehicle communication technologies to create an integrated solution comprising cooperative eco-driving support and eco-traffic management. The project aims to demonstrate that the combination of these new intelligent communication technologies can potentially lead to overall fuel savings and CO2 emission reductions of up to 20 %. 1.2 Background
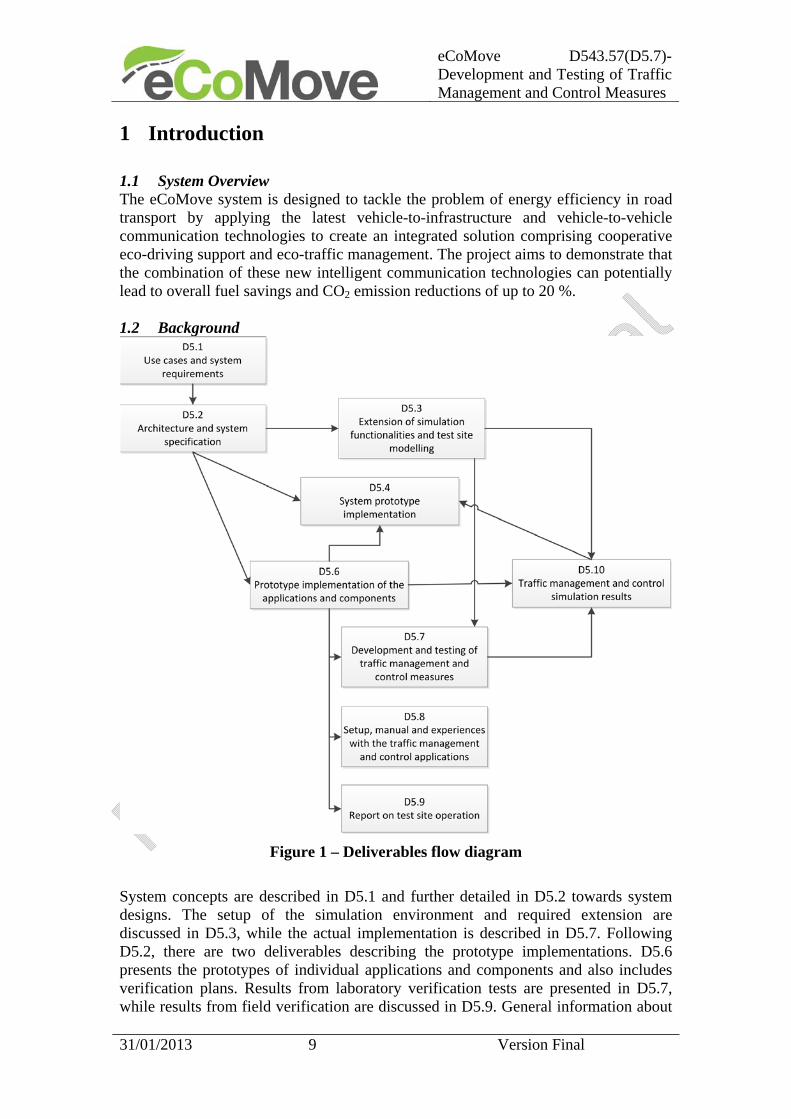
Figure 1 – Deliverables flow diagram
System concepts are described in D5.1 and further detailed in D5.2 towards system designs. The setup of the simulation environment and required extension are discussed in D5.3, while the actual implementation is described in D5.7. Following D5.2, there are two deliverables describing the prototype implementations. D5.6 presents the prototypes of individual applications and components and also includes verification plans. Results from laboratory verification tests are presented in D5.7, while results from field verification are discussed in D5.9. General information about
eCoMove D543.57(D5.7)- Development and Testing of Traffic Management and Control Measures
31/01/2013 10 Version Final
the setup of applications, operational instructions and practical experiences are reported in D5.8. Validation results are discussed in two deliverables. D5.9 includes the results from field validation, while D5.10 is dedicated to impact figures coming from simulation activities. Finally, D5.4 addresses the integration of applications, both in terms of technology as in terms of synergies where impact is concerned. 1.3 Document Overview This document especially focuses on the simulation environment for traffic management and control measures and the outcome of component and application verification. The reader should note that ‘simulation model’ or ‘simulation environment’ refers to microscopic traffic simulation software like VISSIM, not to be confused with the ecoStrategic Model which is a macroscopic state estimation model. Although this document gives an overview of the simulation environment and verification of applications using the simulation environment, it is important to keep in mind that the same setup will be used for validation and impact assessment. Model calibration and simulation results such as impact figures will be reported in D5.10. 1.4 Document Structure This document is arranged as follows:
Chapter 2 summarizes the referenced documents: deliverables, external
documents, and available online development tools.
Chapter 3 gives a functional description of the micro simulation adapter and
its components as they have been developed.
Chapter 4 presents detailed information about the modeling of the simulation test sites Helmond, Munich and the French Motorway.
Chapter 5 describes the installation instructions for setting up the simulation
environment.
Chapter 6 provides an overview and the results of the verification of
eCoMove application and components from a simulation perspective.

eCoMove D543.57(D5.7)- Development and Testing of Traffic Management and Control Measures
31/01/2013 11 Version Final
2 Functional Description of the Micro Simulation Adapter This chapter summarizes the purpose of the Micro Simulation Adapter (MS Adapter) and defines the in- and outputs of this component as defined in the system architecture.
2.1 Role of Simulation in eCoMove As there is a only a limited number of eCoMove equipped vehicles for developing and testing the eCoMove applications in a real environment, traffic simulation plays an important role in the process of the development of functions, in the preparation of field trials and the final impact assessment of the eCoMove System on network level. Therefore, simulation sub-systems will be set up in eCoMove to support the development, the in-loop-testing, the verification of infrastructure functional components and applications and the validation of the whole system.
In order to perform a large scale evaluation of the concept a microscopic simulation environment is being implemented that shall models the reality with installed eCoMove applications as realistic as possible. The main requirements for the simulation environment are (1) to integrate the eCoMove applications without any changes from their test site implementation, (2) to be able to influence the behaviour of the vehicles according to real implementation behaviour, and (3) to systematically assess the impact of eCoMove applications.
2.2 Functional requirements on MS Adapter Table 1 provides a list with functional requirements on the simulation environment and the micros simulation adapter. References to the requirements can be found in deliverable Error! Reference source not found..
REQ NR. Description
ECOM-RQ-SP5-0112
The micro simulation models should be capable of modelling traffic movements, traffic-related inefficiencies and the eCoMove applications and components in a realistic way.
ECOM-RQ-SP5-0114
The simulation environment support developers in testing their applications and components.
ECOM-RQ-SP5-0115
The simulation environment support roads operators in deteriming the effects of traffic management and control strategies.
ECOM-RQ-SP5-0121
Simulation models should include control data (junction control, signal plans, VMS and ramp metering locations).
ECOM-RQ-SP5-0123
Information should be exchanged between vehicles/drivers and infrastructure like this is done in reallity.
ECOM-RQ-SP5-0124
Exchange of information is feasible between simulation environment and applications and components.
ECOM-RQ-SP5-0126
Link up to an emission model.
Table 1: Requirements on the Micro Simulation Adapter
eCoMove D543.57(D5.7)- Development and Testing of Traffic Management and Control Measures
31/01/2013 12 Version Final
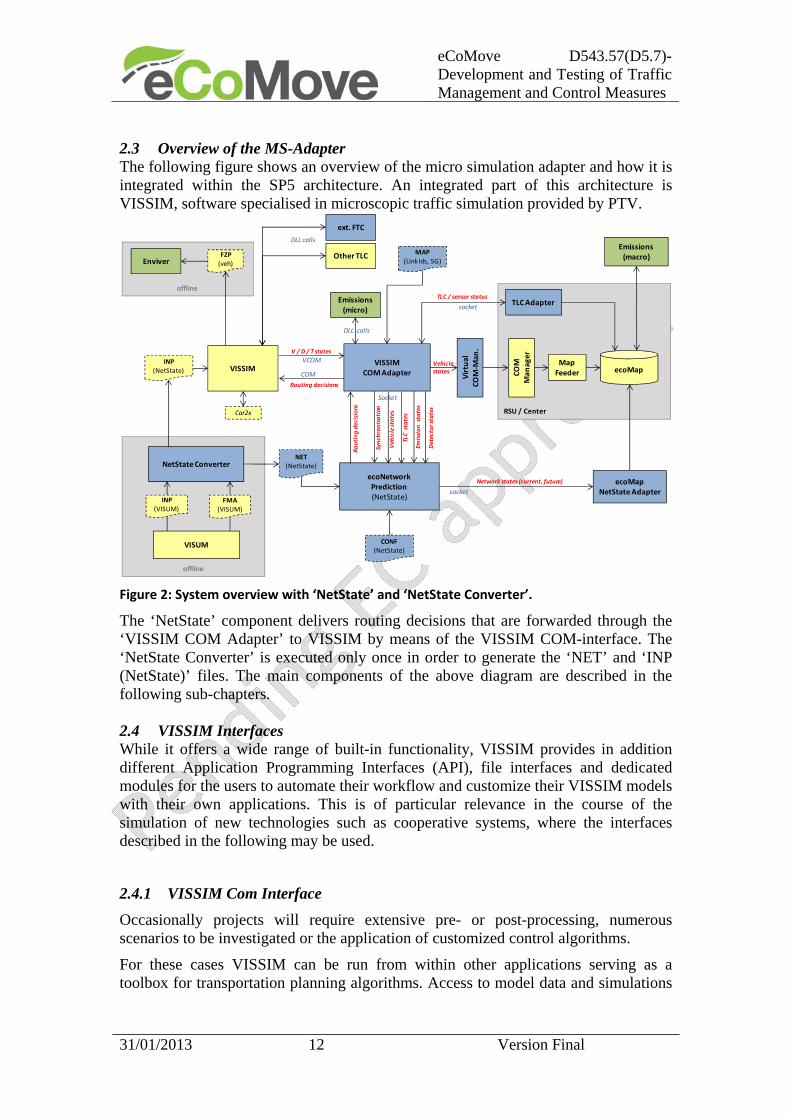
2.3 Overview of the MS-Adapter The following figure shows an overview of the micro simulation adapter and how it is integrated within the SP5 architecture. An integrated part of this architecture is VISSIM, software specialised in microscopic traffic simulation provided by PTV.
Figure 2: System overview with ‘NetState’ and ‘NetState Converter’.
The ‘NetState’ component delivers routing decisions that are forwarded through the ‘VISSIM COM Adapter’ to VISSIM by means of the VISSIM COM-interface. The ‘NetState Converter’ is executed only once in order to generate the ‘NET’ and ‘INP (NetState)’ files. The main components of the above diagram are described in the following sub-chapters. 2.4 VISSIM Interfaces While it offers a wide range of built-in functionality, VISSIM provides in addition different Application Programming Interfaces (API), file interfaces and dedicated modules for the users to automate their workflow and customize their VISSIM models with their own applications. This is of particular relevance in the course of the simulation of new technologies such as cooperative systems, where the interfaces described in the following may be used.
2.4.1 VISSIM Com Interface
Occasionally projects will require extensive pre- or post-processing, numerous scenarios to be investigated or the application of customized control algorithms.
For these cases VISSIM can be run from within other applications serving as a toolbox for transportation planning algorithms. Access to model data and simulations
offline
offline
ext. FTC
INP
(NetState)
Car2x RSU / Center
COM
Manager
Map Feeder ecoMap
TLC Adapter
VISSIMCOM Adapter
VCOM
DLL calls
Vehicle states
Virtual
COM‐M
an.
socket
Tool
NetState ConverterNET
(NetState)
ecoNetworkPrediction (NetState)
TLC states
Detector states
Routing decisions
Routing decisions
COM
V / D / T states
VISUM
INP(VISUM)
FMA
(VISUM)
EnviverFZP
(veh)
VISSIM
Emissions (macro)
Synchronisation
Socket
CONF(NetState)
Vehicle states
Emissions (micro)
DLL calls
Emission states
TLC / sensor status
MAP
(Link Ids, SG)Other TLC
ecoMapNetState Adapter
Network states (current, future)
socket
eCoMove D543.57(D5.7)- Development and Testing of Traffic Management and Control Measures
31/01/2013 13 Version Final
is provided through a COM interface, which allows VISSIM to work as an Automation Server and to export the objects, methods and properties.
The VISSIM COM interface supports Microsoft Automation, so you can use any of the RAD (Rapid Application Development) tools ranging from scripting languages like Visual Basic Script or Java Script to programming environments like Visual C++ or Visual J++. Scripts can also be started from within VISSIM (internal scripting).
2.4.2 VISSIM Car2X Module
The Car2X Module allows the implementation and tests of applications that use Vehicle-to-Vehicle and/or Vehicle-to-Infrastructure communication. The algorithms for the Car2X applications can be written as Python script or C++ program. It can access data of the vehicles which have the respective equipment flag set in the vehicle type and defines when vehicles send messages to nearby vehicles and how vehicles react on messages received from other vehicles. Also the wireless communication range is modelled by the Car2X module. The wireless communication is modelled in a separate *.DLL, which is part of the Car2X module.
During the test and verification phase, PTV released several updates of the Car2X module to cover specific by eCoMove requested extensions.
2.4.3 VISSIM Driver Model DLL Interface
The External Driver Model DLL Interface of VISSIM provides the option to replace the internal driving behavior by a fully user-defined behavior for some or all vehicles in a simulation run.
The user-defined algorithm must be implemented in a DLL written in C/C++ which contains specific functions.
During a simulation run, VISSIM calls the DLL code for each affected vehicle in each simulation time step to determine the behavior of the vehicle. VISSIM passes the current state of the vehicle and its surroundings to the DLL and the DLL computes the acceleration / deceleration of the vehicle and the lateral behavior (mainly for lane changes) and passes the updated state of the vehicle back to VISSIM.
The external driver model can be activated for each vehicle type separately in the dialog box Vehicle Type by checking the checkbox Use external driver model on the tab page External Driver Model and selecting a driver model DLL file and optionally a parameter file to be used.
2.4.4 External Signal Control DLL Interface
Users can also define external signal controllers using the signal controller *.DLL and signal controller *GUI.DLL (in C or C++ programming language).
External signal control can be activated in the VISSIM Signal Control dialog. For the defined controllers, in each controller time step VISSIM contacts all controller *.DLLs at the end of the current simulation time step. First, the current signalization states and detector data of all SCs are passed to the respective *.DLLs. Second, the *.DLLs are asked to calculate new desired signal states which are subsequently passed back to VISSIM. Depending on parameters set by the controller logic, either these
eCoMove D543.57(D5.7)- Development and Testing of Traffic Management and Control Measures
31/01/2013 14 Version Final
signal states are applied immediately, or transition states (e.g. amber when switching from green to red) are inserted automatically, as defined in the signal group parameters in VISSIM. In the next simulation time step the vehicles in VISSIM will cope with the new signalization.
2.4.5 ANM file interface
ANM stands for Abstract Network Model and is a high level file interface to define VISSIM models. The main use case is to transfer data from other tools (such as the transport planning model VISUM or traffic engineering tool) to VISSIM. ANM is a XML format. The main advantage is that the abstract network model is based on nodes and edges, which is the natural format for many other, more macroscopic tools in transport planning and management. VISSIM can read ANM in two ways:
Complete import (initial: creating a new VISSIM network)
Adaptive import (only differences in the new *.ANM file compared with the
*.ANM file imported earlier) in order to update only the affected data in the
VISSIM network.
2.5 Components of the MS-Adapter 2.5.1 VISSIM COM Adapter
This component uses the car2x VCOM interface from VISSIM in order to deliver vehicle beaconing data to the RSUs (802.11p) and/or to the center (3G). The coupling between ‘VISSIM’ and ‘VISSIM COM Adapter’ can be established through a configuration entry in the file ‘c2x.ini’. The adapter can serve several clients. In the opposite direction it offers an interface to ‘broadcast’ speed advices from RSUs within the simulation environment (VISSIM).
2.5.2 External Fixed Time Controller (‘extFTC’)
An external fixed time traffic light controller which controls the signal groups of VISSIM directly according to a given predefined program. The ‘extFTC’ component is able to rotate the fixed-time program (can be invoked remotely by using an interface).
It also forwards the actual state of the TLC (including rest times) and current sensor values through a socket interface. This interface is in line with the interface of the eCoMove component ‘TLC / Sensor Adapter’. In VISSIM the ‘ext. FTC’ component must be defined as part of the TLC parameters.
2.5.3 ecoNetwork Prediction
This sub-system ecoNetwork Prediction (also named “NetState”) contains the online modelling of the dynamic route choice and traffic assignment for the road network. The traffic states are estimated in a way that is in line with given objective functions and other dynamic data like vehicle states, road-side detector values and averaged
eCoMove D543.57(D5.7)- Development and Testing of Traffic Management and Control Measures
31/01/2013 15 Version Final
capacity values that are derived from TLC states. The results are stored into the ecoMap thanks to the ecoMap NetState Adapter component.
2.5.4 ecoMap NetState Adapter
This sub-system ecoMap Netstate Adapter receives dynamic current and predicted network states from ecoNetwork Prediction online and writes the data into the ecoMap, thereby performing a mapping of VISSIM to ecoMap link ids. The ecoMap NetState Adapter is not an integrated part of the eCoMove RSU/Center as it is rather a kind of bypass with the only purpose to put required data into the ecoMap than a required basic component for an eCoMove RSU/Center.
2.5.5 TLC Adapter
The component TLC Adapter receives dynamic TLC and detector states from the VISSIM COM Adapter online and writes the data into the ecoMap. It is assumed that a mapping of VISSIM to ecoMap link ids has already been done by the VISSIM COM Adapter.
Compared to the ecoMap NetState Adapter described in the chapter above it is an intergrated part of the eCoMove RSU/Center as it can connect to existing components/applications as they are used in current traffic control installations.
The connection of eCoMove applications to the TLC goes through a TLC adapter, which in the Peek/Helmond case only connects to the CCOL application to give commands to ImFlow - an adaptive traffic control system which is easy to configure. The only command that will be given is request of priority to ImFlow, while detector and signal group states can be read from the CCOL. However, in this simulation environment there are multiple ways to get detector states and it will be situation dependent whether the detector and signal group states will actually be read this way.
2.5.6 NetState Converter
In a pre-processing step the NetState Converter reads the ‘INP (VISUM)’ and ‘FMA’ files and generates once two new files: ‘INP (NetState)’ and ‘NET (NetState)’.
‘INP (NetState)’ does not contain predefined routing decisions (the ones from VISUM are deleted). Instead it is enriched by new vehicle types (one for each destination), inflows per vehicle type (according o-d-data) and local routing decisions per vehicle type (for each intersection). Later on in online operation the vehicle type dependent inflows and local routing decisions are updated / adjusted by the VISSIM Com Adapter (COM interface).
‘NET (NetState)’ contains all static data needed to run ‘NetState’. This mainly comprises the network topology with traffic related attributes (e.g. link capacities, speed restrictions), origins and destinations, and initial net inflows. The whole configuration is fully compliant with the VISSIM configuration.
2.5.7 Virtual COM Manager

eCoMove D543.57(D5.7)- Development and Testing of Traffic Management and Control Measures
31/01/2013 16 Version Final
The Virtual COM Manager substitutes the real communication units of a test site. It provides relevant data as e.g. vehicle CAM data towards the eCoMove JAVA/OSGi system environment using the interfaces offered by the eCoMove system. But it communicates with the VISSIM COM Manager through socket connection.
The component Virtual COM Manager receives vehicle state data from the VISSIM COM Adapter, converts it to a CAM message format and sends the according CAM messages via Ethernet (not wireless LAN) to the COM Manager.
2.5.8 Peek TLC
The Peek TLC will run in the simulation environment just like it runs on the street. The controllers in the Netherlands are mostly based on a standard called CCOL and this is also the case for Helmond. On top of CCOL the new traffic light control strategy ImFlow can take over signal phasing decisions, while CCOL keeps track of safety constraints.
Both CCOL and ImFlow can be compiled into stand-alone executables suitable for simulation. The CCOL application can connect to VISSIM through a Peek proprietary DDL file. ImFlow and CCOL, connect to each other the same way as on real traffic controllers in the field, but some manual tuning of port numbers may be necessary because you can simulate multiple controllers at once on one pc and then all of those CCOL – ImFlow connections should use different port numbers.
2.5.9 Subchapter on COMManager
The COMManager is developed within SP2. It is responsible for the communications between ITS stations. An appropriate API for application and facility development was defined for portable use in an OSGi run-time environment. This API will be used to communicate between the “ITS simulation station” – here describes as simulation environment – and virtual roadside ITS stations respectively virtual center ITS stations.
Detailed information can be found in deliverable Error! Reference source not found.Error! Reference source not found..
2.5.10 Subchapter on Map Feeder
2.5.10 Subchapter on Map Feeder
The Map Feeder is developed within SP2. It is responsible for writing vehicle CAM and DENM messages provided by the COMManager into the ecoMap. The Map Feeder implements a map matching functionality in order to reference vehicle information onto ecoMap road elements.

eCoMove D543.57(D5.7)- Development and Testing of Traffic Management and Control Measures
31/01/2013 17 Version Final
3 Test side Modelling 3.1 Helmond The city of Helmond is situated in the south of the Netherlands and has been serving many projects for their tests and pilots. The map below shows the locations where roadside units are installed.
Figure 3: roadside units in Helmond
For the main roads in Helmond a microscopic simulation model was prepared including detailed modelling of traffic light controlled intersections considering cycle paths as well as pedestrian crossings and the corresponding traffic demand. A traffic demand model is available for the morning and evening peak periods with traffic volumes for every 15 minutes. The following figure shows the modelled network:
Figure 4: VISSIM model for Helmond
The following figure shows an example of a complex intersection with grey road elements, footpaths in orange and cycle paths in light red; traffic lights are represented using dark red lines.

eCoMove D543.57(D5.7)- Development and Testing of Traffic Management and Control Measures
31/01/2013 18 Version Final
Figure 5: VISSIM model of a complex intersection
3.2 Munich Two traffic models are built for the test site Munich:
a macroscopic traffic model where the focus is on the network and demand
modeling
a microscopic traffic model derived from the macroscopic model with focus
on detailed modeling of intersections and vehicle-infrastructure interaction
The macroscopic traffic model for Munich was generated out of an existing macroscopic traffic model for Germany (PTV product: Validate Germany) in the following way:
in a first step the outline of the Munich network was defined;
this area was used to cut out the included parts of the traffic network together
with relevant traffic demand sinks and sources;
new sinks and sources were generated at the all network links at the border to
the surrounding, original network;
the demand matrices (24 demand matrices, one for each our of an average day)
for the Munich network were generated based on the original demand matrices
for Germany;
eCoMove D543.57(D5.7)- Development and Testing of Traffic Management and Control Measures
31/01/2013 19 Version Final
historical loop data from Bayerinfo and the city of Munich, covering a period
of six month, were considered as input for the calibration of the new traffic
demand model for Munich using VstromFuzzy as method to adjust traffic
demand between sources and sinks.
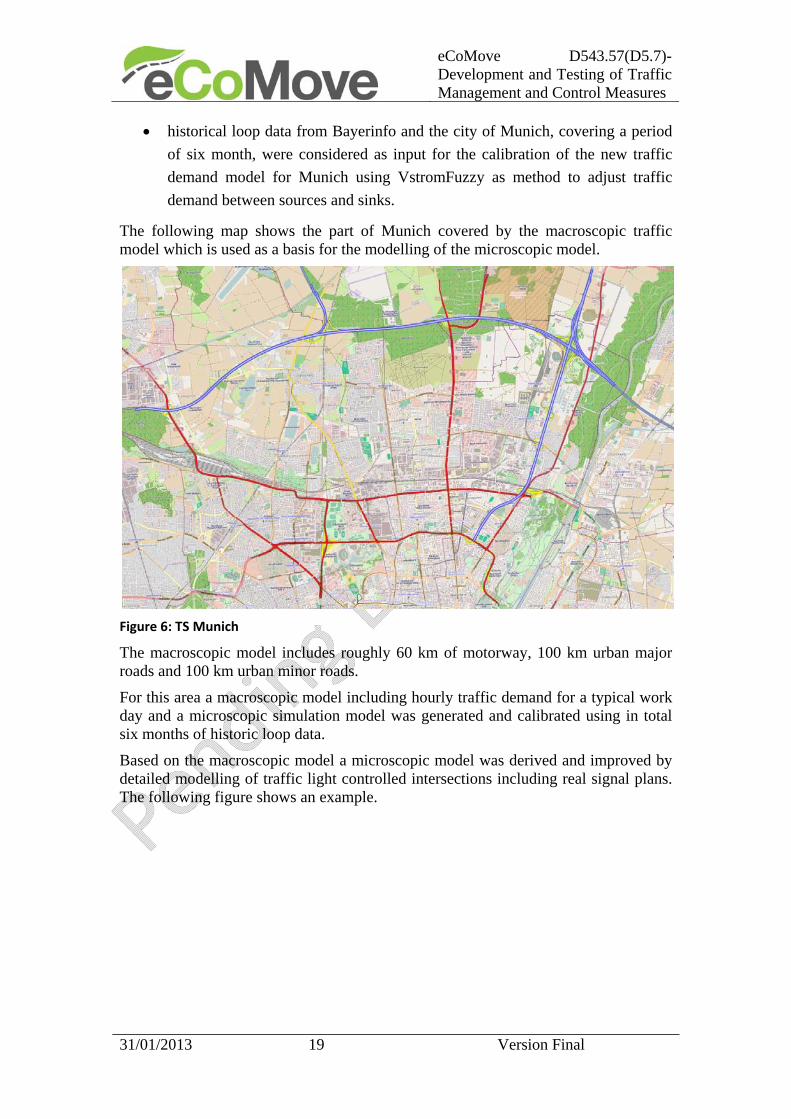
The following map shows the part of Munich covered by the macroscopic traffic model which is used as a basis for the modelling of the microscopic model.
Figure 6: TS Munich
The macroscopic model includes roughly 60 km of motorway, 100 km urban major roads and 100 km urban minor roads.
For this area a macroscopic model including hourly traffic demand for a typical work day and a microscopic simulation model was generated and calibrated using in total six months of historic loop data.
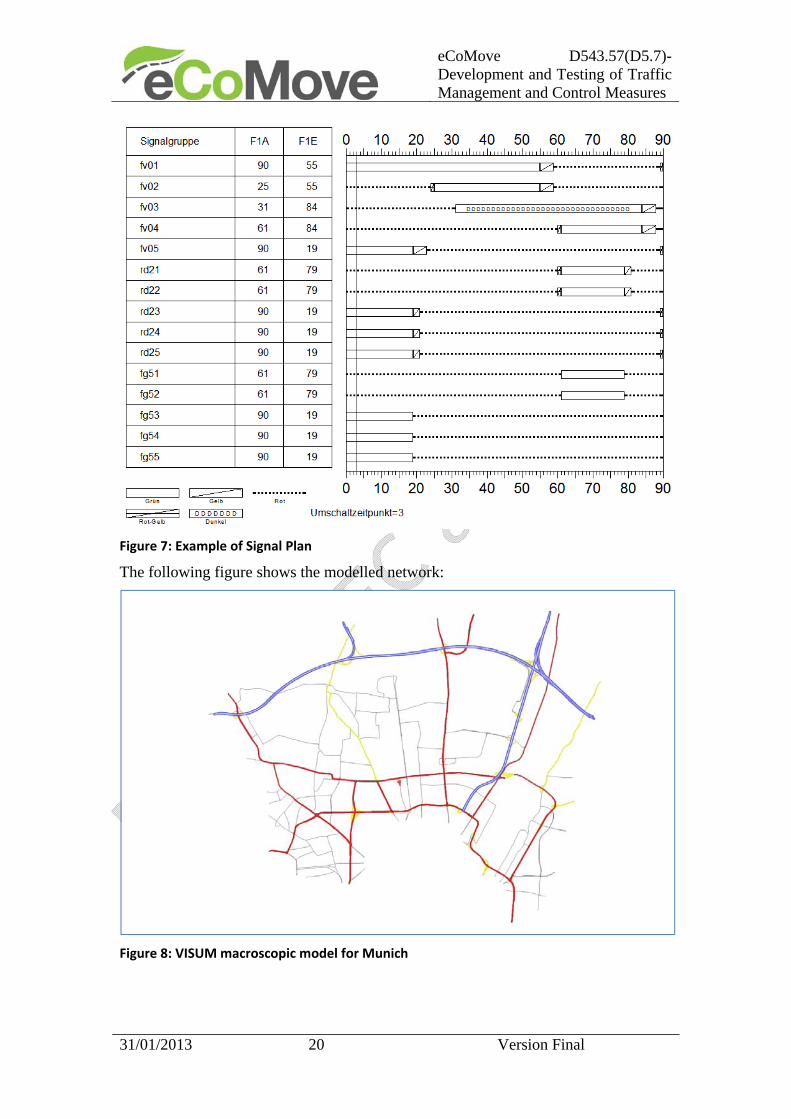
Based on the macroscopic model a microscopic model was derived and improved by detailed modelling of traffic light controlled intersections including real signal plans. The following figure shows an example.
eCoMove D543.57(D5.7)- Development and Testing of Traffic Management and Control Measures
31/01/2013 20 Version Final
Figure 7: Example of Signal Plan
The following figure shows the modelled network:
Figure 8: VISUM macroscopic model for Munich
eCoMove D543.57(D5.7)- Development and Testing of Traffic Management and Control Measures
31/01/2013 21 Version Final
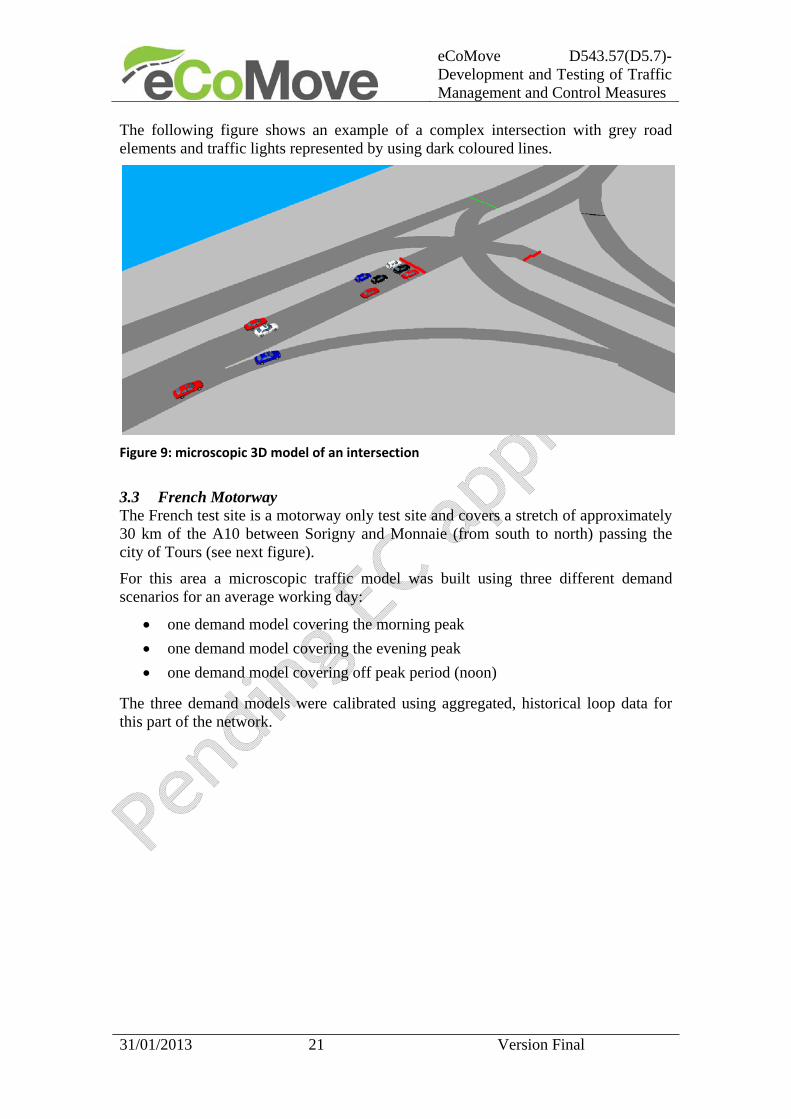
The following figure shows an example of a complex intersection with grey road elements and traffic lights represented by using dark coloured lines.
Figure 9: microscopic 3D model of an intersection
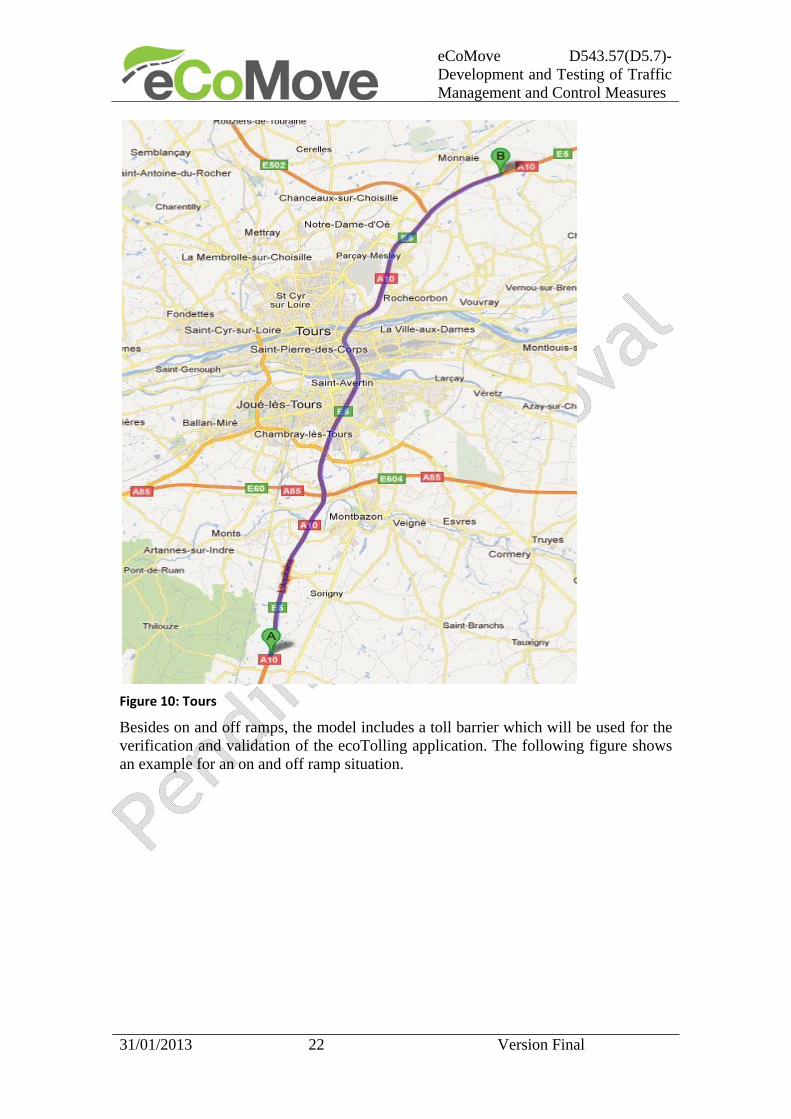
3.3 French Motorway The French test site is a motorway only test site and covers a stretch of approximately 30 km of the A10 between Sorigny and Monnaie (from south to north) passing the city of Tours (see next figure).
For this area a microscopic traffic model was built using three different demand scenarios for an average working day:
one demand model covering the morning peak
one demand model covering the evening peak
one demand model covering off peak period (noon)
The three demand models were calibrated using aggregated, historical loop data for this part of the network.
eCoMove D543.57(D5.7)- Development and Testing of Traffic Management and Control Measures
31/01/2013 22 Version Final
Figure 10: Tours
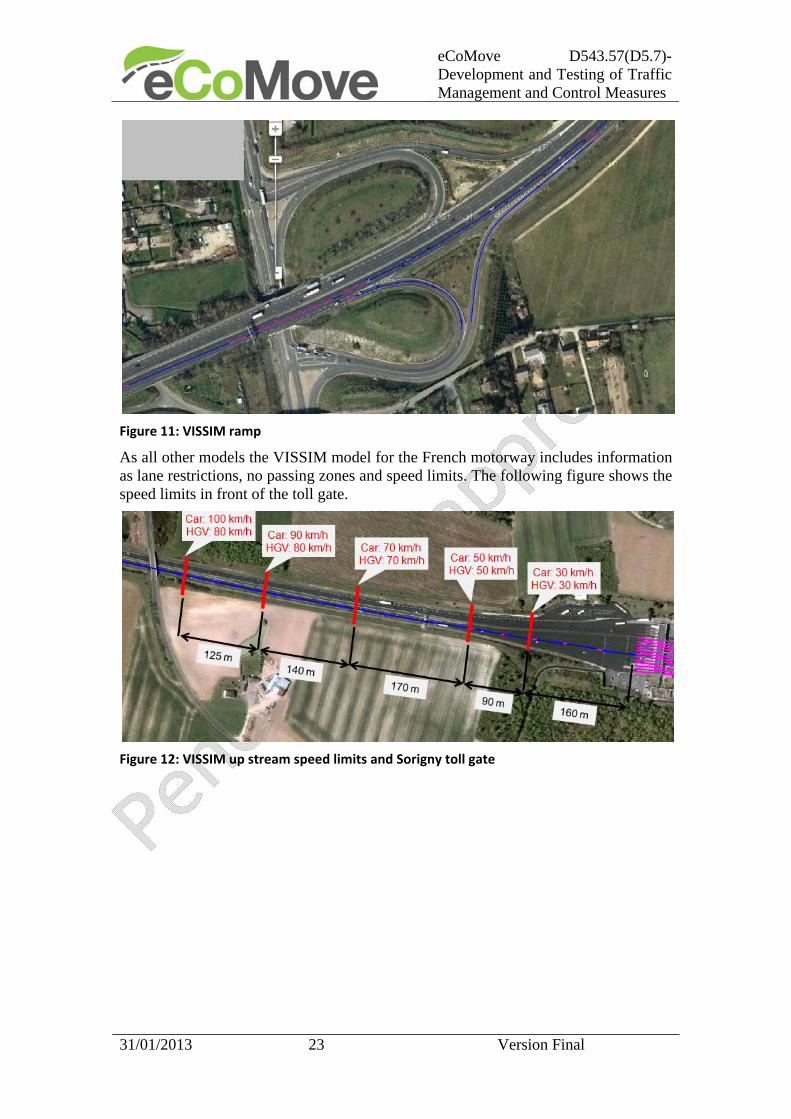
Besides on and off ramps, the model includes a toll barrier which will be used for the verification and validation of the ecoTolling application. The following figure shows an example for an on and off ramp situation.
eCoMove D543.57(D5.7)- Development and Testing of Traffic Management and Control Measures
31/01/2013 23 Version Final
Figure 11: VISSIM ramp
As all other models the VISSIM model for the French motorway includes information as lane restrictions, no passing zones and speed limits. The following figure shows the speed limits in front of the toll gate.
Figure 12: VISSIM up stream speed limits and Sorigny toll gate
eCoMove D543.57(D5.7)- Development and Testing of Traffic Management and Control Measures
31/01/2013 24 Version Final
4 Installation Instructions for setting up the simulation environment
4.1 Introduction This chapter describes the installation process for the eCoMove Simulation Environment. The purpose of the Simulation Environment is to test and verify eCoMove components inside a traffic simulation.
Here, at first, the prerequisites will be listed. Later on, there are more detailed instructions for each step of the actual installation.
4.2 Prerequisites
1. Install Java Runtime 2. Install Visual Studio C++ (Express) 2008 3. Install VISSIM 5.3.10 (32 Bit) with C2X extensions 4. Register VISSIM COM Server 5. Have ecoMap (ADASRP directory from Navteq) available 6. Have Knopferfish 3.1 available
4.3 General Create a directory for the subsequent installation steps, e.g.
C:\eCoMove \Simulation This directory will later on be referred to as the simulation directory. 4.4 ecoMap
4.4.1 Installation
Copy ADASRP (full version or eCoMove -only version) to eCoMap_NAVTEQ
in the simulation directory
Copy NAVTEQ execution environment's folder to NAVTEQExecutionEnvironment in the simulation directory
Install the Knopflerfish 3.1.0 OSGi framework From the folder “NAVTEQExecutionEnvironment” (part of Error!
Reference source not found.), copy the following files into the ADASRP binary folder (eCoMap_NAVTEQ\ADASRP.2011\bin\Win32\ADASRP):
a. all .dll files a. all .dll files b. props.xargs (just a copy of the Knopflerfish
configuration file) c. ADASRP.eCoMove .ini d. ADASRP.eCoMove .bat
Copy the folder SP2_bundles to your local directory
4.4.2 Configuration
eCoMove D543.57(D5.7)- Development and Testing of Traffic Management and Control Measures
31/01/2013 25 Version Final
1. Create or copy init.xargs and restart.xargs (as described in the chapter below) to eCoMap_NAVTEQ\ADASRP.2011\bin\Win32\ADASRP
2. Edit the following sections in ADASRP.eCoMove .ini (Absolute paths
are preferable): a. Path to the map database b. Path to Knopflerfish framework.jar installation
c. Path to Knopflerfish jars folder
d. Check if there is an environment variable JAVA_HOME set on your computer. If not, define it (it should point to the root directory of your Java installation)
- or -
e. edit ADASRP.eCoMove .bat accordingly (add SET JAVA_HOME=C:\WhateverYourPathIs before the SET PATH command)
4.4.3 Start
Start ADASRP by just running the ADASRP.eCoMove .bat. Both the ADASRP and the Knopflerfish GUI should appear. 4.4.4 Remark
Refer to NAVTEQ Execution Environment.doc for more details. 4.5 Knopflerfish
4.5.1 Configuration
4.5.1.1 Method 1 (recommended)
If there are no such files in eCoMap_NAVTEQ\ADASRP.2011\bin\Win32\ADASRP folder or it does not contain any settings of your own, you can copy them from the manuals\examples folder. All the paths in two xargs files must be updated according to real locations on local machine! 4.5.1.2 Method 2
The other option is get a copy of the default knopflerfish's init.xargs file, and update as followed. Use -install and -start to install and start the following bundles (in additional to default bundles):
Knopflerfish bundle o Measurement
Bundles provided by NAVTEQ (can be found in NAVTEQExecutionEnvironment folder)
o ASASRPFrameworkManager

eCoMove D543.57(D5.7)- Development and Testing of Traffic Management and Control Measures
31/01/2013 26 Version Final
o DynamicMapDisplay, o ADASRPRouteProvider o ADASRPPositionClient o ecoMapImplNAVTEQ
Bundles downloaded from repository o Dataproviders_core o LDT_admin o eu.eCoMove project.ldt.util o ecoMap o CamFeeder o qfree_poma_api o ecomessage_api o communication_api o ecomessage_qfree o ans1RT-unigone
Virtual COM-Manager In the init.xargs file, paths to the bundles must be edited according to their real locations on local machine. The following image shows all the bundles (except for default Knopflerfish's) and their dependencies. Green bundles are provided by NAVTEQ. Blue bundles are downloaded from repository in form of jar files. Red bundles are additional Knopflerfish bundles.
Figure 13: All JAVA bundles (except for default Knopflerfish's) and their dependencies.
eCoMove D543.57(D5.7)- Development and Testing of Traffic Management and Control Measures
31/01/2013 27 Version Final
In init.xargs, we need to configure ecoMessage: -Dorg.cvisproject.calm.emulator.broadcastport=6061 -Dcom.qfree.eCoMove .ecomessages.loopback=true -org.cvisproject.calm.emulator.broadcastaddress=127.0.0.1 -Dcom.qfree.eCoMove .ecomessages.cam.dstaddress. 0= datagram://[2001:11:777:44::55]:5000 -Dcom.qfree.eCoMove .ecomessages.verbose=false -Dcom.qfree.eCoMove .ecomessages.cam.port=5000 -Dorg.cvisproject.calm.emulator.broadcastinterval=5000 -Dorg.cvisproject.calm.emulator.enable=true -Dorg.cvisproject.service.calm.io.serviceIDLookupTable= file:///C:/Mat_USER/Quan/eCoMove /DEV/sid-table.txt -Dorg.osgi.framework.bootdelegation=sun.*,com.sun.* -Dcom.qfree.eCoMove .ecomessages.validate=false The most important configuration is: -Dcom.qfree.eCoMove .ecomessages.loopback=true It tells ecomessage_qfree to send messages back to itself. After returning to ecomessage_qfree, the messages will be forward to CamFeeder. Other java packages should also be imported: org.knopflerfish.framework.system.packages.base=javax.net,
javax.net.ssl,
sun.net.www.protocol.http,
sun.net.www.http,
javax.swing,
javax.swing.tree,
javax.swing.table,
javax.swing.plaf.metal,
javax.swing.plaf.basic,
javax.swing.plaf,
javax.swing.filechooser,
javax.swing.event,
javax.swing.border,
javax.accessibility
4.5.2 restart.xargs
In the restart.xargs file, we simply write down all the configuration mentioned above, and configure the restart folder:
eCoMove D543.57(D5.7)- Development and Testing of Traffic Management and Control Measures
31/01/2013 28 Version Final
-Dorg.osgi.framework.dir=[simulation directory]\eCoMap_NAVTEQ\ADASRP-eCoMove \ADASRP.2011\bin\Win32\ADASRP/fwdir 4.6 VISSIM
4.6.1 Remarks
Always start VISSIMVISSIM 5.3.10 using the parameter –automation. This will allow simultaneous operation of VCom and COM: VISSIM.exe –automation Alternatively, you can replace the path of your VISSIM installation in all the files called start_VISSIM_c2x.bat and use these to start VISSIM. 4.6.2 Start
Open an eCoMove map in VISSIM. Currently there are Helmond
Dortmund
Munich (not up-to-date)
At least one VehicleType in your VISSIM Map must contain EQUIPMENT C2XVEH 4.6.3 Operation
Verify that the simulation speed is set to 1.0 (i.e. real-time)!
Always close VISSIMComAdapter (command line window) after each simulation run. VISSIM does not do this automatically.
eCoMove D543.57(D5.7)- Development and Testing of Traffic Management and Control Measures
31/01/2013 29 Version Final
5 Verification of eCoMove Application and Components This chapter describes the results from the verification tests. As development and verification is on-going at the time of submission this chapter could not be finally completed. To give an impression of what to expect the verification results of the components have been included as far as they are already available. 5.1 Verification overview for ecoNetwork Prediction Based on various static network attributes, dynamic capacity related information, road side sensor data and - above all - vehicle generated data (positions, speed, routes), the component ecoNetwork Prediction estimates the current, future and ideal/desired traffic state for the road network in terms of traffic flows, travel times, link emission values and o-d-route distribution schemes.
Within the simulation environment the verification procedure firstly consists in comparing estimated / determined model values with corresponding values from the micro simulation VISSIM that has not been provided to the ecoNetwork Prediction model before. When optimisation is involved (determination of desired traffic states) it will be examined whether the optimised VISSIM scenario gives rise to an overall less fuel consumption / emission for the whole traffic network.
The main functional blocks of the component ecoNetwork Prediction that are to be verified in the simulation environment are the following:
- Estimation of current and future traffic states
Reference to main requirements: SP5.11.68, SP5.11.69 Reference to test sites: Simulation environm., Helmond, Munich Reference to verification phases: alpha, beta Reference to test cases (below): 2
- Estimation of ideal / desired traffic states
Reference to main requirements: SP5.11.67, SP5.11.70 Reference to test sites: Simulation environment, Munich Reference to verification phases: alpha, beta Reference to test cases (below): 3
Note: Verification test 1, defined in chapter 5.10 of deliverable Error! Reference source not found., is omitted here as it only refers to real test sites.
References of the verification tests for the component ecoNetwork Prediction to other References of the verification tests for the component ecoNetwork Prediction to other chapters and deliverables:
- The functional description of the component can be found in chapter 3.10 of
deliverable D5.6.
- The description of interfaces, parameters and test setups can be found in
chapter 4.10 and 5.10 of deliverable D5.6, and chapter 6.10 of this deliverable.
5.1.1 Verification Test 2: Estimation of current and future traffic states
Reference to main requirements: SP5.11.67, SP5.11.70 Reference to verification phases: alpha, beta
eCoMove D543.57(D5.7)- Development and Testing of Traffic Management and Control Measures
31/01/2013 30 Version Final
5.1.1.1 Evaluation of verification Test Case 2
Not available at the time of writing. 5.1.2 Verification Test 3: Estimation of ideal / desired traffic states
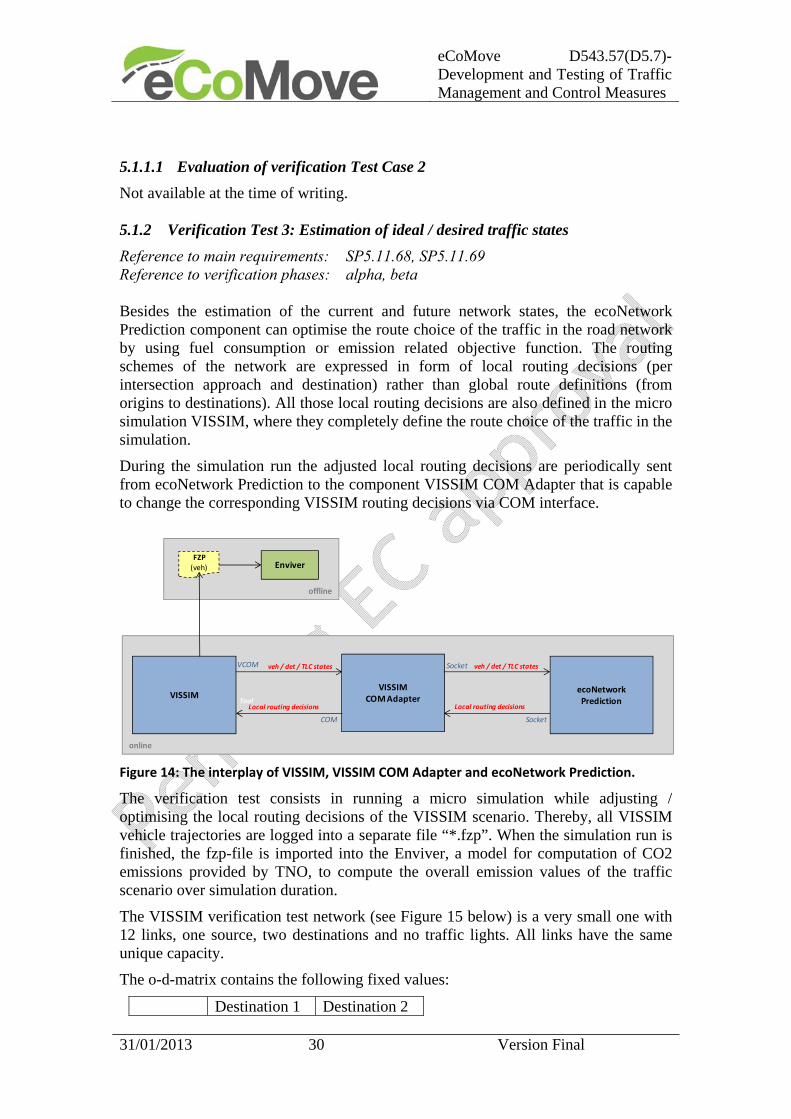
Reference to main requirements: SP5.11.68, SP5.11.69 Reference to verification phases: alpha, beta Besides the estimation of the current and future network states, the ecoNetwork Prediction component can optimise the route choice of the traffic in the road network by using fuel consumption or emission related objective function. The routing schemes of the network are expressed in form of local routing decisions (per intersection approach and destination) rather than global route definitions (from origins to destinations). All those local routing decisions are also defined in the micro simulation VISSIM, where they completely define the route choice of the traffic in the simulation.
During the simulation run the adjusted local routing decisions are periodically sent from ecoNetwork Prediction to the component VISSIM COM Adapter that is capable to change the corresponding VISSIM routing decisions via COM interface.
Figure 14: The interplay of VISSIM, VISSIM COM Adapter and ecoNetwork Prediction.
The verification test consists in running a micro simulation while adjusting / optimising the local routing decisions of the VISSIM scenario. Thereby, all VISSIM vehicle trajectories are logged into a separate file “*.fzp”. When the simulation run is finished, the fzp-file is imported into the Enviver, a model for computation of CO2 emissions provided by TNO, to compute the overall emission values of the traffic scenario over simulation duration.
The VISSIM verification test network (see Figure 15 below) is a very small one with 12 links, one source, two destinations and no traffic lights. All links have the same unique capacity.
The o-d-matrix contains the following fixed values:
Destination 1 Destination 2
online
VISSIMCOM Adapter
VCOM
Tool
ecoNetworkPrediction
Local routing decisions
COM
veh / det / TLC states
VISSIMLocal routing decisions
veh / det / TLC statesSocket
Socket
offline
EnviverFZP
(veh)

eCoMove D543.57(D5.7)- Development and Testing of Traffic Management and Control Measures
31/01/2013 31 Version Final
Source 1 900 veh/h 900 veh/h All VISSIM links have 1 lane. At the beginning of the links 2, 3 and 4 there are speed decisions (40 km/h) that reduce the capacity of all links in the network with the exception of link 1:
Capacity Link 1 = 1800 veh/h Capacity Link x = 1650 veh/h, x≠1
From this it is clear that not the complete network inflow can be routed along the shortest routes to the two destinations.
There are two routing decisions for the two destinations that equally distribute the approaching traffic along the destination relevant exit links (see Figure 15 below):
RD_1 = { left=0.5, straight=0.5 } RD_2 = { left=1.0, right=0.0 } RD_3 = { right=0.5, straight=0.5 } RD_4 = { left=0.0, right=1.0 }
Furthermore, there are three detectors defined as can be seen in the figure below.
Figure 15: VISSIM test network with 4 local routing decisions that belong to the two
different destinations. The green lines are speed decisions (40 km/h) that reduce the capacity of the respective links.
5.1.2.1 Evaluation of verification Test Case 3
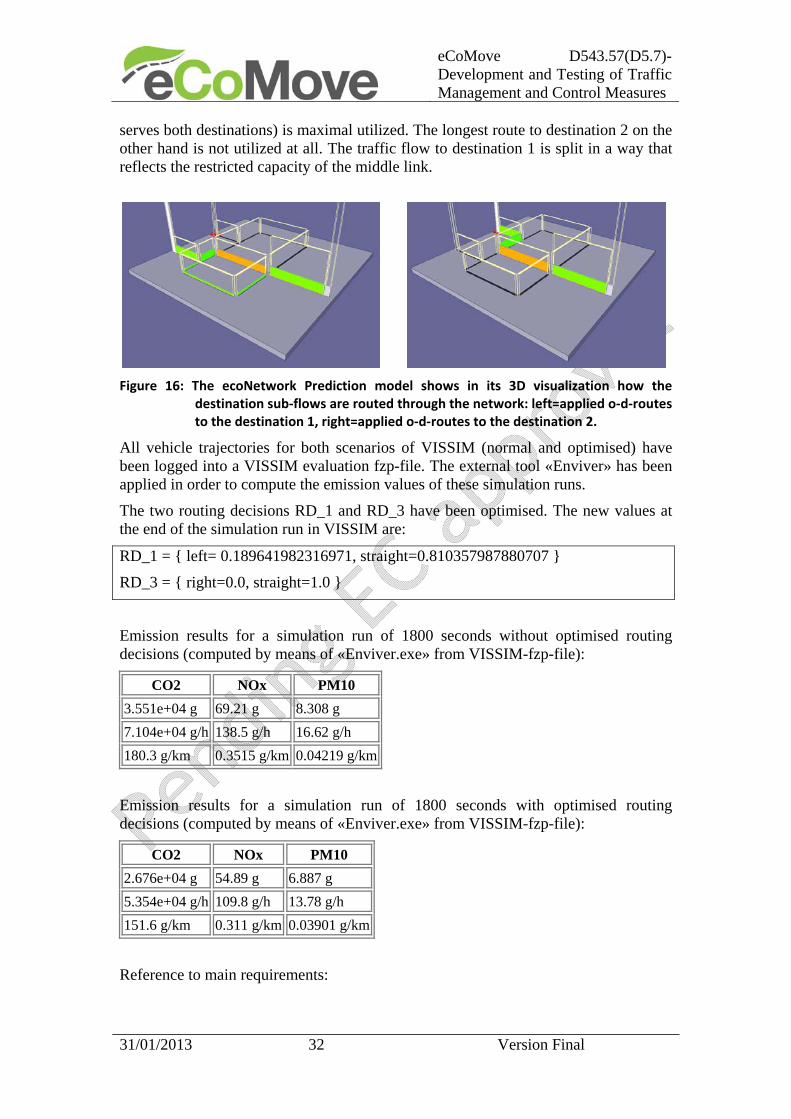
In Figure 16 below it can be seen how ecoNetwork Prediction optimizes the origin-destination-routes for the test example in order to realize minimal fuel consumption / emission. The shortest connection in the middle (see Figure 16: orange link that
eCoMove D543.57(D5.7)- Development and Testing of Traffic Management and Control Measures
31/01/2013 32 Version Final
serves both destinations) is maximal utilized. The longest route to destination 2 on the other hand is not utilized at all. The traffic flow to destination 1 is split in a way that reflects the restricted capacity of the middle link.
Figure 16: The ecoNetwork Prediction model shows in its 3D visualization how the
destination sub‐flows are routed through the network: left=applied o‐d‐routes to the destination 1, right=applied o‐d‐routes to the destination 2.
All vehicle trajectories for both scenarios of VISSIM (normal and optimised) have been logged into a VISSIM evaluation fzp-file. The external tool «Enviver» has been applied in order to compute the emission values of these simulation runs.
The two routing decisions RD_1 and RD_3 have been optimised. The new values at the end of the simulation run in VISSIM are:
RD_1 = { left= 0.189641982316971, straight=0.810357987880707 }
RD_3 = { right=0.0, straight=1.0 }
Emission results for a simulation run of 1800 seconds without optimised routing decisions (computed by means of «Enviver.exe» from VISSIM-fzp-file):
CO2 NOx PM10
3.551e+04 g 69.21 g 8.308 g
7.104e+04 g/h 138.5 g/h 16.62 g/h
180.3 g/km 0.3515 g/km 0.04219 g/km
Emission results for a simulation run of 1800 seconds with optimised routing decisions (computed by means of «Enviver.exe» from VISSIM-fzp-file):
CO2 NOx PM10
2.676e+04 g 54.89 g 6.887 g
5.354e+04 g/h 109.8 g/h 13.78 g/h
151.6 g/km 0.311 g/km 0.03901 g/km
Reference to main requirements:
eCoMove D543.57(D5.7)- Development and Testing of Traffic Management and Control Measures
31/01/2013 33 Version Final
- SP5.11.68: The direct comparison of the emission results shows that the optimised routing entails reduced emission values. As can easily be seen for the simple example the optimised routing decisions of the model represent significant reduced total fuel consumption of the network.
- SP5.11.69: The traffic flow to destination 1 is split in a way that reflects the restricted capacity of the middle link (see Figure 16: orange link). Thus, the optimised solution takes into account the restricted capacity of this link.
Summary of the verification test:
- The state data (vehicle, detector) is transferred from VISSIM to ecoNetwork Prediction online.
- The local routing decisions determined by ecoNetwork Prediction are used to change the local routing decisions of VISSIM online.
- The referenced requirements are met.
5.2 Verification overview for ecoRouteAdvice
The main functionality of the ecoRoute Advice to be verified is the following:
- Generate eco routes for eCoMove vehicles
Reference to main requirements: SP5.11.1, SP5.11.2, SP5.11.4, SP5.11.5
Reference to test sites: Munich (simulation)
Reference to verification phases: alpha
Reference to test cases (below): 1
References of the verification tests for the component ecoRoute Advice to other chapters and deliverables:
- The functional description of the component can be found in chapter 3.1 of
deliverable D5.6.
- The description of interfaces, parameters and test setups can be found in
chapter 4.1 and 5.1 of deliverable D5.6, and chapter 6.2 of this deliverable.
The individual benefit of the ecoRoute Advice is an acceptable route advice regarding travel time and fuel consumption. The overall benefit is optimising traffic distribution of the whole network according to the recommendations of the ecoNetwork Prediction.
5.2.1 Verification Test Case 1: Generate eco routes for eCoMove vehicles
The ecoRoute Advice generates a bundle of route advices to eCoMove vehicles on demand.
Therefore the purpose of this test case is to verify that the ecoRoute Advice fulfils its defined requirements. This means the advised routes should take into account capacity restrictions (incidents, accidents, road work, etc.) and local traffic conditions. Additionally the overall benefits for the whole network do not come at unacceptable cost for some individuals.
eCoMove D543.57(D5.7)- Development and Testing of Traffic Management and Control Measures
31/01/2013 34 Version Final
Reference to main requirements: SP5.11.1, SP5.11.2, SP5.11.4, SP5.11.5
Reference to verification phases: alpha
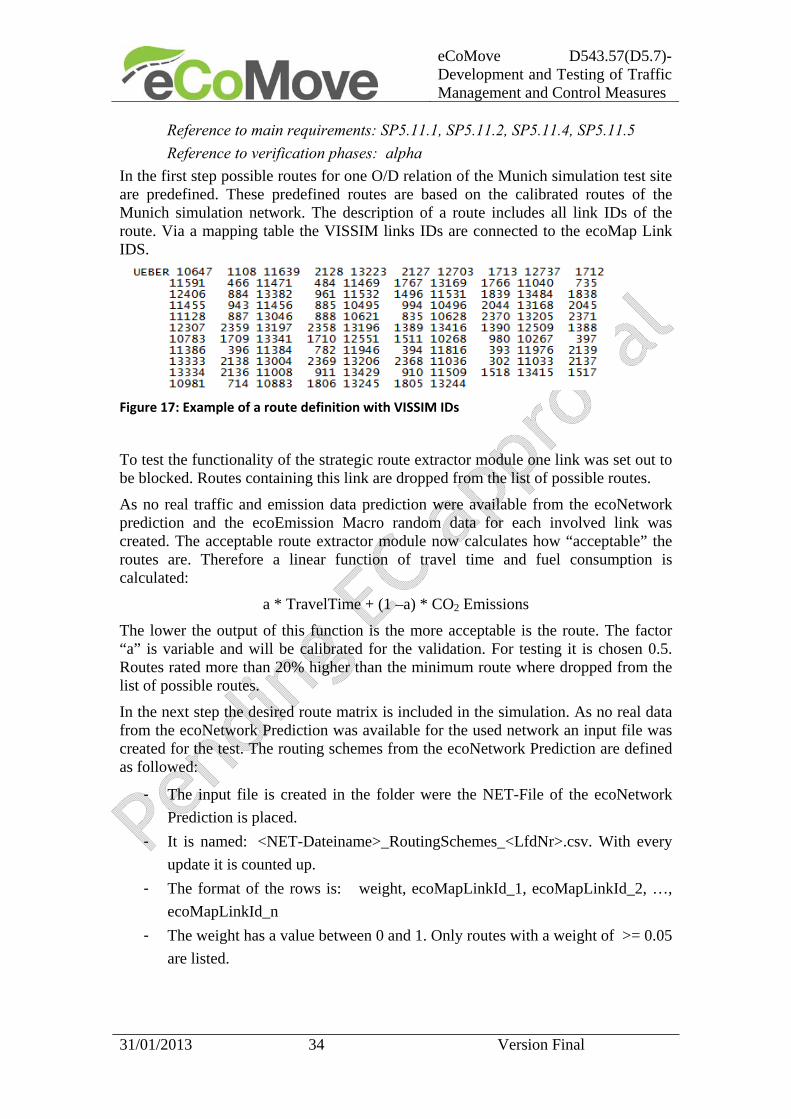
In the first step possible routes for one O/D relation of the Munich simulation test site are predefined. These predefined routes are based on the calibrated routes of the Munich simulation network. The description of a route includes all link IDs of the route. Via a mapping table the VISSIM links IDs are connected to the ecoMap Link IDS.
Figure 17: Example of a route definition with VISSIM IDs
To test the functionality of the strategic route extractor module one link was set out to be blocked. Routes containing this link are dropped from the list of possible routes.
As no real traffic and emission data prediction were available from the ecoNetwork prediction and the ecoEmission Macro random data for each involved link was created. The acceptable route extractor module now calculates how “acceptable” the routes are. Therefore a linear function of travel time and fuel consumption is calculated:
a * TravelTime + (1 –a) * CO2 Emissions
The lower the output of this function is the more acceptable is the route. The factor “a” is variable and will be calibrated for the validation. For testing it is chosen 0.5. Routes rated more than 20% higher than the minimum route where dropped from the list of possible routes.
In the next step the desired route matrix is included in the simulation. As no real data from the ecoNetwork Prediction was available for the used network an input file was created for the test. The routing schemes from the ecoNetwork Prediction are defined as followed:
- The input file is created in the folder were the NET-File of the ecoNetwork
Prediction is placed.
- It is named: <NET-Dateiname>_RoutingSchemes_<LfdNr>.csv. With every
update it is counted up.
- The format of the rows is: weight, ecoMapLinkId_1, ecoMapLinkId_2, …,
ecoMapLinkId_n
- The weight has a value between 0 and 1. Only routes with a weight of >= 0.05
are listed.

eCoMove D543.57(D5.7)- Development and Testing of Traffic Management and Control Measures
31/01/2013 35 Version Final
For the test every eCoMove eCoMove equipped vehicle entering the network will request a route. The actual routing scheme derived from the static routing in VISSIM is compared with the desired routes from the input file. The difference between the values is calculated and scaled to the value of 1. From this the vehicles get a new route according to the calculated probability.
5.2.2 Evaluation of verification Test Case 1
The evaluation criteria described in chapter 5.1.2.5 of deliverable D5.6 are tested using the evaluation methods described above.
An overview of the requirements and the performed tests is given in the following:
Requirement number
Requirement Performed Test Test passed
SP5-1-0001 Take into account capacity
restrictions (incidents, accidents, road work, etc.)
Blocked links and too high travel times are
considered X
SP5-1-0002 Overall benefits do not come
at unacceptable cost for some individuals
Considered by the parameterize linear
function X
SP5-1-0004 A goal of route optimization is
needed
Via desired route matrix from ecoNetwork
Prediction X
SP5-1-0005
Route advices should reflect local traffic conditions, or
should be updated based on them
Considered within the desired route matrix and the parameterize linear
function
X
It is approved that the ecoRoute Advice is able to process the input data. The calculation time is less than one second. Therefore it is assumed that the calculation time for the complete test site will be lower than 15 minutes, which is the average time of the data update on traffic data.
5.3 Verification overview for ecoParkAdvice 5.3.1 Test case 1: Component test
The goal of this verification test is to assess that the ecoParkAdvice service is working as described in Deliverable 5.6. Specifically the test is aimed at the following requirements and in the described manner: SP5.2.0006: Check if parking locations near the destination are returned;
SP5.2.0007: Check if energy efficiency is used to determine the parking facility;
SP5.2.0008: Check if route distribution is used to determine the route towards the
parking facility;
SP5.2.0009: Check if parking space availability is used to determine the parking
facility;
SP5.2.0010: Check if ecoParkAdvice is aligned with parking locations in the
municipalities;
SP5.2.0012: Check if ecoParkAdvice can be executed in a closed communication
network;
eCoMove D543.57(D5.7)- Development and Testing of Traffic Management and Control Measures
31/01/2013 36 Version Final
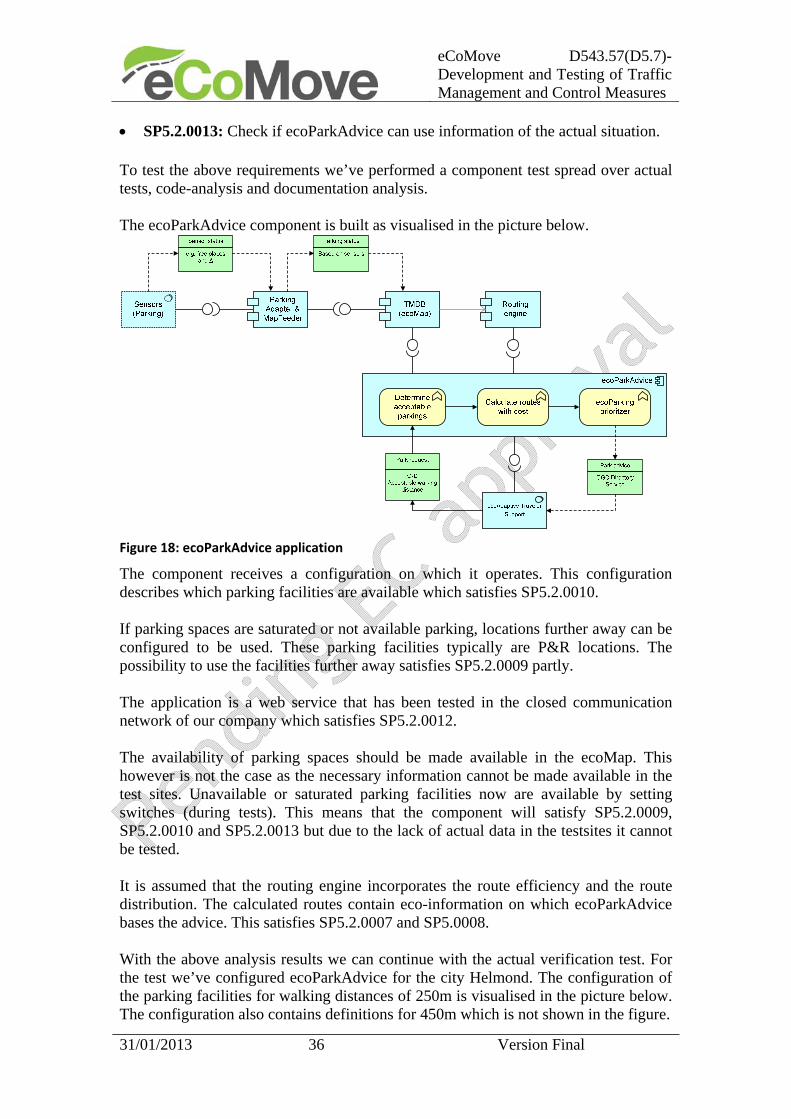
SP5.2.0013: Check if ecoParkAdvice can use information of the actual situation.
To test the above requirements we’ve performed a component test spread over actual tests, code-analysis and documentation analysis. The ecoParkAdvice component is built as visualised in the picture below.
Figure 18: ecoParkAdvice application
The component receives a configuration on which it operates. This configuration describes which parking facilities are available which satisfies SP5.2.0010. If parking spaces are saturated or not available parking, locations further away can be configured to be used. These parking facilities typically are P&R locations. The possibility to use the facilities further away satisfies SP5.2.0009 partly. The application is a web service that has been tested in the closed communication network of our company which satisfies SP5.2.0012. The availability of parking spaces should be made available in the ecoMap. This however is not the case as the necessary information cannot be made available in the test sites. Unavailable or saturated parking facilities now are available by setting switches (during tests). This means that the component will satisfy SP5.2.0009, SP5.2.0010 and SP5.2.0013 but due to the lack of actual data in the testsites it cannot be tested. It is assumed that the routing engine incorporates the route efficiency and the route distribution. The calculated routes contain eco-information on which ecoParkAdvice bases the advice. This satisfies SP5.2.0007 and SP5.0008. With the above analysis results we can continue with the actual verification test. For the test we’ve configured ecoParkAdvice for the city Helmond. The configuration of the parking facilities for walking distances of 250m is visualised in the picture below. The configuration also contains definitions for 450m which is not shown in the figure.
eCoMove D543.57(D5.7)- Development and Testing of Traffic Management and Control Measures
31/01/2013 37 Version Final
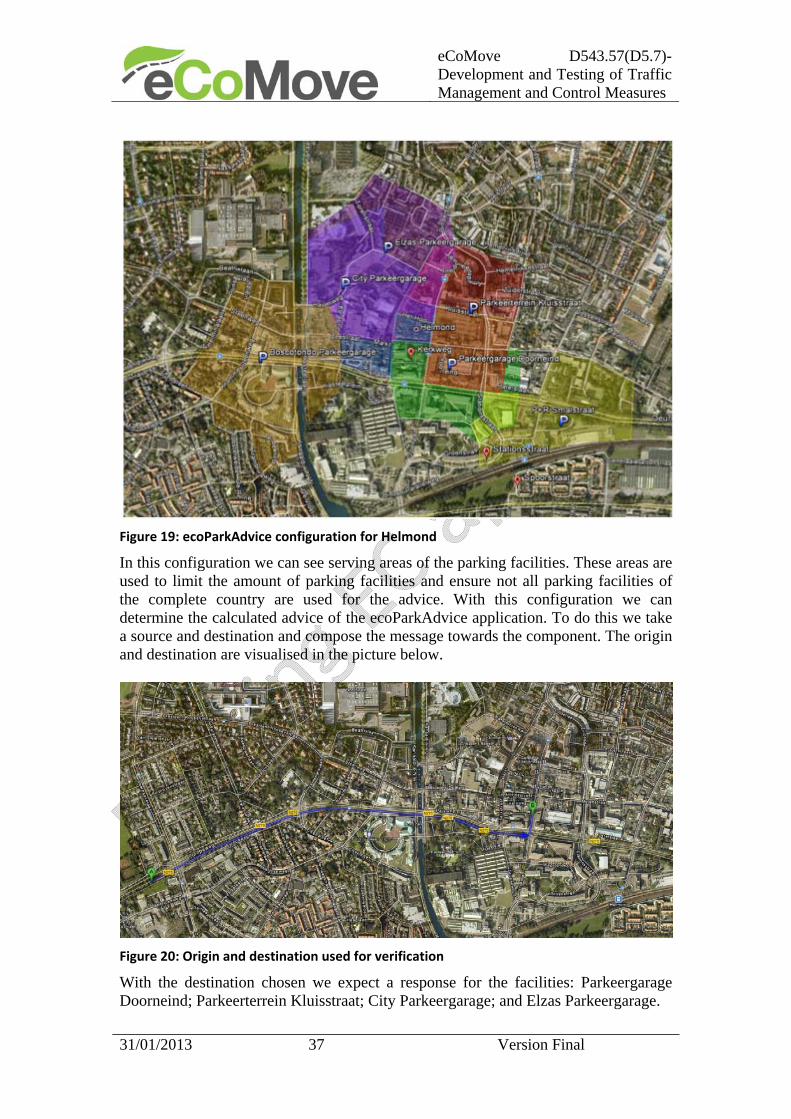
Figure 19: ecoParkAdvice configuration for Helmond
In this configuration we can see serving areas of the parking facilities. These areas are used to limit the amount of parking facilities and ensure not all parking facilities of the complete country are used for the advice. With this configuration we can determine the calculated advice of the ecoParkAdvice application. To do this we take a source and destination and compose the message towards the component. The origin and destination are visualised in the picture below.
Figure 20: Origin and destination used for verification
With the destination chosen we expect a response for the facilities: Parkeergarage Doorneind; Parkeerterrein Kluisstraat; City Parkeergarage; and Elzas Parkeergarage.
eCoMove D543.57(D5.7)- Development and Testing of Traffic Management and Control Measures
31/01/2013 38 Version Final
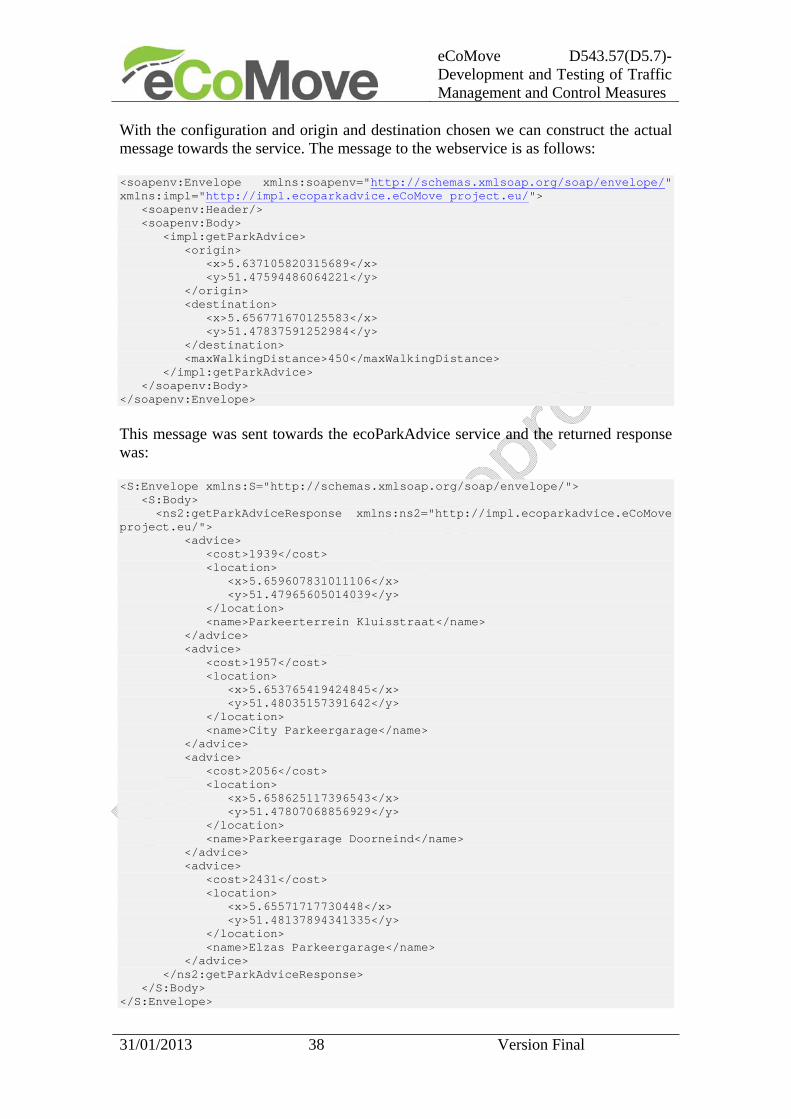
With the configuration and origin and destination chosen we can construct the actual message towards the service. The message to the webservice is as follows: <soapenv:Envelope xmlns:soapenv="http://schemas.xmlsoap.org/soap/envelope/" xmlns:impl="http://impl.ecoparkadvice.eCoMove project.eu/"> <soapenv:Header/> <soapenv:Body> <impl:getParkAdvice> <origin> <x>5.637105820315689</x> <y>51.47594486064221</y> </origin> <destination> <x>5.656771670125583</x> <y>51.47837591252984</y> </destination> <maxWalkingDistance>450</maxWalkingDistance> </impl:getParkAdvice> </soapenv:Body> </soapenv:Envelope>
This message was sent towards the ecoParkAdvice service and the returned response was: <S:Envelope xmlns:S="http://schemas.xmlsoap.org/soap/envelope/"> <S:Body> <ns2:getParkAdviceResponse xmlns:ns2="http://impl.ecoparkadvice.eCoMove project.eu/"> <advice> <cost>1939</cost> <location> <x>5.659607831011106</x> <y>51.47965605014039</y> </location> <name>Parkeerterrein Kluisstraat</name> </advice> <advice> <cost>1957</cost> <location> <x>5.653765419424845</x> <y>51.48035157391642</y> </location> <name>City Parkeergarage</name> </advice> <advice> <cost>2056</cost> <location> <x>5.658625117396543</x> <y>51.47807068856929</y> </location> <name>Parkeergarage Doorneind</name> </advice> <advice> <cost>2431</cost> <location> <x>5.65571717730448</x> <y>51.48137894341335</y> </location> <name>Elzas Parkeergarage</name> </advice> </ns2:getParkAdviceResponse> </S:Body> </S:Envelope>

eCoMove D543.57(D5.7)- Development and Testing of Traffic Management and Control Measures
31/01/2013 39 Version Final
From the response we can see that the parking locations that have been returned are equal to the expected locations, and are located in the vicinity of the destination (SP5.2.0006). This is determined based on the serving areas of the parking facilities. From the response we can also see that the parking facilities are ordered based on the energy efficiency (cost) of the journey towards the facility (SP5.2.0007 and SP5.2.0008 through the routing engine) where Doorneind is the closest to the actual destination. Overall we can conclude that the ecoParkAdvice application is working as expected. 5.4 Verification overview for ecoGreen Wave The main functionality of the ecoGreen Wave to be verified is the following:
- 1. Calculate offsets (and progressive speeds) for signal programs on
coordinated intersections
- Reference to main requirements: SP5-0016, SP5-0017, SP5-0019, SP5-0021
- Reference to test sites: Simulation environment Munich
- Reference to verification phases: alpha
- Reference to test cases (below): 1
References of the verification tests for the component ecoGreen Wave to other chapters and deliverables:
- The functional description of the component can be found in chapter 3.3 of
deliverable D5.6.
- The description of interfaces, parameters and test setups can be found in
chapter 4.3 and 5.3 of deliverable D5.6, and chapter 6.3 of this deliverable.
The individual benefit of the ecoGreen Wave is optimized coordinated signal plans that guarantee a green wave in two directions of a stretch of road by assuming that the progressive speed can be influenced by the ecoApproach Advice.
5.4.1 Verification Test Case 1: Calculate offsets (and progressive speeds) for signal programs on coordinated intersections
The ecoGreen Wave will calculate an optimized offset (and the progressive speeds of traffic streams) assuming that vehicles can be influenced by the ecoApproach Advice. This should have an effect on both driving directions.
Therefore the purpose of this test case is to verify that the ecoGreen Wave fulfils its requirements regarding calculation speeds, network width traffic actuation, strategic influences and local traffic actuation.
Reference to main requirements: SP5-0016, SP5-0017, SP5-0019, SP5-0021
Reference to verification phases: alpha
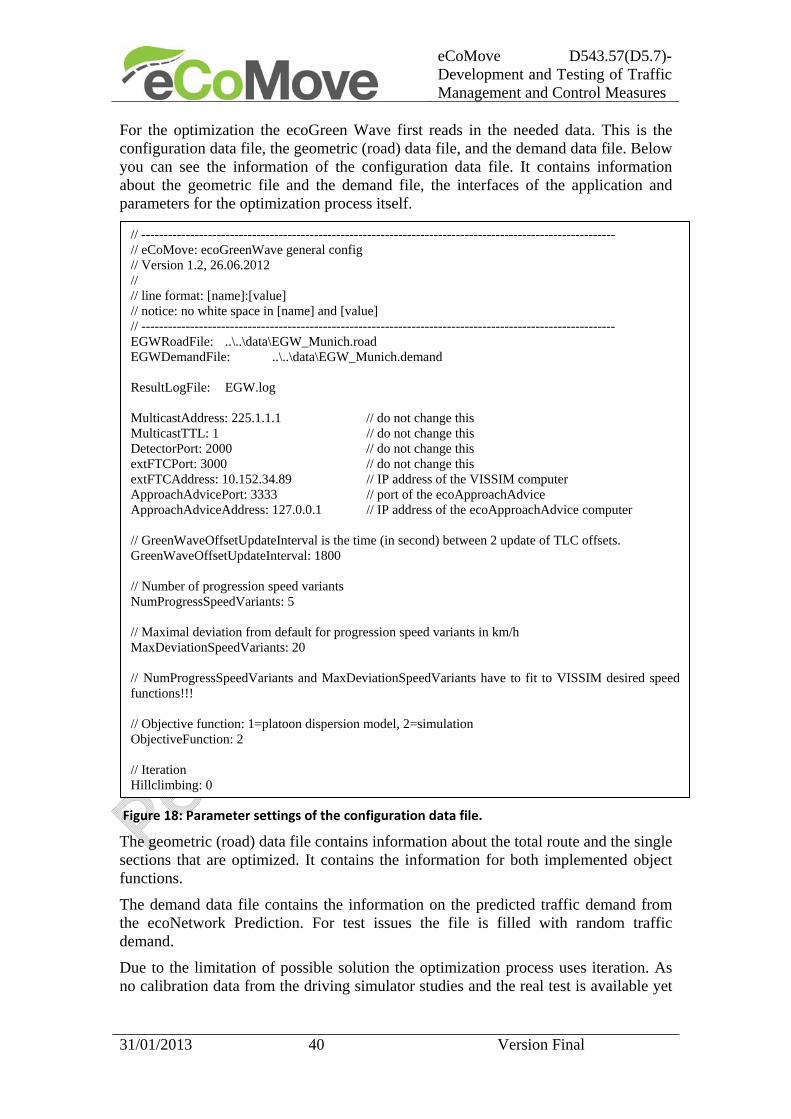
eCoMove D543.57(D5.7)- Development and Testing of Traffic Management and Control Measures
31/01/2013 40 Version Final
For the optimization the ecoGreen Wave first reads in the needed data. This is the configuration data file, the geometric (road) data file, and the demand data file. Below you can see the information of the configuration data file. It contains information about the geometric file and the demand file, the interfaces of the application and parameters for the optimization process itself.
Figure 18: Parameter settings of the configuration data file.
The geometric (road) data file contains information about the total route and the single sections that are optimized. It contains the information for both implemented object functions.
The demand data file contains the information on the predicted traffic demand from the ecoNetwork Prediction. For test issues the file is filled with random traffic demand.
Due to the limitation of possible solution the optimization process uses iteration. As no calibration data from the driving simulator studies and the real test is available yet
// ----------------------------------------------------------------------------------------------------------- // eCoMove: ecoGreenWave general config // Version 1.2, 26.06.2012 // // line format: [name]:[value] // notice: no white space in [name] and [value] // ----------------------------------------------------------------------------------------------------------- EGWRoadFile: ..\..\data\EGW_Munich.road EGWDemandFile: ..\..\data\EGW_Munich.demand ResultLogFile: EGW.log MulticastAddress: 225.1.1.1 // do not change this MulticastTTL: 1 // do not change this DetectorPort: 2000 // do not change this extFTCPort: 3000 // do not change this extFTCAddress: 10.152.34.89 // IP address of the VISSIM computer ApproachAdvicePort: 3333 // port of the ecoApproachAdvice ApproachAdviceAddress: 127.0.0.1 // IP address of the ecoApproachAdvice computer // GreenWaveOffsetUpdateInterval is the time (in second) between 2 update of TLC offsets. GreenWaveOffsetUpdateInterval: 1800 // Number of progression speed variants NumProgressSpeedVariants: 5 // Maximal deviation from default for progression speed variants in km/h MaxDeviationSpeedVariants: 20 // NumProgressSpeedVariants and MaxDeviationSpeedVariants have to fit to VISSIM desired speed functions!!! // Objective function: 1=platoon dispersion model, 2=simulation ObjectiveFunction: 2 // Iteration Hillclimbing: 0
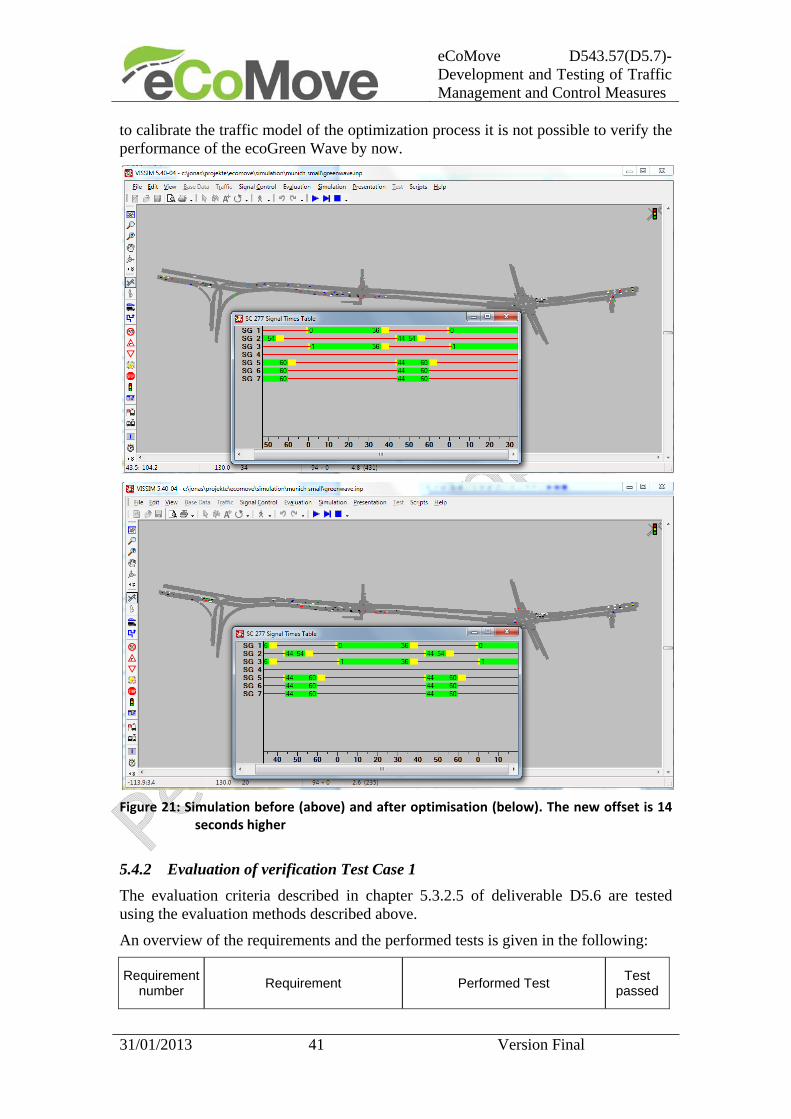
eCoMove D543.57(D5.7)- Development and Testing of Traffic Management and Control Measures
31/01/2013 41 Version Final
to calibrate the traffic model of the optimization process it is not possible to verify the performance of the ecoGreen Wave by now.
Figure 21: Simulation before (above) and after optimisation (below). The new offset is 14
seconds higher
5.4.2 Evaluation of verification Test Case 1
The evaluation criteria described in chapter 5.3.2.5 of deliverable D5.6 are tested using the evaluation methods described above.
An overview of the requirements and the performed tests is given in the following:
Requirement number
Requirement Performed Test Test
passed
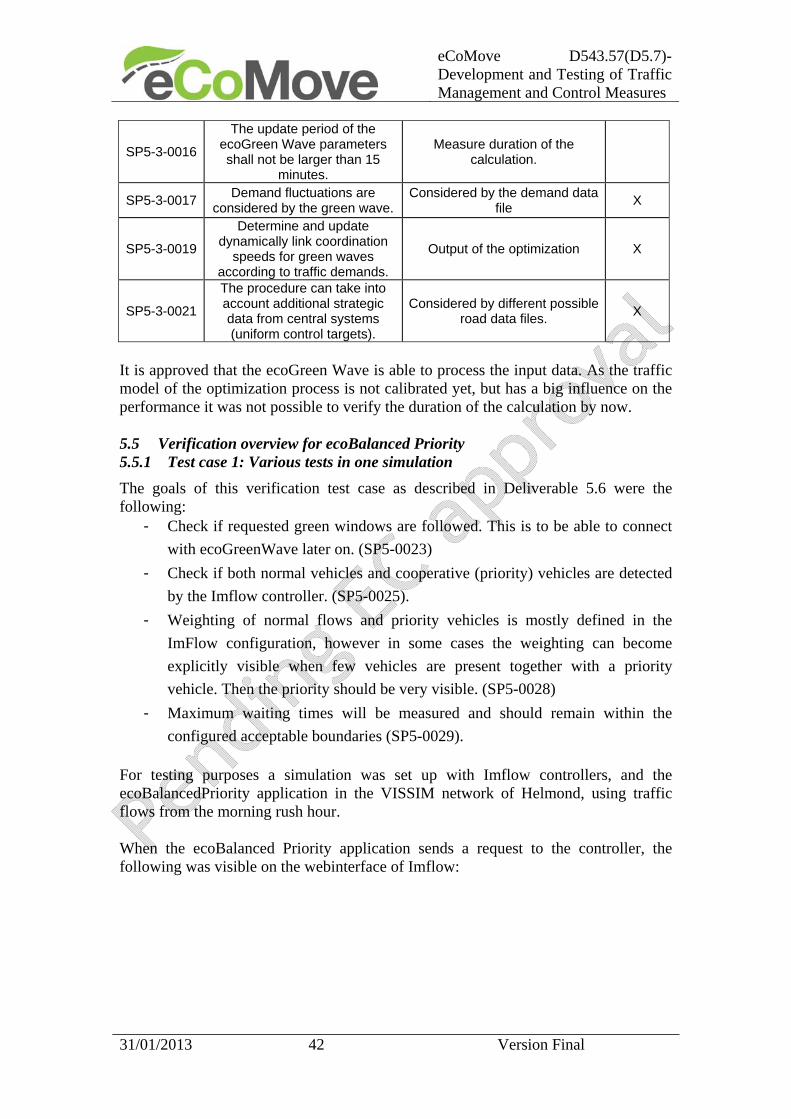
eCoMove D543.57(D5.7)- Development and Testing of Traffic Management and Control Measures
31/01/2013 42 Version Final
SP5-3-0016
The update period of the ecoGreen Wave parameters shall not be larger than 15
minutes.
Measure duration of the calculation.
SP5-3-0017 Demand fluctuations are
considered by the green wave. Considered by the demand data
file X
SP5-3-0019
Determine and update dynamically link coordination
speeds for green waves according to traffic demands.
Output of the optimization X
SP5-3-0021
The procedure can take into account additional strategic data from central systems (uniform control targets).
Considered by different possible road data files.
X
It is approved that the ecoGreen Wave is able to process the input data. As the traffic model of the optimization process is not calibrated yet, but has a big influence on the performance it was not possible to verify the duration of the calculation by now. 5.5 Verification overview for ecoBalanced Priority 5.5.1 Test case 1: Various tests in one simulation
The goals of this verification test case as described in Deliverable 5.6 were the following:
- Check if requested green windows are followed. This is to be able to connect
with ecoGreenWave later on. (SP5-0023)
- Check if both normal vehicles and cooperative (priority) vehicles are detected
by the Imflow controller. (SP5-0025).
- Weighting of normal flows and priority vehicles is mostly defined in the
ImFlow configuration, however in some cases the weighting can become
explicitly visible when few vehicles are present together with a priority
vehicle. Then the priority should be very visible. (SP5-0028)
- Maximum waiting times will be measured and should remain within the
configured acceptable boundaries (SP5-0029).
For testing purposes a simulation was set up with Imflow controllers, and the ecoBalancedPriority application in the VISSIM network of Helmond, using traffic flows from the morning rush hour. When the ecoBalanced Priority application sends a request to the controller, the following was visible on the webinterface of Imflow:
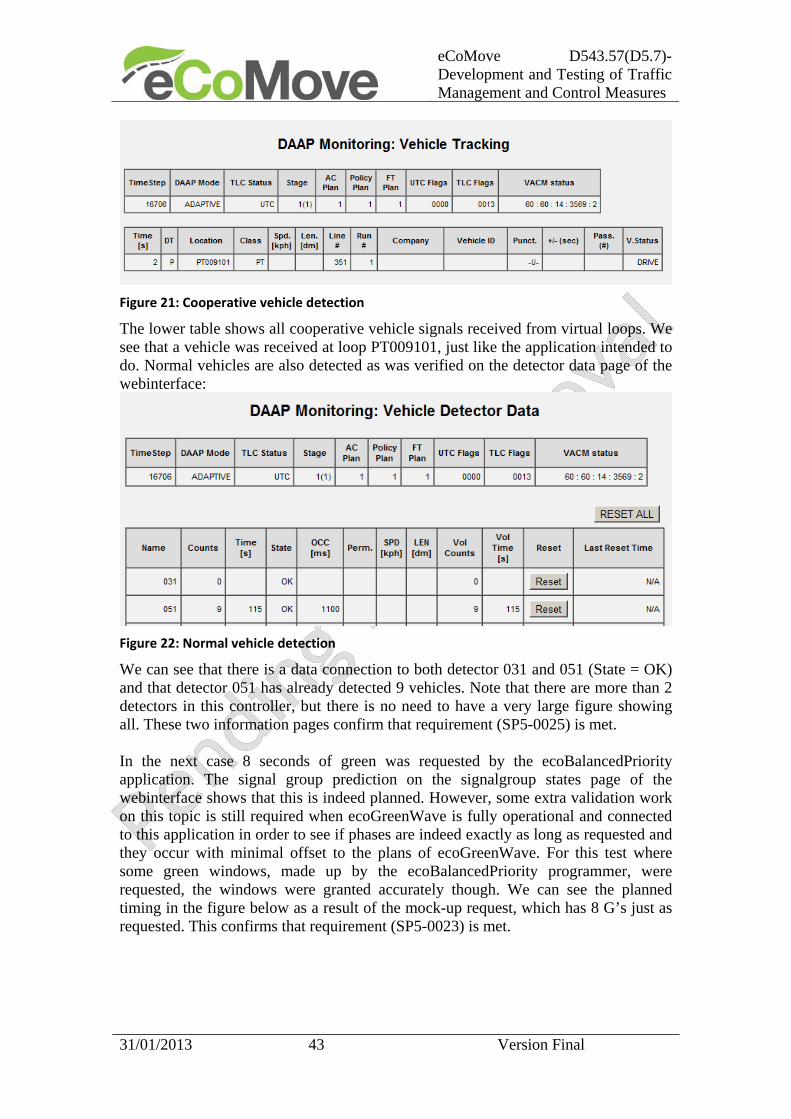
eCoMove D543.57(D5.7)- Development and Testing of Traffic Management and Control Measures
31/01/2013 43 Version Final
Figure 21: Cooperative vehicle detection
The lower table shows all cooperative vehicle signals received from virtual loops. We see that a vehicle was received at loop PT009101, just like the application intended to do. Normal vehicles are also detected as was verified on the detector data page of the webinterface:
Figure 22: Normal vehicle detection
We can see that there is a data connection to both detector 031 and 051 (State = OK) and that detector 051 has already detected 9 vehicles. Note that there are more than 2 detectors in this controller, but there is no need to have a very large figure showing all. These two information pages confirm that requirement (SP5-0025) is met. In the next case 8 seconds of green was requested by the ecoBalancedPriority application. The signal group prediction on the signalgroup states page of the webinterface shows that this is indeed planned. However, some extra validation work on this topic is still required when ecoGreenWave is fully operational and connected to this application in order to see if phases are indeed exactly as long as requested and they occur with minimal offset to the plans of ecoGreenWave. For this test where some green windows, made up by the ecoBalancedPriority programmer, were requested, the windows were granted accurately though. We can see the planned timing in the figure below as a result of the mock-up request, which has 8 G’s just as requested. This confirms that requirement (SP5-0023) is met.

eCoMove D543.57(D5.7)- Development and Testing of Traffic Management and Control Measures
31/01/2013 44 Version Final
Figure 23: Green phase requested for signal group 08
In another test a priority request was made while there was actually no traffic present on signal group 8 (the direction with the green light in the figure below). Conflicting traffic was present as can be seen in the figure below:
Figure 24: Priority for SG on the west wins over conflicting traffic from the north
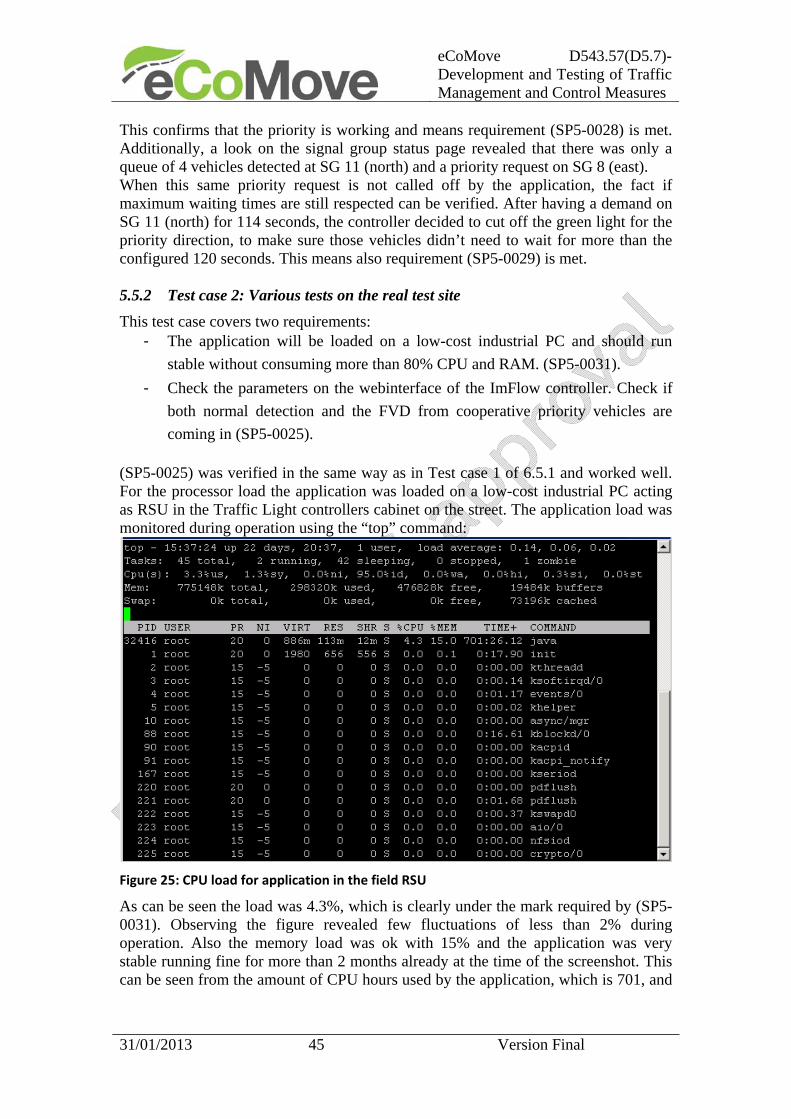
eCoMove D543.57(D5.7)- Development and Testing of Traffic Management and Control Measures
31/01/2013 45 Version Final
This confirms that the priority is working and means requirement (SP5-0028) is met. Additionally, a look on the signal group status page revealed that there was only a queue of 4 vehicles detected at SG 11 (north) and a priority request on SG 8 (east). When this same priority request is not called off by the application, the fact if maximum waiting times are still respected can be verified. After having a demand on SG 11 (north) for 114 seconds, the controller decided to cut off the green light for the priority direction, to make sure those vehicles didn’t need to wait for more than the configured 120 seconds. This means also requirement (SP5-0029) is met. 5.5.2 Test case 2: Various tests on the real test site
This test case covers two requirements: - The application will be loaded on a low-cost industrial PC and should run
stable without consuming more than 80% CPU and RAM. (SP5-0031).
- Check the parameters on the webinterface of the ImFlow controller. Check if
both normal detection and the FVD from cooperative priority vehicles are
coming in (SP5-0025).
(SP5-0025) was verified in the same way as in Test case 1 of 6.5.1 and worked well. For the processor load the application was loaded on a low-cost industrial PC acting as RSU in the Traffic Light controllers cabinet on the street. The application load was monitored during operation using the “top” command:
Figure 25: CPU load for application in the field RSU
As can be seen the load was 4.3%, which is clearly under the mark required by (SP5-0031). Observing the figure revealed few fluctuations of less than 2% during operation. Also the memory load was ok with 15% and the application was very stable running fine for more than 2 months already at the time of the screenshot. This can be seen from the amount of CPU hours used by the application, which is 701, and
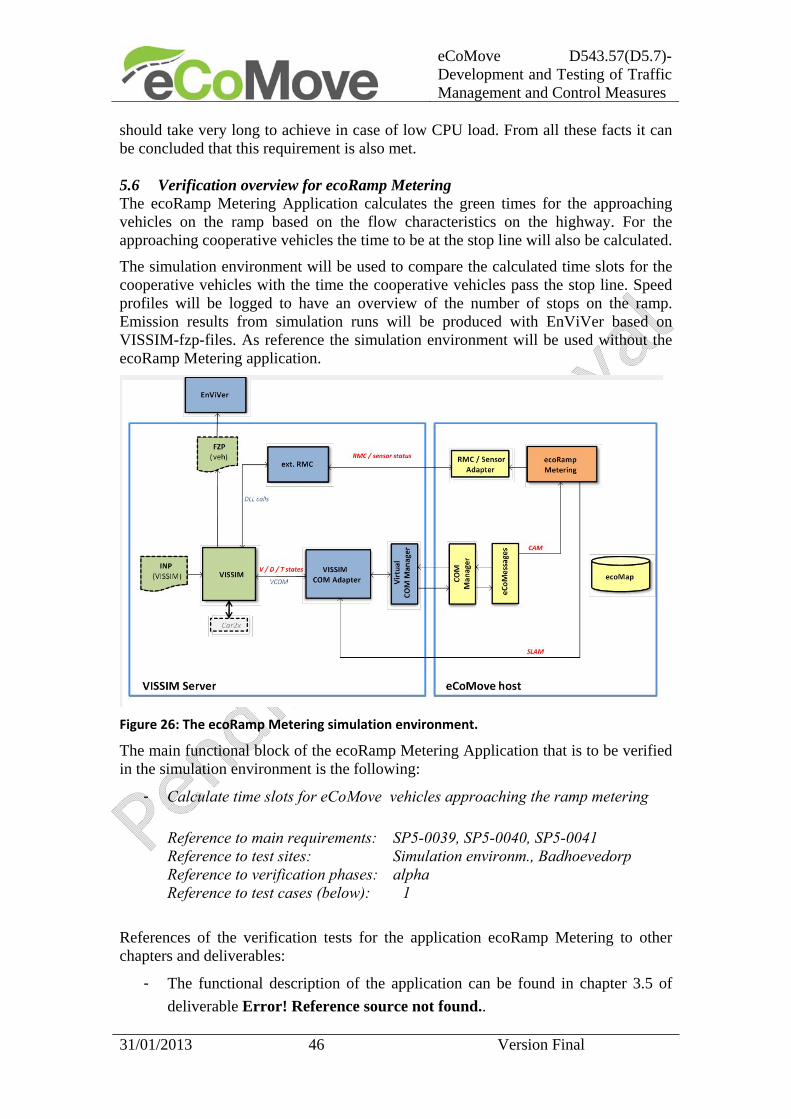
eCoMove D543.57(D5.7)- Development and Testing of Traffic Management and Control Measures
31/01/2013 46 Version Final
should take very long to achieve in case of low CPU load. From all these facts it can be concluded that this requirement is also met. 5.6 Verification overview for ecoRamp Metering The ecoRamp Metering Application calculates the green times for the approaching vehicles on the ramp based on the flow characteristics on the highway. For the approaching cooperative vehicles the time to be at the stop line will also be calculated.
The simulation environment will be used to compare the calculated time slots for the cooperative vehicles with the time the cooperative vehicles pass the stop line. Speed profiles will be logged to have an overview of the number of stops on the ramp. Emission results from simulation runs will be produced with EnViVer based on VISSIM-fzp-files. As reference the simulation environment will be used without the ecoRamp Metering application.
Figure 26: The ecoRamp Metering simulation environment.
The main functional block of the ecoRamp Metering Application that is to be verified in the simulation environment is the following:
- Calculate time slots for eCoMove vehicles approaching the ramp metering
Reference to main requirements: SP5-0039, SP5-0040, SP5-0041 Reference to test sites: Simulation environm., Badhoevedorp Reference to verification phases: alpha Reference to test cases (below): 1
References of the verification tests for the application ecoRamp Metering to other chapters and deliverables:
- The functional description of the application can be found in chapter 3.5 of
deliverable Error! Reference source not found..

eCoMove D543.57(D5.7)- Development and Testing of Traffic Management and Control Measures
31/01/2013 47 Version Final
The description of interfaces, parameters and test setups can be found in chapter 4.5 and 5.5 of deliverable D5.6. 5.6.1 Verification Test Case 1: Calculate time slots for eCoMove vehicles
approaching the ramp metering.
Reference to main requirements: SP5-0039, SP5-0040, SP5-0041 Reference to verification phases: alpha
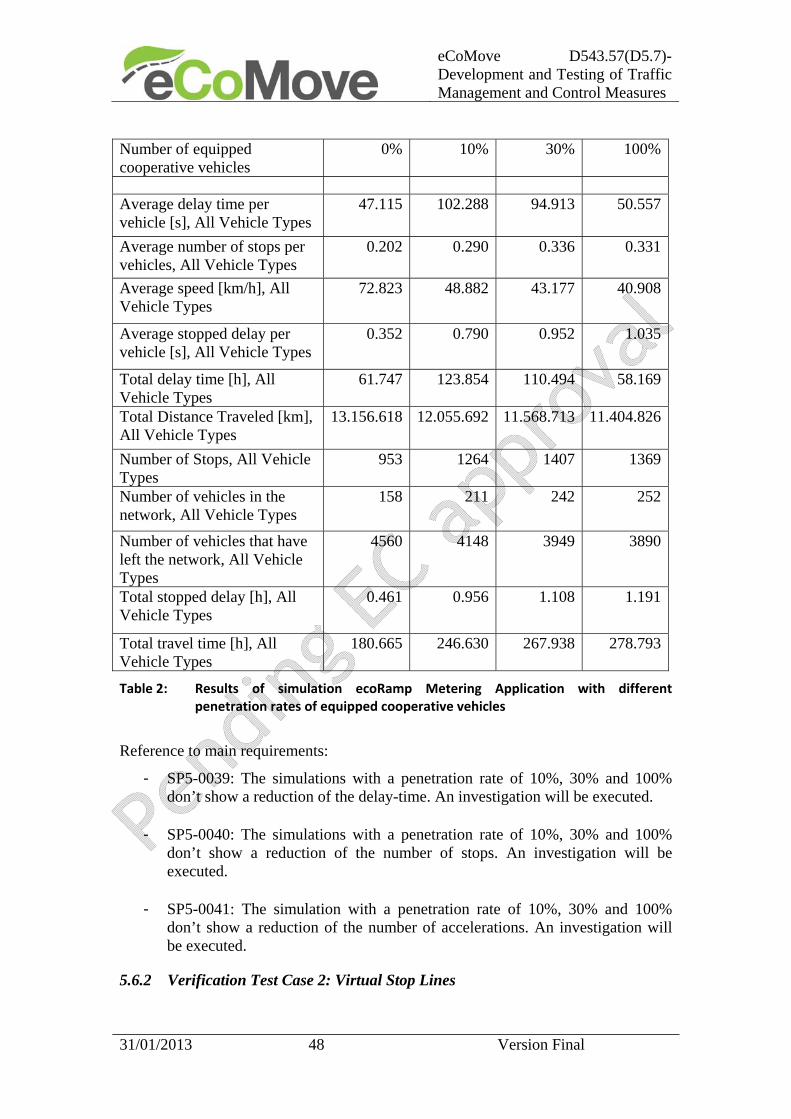
eCoMove D543.57(D5.7)- Development and Testing of Traffic Management and Control Measures
31/01/2013 48 Version Final
Number of equipped cooperative vehicles
0% 10% 30% 100%
Average delay time per vehicle [s], All Vehicle Types
47.115 102.288 94.913 50.557
Average number of stops per vehicles, All Vehicle Types
0.202 0.290 0.336 0.331
Average speed [km/h], All Vehicle Types
72.823 48.882 43.177 40.908
Average stopped delay per vehicle [s], All Vehicle Types
0.352 0.790 0.952 1.035
Total delay time [h], All Vehicle Types
61.747 123.854 110.494 58.169
Total Distance Traveled [km], All Vehicle Types
13.156.618 12.055.692 11.568.713 11.404.826
Number of Stops, All Vehicle Types
953 1264 1407 1369
Number of vehicles in the network, All Vehicle Types
158 211 242 252
Number of vehicles that have left the network, All Vehicle Types
4560 4148 3949 3890
Total stopped delay [h], All Vehicle Types
0.461 0.956 1.108 1.191
Total travel time [h], All Vehicle Types
180.665 246.630 267.938 278.793
Table 2: Results of simulation ecoRamp Metering Application with different penetration rates of equipped cooperative vehicles
Reference to main requirements:
- SP5-0039: The simulations with a penetration rate of 10%, 30% and 100% don’t show a reduction of the delay-time. An investigation will be executed.
- SP5-0040: The simulations with a penetration rate of 10%, 30% and 100%
don’t show a reduction of the number of stops. An investigation will be executed.
- SP5-0041: The simulation with a penetration rate of 10%, 30% and 100%
don’t show a reduction of the number of accelerations. An investigation will be executed.
5.6.2 Verification Test Case 2: Virtual Stop Lines

eCoMove D543.57(D5.7)- Development and Testing of Traffic Management and Control Measures
31/01/2013 49 Version Final
In case of a long queue, virtual stop lines halt parts of the queue while only the front of the queue is in stop-and-go mode. Once the most downstream section has cleared, the remainder of the queue can move forward at once, potentially saving significantly on fuel. As described in D5.6 the objectives of this test were to assess whether the behavior of the Virtual Stop Line (VSL) strategy is right and whether such a strategy actually reduces fuel consumption on on-ramps. Details on the implementation of the strategy within the AIMSUN simulation software are discussed in D5.6 as well. Figure 27 shows the VSL strategy in operation. After calibration of the driver behavior AIMSUN-settings and based on the results presented below it can be concluded that the VSL strategy was implemented satisfactory.
Figure 27: Virtual Stop Line strategy in operation in AIMSUN
Requirement SP5 – 0042: The strategy reduces the amount of stop-and-go movements on on-ramps For the on-ramp, activation of the VSL strategy resulted in an overall reduction of CO2 of 15%, a 23% reduction in NOx emission, and a 14% reduction in PM. These substantial results were achieved mainly due to the reduction of the stop and go’s, for the total network this reduction was 18%.

eCoMove D543.57(D5.7)- Development and Testing of Traffic Management and Control Measures
31/01/2013 50 Version Final
Figure 28: Comparison of typical vehicles on on‐ramp without and with VSL activated
Figure 28 shows the typical trajectory of a vehicle on an on-ramp with and without activation of the virtual stop line strategy. Clearly, trajectories are much smoother with the strategy activated. The peaks in the curve around 60 seconds mark the moment the VSL strategy is deactivated and the vehicles move on to the actual stop line of the ramp metering strategy. On the entire network a reduction of 4% in CO2, 4% in NOx and 5% was observed. Results are summarized in Table 3.
Table 3: Results for virtual stop line strategy
Requirement SP5 – 0044: The strategy is able to discriminate between different lanes and branches

eCoMove D543.57(D5.7)- Development and Testing of Traffic Management and Control Measures
31/01/2013 51 Version Final
In theory it is possible to keep one lane to halt while the adjacent lane can drive on. In particular in combination with the truck priority strategy this approach could work very well. However, with the available features within AIMSUN it was not possible to implement this mechanism. Besides, from a user perspective is seems a very unacceptable solution because of equity reasons. Requirement SP5 – 0045: Outcome of the control strategy should remain within the acceptability boundaries of individual travelers With the VSL strategy the total waiting time at the on-ramp does not increase or decrease, only the number of stops during the wait is affected. However, literature shows that drivers prefer to progress slowly rather than to wait long ones and progress faster (David et al., 2003). As such, the VSL strategy could have a negative effect on acceptability. On the other hand, there is evidence that information about the expected wait length can largely relieve the negative emotions associated with waiting (Zhang et al., 2009; Osuna, 1995). Therefore, in combination with information on time to green the VSL strategy might be acceptable.
Ref Doc
[David et al., 2003] David, L. Kathleen, H. John, B and Kasia, W. (2003). Weighting Waiting: Evaluating the Perception of In-Vehicle Travel Time Under Moving and Stopped Conditions. 10th Inter. Conference on Travel Behaviour Research
[Zhang et al., 2009] Osuna, Edgar E. (1985), The psychological cost of waiting. Journal of Mathematical Psychology, 29(1), 82-105
[Osuna, 1995] Lei Zhang, Feng Xie and David Levinson, Illusion of Motion Variation in Value of Travel Time Under Different Freeway Driving Conditions, 2009
5.6.3 Verification Test Case 2: Truck Priority strategy
As described in D5.6 the objectives of this test were to assess whether the behavior of the Truck Priority (TP) strategy is right and whether such a strategy actually reduces fuel consumption on on-ramps. Details on the implementation of the strategy within the AIMSUN simulation software are discussed in D5.6 as well. Details on the setup of the simulation and calibration of the network will be given in D5.10. After a process of trial-and-error to get the AIMSUN-settings right and based on the results presented below it can be concluded that the TP strategy was implemented satisfactory. Requirement SP5 – 0042: The strategy reduces the amount of stop-and-go movements on on-ramps Requirement SP5 – 0043: The strategy reduces the fuel consumption of heavy and/or polluting vehicles on on-ramps For the on-ramp, activation of the TP strategy resulted in an overall reduction of CO2 of 29.6%, a 37% reduction in NOx emission, and a 34% reduction in PM. Although, the emission of motorway traffic slightly increased, the effect on the on-ramp is large

eCoMove D543.57(D5.7)- Development and Testing of Traffic Management and Control Measures
31/01/2013 52 Version Final
enough to achieve an overall improvement. Compared to the virtual stop line strategy the benefits are higher as a result of targeting the most polluting vehicles with the TP strategy. Especially for this category the number of stop-and-go movements decrease. The share of trucks was 10%, which is relatively high compared to other studies. Unexpectedly, the motorway hardly suffers from the truck priority strategy. The results are summarized in Table 4.
Table 4: results for truck priority strategy
Requirement SP5 – 0044: The strategy is able to discriminate between different lanes and braches Requirement SP5 – 0045: Outcome of the control strategy should remain within the acceptability boundaries of individual travelers Requirement SP5 – 0046: The control strategy anticipates to traffic conditions at upstream and downstream traffic controllers As mentioned in the previous section it was not possible to implement lane/branch specific approach with the available AIMSUN features. Although a different VSL strategy for adjacent lanes may not be acceptable, perhaps different priority strategies for branches are. To alleviate upstream conditions of one of the branches the green frequency as well as the number of vehicles allowed per green window could be varied per branch. Such an approach is very similar to the TP strategy currently implementation only depending on a different input variable. Still equity issues may affect user acceptance, but probably not as severely as is the case with different VSL strategies for adjacent lanes.
eCoMove D543.57(D5.7)- Development and Testing of Traffic Management and Control Measures
31/01/2013 53 Version Final
5.7 Verification overview for ecoSpeed and Headway Management The main functionality to be verified is the pprevention and mitigation of shockwaves in traffic flow. The functional description, parameters, interfaces, and preparation of the verification are detailed in deliverable D5.6. The ecoSpeed and Headway Management application is to be verified in the eCoMove simulation environment for part of the A10 near Tours France. A prerequisite condition for the verification is that shockwaves are present in the traffic situations modeled in simulation environment of Tours. Before any tests will be performed it will first be determined how often and how big the inefficiencies that can be mitigated though ecoSpeed and Headway management are. If the prerequisite conditions for ecoSpeed and Headway Management cannot be met verification will take place using other networks that do exemplify the inefficiencies targeted by ecoSpeed and Headway Management. Current results indicate that the inefficiencies to solve are not present in the simulation environment for Tours. Two approaches are followed. Firstly the ecoSpeed and Headway Management application is applied at the A270 test site in Helmond. The results are reported below. Secondly, the traffic demands are increased in the simulation for Tours such that the anticipated effects do occur. These experiments are still ongoing and will be reported upon later. 5.7.1 Verification Test Case 1: Prevent and mitigate shockwaves in traffic flow
The test case verifies the functionality of a sequence of components in the following test procedure:
1. Object Detection: The properties of the vehicles that are relevant for this application are timely and accurately relayed from test environment via the object detection module into the map. The object detection module detects road user objects, such as vehicles from V2I communication or road side sensors. The application requires the location and speed of vehicles in the monitored segment of the network.
2. Shockwave Detection: The shockwave fronts (head and tail) can be identified accurately and in a timely manner.
3. Shockwave Monitoring: The shockwave fronts (head and tail) can be monitored and tracked over time.
4. Profile Generation: The speed advice is generated for any detected shockwaves. The speed advice is defined as a speed profile, which is a function of the advised speed over the road length. The speed advice should comply to the local maximum speed limits and control targets from a strategic level.
5. Message Generation: The speed profile is relayed from the ecoSpeed and Headway Management application via the ecoMap to the vehicles in the simulation environment accurately and timely.
In the first step, the A270 section of the test site in Helmond is used as a test environment [Netten 2011]. The A270 section is 6 km long and 50 vehicles are used in this test, of which 20 are equipped with an on-board system to present the speed
eCoMove D543.57(D5.7)- Development and Testing of Traffic Management and Control Measures
31/01/2013 54 Version Final
advice to the driver. All vehicles drive in one lane and drivers are instructed to follow the advice. Traffic is continuously monitored at 10 Hz by road side sensors between locations 1000 and 5800 m and from G5 (802.11p) communication. Live traffic data is forwarded to the application unit with the speed and headway management application. Error! Reference source not found. (top) shows the vehicle detections (step 1) as trajectories of the vehicle positions along the route and their speed (color). The shockwaves are created by the first vehicle; it drives at 80 km/h and slows down to 50 km/h for 10 seconds, and then accelerates back to 80 km/h again. This maneuver is performed twice at 60 and 180 seconds in the experiment. A speed and headway advice is broadcasted continuously along the route in a SLAM. The speed advice is generated as a speed profile; a linear function of an advised speed along the route. An equipped vehicle can determine a speed advice for their momentary location from this profile. The maximum speed limit of 100km/h is the default for the speed profile. Upon detection of a perturbation (shockwave), the speed profile is adapted to resolve the perturbation. Error! Reference source not found. (bottom) shows two profiles at 90 and 120 sec of the experiment as a black line. Shortly after the maneuver of the lead vehicle a speed measure is computed and gradually introduced to control the decelerations of vehicles in the affected area. At 90 seconds the profile (bottom left) is extended over a length of 2 km, of which 1 km has a minimum advice speed of 55 km/h upstream of the jam head. The speed advice linearly decreases between locations 1400 and 2100m at a rate equivalent to a deceleration when the throttle is released (without braking). At 90 sec, the equipped vehicles are still decelerating to reach the reduced speed limit, thus creating gaps with their leading vehicles. At 120 sec, the first vehicle is already accelerating out of the perturbation. The outflow from the jam head is stimulated with a linearly increasing speed advice at a reasonably and steady acceleration, and slightly above the detected speeds. This allows gradually raising the minimum speed in the shockwave to resolve the upstream perturbation as quickly as possible and restore the initial free flow state around 150 sec. Note that the last vehicle is not really participating in the experiment.
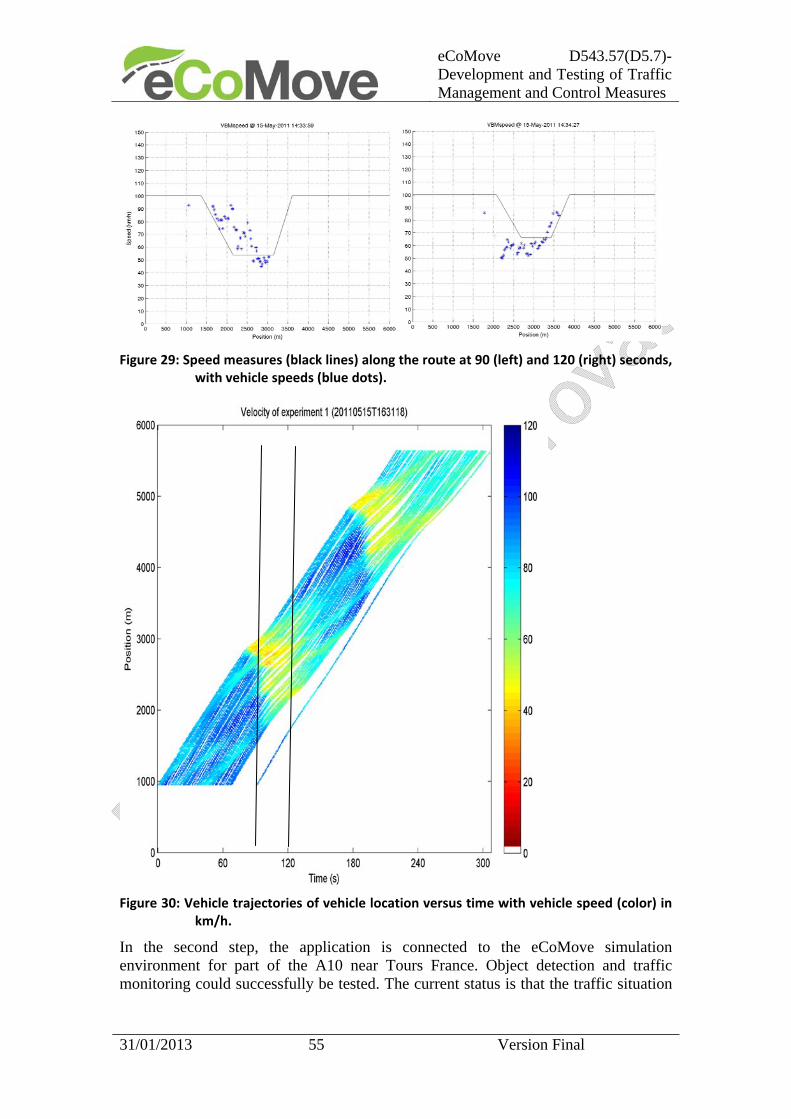
eCoMove D543.57(D5.7)- Development and Testing of Traffic Management and Control Measures
31/01/2013 55 Version Final
Figure 29: Speed measures (black lines) along the route at 90 (left) and 120 (right) seconds,
with vehicle speeds (blue dots).
Figure 30: Vehicle trajectories of vehicle location versus time with vehicle speed (color) in
km/h.
In the second step, the application is connected to the eCoMove simulation environment for part of the A10 near Tours France. Object detection and traffic monitoring could successfully be tested. The current status is that the traffic situation
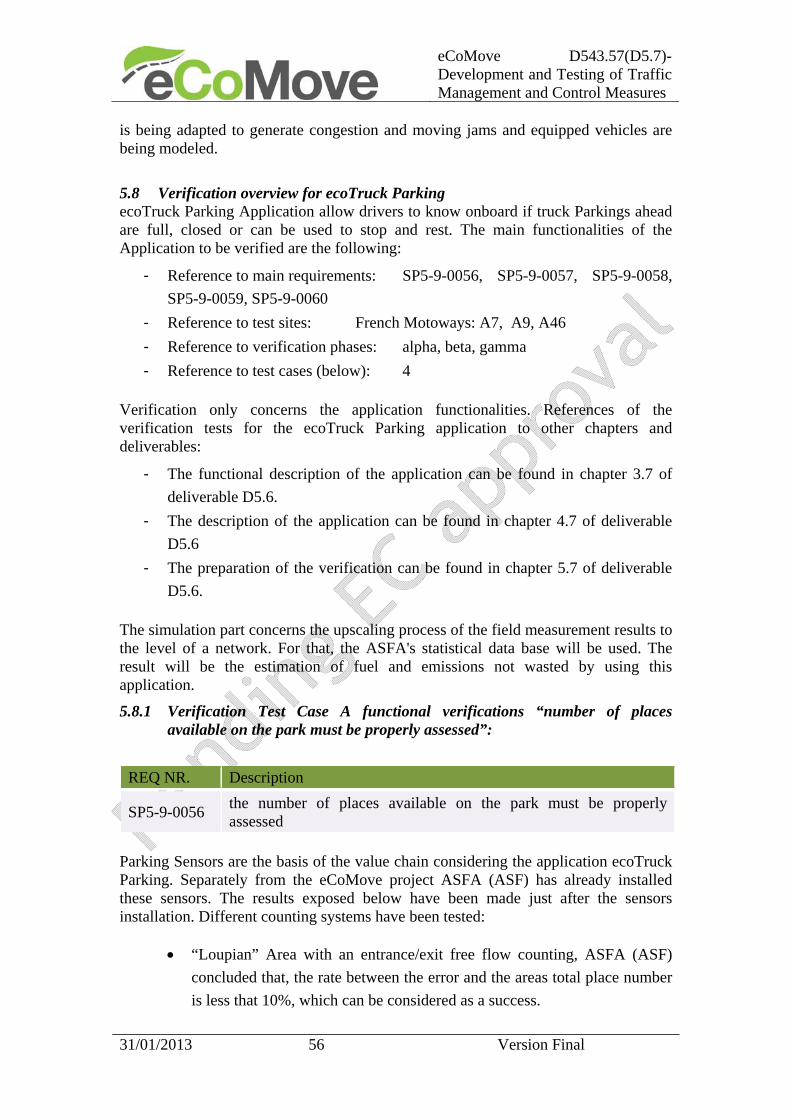
eCoMove D543.57(D5.7)- Development and Testing of Traffic Management and Control Measures
31/01/2013 56 Version Final
is being adapted to generate congestion and moving jams and equipped vehicles are being modeled.
5.8 Verification overview for ecoTruck Parking ecoTruck Parking Application allow drivers to know onboard if truck Parkings ahead are full, closed or can be used to stop and rest. The main functionalities of the Application to be verified are the following:
- Reference to main requirements: SP5-9-0056, SP5-9-0057, SP5-9-0058,
SP5-9-0059, SP5-9-0060
- Reference to test sites: French Motoways: A7, A9, A46
- Reference to verification phases: alpha, beta, gamma
- Reference to test cases (below): 4
Verification only concerns the application functionalities. References of the verification tests for the ecoTruck Parking application to other chapters and deliverables:
- The functional description of the application can be found in chapter 3.7 of
deliverable D5.6.
- The description of the application can be found in chapter 4.7 of deliverable
D5.6
- The preparation of the verification can be found in chapter 5.7 of deliverable
D5.6.
The simulation part concerns the upscaling process of the field measurement results to the level of a network. For that, the ASFA's statistical data base will be used. The result will be the estimation of fuel and emissions not wasted by using this application.
5.8.1 Verification Test Case A functional verifications “number of places available on the park must be properly assessed”:
REQ NR. Description
SP5-9-0056 the number of places available on the park must be properly assessed
Parking Sensors are the basis of the value chain considering the application ecoTruck Parking. Separately from the eCoMove project ASFA (ASF) has already installed these sensors. The results exposed below have been made just after the sensors installation. Different counting systems have been tested:
“Loupian” Area with an entrance/exit free flow counting, ASFA (ASF)
concluded that, the rate between the error and the areas total place number
is less that 10%, which can be considered as a success.

eCoMove D543.57(D5.7)- Development and Testing of Traffic Management and Control Measures
31/01/2013 57 Version Final
“Lunel” and “Montelimar” Area with an entrance/exit counting with toll
system; the results give an error rate of 2% which is very good.
“Béziers” area with sensors on the ground on each place. This system,
mainly due to cost efficiency will be multiplied on ASFA network.
We choose here to develop the results on “Beziers” area because a lot of things can be said. Observations have permitted to highlight that 15 to 20% of the events produce a sensor error:
Maneuver of readjustment of the truck just after the arrival of the truck,
Departure immediately followed by an arrival
Maneuver of a truck on the place nearby
Trailer changes : truck departure without the trailer
Long maneuver more than 1minute
Short truck parked without interaction with the sensors
These phenomena aren’t all directly linked to the intrinsic sensors accuracy but to the extrapolation made from a point of measurement to a larger area. A truck incorrectly parked can generate a false data. It’s difficult to avoid totally this problem. ASFA (ASF) has made complementary tests with two sensors on a parking place and the results haven’t formalized significant gain.
After 60 hours of observations, ASFA (ASF) has realized statistics linked to each sensors. The synthesis is presented below: Initial situation Free place Occupied place Event Truck arrival Truck departure Detection rate 96%
Inte
rpre
tati
on
of th
e ra
w d
ata
Result is an entrance 100% 25%
Result is a departure 0% 75%
Sensors detect truck movement at 96%. Errors are mainly linked to truck departure. These departures are falsely concluded to new arrivals in 25% of the cases. 5.8.2 Verification Test Case B functional verifications “Status of the truck
parking area must correspond to reality”:
REQ NR. Description
SP5-9-0057 Status of the truck parking area must correspond to reality The “Full” status is determined when the number of free place is less that 10% of the total capacity. “Free” status occurs when the number of occupied places is more than

eCoMove D543.57(D5.7)- Development and Testing of Traffic Management and Control Measures
31/01/2013 58 Version Final
10% of the total capacity. “Close” status must occur only when the TMC forces this status. The tests have been made in September and October 2012 on A7 and A9 motorways. No status error has been detected. It must be underlined that no situation of full area was observed. At this state of the tests, ASFA is very confident in the algorithm made to determinate the status of the area. 5.8.3 Verification Test Case C functional verifications “vehicle is properly
positioned on a road, with a correct direction”:
REQ NR. Description
SP5-9-0058 Verify that a vehicle that sends its successive positions is properly positioned on a road, with a correct direction
The OBU send the last 3 positions recorded by the application to the servers, and the mapmatching algorithm:
Find if the OBU is on the ASFA network,
Determinate the reference of the motorway,
Determinate the direction of the OBU.
Tests have been made in September and October 2012(see illustrations below). 5.8.4 Verification Test Case D functional verifications “Downstream Truck
Parking Areas are sent to the OBU”:
REQ NR. Description
SP5-9-0059 The available parking search engine must return truck parking area located downstream from the vehicle's position

eCoMove D543.57(D5.7)- Development and Testing of Traffic Management and Control Measures
31/01/2013 59 Version Final
Figure 31: View of a test “2 oct 7h46.50” made southbound close to truck parking area of
Lunel
The log traces of the server at this moment are related below. 02 Oct 2012 07:46:50,317 DEBUG eCoTruckParking.eCoTruckParkingREST - lastLocations : [{"Latitude":43.75058060511947,"Longitude":4.213051982223988},{"Latitude":43.75050873029977,"Longitude":4.212674545124173},{"Latitude":43.75043073669076,"Longitude":4.212300544604659}] 02 Oct 2012 07:46:50,317 DEBUG eCoTruckParking.ParkingManager - Recherche des parkings sur la leg 19 après l'abscisse 12775 As written on the log, the last 3 GPS positions have been sent to the server. One of the positions is located on the map below (A9 motorway westbound).
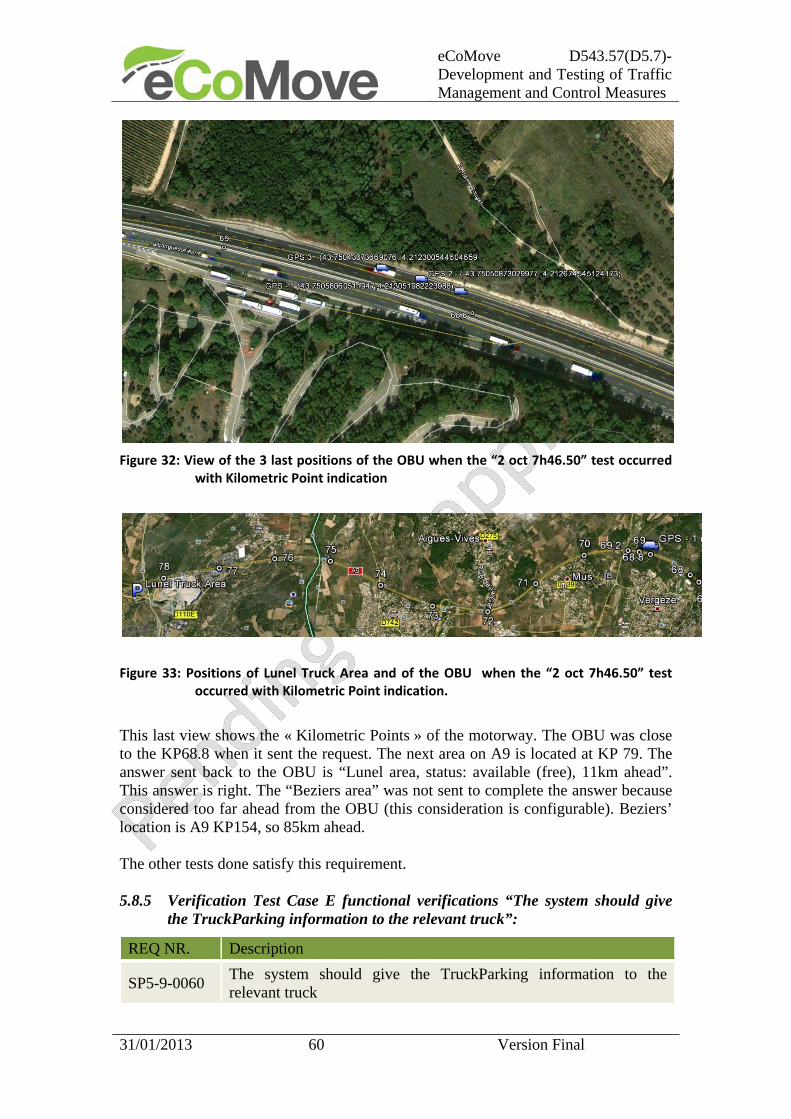
eCoMove D543.57(D5.7)- Development and Testing of Traffic Management and Control Measures
31/01/2013 60 Version Final
Figure 32: View of the 3 last positions of the OBU when the “2 oct 7h46.50” test occurred
with Kilometric Point indication
Figure 33: Positions of Lunel Truck Area and of the OBU when the “2 oct 7h46.50” test occurred with Kilometric Point indication.
This last view shows the « Kilometric Points » of the motorway. The OBU was close to the KP68.8 when it sent the request. The next area on A9 is located at KP 79. The answer sent back to the OBU is “Lunel area, status: available (free), 11km ahead”. This answer is right. The “Beziers area” was not sent to complete the answer because considered too far ahead from the OBU (this consideration is configurable). Beziers’ location is A9 KP154, so 85km ahead. The other tests done satisfy this requirement. 5.8.5 Verification Test Case E functional verifications “The system should give
the TruckParking information to the relevant truck”:
REQ NR. Description
SP5-9-0060 The system should give the TruckParking information to the relevant truck

eCoMove D543.57(D5.7)- Development and Testing of Traffic Management and Control Measures
31/01/2013 61 Version Final
These tests using two OBU haven’t been made for the moment. 5.9 Verification overview for ecoTolling The ecoTolling Application supports driver to pass in an energy efficient way a toll station. To support this, nonstop tolling lanes are provided to equipped vehicles which also receive lane and speed advice in order to guiding them to an appropriate toll gate.
The goal of this verification test is to assess that the ecoTolling is working as described in Deliverable 5.6. Specifically the test is aimed at the following requirements.
REQ NR.
Description Verification approach
SP5-10-0061
The number of stops will be lower driving through the ecoLane rather than a conventional lane
Assess number of stops for the toll station
SP5-10-0063
The drivers will follow the speed recommendations
Assess average speed within the approach of the toll station
SP5-10-0064
The average travel time will be improved compared to a "conventional" toll crossing. It is assumed here that the drivers will follow the speed recommendations on the pictogram on the entrance ecoTolling lane.
Assess traveltime loss for all vehicles passing the toll area
All verification tests are made using the VISSIM simulation environment described in chapter 3.3. Data collection for the verification starts after 30 minutes of simulation and end after 60 minutes. The following figure shows the area of the toll station with a green arrow indicating the start and a red arrow indicating the end point for the measurement of traveltime loss as well as number of stops. The distance between the green and the red arrow is 608 meters.
Figure 34: Toll area, driving direction from left to right
The following table shows the resulting measurements. The average traveltime loss compared to a drive with free flow speed, the average number of stops and the number of observed vehicles.

eCoMove D543.57(D5.7)- Development and Testing of Traffic Management and Control Measures
31/01/2013 62 Version Final
Vehicle type \ Measurement
Traveltime loss (seconds)
Number of stops Number of
vehicles eCoMove cars 25,3 1,55 534
Other cars 126,5 6,99 721
eCoMove hgvs 17,4 0,65 135
Other hgvs 49,9 1,59 41
The following table summarizes the verification of ecoTolling.
Verification Criteria Tests performed
Evaluation method
Assess number of stops for the toll station. X VISSIM analysis
Assess average speed within the approach of the toll station.
X VISSIM constraint
Assess traveltime loss for all vehicles passing the toll area.
X VISSIM analysis
It can be concluded, that the ecoTolling application is able to reduce the number of stops and improve the traveltime within the area of a toll station. Based on these first results further improvement of the application is investigated; especially its impact in situations with high traffic demand. 5.10 Verification overview for Driver Info Support and Driver Dialogue Manager The Driver Info Support and Driver Dialogue Manager (in the following named as ecoATS) support drivers and service providers to choose or calculate an optimal route based on latest information from traffic management as traffic state and prediction, information on events or roadworks and route recommendations as part of the strategic traffic management. The goal of this verification test is to assess that the Info Support and Driver Dialogue Manager are working as described in Deliverable 5.6. Specifically the test is aimed at the following requirements.
REQ NR.
Description Verification approach
SP5-14-0084
The infrastructure system provides traffic (and signal) states to the vehicles
See SP5-14-0087 and SP5-14-0088 for traffic state. Signal state is provided by ecoGreen wave
SP5-14-0085
The infrastructure (traffic operator) provides forecast information to the vehicles and other service provider
See SP5-14-0087 and SP5-14-0088
SP5-14-0086
The infrastructure (traffic operator) should provide tailored information to the vehicles
See SP5-14-0093
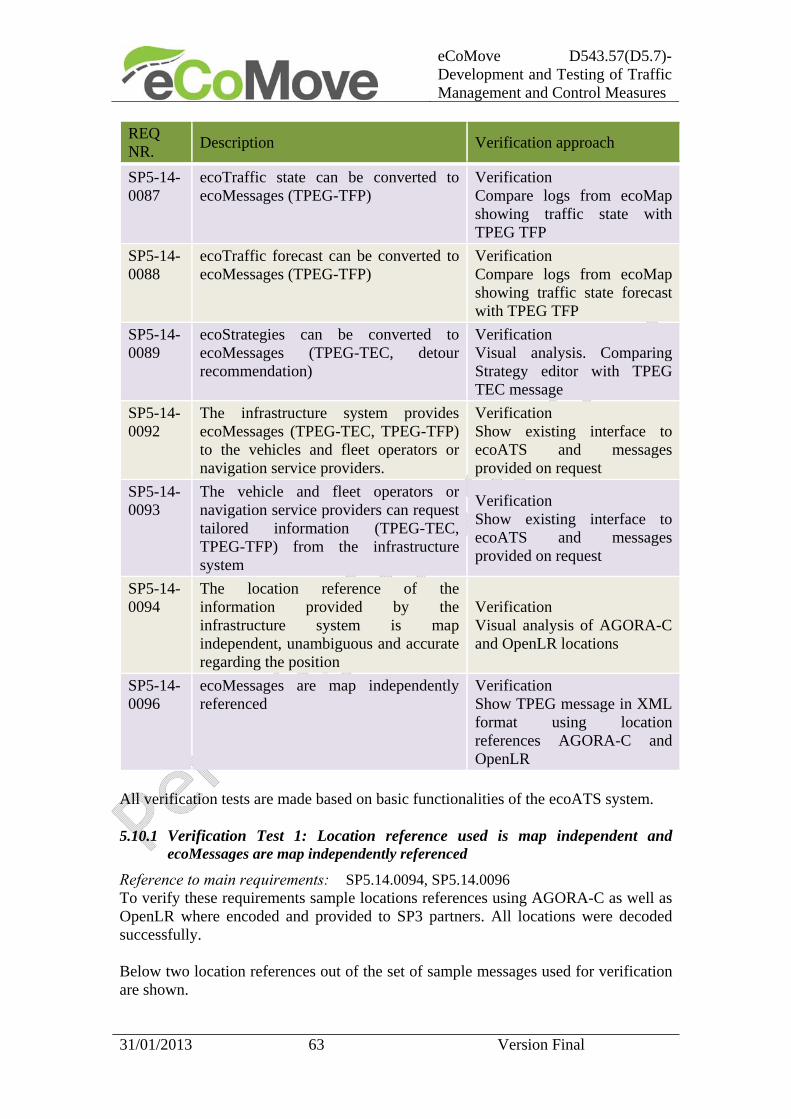
eCoMove D543.57(D5.7)- Development and Testing of Traffic Management and Control Measures
31/01/2013 63 Version Final
REQ NR.
Description Verification approach
SP5-14-0087
ecoTraffic state can be converted to ecoMessages (TPEG-TFP)
Verification Compare logs from ecoMap showing traffic state with TPEG TFP
SP5-14-0088
ecoTraffic forecast can be converted to ecoMessages (TPEG-TFP)
Verification Compare logs from ecoMap showing traffic state forecast with TPEG TFP
SP5-14-0089
ecoStrategies can be converted to ecoMessages (TPEG-TEC, detour recommendation)
Verification Visual analysis. Comparing Strategy editor with TPEG TEC message
SP5-14-0092
The infrastructure system provides ecoMessages (TPEG-TEC, TPEG-TFP) to the vehicles and fleet operators or navigation service providers.
Verification Show existing interface to ecoATS and messages provided on request
SP5-14-0093
The vehicle and fleet operators or navigation service providers can request tailored information (TPEG-TEC, TPEG-TFP) from the infrastructure system
Verification Show existing interface to ecoATS and messages provided on request
SP5-14-0094
The location reference of the information provided by the infrastructure system is map independent, unambiguous and accurate regarding the position
Verification Visual analysis of AGORA-C and OpenLR locations
SP5-14-0096
ecoMessages are map independently referenced
Verification Show TPEG message in XML format using location references AGORA-C and OpenLR
All verification tests are made based on basic functionalities of the ecoATS system. 5.10.1 Verification Test 1: Location reference used is map independent and
ecoMessages are map independently referenced
Reference to main requirements: SP5.14.0094, SP5.14.0096 To verify these requirements sample locations references using AGORA-C as well as OpenLR where encoded and provided to SP3 partners. All locations were decoded successfully. Below two location references out of the set of sample messages used for verification are shown.

eCoMove D543.57(D5.7)- Development and Testing of Traffic Management and Control Measures
31/01/2013 64 Version Final
Descriptor Bavaria-3-3-1 Location description:
Munich, Bavaria, A995
Location coordinates:
48.02448, 11.6584448.02709, 11.64839
AGORA code:
AVwBMABYAiAGBBcWhCwISy4iJYfsSBXNQAABAQVBdXRvYgQIB9EI3FPsWA0EBwbIQP9RAL0EERDITP4+AHnCSAPQQARBOTk1BAgH0QjuAcJIKAQKCYhM/wQAC8JgUA==
Encoding map:
Figure 35: Sample location in Bavaria (Intersection München Süd on highway A995) using AGORA‐C as method for map independent location referencing
Descriptor Helmond-1-1-7 Location description:
Helmond N270 / Lagedijk / Engelseweg
OpenLR code:
CwQILySa/hKJG/+P/x0iQAc=
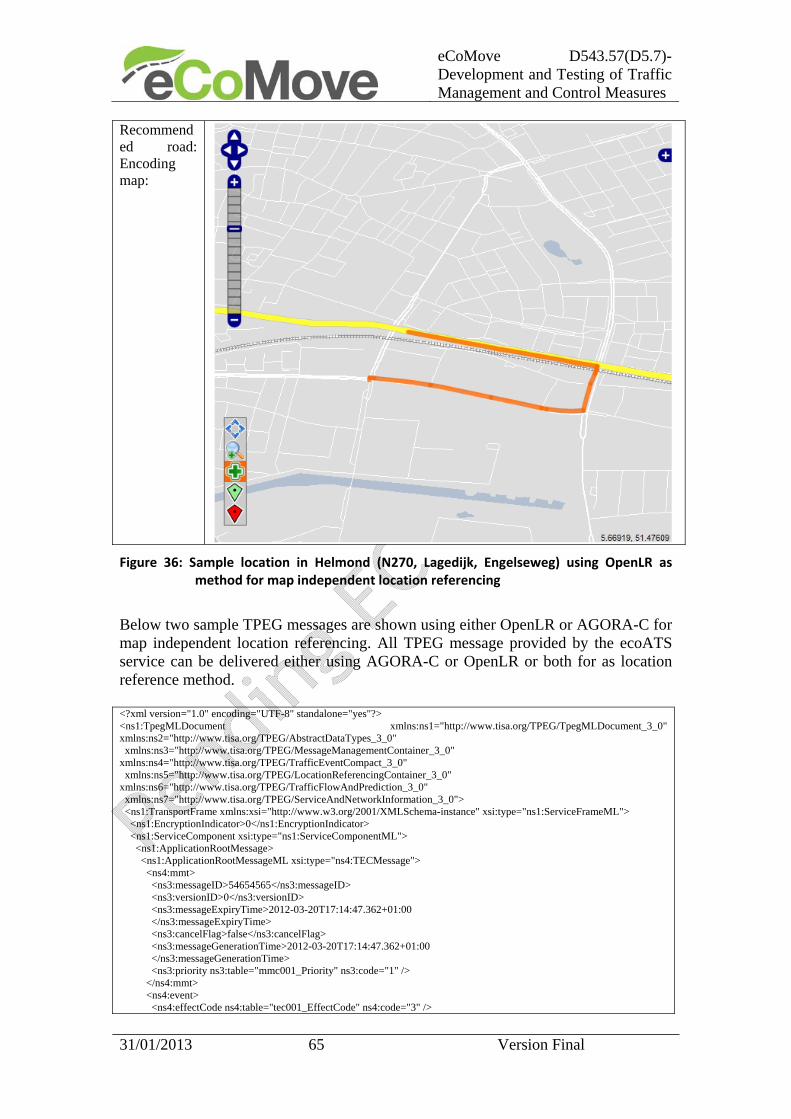
eCoMove D543.57(D5.7)- Development and Testing of Traffic Management and Control Measures
31/01/2013 65 Version Final
Recommended road: Encoding map:
Figure 36: Sample location in Helmond (N270, Lagedijk, Engelseweg) using OpenLR as method for map independent location referencing
Below two sample TPEG messages are shown using either OpenLR or AGORA-C for map independent location referencing. All TPEG message provided by the ecoATS service can be delivered either using AGORA-C or OpenLR or both for as location reference method. <?xml version="1.0" encoding="UTF-8" standalone="yes"?> <ns1:TpegMLDocument xmlns:ns1="http://www.tisa.org/TPEG/TpegMLDocument_3_0" xmlns:ns2="http://www.tisa.org/TPEG/AbstractDataTypes_3_0" xmlns:ns3="http://www.tisa.org/TPEG/MessageManagementContainer_3_0" xmlns:ns4="http://www.tisa.org/TPEG/TrafficEventCompact_3_0" xmlns:ns5="http://www.tisa.org/TPEG/LocationReferencingContainer_3_0" xmlns:ns6="http://www.tisa.org/TPEG/TrafficFlowAndPrediction_3_0" xmlns:ns7="http://www.tisa.org/TPEG/ServiceAndNetworkInformation_3_0"> <ns1:TransportFrame xmlns:xsi="http://www.w3.org/2001/XMLSchema-instance" xsi:type="ns1:ServiceFrameML"> <ns1:EncryptionIndicator>0</ns1:EncryptionIndicator> <ns1:ServiceComponent xsi:type="ns1:ServiceComponentML"> <ns1:ApplicationRootMessage> <ns1:ApplicationRootMessageML xsi:type="ns4:TECMessage"> <ns4:mmt> <ns3:messageID>54654565</ns3:messageID> <ns3:versionID>0</ns3:versionID> <ns3:messageExpiryTime>2012-03-20T17:14:47.362+01:00 </ns3:messageExpiryTime> <ns3:cancelFlag>false</ns3:cancelFlag> <ns3:messageGenerationTime>2012-03-20T17:14:47.362+01:00 </ns3:messageGenerationTime> <ns3:priority ns3:table="mmc001_Priority" ns3:code="1" /> </ns4:mmt> <ns4:event> <ns4:effectCode ns4:table="tec001_EffectCode" ns4:code="3" />
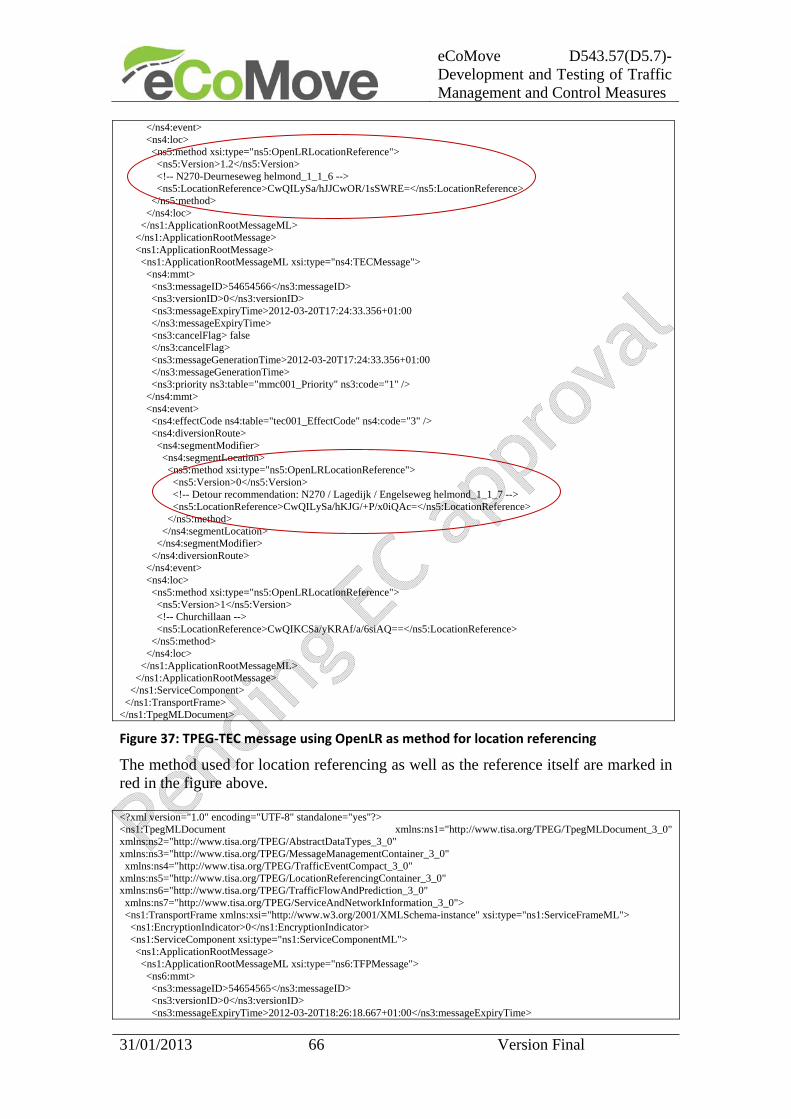
eCoMove D543.57(D5.7)- Development and Testing of Traffic Management and Control Measures
31/01/2013 66 Version Final
</ns4:event> <ns4:loc> <ns5:method xsi:type="ns5:OpenLRLocationReference"> <ns5:Version>1.2</ns5:Version> <!-- N270-Deurneseweg helmond_1_1_6 --> <ns5:LocationReference>CwQILySa/hJJCwOR/1sSWRE=</ns5:LocationReference> </ns5:method> </ns4:loc> </ns1:ApplicationRootMessageML> </ns1:ApplicationRootMessage> <ns1:ApplicationRootMessage> <ns1:ApplicationRootMessageML xsi:type="ns4:TECMessage"> <ns4:mmt> <ns3:messageID>54654566</ns3:messageID> <ns3:versionID>0</ns3:versionID> <ns3:messageExpiryTime>2012-03-20T17:24:33.356+01:00 </ns3:messageExpiryTime> <ns3:cancelFlag> false </ns3:cancelFlag> <ns3:messageGenerationTime>2012-03-20T17:24:33.356+01:00 </ns3:messageGenerationTime> <ns3:priority ns3:table="mmc001_Priority" ns3:code="1" /> </ns4:mmt> <ns4:event> <ns4:effectCode ns4:table="tec001_EffectCode" ns4:code="3" /> <ns4:diversionRoute> <ns4:segmentModifier> <ns4:segmentLocation> <ns5:method xsi:type="ns5:OpenLRLocationReference"> <ns5:Version>0</ns5:Version> <!-- Detour recommendation: N270 / Lagedijk / Engelseweg helmond_1_1_7 --> <ns5:LocationReference>CwQILySa/hKJG/+P/x0iQAc=</ns5:LocationReference> </ns5:method> </ns4:segmentLocation> </ns4:segmentModifier> </ns4:diversionRoute> </ns4:event> <ns4:loc> <ns5:method xsi:type="ns5:OpenLRLocationReference"> <ns5:Version>1</ns5:Version> <!-- Churchillaan --> <ns5:LocationReference>CwQIKCSa/yKRAf/a/6siAQ==</ns5:LocationReference> </ns5:method> </ns4:loc> </ns1:ApplicationRootMessageML> </ns1:ApplicationRootMessage> </ns1:ServiceComponent> </ns1:TransportFrame> </ns1:TpegMLDocument>
Figure 37: TPEG‐TEC message using OpenLR as method for location referencing
The method used for location referencing as well as the reference itself are marked in red in the figure above. <?xml version="1.0" encoding="UTF-8" standalone="yes"?> <ns1:TpegMLDocument xmlns:ns1="http://www.tisa.org/TPEG/TpegMLDocument_3_0" xmlns:ns2="http://www.tisa.org/TPEG/AbstractDataTypes_3_0" xmlns:ns3="http://www.tisa.org/TPEG/MessageManagementContainer_3_0" xmlns:ns4="http://www.tisa.org/TPEG/TrafficEventCompact_3_0" xmlns:ns5="http://www.tisa.org/TPEG/LocationReferencingContainer_3_0" xmlns:ns6="http://www.tisa.org/TPEG/TrafficFlowAndPrediction_3_0" xmlns:ns7="http://www.tisa.org/TPEG/ServiceAndNetworkInformation_3_0"> <ns1:TransportFrame xmlns:xsi="http://www.w3.org/2001/XMLSchema-instance" xsi:type="ns1:ServiceFrameML"> <ns1:EncryptionIndicator>0</ns1:EncryptionIndicator> <ns1:ServiceComponent xsi:type="ns1:ServiceComponentML"> <ns1:ApplicationRootMessage> <ns1:ApplicationRootMessageML xsi:type="ns6:TFPMessage"> <ns6:mmt> <ns3:messageID>54654565</ns3:messageID> <ns3:versionID>0</ns3:versionID> <ns3:messageExpiryTime>2012-03-20T18:26:18.667+01:00</ns3:messageExpiryTime>

eCoMove D543.57(D5.7)- Development and Testing of Traffic Management and Control Measures
31/01/2013 67 Version Final
<ns3:cancelFlag>false</ns3:cancelFlag> <ns3:messageGenerationTime>2012-03-20T18:26:18.667+01:00</ns3:messageGenerationTime> <ns3:priority ns3:table="mmc001_Priority" ns3:code="1" /> </ns6:mmt> <ns6:method xsi:type="ns6:FlowStatus"> <ns6:status> <ns6:freeFlowTravelTime>80</ns6:freeFlowTravelTime> <ns6:delay>160</ns6:delay> </ns6:status> </ns6:method> <ns6:loc> <ns5:method xsi:type="ns5:AgoraCLocationReference"> <ns5:Version>1</ns5:Version> <!-- Munich, Bavaria, A8 --> <ns5:LocationReference>ATwBMAA4AiAGBBQThCwIHbwiRWlfSADNQAABAQJBOAQIB9EIAQBfWBEECQjISAMK/gFfYAQIB5EMAABfYFA=</ns5:LocationReference> </ns5:method> </ns6:loc> </ns1:ApplicationRootMessageML> </ns1:ApplicationRootMessage> </ns1:ServiceComponent> </ns1:TransportFrame> </ns1:TpegMLDocument>
Figure 38: TPEG‐TFP message using AGORA‐C as method for location referencing
The method used for location referencing as well as the reference itself are marked in red in the figure above. It can be concluded, that it the main requirements SP5.14.0094 and SP5.14.0096 were successfully verified. 5.10.2 Verification Test 2: Vehicles, fleet operators and navigation service provider
can request tailored ecoMessages from the infrastructure service provider
Reference to main requirements: SP5.14.0092, SP5.14.0093 To verify these requirements ecoATS offers a service where the above mentioned eCoMove user can request traffic incident information including detour recommendations from the strategic traffic management as TPEG-TEC messages, traffic state and prediction information as TPEG-TFP messages and parking information as TPEG-PKI messages. The following procedure was performed using a standard web browser offering a developer tool for interacting with web services and other web resources that supports sending HTTP requests, setting the entity body, and content type. Thus supporting interaction with web services and inspecting the results.
1. Following the documentation of the ecoATS service a session was initiated
providing configuration parameters as (a) required method for location
referencing (marked in red) and (b) required TPEG application (marked in
green). Additional parameters are provided as well.

eCoMove D543.57(D5.7)- Development and Testing of Traffic Management and Control Measures
31/01/2013 68 Version Final
Figure 39: post init request to ecoATS service
2. The response of the ecoATS service provides a session Id for further use
(marked in red)
Figure 40: receive session id from ecoATS service
3. Get message request send to ecoATS asking for the delivery or an update of
the requested TPEG applications providing the current position of the
requesting vehicle (marked in red).
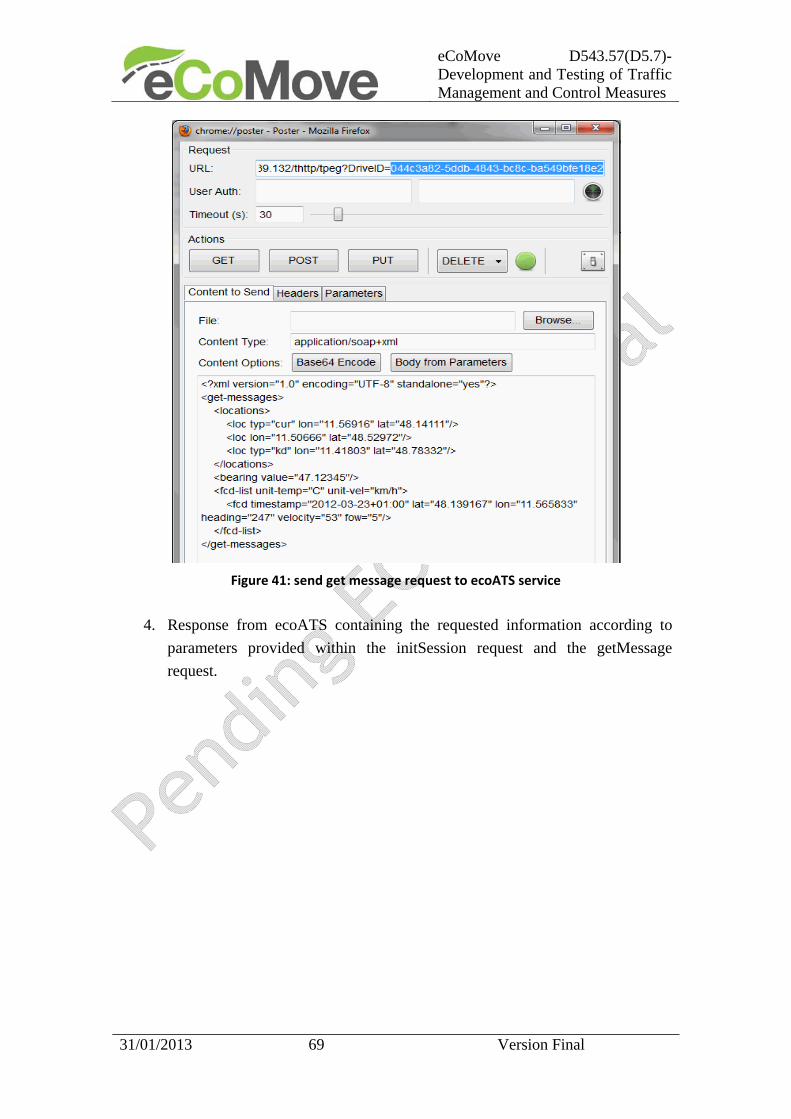
eCoMove D543.57(D5.7)- Development and Testing of Traffic Management and Control Measures
31/01/2013 69 Version Final
Figure 41: send get message request to ecoATS service
4. Response from ecoATS containing the requested information according to
parameters provided within the initSession request and the getMessage
request.
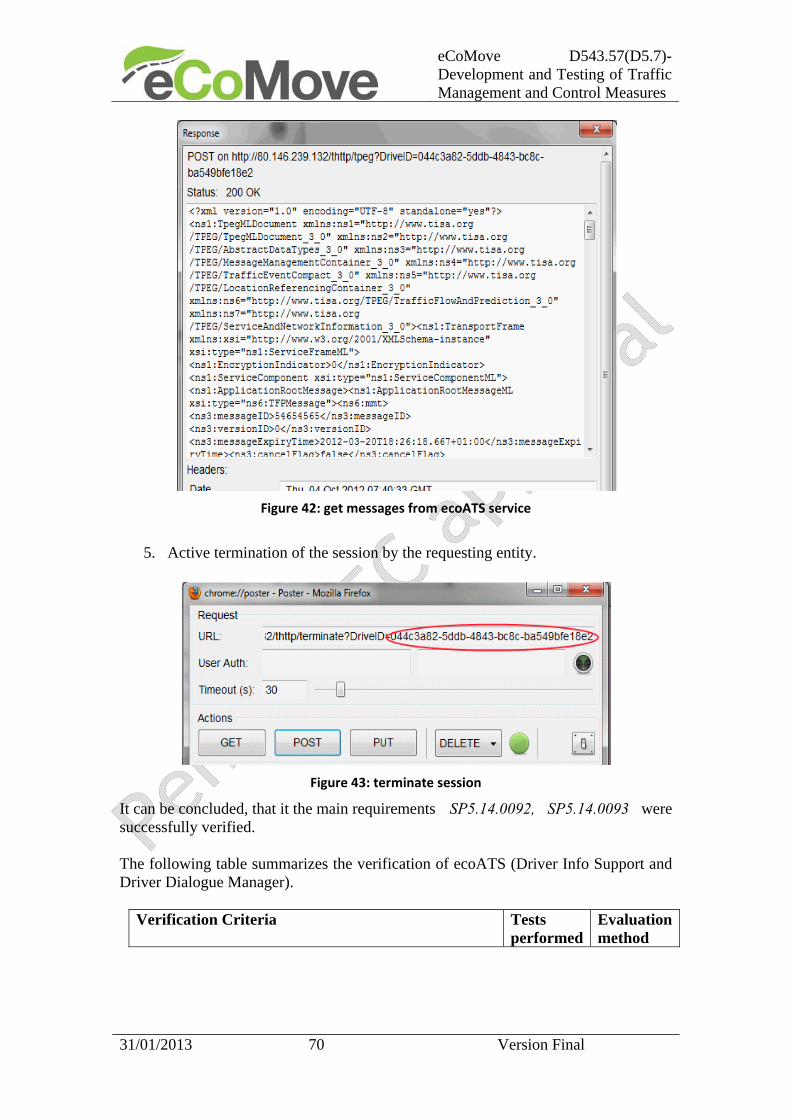
eCoMove D543.57(D5.7)- Development and Testing of Traffic Management and Control Measures
31/01/2013 70 Version Final
Figure 42: get messages from ecoATS service
5. Active termination of the session by the requesting entity.
Figure 43: terminate session
It can be concluded, that it the main requirements SP5.14.0092, SP5.14.0093 were successfully verified. The following table summarizes the verification of ecoATS (Driver Info Support and Driver Dialogue Manager).
Verification Criteria Tests performed
Evaluation method

eCoMove D543.57(D5.7)- Development and Testing of Traffic Management and Control Measures
31/01/2013 71 Version Final
Compare logs from ecoMap showing traffic state with TPEG TFP
Not ready yet
Visual analysis of ecoMap data and TFP messages
Compare logs from ecoMap showing traffic state forecast with TPEG TFP
Not ready yet
Visual analysis of ecoMap data and TFP messages
Visual analysis. Comparing Strategy editor with TPEG TEC message
Not ready yet
Visual analysis of strategies and events defined and resulting TEC message
Show existing interface to ecoATS and messages provided on request
X
Interface ecoATS service using a “poster” tool for interacting with web services and other web resources
Visual analysis of AGORA-C and OpenLR locations X
Location exchange with partners and visual comparison of results from location decoding
Show TPEG message in XML format using location references AGORA-C and OpenLR
X Visual analysis of messages
It can be concluded, that the ecoATS service is able to provide the information requested by ecoNavigation or fleet operators in a map independent way. As the integration with the ecoMap as well as the editor for defining ecoStrategies are not realised yet further integration tests need to be done. 5.11 Verification overview for ecoApproach Advice The main functionality of the ecoApproach Advice to be verified in the simulation environment is the following:
- Calculate time slots and lane advice for eCoMove vehicles approaching an
intersection
Reference to main requirements: SP5.11.35, SP5.11.37, SP5.11.38 Reference to test sites: Simulation environment Munich Reference to verification phases: alpha Reference to test cases (below): 1

eCoMove D543.57(D5.7)- Development and Testing of Traffic Management and Control Measures
31/01/2013 72 Version Final
References of the verification tests for the component ecoApproach Advice to other chapters and deliverables:
- The functional description of the component can be found in chapter 3.9 of
deliverable D5.6.
- The description of interfaces, parameters and test setups can be found in
chapter 4.9 and 5.9 of deliverable D5.6, and chapter 6.11 of this deliverable.
The individual benefit of the ecoApproach Advice is a speed advice. If the driver follows this speed, he or she will reach the next intersection during the green time. The overall benefit is optimising traffic throughput by forming platoons at the signalized intersections.
To shape the platoons, vehicles crossing the stop line of the upstream traffic light at the beginning of the green time will get a lower speed than vehicles at the end of the green time. Following the speed advice they arrive at the next intersection one after another in a platoon at beginning of the green time. The platoon shaping approach is presented in Figure 44. As can be seen in the figure the vehicles cross the first stop line at time ti in arbitrary distances. Then they get different speed advices at time ti+1. The first vehicle gets the slowest speed. The two following vehicles get a higher speed advice and the last vehicle gets the highest speed advice. At time ti+2 all vehicles arrive at the next intersection in a platoon.
Figure 44: Platoon shaping with the approach advice system. The brighter the colour, the
higher the advised speed, vopt.
Within the simulation environment the verification procedure proves the proper calculation of time slots and lane advices for eCoMove vehicles approaching an intersection. In addition it will be verified if platoons are formed in case of high penetration rates.
5.11.1 Verification Test 1: Calculate time slots and lane advice for eCoMove
vehicles approaching an intersection
Reference to main requirements: SP5.11.35, SP5.11.37, SP5.11.38 Reference to verification phases: alpha
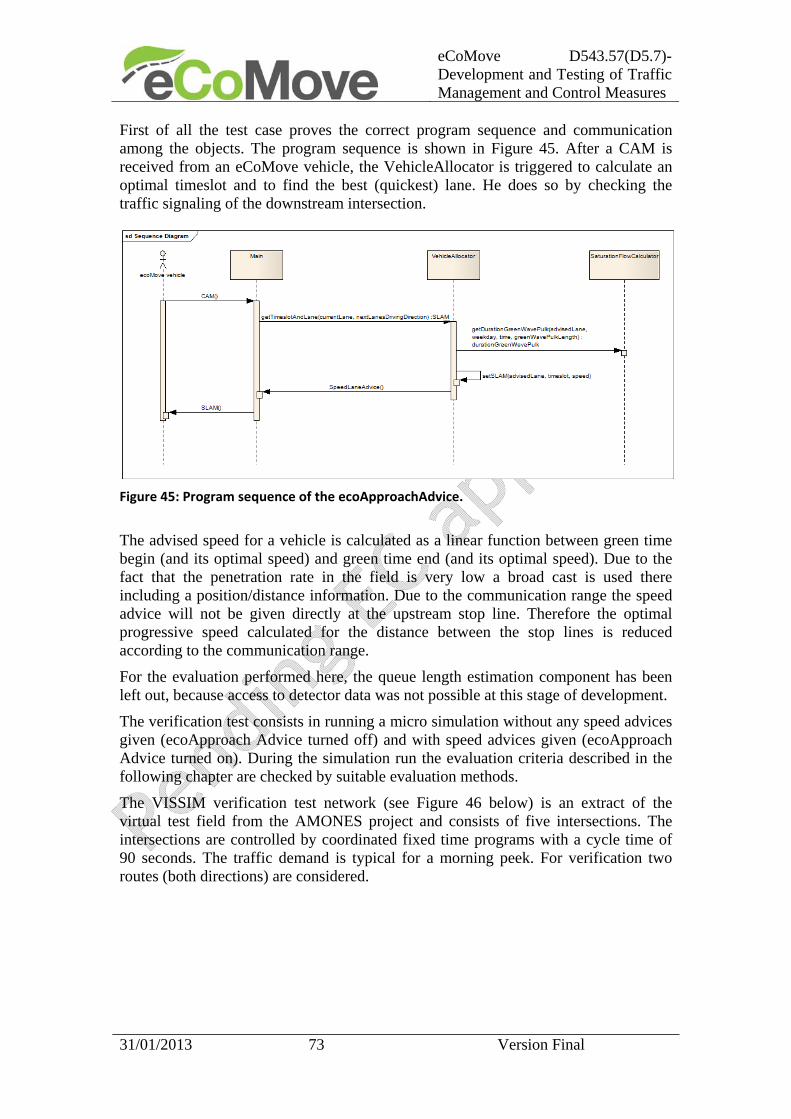
eCoMove D543.57(D5.7)- Development and Testing of Traffic Management and Control Measures
31/01/2013 73 Version Final
First of all the test case proves the correct program sequence and communication among the objects. The program sequence is shown in Figure 45. After a CAM is received from an eCoMove vehicle, the VehicleAllocator is triggered to calculate an optimal timeslot and to find the best (quickest) lane. He does so by checking the traffic signaling of the downstream intersection.
Figure 45: Program sequence of the ecoApproachAdvice.
The advised speed for a vehicle is calculated as a linear function between green time begin (and its optimal speed) and green time end (and its optimal speed). Due to the fact that the penetration rate in the field is very low a broad cast is used there including a position/distance information. Due to the communication range the speed advice will not be given directly at the upstream stop line. Therefore the optimal progressive speed calculated for the distance between the stop lines is reduced according to the communication range.
For the evaluation performed here, the queue length estimation component has been left out, because access to detector data was not possible at this stage of development.
The verification test consists in running a micro simulation without any speed advices given (ecoApproach Advice turned off) and with speed advices given (ecoApproach Advice turned on). During the simulation run the evaluation criteria described in the following chapter are checked by suitable evaluation methods.
The VISSIM verification test network (see Figure 46 below) is an extract of the virtual test field from the AMONES project and consists of five intersections. The intersections are controlled by coordinated fixed time programs with a cycle time of 90 seconds. The traffic demand is typical for a morning peek. For verification two routes (both directions) are considered.

eCoMove D543.57(D5.7)- Development and Testing of Traffic Management and Control Measures
31/01/2013 74 Version Final
Figure 46: Verification test network with distances between inersections in meter.
5.11.1.1 Evaluation of verification Test Case 1
The evaluation criteria described in chapter 5.9.2.5 of deliverable D5.6 are tested using different evaluation methods. Two of the criteria could not be tested entirely because the queue length estimation component has been left out as mentioned earlier. An overview, which tests have been performed how is given in the following table:
Evaluation Criteria Tests performed
Evaluation method
Calculated time slot during the green phase is free (not occupied by queued vehicles).
(X) visual analysis
Lane advised is in the direction of travel. X VISSIM constraint
Lane advised has smaller queues than other lanes going in the same direction.
Speed advice complies with the local (speed) regulations. X unit tests
Formation of platoons in case of a high penetration rate, i.e. consecutive arrival at the stop line.
X visual analysis
The criteria “Calculated time slot during the green phase is free (not occupied by queued vehicles)” could be tested partly. Meaning it could be proven by visual analysis that the advised vehicles mainly arrive during the green phase. But as queued vehicles are not considered so far, there were cases, where vehicles arrive during the beginning of the green phase, when queued vehicles had not yet departed. This will be improved during further development.
The criteria “Lane advised is in the direction of travel” could be easily tested, because the ecoApproach Advice does not change the routes of the vehicles and it is a VISSIM constraint that vehicles follow their predefined routes until they reach their destination.
The criteria “Speed advice complies with the local (speed) regulations” has been guaranteed by using an unit test, which checks if the calculated speed is the same or smaller than the maximum allowed speed.
The criteria “Formation of platoons in case of a high penetration rate, i.e. consecutive arrival at the stop line” could be evaluated visually by watching the simulation run. It could be seen that platoons have been formed when running a simulation with a high penetration rate.
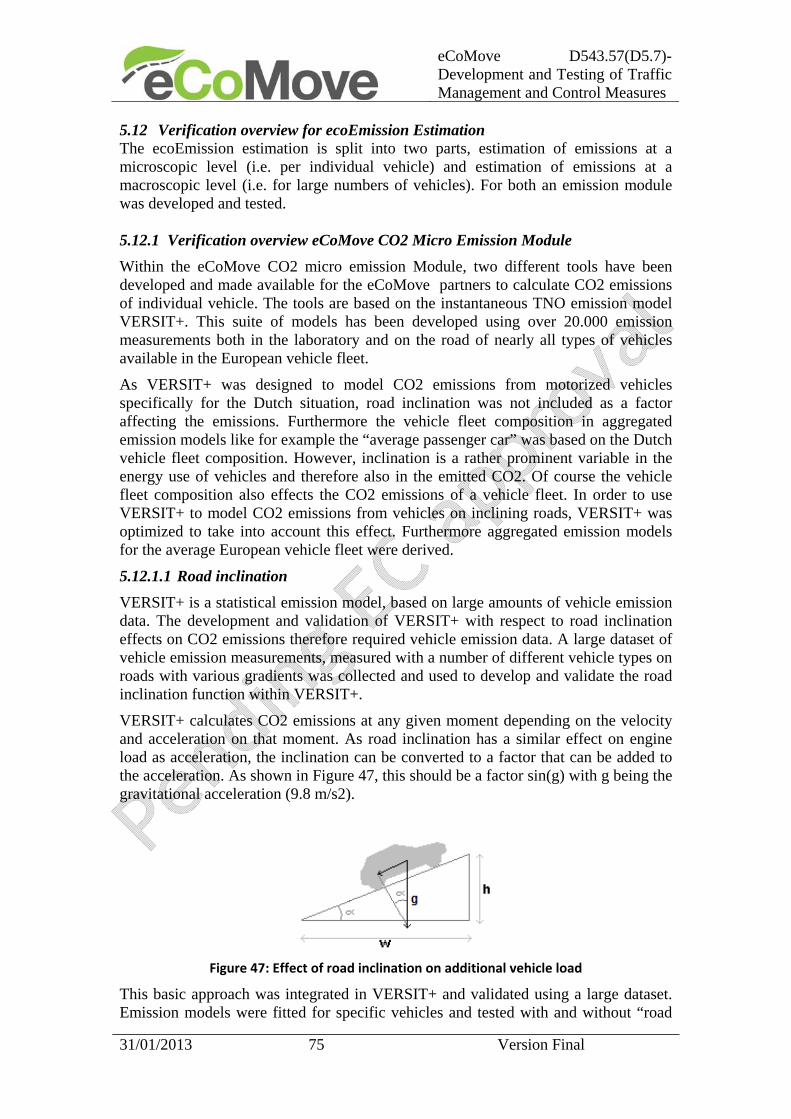
eCoMove D543.57(D5.7)- Development and Testing of Traffic Management and Control Measures
31/01/2013 75 Version Final
5.12 Verification overview for ecoEmission Estimation The ecoEmission estimation is split into two parts, estimation of emissions at a microscopic level (i.e. per individual vehicle) and estimation of emissions at a macroscopic level (i.e. for large numbers of vehicles). For both an emission module was developed and tested. 5.12.1 Verification overview eCoMove CO2 Micro Emission Module
Within the eCoMove CO2 micro emission Module, two different tools have been developed and made available for the eCoMove partners to calculate CO2 emissions of individual vehicle. The tools are based on the instantaneous TNO emission model VERSIT+. This suite of models has been developed using over 20.000 emission measurements both in the laboratory and on the road of nearly all types of vehicles available in the European vehicle fleet.
As VERSIT+ was designed to model CO2 emissions from motorized vehicles specifically for the Dutch situation, road inclination was not included as a factor affecting the emissions. Furthermore the vehicle fleet composition in aggregated emission models like for example the “average passenger car” was based on the Dutch vehicle fleet composition. However, inclination is a rather prominent variable in the energy use of vehicles and therefore also in the emitted CO2. Of course the vehicle fleet composition also effects the CO2 emissions of a vehicle fleet. In order to use VERSIT+ to model CO2 emissions from vehicles on inclining roads, VERSIT+ was optimized to take into account this effect. Furthermore aggregated emission models for the average European vehicle fleet were derived.
5.12.1.1 Road inclination
VERSIT+ is a statistical emission model, based on large amounts of vehicle emission data. The development and validation of VERSIT+ with respect to road inclination effects on CO2 emissions therefore required vehicle emission data. A large dataset of vehicle emission measurements, measured with a number of different vehicle types on roads with various gradients was collected and used to develop and validate the road inclination function within VERSIT+.
VERSIT+ calculates CO2 emissions at any given moment depending on the velocity and acceleration on that moment. As road inclination has a similar effect on engine load as acceleration, the inclination can be converted to a factor that can be added to the acceleration. As shown in Figure 47, this should be a factor sin(g) with g being the gravitational acceleration (9.8 m/s2).
Figure 47: Effect of road inclination on additional vehicle load
This basic approach was integrated in VERSIT+ and validated using a large dataset. Emission models were fitted for specific vehicles and tested with and without “road
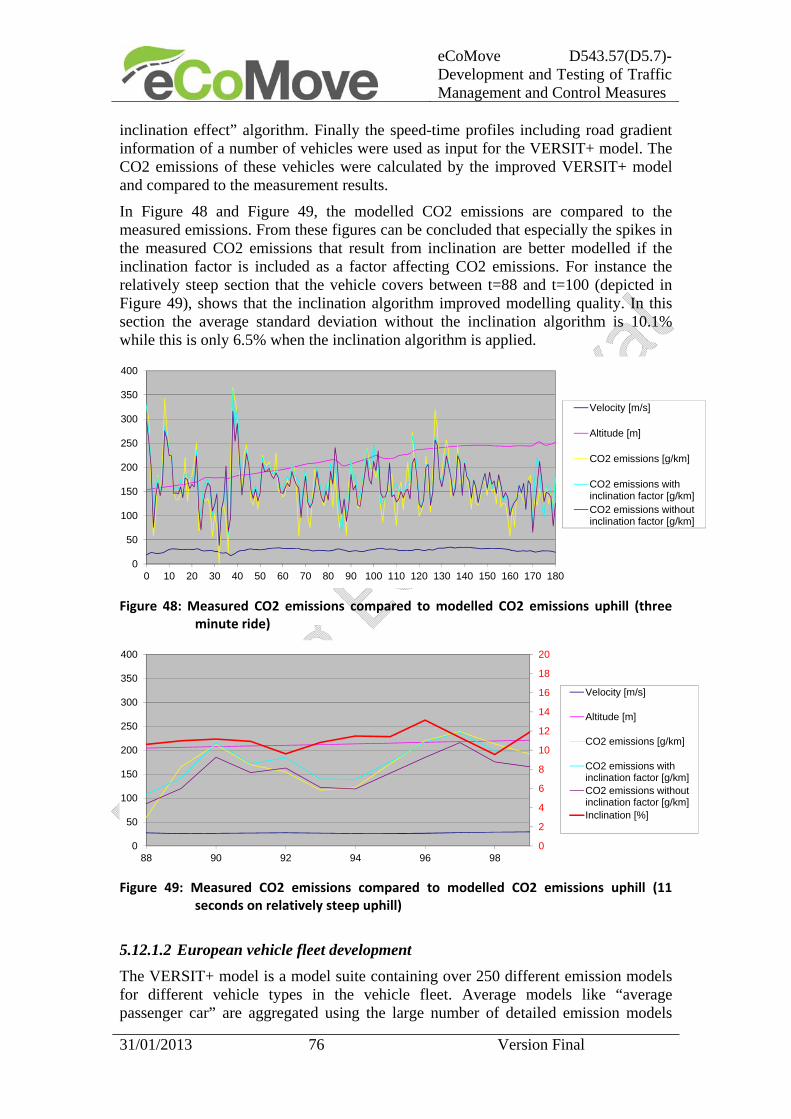
eCoMove D543.57(D5.7)- Development and Testing of Traffic Management and Control Measures
31/01/2013 76 Version Final
inclination effect” algorithm. Finally the speed-time profiles including road gradient information of a number of vehicles were used as input for the VERSIT+ model. The CO2 emissions of these vehicles were calculated by the improved VERSIT+ model and compared to the measurement results.
In Figure 48 and Figure 49, the modelled CO2 emissions are compared to the measured emissions. From these figures can be concluded that especially the spikes in the measured CO2 emissions that result from inclination are better modelled if the inclination factor is included as a factor affecting CO2 emissions. For instance the relatively steep section that the vehicle covers between t=88 and t=100 (depicted in Figure 49), shows that the inclination algorithm improved modelling quality. In this section the average standard deviation without the inclination algorithm is 10.1% while this is only 6.5% when the inclination algorithm is applied.
Figure 48: Measured CO2 emissions compared to modelled CO2 emissions uphill (three
minute ride)
Figure 49: Measured CO2 emissions compared to modelled CO2 emissions uphill (11
seconds on relatively steep uphill)
5.12.1.2 European vehicle fleet development
The VERSIT+ model is a model suite containing over 250 different emission models for different vehicle types in the vehicle fleet. Average models like “average passenger car” are aggregated using the large number of detailed emission models
0
50
100
150
200
250
300
350
400
0 10 20 30 40 50 60 70 80 90 100 110 120 130 140 150 160 170 180
Velocity [m/s]
Altitude [m]
CO2 emissions [g/km]
CO2 emissions withinclination factor [g/km]CO2 emissions withoutinclination factor [g/km]
0
2
4
6
8
10
12
14
16
18
20
0
50
100
150
200
250
300
350
400
88 90 92 94 96 98
Velocity [m/s]
Altitude [m]
CO2 emissions [g/km]
CO2 emissions withinclination factor [g/km]CO2 emissions withoutinclination factor [g/km]Inclination [%]

eCoMove D543.57(D5.7)- Development and Testing of Traffic Management and Control Measures
31/01/2013 77 Version Final
within this general class and information concerning number of vehicle kilometres travelled by the various different vehicle classes. An example of a detailed vehicle class is for example: passenger car, diesel fuel, Euro 4, soot filter, medium weight class. The existing aggregated models are based on the Dutch vehicle fleet composition. The vehicle fleet composition in the Netherlands does not match the average European fleet composition. In the Netherlands the share of diesel vehicle is for instance lower than in the average European vehicle fleet. As eCoMove partners are located in many different countries in Europe, it was decided to develop aggregated models based on the average European vehicle fleet. The model Tremove was used as reference for the average European fleet composition numbers. These Tremove data together with the VERSIT+ model suite was used to derive aggregated VERSIT+ models for the European vehicle fleet.
The results were validated by calculating average vehicle emissions for different speed time profiles using both the average Dutch and average European models. The results of the average European models were compared to the average Dutch models. The emissions of the average European models did differ from the Dutch models and could be explained by the differences in fleet composition. The European fleet model for instance predicts higher NOx emissions which can be explained by the higher share of diesel vehicles in the European fleet.
5.12.1.3 EnViVer
Both the road inclination algorithm and European vehicle fleet model are integrated and validated in the software tool EnViVer. EnViVer is a software model which is based on aggregated VERSIT+ models and is able to calculated vehicle emissions for individual vehicles. EnViVer is specifically developed as an user friendly tool to calculate vehicle emissions for traffic micro simulations. EnViVer requires all speed time profiles of each single vehicle in a traffic micro simulation (VISSIM or similar). These speed time profiles together with road inclination information are used to calculate the vehicle emissions of all vehicles in the traffic simulation.
A large number of speed-time-road inclinations profiles are imported in EnViVer and compared to the original VERSIT+ models and to the recorded real world emission measurements. The comparison of the results did show that both road inclination and the European vehicle were integrated in EnViVer successfully.
EnViVer has been distributed to a number of eCoMove partners and is also used by TNO within the eCoMove project.
5.12.1.4 VERSIT+ Command line version
A second tool developed for the eCoMove project is the command line version of aggregated VERSIT+ models. Basically this module contains the aggregated models as integrated in the EnViVer tool.
Purpose of the command line version is automatic data processing. The VERSIT+ command line module can be integrated in other software to calculate vehicle emissions based on speed time road inclination information. In this way, no manual interference is required to link speed-time-inclination information of individual vehicles to specific VERSIT+ emission models and to calculate vehicle emissions.
The Command line version of VERSIT+ contains the emission models as developed for EnViVer. The module was tested by calculating vehicle emissions for a various

eCoMove D543.57(D5.7)- Development and Testing of Traffic Management and Control Measures
31/01/2013 78 Version Final
number of speed-time-road inclination profiles. The same calculations were performed using both VERSIT+ and EnViVer. The results were validated, showing no differences between the calculated emission results.
5.12.2 Verification overview eCoMove CO2 Macro Emission Module
VISSIM traffic micro simulations of specific network components, such as roundabouts and other intersections, together with VERSIT+ CO2 emission calculations for all simulated vehicles in these components have formed the basis for deriving macroscopic CO2 emission relations between a macroscopic traffic parameter as mean vehicle speed and the mean CO2 emission rate per vehicle. These macroscopic relations are then used to calculate CO2 emission rates for meso/macro traffic simulations from DynaSmart.
5.12.2.1 Traffic micro simulations of specific network components
In order to be able to calculate emissions for urban situations and for different routes, e.g. for eco-routing applications, it was desirable to develop an emission module which distinguishes between different intersection types. Therefore the following specific network components or infrastructure types were taken into account so far:
- Single lane roundabout, speed limit 50 km/h
- Dual lane roundabout, speed limit 80 km/h
- Uncontrolled intersection, speed limit 50 km/h
- Controlled intersection, speed limit 50 km/h
- Straight urban road section, single lane, speed limit 10-80 km/h
- Straight motorway section, two lanes, speed limit 100-120 km/h
With VISSIM many micro simulations for various traffic intensity situations, e.g. ‘low’, ‘medium’ and ‘high’ intensity traffic (resp. 400, 700 and 1100 vehicles/hour), and for various traffic compositions, e.g. ‘low’, ‘medium’ and ‘high’ truck (resp. 2, 5 and 10 % trucks of all vehicles), were performed for these network components and exported to fzp-files. For simplicity, the simulated traffic consisted of only two vehicle types, i.e. an ‘average European’ car and an ‘average European’ truck. In order to reach statistical significance, i.e. reducing the effects of stochasticity, for each combination of network component, traffic intensity and composition three simulations were done of 30 minutes each, so one and a half hours in total for each combination.
5.12.2.2 VERSIT+ simulations of CO2 emission in specific network components
Next, using the speed time profiles of all simulated vehicles and VERSIT+ the CO2 emissions of each individual vehicle in the specific combination of network component and traffic regime were calculated. This data was then used to identify and derive relations between macroscopic traffic parameters and CO2 emissions.
Examples of the vehicle ride information of individual vehicles thus simulated with VISSIM/VERSIT+ are given in Figure 50 and Figure 51.
5.12.2.3 Approach to derive macroscopic CO2 emission relations and first verification
Data Aggregation

eCoMove D543.57(D5.7)- Development and Testing of Traffic Management and Control Measures
31/01/2013 79 Version Final
The data from large numbers of simulated vehicle rides for a specific traffic composition, e.g. ‘high’ or 10 % trucks, and various traffic intensities in a specific network component can be aggregated in many ways in order to try to identify and derive a suitable relationship between the macroscopic CO2 emission and macroscopic traffic parameters such as the mean vehicle speed. After quite a bit of trial and error it appeared that the most suitable, i.e. the most clear, consequent and unambiguous, relationship could be identified for the mean CO2 emission rate ERm per vehicle (either ‘car’ or ‘truck’) for a specific length of time as a function of the mean vehicle speed Vm in the entire (simulated) network component, i.e. ERm(Vm|Tav) or for short ERm(Vm).
Graphical examples of such aggregation and the associated calculations are given in Figure 52 and Figure 53 for cars and trucks respectively on a single lane roundabout.
One Second Averages The upper graphs of Figure 52 and Figure 53 show the mean vehicle emission rate ERm as a function of the mean vehicle speed Vm averaged per second over the entire roundabout. So each coloured circle, i.e. each of the almost 9000 data points per colour or traffic intensity regime (equivalent to a total simulation time of one and a half hour), represents a one second averaged mean emission rate and mean speed for all cars (Figure 52) or all trucks (Figure 53) on the roundabout. The green circles are for low traffic intensity, the blue ones for medium and the red ones are for high traffic intensity. As to be expected, the mean vehicle speeds tend to increase for decreasing traffic intensity as do the mean emission rates as the emission rate is usually roughly proportional to vehicle speed. To further illustrate the latter, the zero acceleration (a=0) emission rate as a function of speed for the average car as well as for the average truck has also been calculated with VERSIT+ and plotted in Figure 52 and Figure 53. These are the two coloured curves, the lower cyan coloured curve is ER(V|a=0) for the average car and the higher magenta coloured curve is ER(V|a=0) for the average truck. The somewhat strange discontinuities in the curves around 5 km/h are caused by the coarse modelling of the stationary emissions which as a consequence extends from zero to 5 km/h. As the vehicle CO2 emission rate is not only dependent on the vehicle speed but also highly dependent on the vehicle acceleration, where roughly the emission rate increases with increasing dynamics, the cyan and magenta curves can be viewed as a ‘soft’ lower boundaries in vehicle emission rate. With ‘soft’ is meant that, depending on the averaging time chosen and the particular dynamics during that time, the average emission rate can occasionally be lower than the lower boundary but is usually higher. And indeed, in Figure 52 (upper graph) for cars most of the coloured circles seem to lie well above the cyan curve, whereas in Figure 53 (upper graph) for trucks most of the coloured circles seem to lie above the magenta curve.
Ten Minute Averages The lower graphs in Figure 52Figure 52 and Figure 53 use a longer averaging times of ten minutes as opposed to the one second averaging time used in the upper graphs. So the lower graphs in Figure 52 and Figure 53 are similar to the upper graphs in Figure 52 and Figure 53 except that the coloured circles now each represent an averaging time of ten minutes and as a result the number of data points has been dramatically reduced by a factor of 600 from about 9000 to 15 per colour or traffic intensity regime.
eCoMove D543.57(D5.7)- Development and Testing of Traffic Management and Control Measures
31/01/2013 80 Version Final
Macroscopic Emission Relations and First Verifications Also shown in both the upper and the lower graphs are polynomial curves fitted to all data points, i.e. the black curves and also printed as a polynomial in the upper left corner (y = a2x2 + a1x + a0). These are estimations of the sought macroscopic relations between ERm and Vm. Using these polynomial fits a first verification can be performed by comparing the total emission with the macroscopically estimated total emission for each set of simulations. Here, the total emission is calculated by summing the mean emission rates, as calculated directly from the simulations and plotted in the graphs, multiplied by the appropriate vehicle numbers and averaging time. The estimated total emission is calculated similarly but instead of the mean emission rates it uses the estimated mean emissions as calculated from the macroscopic polynomial using (only) the mean speeds of the data points. Both numbers are given in the upper left corner and, comparing the upper with the lower graphs, one may observe that the total emission estimate improves considerably when the averaging time increases from one second to ten minutes.
Size Dependency and Table Lookup Strategy Though the strategy to average over the entire simulated network component, e.g. a single lane roundabout, proved to be crucial to identify and derive macroscopic mean emission rate versus mean speed relationships, it did introduce a scale or size dependency. Obviously, two single lane roundabouts only differing in the length of the roads leading to and from the roundabouts may and will have different mean speeds as well as mean emission rates for the same traffic intensity and composition. This complication was solved by deriving the macro relations for various network component sizes and then define two-dimensional lookup tables, dependent on mean vehicle speed Vm and network component size Sz, for the mean CO2 emission rates ERm from these, i.e. ERm(Vm|Sz), for each particular network component. An example illustrating this approach is given in the two graphs of Figure 54, upper for cars and lower for trucks, for a single lane roundabout with a speed limit of 50 km/h.
5.12.2.4 eCoMove CO2 Macro Emission Module
As every larger traffic network can be thought of as composed of intersections of various kind connected by roads of various kind, the network components as defined before (see section 6.12.2.1) together with the previously sketched macroscopic CO2 emission lookup tables can be used to estimate CO2 emissions from the macro traffic data as simulated for larger traffic networks. To be a little more specific, this can be done quite efficiently for each road section or link in a network by taking into account the two intersection types or nodes at its beginning and end.
For the eCoMove project macro traffic simulations are performed with meso/macro traffic model program DynaSmart. Thus, the eCoMove CO2 Macro Emission Module was designed to interface with DynaSmart and to use the macroscopic CO2 emission lookup table per network component strategy. A first version of this module ‘CO2eCoMove _P’, coded and running in Matlab, has recently been realized and was distributed to one of the eCoMove partners for evaluation.
An example of the CO2 emission data as calculated per link, i.e. a road segment, as a (discrete) function of time with this module CO2eCoMove _P is shown in Figure 55.
5.12.2.5 Verification by comparing emissions for microscopic and macroscopic traffic simulations for similar networks
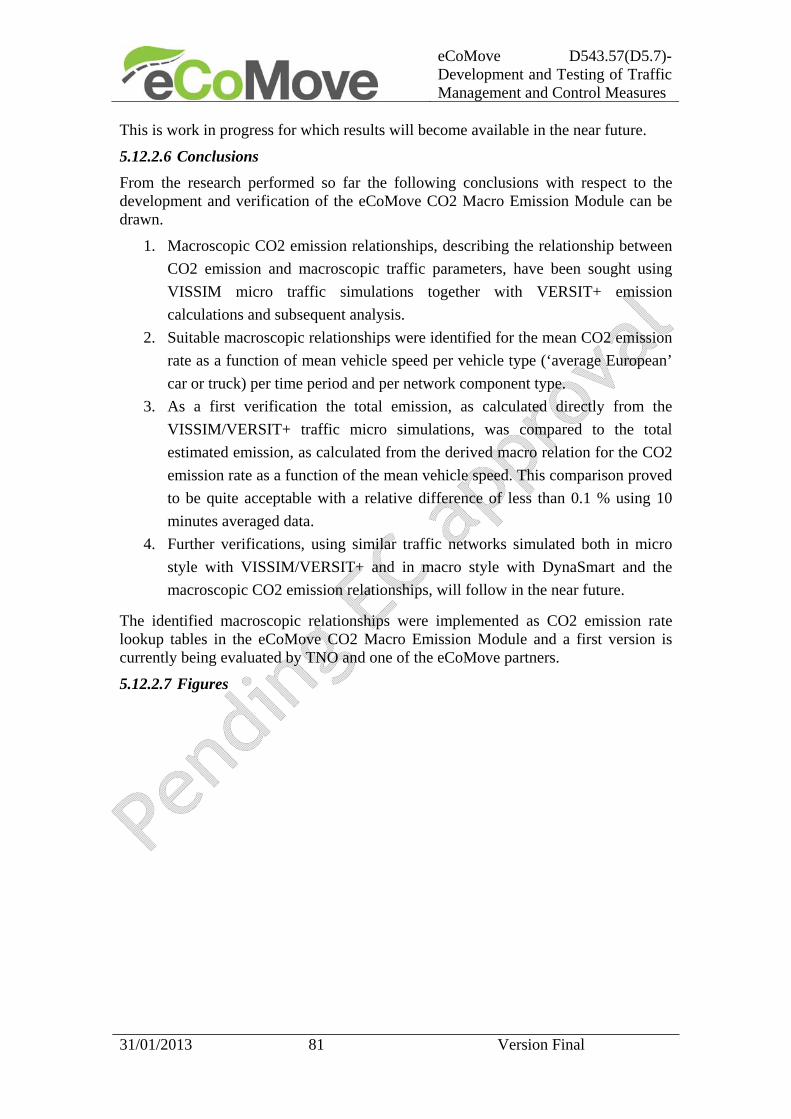
eCoMove D543.57(D5.7)- Development and Testing of Traffic Management and Control Measures
31/01/2013 81 Version Final
This is work in progress for which results will become available in the near future.
5.12.2.6 Conclusions
From the research performed so far the following conclusions with respect to the development and verification of the eCoMove CO2 Macro Emission Module can be drawn.
1. Macroscopic CO2 emission relationships, describing the relationship between
CO2 emission and macroscopic traffic parameters, have been sought using
VISSIM micro traffic simulations together with VERSIT+ emission
calculations and subsequent analysis.
2. Suitable macroscopic relationships were identified for the mean CO2 emission
rate as a function of mean vehicle speed per vehicle type (‘average European’
car or truck) per time period and per network component type.
3. As a first verification the total emission, as calculated directly from the
VISSIM/VERSIT+ traffic micro simulations, was compared to the total
estimated emission, as calculated from the derived macro relation for the CO2
emission rate as a function of the mean vehicle speed. This comparison proved
to be quite acceptable with a relative difference of less than 0.1 % using 10
minutes averaged data.
4. Further verifications, using similar traffic networks simulated both in micro
style with VISSIM/VERSIT+ and in macro style with DynaSmart and the
macroscopic CO2 emission relationships, will follow in the near future.
The identified macroscopic relationships were implemented as CO2 emission rate lookup tables in the eCoMove CO2 Macro Emission Module and a first version is currently being evaluated by TNO and one of the eCoMove partners.
5.12.2.7 Figures
eCoMove D543.57(D5.7)- Development and Testing of Traffic Management and Control Measures
31/01/2013 82 Version Final
Figure 50: Example vehicle ride information for vehicle of type ‘car’ from a combined
VISSIM/VERSIT+ simulation for a single lane roundabout with ‘high traffic’ density (1100 vehicles/hour) and ‘high truck’ traffic (10% trucks).

eCoMove D543.57(D5.7)- Development and Testing of Traffic Management and Control Measures
31/01/2013 83 Version Final
Figure 51: Example vehicle ride information for vehicle of type ‘truck’ from a combined
VISSIM/VERSIT+ simulation for a single lane roundabout with ‘high traffic’ density (1100 vehicles/hour) and ‘high truck’ traffic (10% trucks).
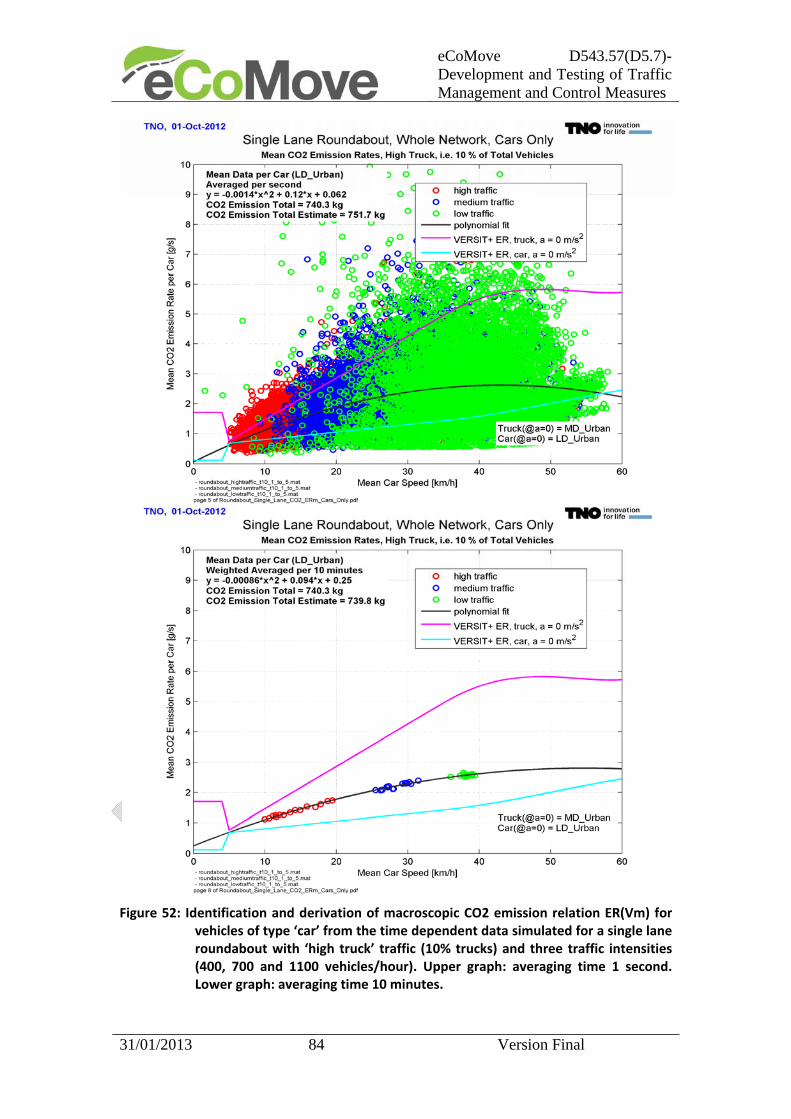
eCoMove D543.57(D5.7)- Development and Testing of Traffic Management and Control Measures
31/01/2013 84 Version Final
Figure 52: Identification and derivation of macroscopic CO2 emission relation ER(Vm) for
vehicles of type ‘car’ from the time dependent data simulated for a single lane roundabout with ‘high truck’ traffic (10% trucks) and three traffic intensities (400, 700 and 1100 vehicles/hour). Upper graph: averaging time 1 second. Lower graph: averaging time 10 minutes.
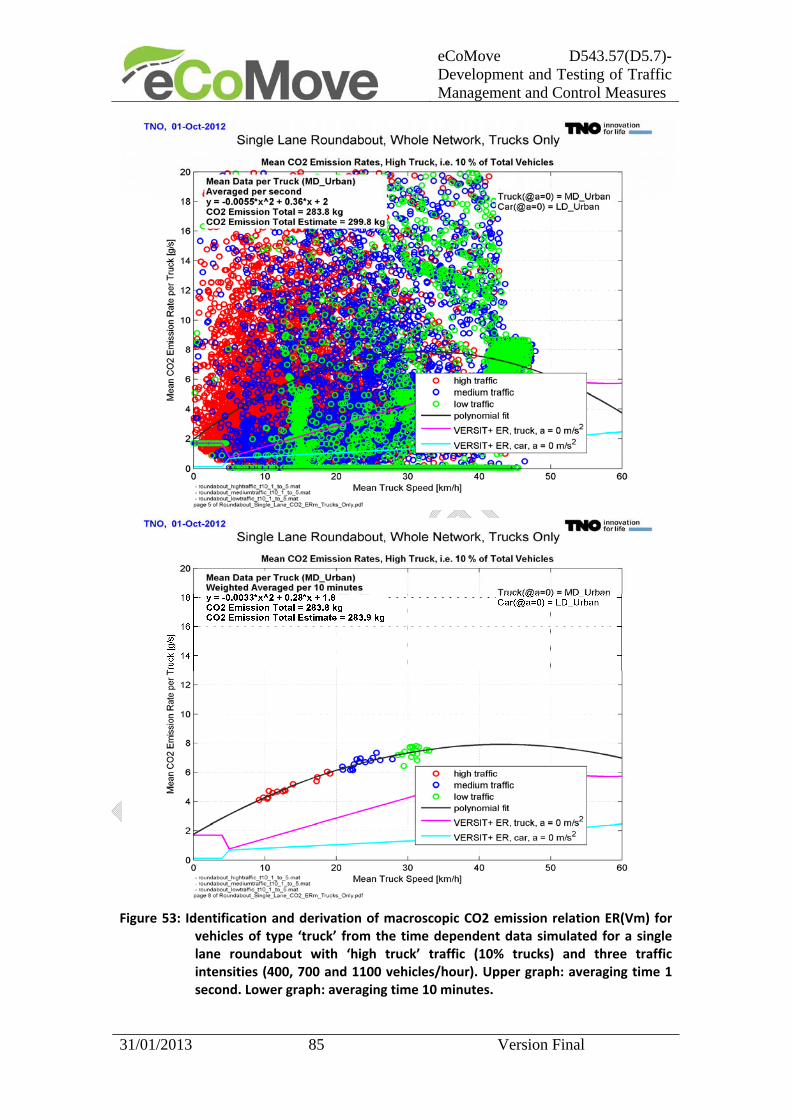
eCoMove D543.57(D5.7)- Development and Testing of Traffic Management and Control Measures
31/01/2013 85 Version Final
Figure 53: Identification and derivation of macroscopic CO2 emission relation ER(Vm) for
vehicles of type ‘truck’ from the time dependent data simulated for a single lane roundabout with ‘high truck’ traffic (10% trucks) and three traffic intensities (400, 700 and 1100 vehicles/hour). Upper graph: averaging time 1 second. Lower graph: averaging time 10 minutes.

eCoMove D543.57(D5.7)- Development and Testing of Traffic Management and Control Measures
31/01/2013 86 Version Final
Figure 54: Macroscopic CO2 emission relation tables ER(Vm|Sz) for vehicles of type ‘car’
(upper graph) and ‘truck’ (lower graph) on a single lane roundabout with a speed limit of 50 km/h.

eCoMove D543.57(D5.7)- Development and Testing of Traffic Management and Control Measures
31/01/2013 87 Version Final
Figure 55: An example of the data as can be calculated with the eCoMove CO2 Macro
Emission Module ‘CO2eCoMove _P’ and extracted and displayed with ‘Get2DPar’: the total CO2 emission per link (X‐axis) per time period as a function of time (Y‐axis).