How Do Traffic Control Measures Affect Vehicle Gas Emissions
DOT HS 811 025 August 2008
Traffic Safety PerformanceMeasures for States and Federal Agencies
This document is available to the public from the National Technical Information Service, Springfield, Virginia 22161
This publication is distributed by the U.S. Department of
Transportation, National Highway Traffic Safety Administration, in the
interest of information exchange. The opinions, findings, and
conclusions expressed in this publication are those of the authors and
not necessarily those of the Department of Transportation or the
National Highway Traffic Safety Administration. The United States
Government assumes no liability for its contents or use thereof. If trade
or manufacturers’ names or products are mentioned, it is because they
are considered essential to the object of the publication and should not
be construed as an endorsement. The United States Government does
not endorse products or manufacturers.
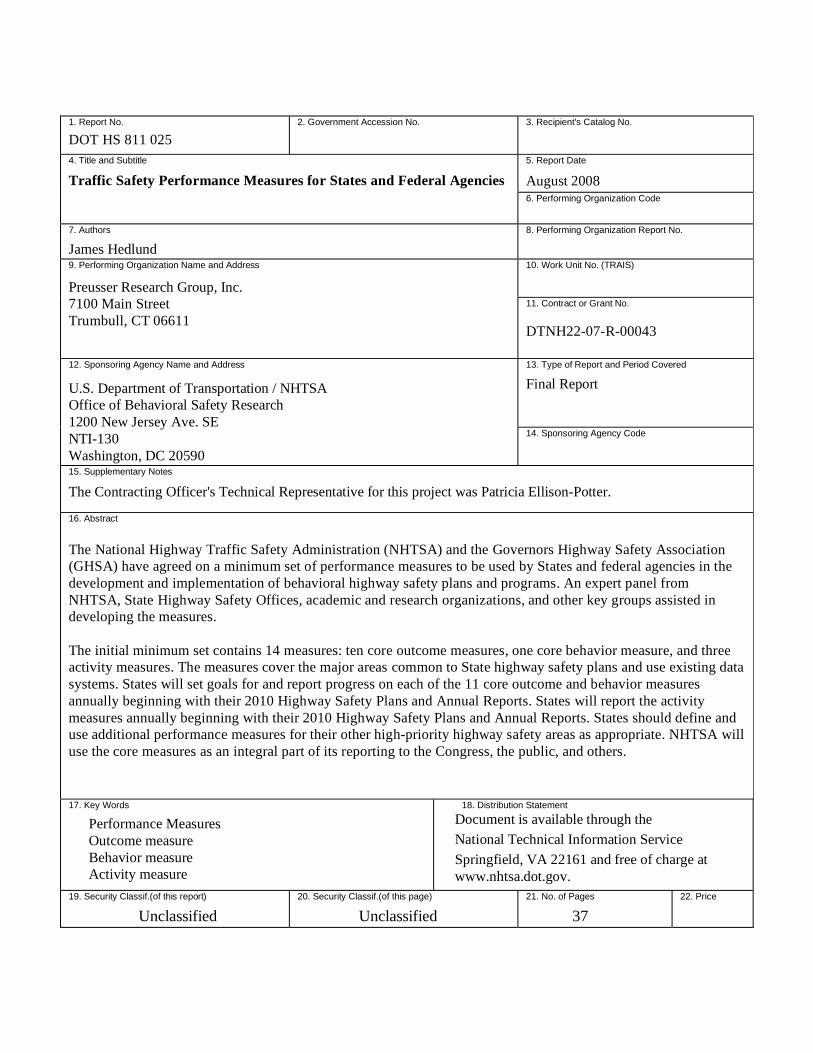
1. Report No.
DOT HS 811 025
2. Government Accession No. 3. Recipient's Catalog No.
4. Title and Subtitle
Traffic Safety Performance Measures for States and Federal Agencies
5. Report Date
August 2008 6. Performing Organization Code
7. Authors
James Hedlund
8. Performing Organization Report No.
9. Performing Organization Name and Address
Preusser Research Group, Inc.
7100 Main Street
Trumbull, CT 06611
10. Work Unit No. (TRAIS)
11. Contract or Grant No.
DTNH22-07-R-00043
12. Sponsoring Agency Name and Address
U.S. Department of Transportation / NHTSA
Office of Behavioral Safety Research
1200 New Jersey Ave. SE
NTI-130
Washington, DC 20590
13. Type of Report and Period Covered
Final Report
14. Sponsoring Agency Code
15. Supplementary Notes
The Contracting Officer's Technical Representative for this project was Patricia Ellison-Potter.
16. Abstract
The National Highway Traffic Safety Administration (NHTSA) and the Governors Highway Safety Association
(GHSA) have agreed on a minimum set of performance measures to be used by States and federal agencies in the
development and implementation of behavioral highway safety plans and programs. An expert panel from
NHTSA, State Highway Safety Offices, academic and research organizations, and other key groups assisted in
developing the measures.
The initial minimum set contains 14 measures: ten core outcome measures, one core behavior measure, and three
activity measures. The measures cover the major areas common to State highway safety plans and use existing data
systems. States will set goals for and report progress on each of the 11 core outcome and behavior measures
annually beginning with their 2010 Highway Safety Plans and Annual Reports. States will report the activity
measures annually beginning with their 2010 Highway Safety Plans and Annual Reports. States should define and
use additional performance measures for their other high-priority highway safety areas as appropriate. NHTSA will
use the core measures as an integral part of its reporting to the Congress, the public, and others.
17. Key Words
Performance Measures
Outcome measure
Behavior measure
Activity measure
18. Distribution Statement
Document is available through the
National Technical Information Service
Springfield, VA 22161 and free of charge at
www.nhtsa.dot.gov.
19. Security Classif.(of this report)
Unclassified
20. Security Classif.(of this page)
Unclassified
21. No. of Pages
37
22. Price
Traffic Safety Performance Measures for States and Federal Agencies
Executive Summary
The National Highway Traffic Safety Administration (NHTSA) and the Governors Highway
Safety Association (GHSA) have agreed on a minimum set of performance measures to be used
by States and federal agencies in the development and implementation of behavioral highway
safety plans and programs. An expert panel from NHTSA, State Highway Safety Offices,
academic and research organizations, and other key groups assisted in developing the measures.
The initial minimum set contains 14 measures: ten core outcome measures, one core behavior
measure, and three activity measures. The measures cover the major areas common to State
highway safety plans and use existing data systems. States will set goals for and report progress
on each of the 11 core outcome and behavior measures annually beginning with their 2010
Highway Safety Plans and Annual Reports. States will report the activity measures annually
beginning with their 2010 Highway Safety Plans and Annual Reports. States should define and
use additional performance measures for their other high-priority highway safety areas as
appropriate. NHTSA will use the core measures as an integral part of its reporting to the
Congress, the public, and others.
The 14 measures follow. Data sources for each measure are given in parentheses.
Core outcome measures – States will set goals and report progress
C-1) Number of traffic fatalities (FARS)
States are encouraged to report 3-year or 5-year moving averages as appropriate
(when annual counts are sufficiently small that random fluctuations may obscure
trends). This comment applies to all fatality measures.
C-2) Number of serious injuries in traffic crashes (State crash data files)
C-3) Fatalities/VMT (FARS, FHWA)
States should set a goal for total fatalities/VMT; States should report both rural and
urban fatalities/VMT as well as total fatalities/VMT.
C-4) Number of unrestrained passenger vehicle occupant fatalities, all seat positions (FARS) C-5) Number of fatalities in crashes involving a driver or motorcycle operator with a BAC of .08 and above (FARS) C-6) Number of speeding-related fatalities (FARS) C-7) Number of motorcyclist fatalities (FARS) C-8) Number of unhelmeted motorcyclist fatalities (FARS) C-9) Number of drivers age 20 or younger involved in fatal crashes (FARS) C-10) Number of pedestrian fatalities (FARS)
Core behavior measure – States will set goals and report progress
B-1) Observed seat belt use for passenger vehicles, front seat outboard occupants (survey)
Performance Measures for States and Federal Agencies 08-08-08 - i -
Activity measures – States will report progress
A-1) Number of seat belt citations issued during grant-funded enforcement activities (grant
activity reporting)
A-2) Number of impaired driving arrests made during grant-funded enforcement activities
(grant activity reporting)
A-3) Number of speeding citations issued during grant-funded enforcement activities (grant
activity reporting)
NHTSA and GHSA will work actively and cooperatively to support the implementation of these
measures and to develop additional or improved measures needed to monitor traffic safety
outcomes, behavior, and activities.
1) Traffic injury data for outcome measures. NHTSA and GHSA will convene a working
group in 2008 to assist each State in identifying the best way to report serious injuries for
core outcome measure C-2 using the State’s current crash data file and to move toward
common and improved injury data definitions and reporting practices.
2) Telephone or similar surveys to track driver attitudes and awareness of highway safety
enforcement and communication activities and self-reported driving behavior. GHSA and
NHTSA will convene a working group in 2008 to develop and test a basic set of survey
questions including information on seat belt use, impaired driving, and speeding. States
will begin reporting survey information in their 2010 Highway Safety Plans and Annual
Reports.
3) Speed monitoring for measuring speed levels and tracking trends. Since State DOTs
typically are responsible for traffic monitoring, NHTSA, FHWA, and GHSA will work
with AASHTO to convene a working group in 2008 to review objectives and resources
and develop guidance for appropriate speed reporting capability. Work will begin by
2009 toward establishing speed monitoring and reporting systems.
4) Law enforcement activities to track both regular operations and special activities such as
high-visibility enforcement campaigns. States will report the number of citations and
arrests from all grant-funded enforcement activities for activity measures A-1, A-2, and
A-3 annually beginning with their 2010 Highway Safety Plans and Annual Reports.
States will extend reporting as the necessary reporting technologies and systems are
developed and implemented. NHTSA and GHSA will convene a working group in 2008
to assist States in improving arrest and citation data collection and reporting. PIRE is
under contract to work with GHSA and NHTSA to develop more comprehensive
performance measures for enforcement activities by May 2009.
Guidance: The following points apply both to the 14 measures in the initial minimum set and to
additional measures to be added as outlined above.
1) NHTSA, with the assistance of the States, will develop uniform definitions, protocols,
and reporting requirements for each recommended performance measure. This is critical
for measures requiring data that all States do not collect and report at present.
2) NHTSA will assist States in establishing data collection and analysis systems for all
measures that not all States report at present.
Performance Measures for States and Federal Agencies 08-08-08 - ii -
3) States will set goals for and report progress on each of the 11 core outcome and behavior
measures annually beginning with their 2010 Highway Safety Plans and Annual Reports.
NHTSA will use the core outcome and behavior measures as an integral part of its
reporting to the Congress, the public, and others.
4) As additional measures from the developmental activities are added to the minimum set,
not all States may be able to implement them immediately.
5) Some behavior and activity measures may be reported only from a portion of a State. For
example, seat belt use observations currently sample only a portion of each State’s roads.
6) All core outcome and behavior measures should be reported on a calendar year basis.
That is, all counts of fatalities and serious injuries should be from January 1 to December
31 and belt use should be reported for the calendar year in which surveys were
conducted. Activity measures should be reported on a federal fiscal year (October 1 to
September 30) basis.
a. In their Highway Safety Plans, due September 1, States should report outcome
and behavior measures for the most recent calendar year for which data are
available on a timely basis and activity measures for the previous fiscal year. For
example, for the 2010 Highway Safety Plan, due September 1, 2009, States
should report outcome measures for calendar year 2007 and, if FARS data are
available on a timely basis, for 2008. They should report seat belt use data for
2008 and, if data are available on a timely basis, for spring 2009. They should
report activity measures for the fiscal year October 1, 2007 to September 30,
2008.
b. In their Annual Reports, due December 31, States should report outcome and
behavior measures for the most recent calendar year for which data are available.
States should report activity measures for the federal fiscal year covered by the
annual report. For example, for the Annual Report due December 31, 2010, States
should report outcome measures for calendar year 2009 and seat belt use data for
2010. They should report activity measures for the federal fiscal year October 1,
2009 to September 30, 2010.
Abbreviations:
AASHTO: American Association of State Highway and Transportation Officials
BAC: blood alcohol concentration
DOT: Department of Transportation
FARS: Fatality Analysis Reporting System (NHTSA)
FHWA: Federal Highway Administration
GHSA: Governor’s Highway Safety Association
NHTSA: National Highway Traffic Safety Administration
PIRE: Pacific Institute for Research and Evaluation
VMT: Vehicle Miles of Travel
Performance Measures for States and Federal Agencies 08-08-08 - iii -
Contents page
Executive summary......................................................................................................................i
How the performance measures were developed .........................................................................1
Performance measures for traffic safety.......................................................................................1
Need for performance measures ............................................................................................1
Potential areas for performance measures ..............................................................................2
Purposes of performance measures ........................................................................................3
Types of performance measures ............................................................................................3
Criteria for performance measures.........................................................................................5
Performance measures currently recommended for States......................................................5
Performance measures currently used by States.....................................................................6
Performance measures currently used by NHTSA .................................................................7
Performance measures currently used in other countries ........................................................7
The minimum set of performance measures.................................................................................7
Use of performance measures................................................................................................8
Overall measures...................................................................................................................8
Seat belt measures ...............................................................................................................11
Child occupant measures .....................................................................................................12
Alcohol measures ................................................................................................................13
Speeding and aggressive driving measures ..........................................................................14
Motorcyclist measures.........................................................................................................15
Young driver measures........................................................................................................16
Pedestrian measures ............................................................................................................17
Older driver measures..........................................................................................................17
Bicyclist measures...............................................................................................................17
Performance measures under development and study ................................................................18
Traffic injury data................................................................................................................18
Telephone or similar surveys...............................................................................................19
Speed monitoring ................................................................................................................19
Law enforcement activities..................................................................................................20
Guidance for using performance measures ................................................................................21
References ................................................................................................................................23
Performance Measures for States and Federal Agencies 08-08-08 - iv -
Appendices
A. Performance Measure Expert Panel ......................................................................................24
B. Performance measures supported by GHSA and NHTSA .....................................................27
C. Performance measures currently used in annual State highway safety plans
(402 plans) and in State Strategic Highway Safety Plans (SHSPs).........................................28
D. Example of why direct comparisons between States may be misleading ...............................34
E. Example of variability in annual fatality counts and effect of moving averages .....................35
F. Extracts from “Transportation Performance Measures in Australia, Canada, Japan, and New Zealand .......................................................................................................37
Performance Measures for States and Federal Agencies 08-08-08 - v -
Traffic Safety Performance Measures for States and Federal Agencies
July 31, 2008
The National Highway Traffic Safety Administration (NHTSA) and the Governors Highway
Safety Association (GHSA) have agreed on a minimum set of performance measures to be used
by States and federal agencies in the development and implementation of behavioral highway
safety plans and programs. This report documents how the minimum set of measures was
developed, presents background information on performance measures, explains the measures in
the minimum set and discusses their use, and describes areas in which additional measures are
being developed.
How the performance measures were developed
The measures were developed by an expert panel whose members came from NHTSA, State
Highway Safety Offices (SHSOs), academic and research organizations, and other key groups
(see Appendix A for panel members) with staff assistance from GHSA and the Preusser
Research Group (PRG). The panel met on January 17, 2008 and developed draft guidance on the
criteria the measures should satisfy and how the measures should be used as well as a draft list of
measures. Staff then prepared a white paper that presented background information on
performance measures (contained in the next section of this report), documented the panel’s draft
conclusions, and presented additional issues on which the panel sought advice. The white paper
was distributed for public comment on March 3, 2008.
The panel met again on May 13, 2008. After considering all white paper comments, the panel
agreed on a minimum set of 14 performance measures to be implemented by 2010. It also agreed
on areas in which performance measures are needed but where additional work is required to
define or develop them. The Federal Highway Administration (FHWA), GHSA, and NHTSA
agreed to a process and schedule for developing measures in each area.
The minimum set of performance measures and the areas where additional work is required
represent the general consensus but not the unanimous opinion of the panel. Individual panel
members likely would wish to add, drop, or change one or more of the 14 recommended
measures or the four areas where additional measures will be developed. NHTSA and GHSA
have agreed on the 14 measures and the four areas.
Performance measures for traffic safety
Need for performance measures
Performance measures are required for each State’s traffic safety activities. 23 CFR
1200.10(a)(1) requires States to develop each year:
Performance Measures for States and Federal Agencies 08-08-08 - 1 -
“(a) A Performance Plan, containing the following elements: (1) A list of objective and
measurable highway safety goals, within the National Priority Program Areas and other
program areas, based on highway safety problems identified by the State during the processes
under paragraph (a)(2) of this section. Each goal must be accompanied by at least one
performance measure that enables the State to track progress, from a specific baseline,
toward meeting the goal (e.g., a goal to “increase safety belt use from XX percent in 19__ to
YY percent in 20__,” using a performance measure of “percent of restrained occupants in
front outboard seating positions in passenger motor vehicles”).”
Recent reviews of NHTSA have emphasized the importance of performance measures (Scovel,
2007). The Department of Transportation’s audit of NHTSA’s impaired driving program
(USDOT, 2007) reported:
“Better performance measures are needed to fully gauge the impact that future Federal
resources will have on State programs.”
In discussions with NHTSA on high-visibility enforcement programs, the Government
Accountability Office raised the question (USGAO, 2007):
“In some states, performance measures do not always contain sufficient detail or do not
explain the specific actions that the state will take to achieve final targeted outcomes. What
steps, if any, can NHTSA take to improve the quality of state performance measures?”
These examples illustrate the importance of establishing a common set of performance measures
that cover key traffic safety program areas and that will be used by all States and NHTSA (as
well as other federal agencies dealing with traffic safety).
Potential areas for performance measures
Performance measures were considered for the following ten areas.
• Overall
• Seat belt use
• Child occupants
• Alcohol-impaired driving
• Speeding and aggressive driving
• Motorcyclists
• Young drivers
• Older drivers
• Pedestrians
• Bicyclists
Emergency Medical Services (EMS) and traffic records were not considered because
performance measures for these areas are being developed by others (NHTSA, 2006; USDOT,
2006, Appendix 3).
Performance Measures for States and Federal Agencies 08-08-08 - 2 -
These areas agree closely with the priority behavioral program areas that States have identified in
their State Strategic Highway Safety Plans (SHSPs), as tabulated by the Federal Highway
Administration (FHWA) (Lindley, 2008).
Most frequently identified behavioral priority areas in State SHSPs, listed by the number of
States including the area as a priority:
48 occupant protection
46 impaired driving
40 young drivers
35 aggressive drivers
34 pedestrian safety
30 motorcycle safety
28 speeding
27 bicycle safety
24 older drivers
21 distracted drivers
Purposes of performance measures
Performance measures are used for several different purposes.
• Set goals
• Connect goals to actions
• Allocate resources
• Monitor and evaluate progress
• Communicate the priorities, results, and the value to society of various traffic safety
program areas and activities
In general, performance measures should be used as their name implies – to measure and assess
progress, at the local, State, or national level – not to compare localities or States that may differ
substantially on many factors that affect traffic safety.
Each purpose places specific and sometimes differing requirements on performance measures.
Conversely, not all performance measures satisfy or are even appropriate for each purpose.
Types of performance measures
Behavior traffic safety performance measures document three distinct subjects.
• Outcomes: may include crashes, injuries, or fatalities; may be presented as numbers, rates
(per population, travel mile (VMT), licensed driver, etc.), percentages, or ratios.
• Behavior: may include observed behavior on the road or self-reported behavior obtained
through surveys; also may include self-reported awareness, knowledge, and attitudes.
• Activities: may include law enforcement, courts, media, education, and other activities
that may affect traffic safety.
Outcome measures from traffic crash data are used to set national and State goals, allocate
resources, and measure progress both overall and in key areas. They should be accurate. For
Performance Measures for States and Federal Agencies 08-08-08 - 3 -
national use they should be uniform and consistent across States and over time; for State use they
need not be uniform or consistent with other States but they should be consistent over time. They
may not be especially timely. The most common outcome measures used at federal, State, and
local levels are annual traffic fatalities and annual traffic fatality rates per mile of travel.
Behavior measures use data either from direct observations (such as belt use or vehicle speed) or
from some method of self-reporting (such as surveys). They provide the link between specific
activities and outcomes by assessing whether activities have influenced behavior. Behavior
measures help States assess the effectiveness of their specific activities in a timely manner; this
in turn allows them to allocate scarce resources efficiently. The behavior measure used most
commonly is observed belt use.
Activity measures cover a wide range of specific actions taken in an attempt to affect outcome
measures (to reduce crashes, injuries, and fatalities). They document how specific programs and
activities are implemented. Discussions of performance measures in other fields may call them
output measures. Examples include counts of activities (checkpoints conducted, Public Service
Announcements (PSAs) aired, motorcycle operators training courses held), funds or hours used
to conduct the activities (law enforcement hours used for checkpoints, costs of PSAs, costs or
instructor hours for motorcycle operator training), or counts of persons affected (drivers passing
through checkpoints, number of viewers for PSAs, number of motorcycle operators trained).
Activity measures may not be consistent across States or over time because different States may
use different activities at different times to address their highway safety problems. Activity
measures should be timely.
The three types of measures work together to document overall performance. Activity measures
document what was done; behavior measures document whether the activities changed behavior;
and outcome measures document whether the behavior change reduced crashes, injuries, and
fatalities.
It’s useful to identify two variants of these three basic performance measure types.
Information from outcome, behavior, or activity measures may be presented in different ways.
Examples include using moving averages instead of annual or monthly counts, rates (per
population, travel mile (VMT), licensed driver, etc.), percentages (percentage of drivers in fatal
crashes with BAC .08 or above), or ratios (ratio of helmeted to unhelmeted motorcyclist
fatalities). These methods may make the information from outcome, behavior, or activity
measures more useful or understandable. For example, moving averages can smooth out the
effects of year-to-year fatality count variations in small States and allow trends to be seen more
clearly. Population rates can allow motor vehicle fatality and injury rates to be compared with
population rates from other injury causes or from diseases.
Outcome, behavior, or activity measures can be disaggregated by important subgroups to provide
better understanding of the measures or to focus on key program targets. For example, fatality or
injury rates per VMT for a State are more meaningful if both rural and urban rates also are
presented. Belt use can be disaggregated by occupant age, vehicle type, and time of day to
identify low belt users.
Performance Measures for States and Federal Agencies 08-08-08 - 4 -
Criteria for performance measures
Traffic safety performance measures should satisfy the following criteria.
• Important and valid; the quantity measured has a substantial impact on traffic safety
• Uniform across States (only for measures aggregated at regional or national levels)
• Sensitive to actual State-level trends (a change in the measure will provide useful and
meaningful traffic safety information)
• Long-term, something that should be measured for many years
• Acceptable to stakeholders; developed by consensus process
• Operational definition: it’s clear how to obtain the measure
• Accurate, reliable, and repeatable over time
• Understandable; can be communicated easily to decision makers and public
• Timely
• Cost reasonable for the value of information obtained
Unfortunately, no measure satisfies all criteria and most are poor on at least one. In particular,
the outcome measures from the Fatality Analysis Reporting System (FARS) or State data
accurately track outcomes and are available currently with no additional data collection cost but
they are not timely. More timely behavior and activity measures may not be as accurate, valid, or
as uniform across States. Most behavior and activity measures also add costs for data collection.
All behavior and activity measures must balance the costs of acquiring and analyzing the data
against the benefit of the new information the data would provide.
Since no measure satisfies all desired criteria, a mix of measures is needed, each satisfying
different criteria and appropriate for different purposes. However, the measures as a whole
should satisfy a final criterion:
• Not too many: use a small number of the most important measures
Another criterion that could be used is “ease of uniform implementation” in the sense that an
ideal measure could be implemented quickly, uniformly in all States, at minimal cost. Measures
using FARS are easy to implement; measures requiring new data collection are not. Some
measures that may be valuable in the long run may not be easy to implement uniformly (or at all)
in the short run. They require longer-term research, development, and implementation.
Performance measures currently recommended for States
GHSA supports 10 performance measures for use by all States, which are listed in the GHSA
guidelines for State highway safety plans (GHSA, 2004, p. 17).
• Overall measures: traffic fatalities, fatalities/VMT, fatalities/population; traffic injuries
(including fatalities), injuries/VMT, injuries/population
• Seat belt measure: observed belt use rate
• Alcohol measures: alcohol related fatalities, alcohol related fatalities/VMT; percent of all
fatalities that involve alcohol
Nine of the ten are outcome measures obtained from FARS or State crash data files. Observed
belt use is the only behavior measure and there are no activity measures.
Performance Measures for States and Federal Agencies 08-08-08 - 5 -
NHTSA also recommends that States consider 20 additional performance measures in eight
priority traffic safety areas (GHSA, 2004, p. 18). These include one behavior measure
(motorcycle helmet use) and three activity measures from traffic citations or arrests. They are
listed in Appendix B.
Performance measure currently used by States
All States use performance measures, at least implicitly, in their annual highway safety (Sec.
402) plans. The number of measures used by a State ranges from 4 to 115.
No single measure is used by all States. In fact, only 2 measures are used by more than half the
States: observed belt use (by 50) and fatalities/VMT (by 30). While the 10 GHSA-supported
measures (GHSA, 2004) are used most frequently, only four States use all 10.
States use many different outcome measures to assess a highway safety problem area.
Differences include what to count (crashes, injury crashes, serious injury crashes, fatal crashes;
injuries, serious injuries, fatalities) and whether and how to normalize (rates per VMT, per
population, per registered driver; proportions of crashes, injuries, or fatalities with some
characteristic, such as the proportion of fatalities that are pedestrians).
Many States use some behavior or activity measures to track specific programs, such as training,
traffic records, enforcement, and the like. The only behavior or activity measure used by more
than 10 States is observed belt use, by 50 States. Next are the activity measures of DWI citations,
speed citations, and motorcyclists trained, with four States each.
Performance measures are used less frequently in State Strategic Highway Safety Plans (SHSP
plans) than in 402 plans. Some plans have no performance measures. While 402 plans are
produced annually, many SHSP plans were produced two or three years ago, before the recent
emphasis on performance measures.
Most States (45) have an overall performance goal of reducing traffic fatalities (16),
fatalities/VMT (15), or both (14), but a few plans lack even an overall measure. Traffic fatalities
and fatalities/VMT are the only two measures used by more than half the States.
While the 10 GHSA-supported measures (GHSA, 2004) are used most frequently, no State uses
all 10. In fact, no State uses the overall measures of fatalities or injuries per population.
As in their 402 plans, many States use some behavior or activity measures to track specific
programs. Only one behavior measure is used by more than two States: observed belt use, used
by 25. The only activity measure used by more than two States is DWI citations, used by five.
Appendix C, “Performance measures in State 402 and SHSP plans,” provides additional detail.
Performance Measures for States and Federal Agencies 08-08-08 - 6 -
Performance measures currently used by NHTSA
NHTSA uses a number of measures in reports to the Congress, the public, and others regarding
the status of traffic safety overall and key traffic safety subjects such as seat belt use, impaired
driving, speeding, and motorcycle helmet use. Since the criteria for measures used by NHTSA
for these purposes are similar to those outlined above, NHTSA intends to use the performance
measures from this report’s minimum set for these external communications.
Performance measures currently used in other countries
Many European countries currently use overall measures of fatalities, injuries, fatalities/VMT, or
injuries/VMT. The European Community (OECD, 2007) recommends measures for alcohol
(from crash data), seat belts (from observed belt use), speed (from speed monitoring), and
motorcycles, mopeds, and bicycles (from observed helmet use). New Zealand uses performance
measures of the number of roadside breath tests for alcohol and the number of law enforcement
hours expended to administer these roadside breath tests. FHWA (2004) and SWOV (2005)
document these performance measures and recommendations. Appendix F provides brief
extracts from FHWA (2004) of general observations regarding performance measures in
Australia, Canada, Japan, and New Zealand and recommendations for performance measures for
the United States.
The minimum set of performance measures
This section documents the performance measures in the minimum set, discusses how they will
be used, and describes additional measures that are being developed. It also describes other
performance measures that some States and federal agencies may wish to use as appropriate to
address their individual traffic safety priority areas.
The initial minimum set contains 14 performance measures: ten core outcome measures, one
core behavior measure, and three activity measures. The core outcome measures are numbered
C-1 through C-10, the core behavior measure is B-1, and the activity measures are A-1 through
A-3. These measures use several available data sources: FARS, seat belt use observation surveys,
and grant reporting data.
Additional or improved behavior and activity measures are needed but require data that are not
currently available in all States. NHTSA and GHSA have agreed to activities to develop these
data sources and to define and test performance measures from them.
After a description of how the performance measures will be used, each major subject area is
discussed in turn: the measures in the minimum set, additional measures to be developed,
optional measures that States may wish to use, and methods for presenting or disaggregating the
measures. Following this, the activities to implement measures in the minimum set and to study
and develop additional measures across all subject areas are described.
Performance Measures for States and Federal Agencies 08-08-08 - 7 -
Use of performance measures
The outcome, behavior, and activity measures in the minimum set will be used in different ways.
The outcome measures will be used to set goals, at both State and national levels, to assess
progress toward these goals, and to provide ultimate accountability. For example, a State may
have an overall goal of reducing the number of traffic fatalities below a specified level by a
given year, or meeting a similar target for the 5-year moving average of traffic fatalities. Goals
for the national fatality rate per VMT have been used for some time. NHTSA has performance
goals for 2009 that use VMT rates.
The behavior and activity measures will be used to provide timely indicators of the effects of
specific programs or groups of programs. States may wish to use them for short-term program
implementation goals: for example, if a program seeks to train motorcycle operators, then the
State may set a goal for the number of operators trained in a year.
NHTSA recognizes that the establishment of a minimum set of performance measures, including
outcome, behavior, and activity measures, will have implications for State annual highway safety
plans. As noted previously, Section 402 regulations require that States provide “from – to” goal
statements for certain performance measures. NHTSA expects that State highway safety plans
will include such goal statements for the outcome and behavior measures in the minimum set but
not for activity measures in the minimum set, or for any measures not included in the minimum
set. To emphasize this point, the outcome and behavior measures in the minimum set, for which
goal statements are expected, are called core measures.
NHTSA and GHSA believe that, like the core outcome and behavior measures, the activity
measures in the minimum set are critical for State use in identifying problems, tracking progress,
and assessing countermeasure effectiveness. States agree to collect and use data on these activity
measures and to provide these data to NHTSA annually. However, NHTSA will expect “from –
to” goal statements in annual Highway Safety Plans only for the core outcome and behavior
measures. All outcome, behavior, and activity measures should be collected and reported on a
calendar year basis. That is, all counts of fatalities and injuries should be from January 1 to
December 31. Surveys and activity counts should be performed during the calendar year for
which they are reported.
Overall measures
Core outcome measures in the minimum set:
C-1) Number of traffic fatalities (FARS)
C-2) Number of serious injuries in traffic crashes (State crash data files)
C-3) Fatalities/VMT (FARS, FHWA)
Methods for presenting or disaggregating these measures:
Population rates: fatalities, injured persons/population
VMT rates: injured persons/VMT
Moving averages: for all measures
Disaggregate VMT rates by rural/urban
Other breakouts are described in the remaining sections
Performance Measures for States and Federal Agencies 08-08-08 - 8 -
Traffic fatalities are the key outcome measure. They are clearly understood and universally used.
NHTSA’s FARS has maintained a national census of traffic fatalities since 1975. FARS provides
uniform, consistent, accurate, and reliable traffic fatality data. FARS data can be used for overall
traffic safety outcome measures such as C-1 and C-3 and also for outcome measures in key
program areas.
Fatality data from FARS have three weaknesses.
1) FARS data are not timely. Complete annual data are not available until approximately the
following August. This means that FARS data to examine the effect of an activity starting in
January of a given year will not be available for 18 months.
Some States address this issue by tracking traffic fatalities on a daily basis and reporting
current year-to-date traffic fatalities compared to the previous year’s total as of the same
date. This practice provides an immediate indicator of overall traffic safety performance.
These counts cannot be completely accurate due to late reporting and to persons who die
some days after a crash (FARS includes all persons who die within 30 days of a crash). They
can include breakouts for a few key areas, such as motorcycle fatalities. They may not be
able to provide other breakouts. For example, BAC data from fatalities typically are not
available for weeks or even months following a crash.
2) Small States have few traffic fatalities. In 2005, three States and the District of Columbia
had fewer than 100 total fatalities and another seven States had between 100 and 200. When
the numbers are disaggregated by program area, such as passenger vehicle occupant
fatalities, the counts become even smaller. A very few crashes may produce a large
proportionate change in a small State’s fatality count. For example, in a State with 50
speeding-related fatalities, a single speeding crash with 5 fatalities accounts for 10% of the
annual total.
Some States use moving averages to smooth out the irregularities produced by small numbers
of fatalities. Appendix D provides an example. Moving averages often show long-term trends
more clearly than annual counts. Moving averages can be used for fatality rates (per VMT or
population). More complex statistical methods such as regression also can be used to reveal
underlying trends.
Moving averages typically use a three, five, or ten year period. Longer time periods smooth
the data more, which reduces the effect of a single unusual year; however, new trends are not
apparent for several years (see Appendix E). Shorter time periods may be more appropriate
for larger than for smaller States.
3) Traffic crashes, injuries, and fatalities are influenced by many factors outside the control
of State highway safety offices or NHTSA. Most obviously they are affected by the amount
of travel. As discussed in the next section, measures using rates/VMT can begin to take this
into account. But they also are affected by the type of travel: for example, young drivers have
a higher crash risk than older drivers; motorcyclists have a higher crash risk than passenger
car drivers; travel on two-lane country roads is more risky than travel on Interstate highways.
Performance Measures for States and Federal Agencies 08-08-08 - 9 -
At a broader level, crashes, injuries, and fatalities are affected by vehicle safety
improvements, roadway design, traffic volumes and speeds, urbanization, per capita alcohol
consumption, and even general economic conditions. The influence of all these factors makes
it difficult to compare crashes, injuries, or fatalities – or rates – between jurisdictions in
which these influencing factors differ. These factors also make it difficult to interpret
whether a change in traffic fatalities was due to traffic safety programs or to other factors (or
to both).
These observations have three consequences. First, conclusions about changes in traffic
crashes, injuries, or fatalities should be made only after accounting for potential effects of
other influences through good analyses. Next, the observations emphasize the importance of
behavior measures, which can provide the causal link between traffic safety activities and
crash data.
Finally, the goal of traffic safety is to reduce the absolute number of crashes, injuries, and
fatalities in spite of other factors that may conspire to increase them. Some States have
adopted a specific goal of no traffic fatalities or no preventable fatalities. So these comments
should not be interpreted that performance measures should not be based on crashes, injuries,
or fatalities, but only that those measures should be used and interpreted appropriately.
The fatality rate per mile of travel (fatalities/VMT) is used frequently to track both national and
State overall traffic safety trends and to set goals (see Appendix C). It is one of the ten
performance measures supported by GHSA and NHTSA (Appendix B). The VMT rate is
valuable to put the fatality counts of rapidly-growing and slowly-growing States into perspective.
VMT rate comparisons among States can be misleading unless rural and urban rates are shown
separately. Rural rates are substantially higher than urban rates. This means that predominantly
rural States are likely to have higher overall fatality rates than predominantly urban States.
Appendix D provides an example, using California and South Dakota. South Dakota’s overall
fatality rate/VMT was substantially higher than California’s. However, South Dakota’s rural and
urban rates were both lower than California’s respective rates. NHTSA and FHWA should
present both rural and urban VMT rates, using the FHWA definitions, whenever overall State
VMT rates are published. States are encouraged to present both rural and urban VMT rates along
with their overall VMT rate.
Population rates are useful at both national and State levels to measure the public health burden
from motor vehicle crashes against the population size. Population fatality or injury rates from
traffic crashes can be compared to rates from falls, poisoning, heart disease, diabetes, or other
causes to rank the public health impact of each cause and to determine whether societal resources
are devoted to each cause in comparison to its burden.
A State’s population rates are based on the State’s resident population. Unlike injuries or disease,
a State’s traffic crash victims include not just residents but also persons driving through the
State. Some States have a substantial number of crashes, injuries, and fatalities involving out-of-
State persons. As a result, comparing population rates among States may be misleading. While
Performance Measures for States and Federal Agencies 08-08-08 - 10 -
population rates are not included in the minimum set, States may wish to use population rates as
a means of communicating the importance of traffic safety in the broad public health agenda.
Traffic injuries provide substantially greater counts than fatalities. NHTSA reports about 43,000
fatalities and about 2,700,000 injuries annually in recent years, or about 60 injuries for each
fatality. Traffic injury data come from each State’s crash data systems. There is no national data
system comparable to FARS that reports State-level injury counts.
NHTSA and GHSA agree that traffic injury data should be used to define outcome performance
measures. Since almost all States record serious injuries in their crash data files, the number of
serious injuries has been included as core outcome measure C-2 in the minimum set, with the
understanding that the definition of serious injury may not be consistent from State to State.
NHTSA and GHSA will convene a working group in 2008 to assist each State in identifying the
best way to report serious injuries using the State’s current crash data file and to move toward
common and improved injury data definitions and reporting practices.
More information on the development and implementation of injury measures is included in
Performance Measures Under Development and Study on page 18.
Seat belt measures
Core outcome measure in the minimum set:
C-4) Number of unrestrained passenger vehicle occupant fatalities, all seat positions
(FARS)
Core behavior measure in the minimum set:
B-1) Observed seat belt use for passenger vehicles, front seat outboard occupants
(survey)
Activity measure in the minimum set:
A-1) Number of seat belt citations issued during grant-funded enforcement activities
(grant activity reporting)
Measures under development and study:
Self-reported attitudes, awareness, and behavior regarding seat belt use, laws, penalties
and enforcement (survey)
Law enforcement activities (more comprehensive enforcement measures)
Methods for presenting or disaggregating these measures:
Number of unrestrained fatalities in front and rear seating positions, or in front outboard
positions
Number of unrestrained fatalities during daytime and nighttime hours
Observed seat belt use currently is collected by almost all States in May or June each year, using
NHTSA-approved sampling systems so that the results can be compared across States. The
observations can be broken out by factors of interest such as rural-urban, vehicle type, and
occupant age and sex. Observed belt use is the best behavior measure currently used in traffic
safety, with a clear link to occupant injuries and fatalities. It provides an excellent test of
program effectiveness. And it is timely, with State belt survey results available within weeks of
the observations.
Performance Measures for States and Federal Agencies 08-08-08 - 11 -
The only drawbacks to the current observed belt use rate, aside from the cost of conducting the
survey, are that it measures belt use only in daylight hours, only at one time of the year, and only
for drivers and right front seat passengers. There currently is no practical or cost-effective way to
conduct observations at night or at multiple times of the year.
Seat belt and child restraint use of passenger vehicle occupant fatalities is available in FARS.
Seat belt use in FARS is substantially lower than observed belt use for two reasons. First, it
measures belt use by drivers and passengers who are in high-severity crashes (often speeding)
and who typically use belts less frequently than the general driving public. Second, occupants in
high-severity crashes who are buckled up are less likely to die than those who are unbuckled.
Thus belt use for occupant fatalities measures belt use for the most at-risk occupants, those who
will gain the most by buckling up. It captures their belt use at all hours of the day and all times of
the year, filling in the gaps of observation surveys. A comparison of belt use for front seat
outboard passenger vehicle occupant fatalities with belt use from observation surveys is
especially useful. In small States, occupant fatality belt use suffers from the same small number
issues as overall traffic fatalities, so again moving averages may be useful.
Self-reported attitudes, awareness, and behavior regarding seat belt use, laws, penalties and
enforcement can be useful for assessing the impact of belt use enforcement and publicity
activities. This information also can help to identify characteristics of those occupants who still
do not buckle up and to define strategies to increase their belt use. Some States conduct
occasional telephone surveys or focus groups for these purposes. More information on surveys is
included in Performance Measures Under Development and Study on page 19.
Law enforcement activities have been the most successful strategy to increase belt use over the
past 20 years. Almost all States currently conduct high-visibility enforcement during the annual
Click It or Ticket (CIOT) mobilization in May and some States conduct them at other times of
the year. Specific activities may include checkpoints, saturation patrols, enforcement zones, or
other strategies. Some activities are funded by NHTSA grants while others are not. States
currently report some CIOT enforcement activities to NHTSA.
Some performance measure of the amount or intensity of these activities would be valuable if
one can be defined. NHTSA and GHSA are actively working to define and develop both near
and longer term measures of law enforcement activities. More information is included in
Performance Measures Under Development and Study on page 20.
Child occupant measures
Unrestrained child occupant fatalities are included in core outcome measure C-4: the number of
unrestrained passenger vehicle occupant fatalities, all seat positions. No specific child occupant
measures are included in the minimum set.
Child occupant restraint use is a critical traffic safety concern. As with seat belt use, it can be
observed in traffic (or more usually in parking lots) or in fatal crashes. About one-third of the
Performance Measures for States and Federal Agencies 08-08-08 - 12 -
States include observed child safety seat use as a 402 performance measure. However, no child
occupant behavioral measure is included in the minimum set for several reasons. These include:
a) In most States, child occupant injuries and fatalities are a very small proportion of total
traffic injuries and fatalities, so that year-to-year changes are not a reliable indicator of
changes in program performance.
b) There is no standard age to define child occupants. The ages covered by State child
occupant protection laws vary substantially.
c) Child restraint use surveys are difficult to conduct in a random, probability-based manner.
d) State child restraint surveys are commonly designed to measure use according to age
groups that are relevant to their State laws. Since State laws differ, comparison of age groups
across States is difficult.
Alcohol measures
Core outcome measure in the minimum set:
C-5) Number of fatalities involving a driver or motorcycle operator with a BAC of .08
and above (FARS)
Activity measure in the minimum set:
A-2) Number of impaired driving arrests made during grant-funded enforcement
activities (grant activity reporting)
Measures under development and study:
Self-reported attitudes, awareness, and behavior regarding impaired driving, laws,
penalties and enforcement (survey)
Law enforcement activities (more comprehensive enforcement measures)
Methods for presenting or disaggregating these measures: Number of fatalities involving a driver with a BAC of .08 and above /VMT Number of fatalities involving a driver with a BAC of .08 and above /population
Fatalities involving a driver with a BAC of .08 and above addresses impaired driving at the
illegal per se BAC level. It does not imply that drivers with a positive BAC level less than .08
are not impaired. It does not attempt to address commercial vehicle drivers, who have a legal
BAC limit of .04, or drivers under the age of 21, who have zero tolerance law limits of .02 or
less.
For many years NHTSA has reported the measure “all alcohol-involved fatalities,” defined as all
fatalities in which at least one active participant (driver, pedestrian, or bicyclist) has a positive
BAC. While this does measure the involvement of alcohol in fatal crashes, it combines several
different program targets (underage drivers, pedestrians, and low BAC drivers as well as drivers
at or above .08). The minimum set measure “fatalities involving a driver with BAC .08 and
above” provides a more useful measure of alcohol-impaired driving.
The percent of fatalities involving alcohol is another measure in common use. The comments of
the previous paragraph apply. Also, the percent of fatalities involving alcohol can be reduced
either by reducing the numerator (fewer fatalities involving alcohol) or by increasing the
denominator (more total fatalities, which could be non-alcohol fatalities). So it could change for
Performance Measures for States and Federal Agencies 08-08-08 - 13 -
reasons having nothing to do with alcohol-impaired driving. For these reasons it is not included
in the minimum set of performance measures.
Other measures have been used or proposed to attempt to control for other influences on traffic
safety. One attractive measure is the ratio of fatalities involving alcohol to fatalities not involving
alcohol, which statisticians call the odds ratio. The denominator, fatalities not involving alcohol,
controls for other factors affecting traffic fatalities. The comments of the previous two
paragraphs apply: the measure combines several program targets and it can be reduced either by
reducing alcohol-related fatalities or by increasing non-alcohol fatalities. Other odds ratios also
could be used, for example the ratio of drivers in fatal crashes with BAC .08 and above to drivers
in fatal crashes with BAC below .08.
Single-vehicle nighttime (e.g., 11 pm – 5 am) injury crashes provide a proxy measure for
alcohol-impaired driver crashes because many of these crashes involve alcohol. These crashes
also frequently include other characteristics that States wish to track, such as speeding and
drowsy driving. As a proxy, the measure is not precise. Since it uses injury crashes rather than
fatal crashes, it is timelier than the core measure of fatalities involving a driver with BAC .08
and above. It also estimates impaired driving in non-fatal crashes where BAC testing is rare.
Some States use this measure currently as a timely indicator of impaired driving.
Behavior, attitude, and awareness measures from surveys. Information from attitude, awareness
and self-report behavior surveys provides important insights on the degree to which the public
has been exposed to messages regarding traffic safety, persuaded to change attitudes towards
safety behaviors, or changed their own behavior. This information is especially important for
impaired driving. Unlike seat belt use and speeding, there is no practical and objective way to
determine from the roadside whether a passing driver is impaired by alcohol. More information
on surveys is included in Performance Measures Under Development and Study on page 19.
Alcohol-impaired driving (DWI) law enforcement activities. As with seat belt use, law
enforcement activities have proven to be among the most effective means for reducing impaired
driving. Some performance measure of the amount or intensity of these activities would be
valuable if one can be defined. NHTSA and GHSA are actively working to define and develop
both near and longer term measures of law enforcement activities. More information is included
in Performance Measures Under Development and Study on page 20.
Speeding and aggressive driving measures
Core outcome measure in the minimum set:
C-6) Number of speeding-related fatalities (FARS)
Activity measure in the minimum set:
A-3) Number of speeding citations issued during grant-funded enforcement activities
(grant activity reporting)
Measures under development and study:
Speed monitoring (speed monitoring system)
Self-reported attitudes, awareness, and behavior regarding speeding, aggressive driving,
laws, penalties, and enforcement (survey)
Speeding law enforcement activities (more comprehensive enforcement measures)
Performance Measures for States and Federal Agencies 08-08-08 - 14 -
Speeding-related fatalities. The investigating officer determines whether a traffic fatality is
speeding-related. So the determination of a speeding-related fatality rests on the officer’s
judgment. It may not be consistent from officer to officer, much less from State to State;
however it is the best speeding performance measure currently available. NHTSA has reported
speeding-related fatalities for many years. As with other crash data, speeding-related fatalities
can be broken out by rural-urban, by road type and road speed limit, and can be presented as
rates/VMT and /population.
Speed monitoring. Travel speeds can be observed easily from the roadside or recorded from
loops in the pavement. There has been no consistent speed monitoring across all States since the
National Maximum Speed Limit (NMSL) was repealed (and even under NMSL speed was
monitored only on roads with speed limits 55 mph and above). Only a few States currently
monitor and report speeds on a limited number of their roads: of 32 States that responded to an
informal survey, 16 reported that they conduct some speed monitoring and only 7 produce an
annual report. NHTSA is conducting a national survey of travel speeds, using a probability
sample of roads of all types across the country, in much the same way that the National Occupant
Protection Survey (NOPUS) estimates a national belt use rate.
Speed monitoring in each state using a representative sample of all road types is desirable if a
practical method of data collection can be developed. FHWA, NHTSA, and GHSA are working
in cooperation with
reporting. More infor
19.
AASHTO to identify appropriate methods for speed monitoring and
mation is included in Performance Measures Under Development on page
Speeding law enforcement activities are used by some States in much the same way as high-
visibility seat belt or impaired driving enforcement activities. Some performance measure of the
amount or intensity of these activities would be valuable if one can be defined. NHTSA and
GHSA are actively working to define and develop both near and longer term measures of law
enforcement activities. More information is included in Performance Measures Under
Development and Study on page 20.
Self-reported speeding behavior could be obtained from surveys, as discussed under seat belt and
impaired driving measures. Similar comments apply. Self-reported speeding behavior probably
provides the only indicator of speeding trends until and unless a speed monitoring system is in
place. More information on surveys is included in Performance Measures Under Development
and Study on page 19.
Aggressive driving. While many States include aggressive drivers as a high priority area in their
SHSPs and 402 plans, there appears to be no useful aggressive driving performance measure
distinct from speeding. If surveys are used to obtain self-reported speeding behavior, aggressive
driving information could be included as well.
Performance Measures for States and Federal Agencies 08-08-08 - 15 -
Motorcyclist measures
Core outcome measure:
C-7) Number of motorcyclist fatalities (FARS)
C-8) Number of unhelmeted motorcyclist fatalities (FARS)
Additional measure for consideration by States:
Number of fatalities involving a motorcycle operator with BAC .08 and above (FARS)
Methods for presenting or disaggregating these measures:
Number of motorcyclist fatalities/registered motorcycle
Number of unhelmeted motorcyclist fatalities
Number of motorcyclist fatalities in single-vehicle and multi-vehicle crashes
Motorcycle travel data. FHWA publishes State-level motorcycle VMT data, which is submitted
by the States as part of the Highway Performance Monitoring System (HPMS). State reporting of
motorcycle VMT to FHWA was optional prior to 2007. Even for those States that reported
motorcycle VMT, it often was only estimated as a standard proportion of total VMT rather than
collected directly through surveys or roadside counters. FHWA estimated motorcycle VMT for
States that did not report based on data from States that did report. The accuracy of these
estimates was thus quite speculative. Beginning in 2007, FHWA began requiring States to collect
and report motorcycle VMT data. Initial data will be available in 2008.
FHWA currently is working with the States to improve the collection of motorcycle VMT data
and address any technical issues. In October 2007, FHWA and NHTSA held a symposium on
motorcycle travel to exchange State best practices in motorcycle VMT collection, explore new
data sources and data collection technologies, and develop a long term research and
implementation roadmap. In May 2008 FHWA hosted a demonstration of motorcycle sensor
technology which drew extensive interest and participation by vendors, the motorcycle user
community, and others including NHTSA. When motorcycle VMT data are considered more
reliable, then motorcycle fatalities/VMT can be considered for use as a performance measure.
Motorcyclist fatalities/registered motorcycle. This provides the best motorcyclist exposure
measure currently available. The main drawback is the substantial variability in travel among
motorcyclists. Some use motorcycles for regular transportation while others use them only for
recreation. Motorcycle travel also varies substantially with weather conditions. Motorcycle crash
or casualty rates/registered motorcycle should not be compared across States.
Unhelmeted or BAC .08 and above motorcyclist fatalities. These provide the best current
measures for motorcyclist helmet use and impaired riding. Helmet use can be observed in
roadside surveys, and NHTSA’s NOPUS provides national use rates. The difficulty with
observing State-level helmet use is that there are relatively few motorcyclists on the road, so
obtaining enough observations for a good helmet use estimate requires substantial observation
time and costs. States may be able to estimate an overall helmet use rate by including
motorcyclists in annual seat belt use surveys. This method probably would not be able to obtain
any further detail on helmet use, such as use rates by motorcycle type or use rates for helmets
that comply with DOT standards. States with a substantial number of motorcyclist fatalities may
wish to monitor the role of alcohol using FARS data.
Performance Measures for States and Federal Agencies 08-08-08 - 16 -
Young driver measures
Core outcome measure in the minimum set:
C-9) Number of drivers age 20 or younger involved in fatal crashes (FARS)
Methods for presenting or disaggregating this measure:
Number of fatalities involving a driver age 20 or younger /population
Number of unbelted passenger vehicle occupant fatalities age 20 or younger
Number of drivers age 20 or younger in fatal crashes with a positive BAC
Young drivers involved in fatal crashes. Forty States have identified young drivers as a priority
in their SHSPs. But States use different ways to define “young driver.” These in turn reflect
substantial differences across the States in the laws and licensing requirements affecting drivers
at different ages. The measure in the minimum set is very broad. States are encouraged to track
and report specific age breakouts appropriate to their young driver regulations and programs.
Pedestrian measures
Core outcome measure in the minimum set: C-10) Number of pedestrian fatalities (FARS)
Methods for presenting or disaggregating this measure: Number of pedestrian fatalities by age or location
Number of pedestrian fatalities. The importance of pedestrians as a traffic safety area varies
substantially across the States and from urban to rural areas within a State. Pedestrians are joint
responsibilities of SHSOs and DOTs. One-third of the States currently include a pedestrian
fatality performance measure in their 402 plans. The single measure of pedestrian fatalities will
provide basic monitoring appropriate to all States.
Behavioral pedestrian countermeasures vary substantially by the characteristics of the
pedestrians at risk. States may wish to break out pedestrian fatalities by age (such as under 15
and over 65), location (city streets, rural roadways), and other factors (alcohol involvement) to
track specific programs.
Older driver measures
Older drivers are included in most of the outcome, behavior and activity measures. However, no
specific older driver measures are included in the minimum set.
About half the States include older drivers as a priority area in their SHSPs but very few include
them in their 402 plans. No specific older driver performance measure is used by more than a
single State in its 402 plan. Many current older driver countermeasures involve roadway changes
(better signage, protected left turn lanes) or licensing (examination procedures, graduated
delicensing) so are the primary responsibility of State DOTs or DMVs rather than SHSOs. For
these reasons, no older driver performance measures are included in the minimum set.
Performance Measures for States and Federal Agencies 08-08-08 - 17 -
Bicyclist measures
Bicyclists are addressed in several of the core outcome measures (fatalities, injuries, impaired
driving, speeding). However no specific bicyclist driver measures are included in the minimum
set.
Bicyclists contribute fewer than 2% of traffic fatalities nationwide (2005 data: 784 bicyclist
fatalities,which is 1.8% of the 43,443 total traffic fatalities) and about 12% of traffic injuries.
Most States have few bicyclist fatalities. As with pedestrians, bicyclist safety countermeasures
include both behavioral and roadway activities. For these reasons, no bicyclist measures are
included in the minimum set.
Performance measures under development and study
Additional or improved performance measures are needed to monitor traffic safety outcomes,
behavior, and activities. NHTSA and GHSA have agreed to work actively and cooperatively in
the four general areas discussed previously under overall outcomes, seat belt use, alcohol, and
speeding. Some desired measures require data that are not currently available in all States.
1) Traffic injury data for outcome measures
The individual State crash reporting systems are the primary source of traffic injury data. There
is no national data system comparable to FARS that reports State-level injury counts.
NHTSA’s General Estimates System, or GES, reports national traffic injury estimates from a
national sample of crash reports but cannot produce State-level data. Each State has its own
definition of which crashes should be reported and the definitions are not consistent from State to
State. Each State also has its own system of coding injury severity. The most common system
uses five codes: fatal (K), incapacitating (A), non-incapacitating (B), complaint of injury (C),
and uninjured (O). The distinction between A, B, and C injuries is quite subjective and can be
inconsistent. Some States use more detailed injury coding systems.
Injury data from hospital or EMS sources are much more accurate in defining injury type and
severity than data from police crash reports. Some States can link crash and hospital records but
others cannot. At this time, linked crash and hospital or EMS records cannot be used to provide
more accurate performance measures based on crash injuries.
Three hospital and EMS data systems may provide useful traffic injury data now or in the future.
None can yet be used for performance measures.
A) The Behavioral Risk Factor Surveillance System (BRFSS) is the world’s largest, on-going
telephone health survey system, tracking health conditions and risk behaviors in the United
States yearly since 1984. Conducted by the 50 State health departments as well as those in
the District of Columbia, Puerto Rico, Guam, and the U.S. Virgin Islands, with support from
the Centers for Disease Control and Prevention (CDC), BRFSS provides State-specific
information about issues such as asthma, diabetes, health care access, alcohol use,
Performance Measures for States and Federal Agencies 08-08-08 - 18 -
hypertension, obesity, cancer screening, nutrition and physical activity, tobacco use, and
more. It may be possible to add questions on traffic crash injuries to the BRFSS.
B) The National EMS Information System (NEMSIS) project may provide better injury data
in the future. NEMSIS seeks to implement an electronic EMS documentation system in every
local EMS system, to collect these data in a State EMS information system in every State,
and finally to join the State data in a national EMS database. Currently, over three-quarters of
the States have some type of EMS data system in place at various levels of sophistication.
C) In the CDC State Injury Indicators Report using 2004 data (available at
www.cdc.gov/ncipc/dir/StateInjIndicators.htm), 32 States reported data from hospitalizations
due to traffic crashes. If and when the remaining States contribute data, the system should be
considered as a source of potential performance measures.
Development Plans: NHTSA and GHSA will convene a working group in 2008 to assist each
State in identifying the best way to report serious injuries for core outcome measure C-2 using
the State’s current crash data file and to move toward common and improved injury data
definitions and reporting practices. States will begin reporting injury information for core
outcome measure C-2 in their 2010 Highway Safety Plans and Annual Reports.
2) Telephone or similar surveys to track driver attitudes and awareness of highway safety
enforcement and communication activities and self-reported driving behavior
Self-reported knowledge, attitudes, and behavior, collected through telephone surveys, paper
surveys at motor vehicle department (DMV) offices, or similar means, provide measures of
important intermediate outcomes. Survey data are especially useful for impaired driving because
of the absence of direct observation data. Some States conduct telephone surveys regularly for
these purposes but many do not. NHTSA has conducted national surveys on impaired driving,
speeding, seat belt use, and other issues.
Surveys have several limitations. They require additional costs to design, conduct, and analyze.
Depending on how the survey was conducted, respondents may not be fully representative of the
population of interest (such as all drivers). The data would be self-reported so would not be
objective.
Development Plans: NHTSA and GHSA will convene a working group in 2008 to develop and
test a basic set of survey questions, including information on seat belt use, impaired driving, and
speeding. States will begin collecting and reporting survey information in their 2010 Highway
Safety Plans and Annual Reports.
3) Speed monitoring for measuring speed levels and tracking trends.
Speed monitoring in each State, using a representative sample of each road type with a
standardized sample design, would provide appropriate measures of speed, analogous to
observed belt use. The sample design would need to account for issues such as traffic volumes,
roadway and vehicle types, and environmental factors. The design also would need to determine
Performance Measures for States and Federal Agencies 08-08-08 - 19 -
what should be reported, emphasizing measures with a demonstrated relation to traffic safety
such as mean speeds, 85th
percentile speeds, the proportion of speeds exceeding some threshold,
or speed variances under different traffic flow conditions. Cooperation would be needed with
FHWA and State Departments of Transportation (DOTs) since DOTs typically are responsible
for traffic monitoring. Many States may be able to take advantage of existing traffic monitoring
stations to track speed changes on some road types. Costs to design and implement an accurate,
valid, and uniform system across all States would be substantial.
Development Plans: Since State DOTs typically are responsible for traffic monitoring, NHTSA,
FHWA, and GHSA will work with AASHTO to convene a working group in 2008 to review
objectives and resources and develop guidance for appropriate speed reporting capability. Work
will begin by 2009 toward establishing speed monitoring and reporting systems.
4) Law enforcement activities
Law enforcement activities have proven to be among the most effective means for increasing
seat belt use, decreasing impaired driving, and reducing speeding. Congress allocates funds
annually to NHTSA to develop and place national advertisements specifically to support State
and community enforcement activities during the Drunk Driving. Over the Limit. Under Arrest.
emphasis periods. States allocate significant additional funds for seat belt and impaired driving
enforcement activities and associated advertising.
While law enforcement activity – both in periodic high-visibility campaigns and in sustained
year-round operations – is central to priority traffic safety programs, objective and reliable
measures of law enforcement activity are challenging to identify and collect. Measures based on
counts of activities such as checkpoints and saturation patrols can be misleading due to great
variations in the scale and impact of these events. Counts of enforcement hours are complicated
by difficulty in identifying the actual time spent on a specific enforcement emphasis. Measures
based on jurisdictions or populations covered by an enforcement operation lack consideration of
the level of enforcement intensity. Adding to the challenge is the need for measures that are
sensitive to the general deterrent effect of various law enforcement techniques.
To address the need for accurate, reliable, and feasible law enforcement measures, NHTSA and
GHSA have agreed on both short- and longer-term approaches. For the longer term, NHTSA and
GHSA will work with the Pacific Institute for Research and Evaluation (PIRE) to convene an
expert panel, review existing measures, formulate and test potential measures, and identify
methods that meet accuracy, reliability and feasibility requirements. This effort has been initiated
under a NHTSA contract and will be completed in 2009.
In the shorter term, States will report counts of citations and arrests as reasonable indicators of
law enforcement activity. Citation and arrest counts are not ideal measures because they do not
assess the general deterrent effect of enforcement activities. However, citation and arrest counts
do reflect the general commitment level of a law enforcement agency. They provide the most
objective short-term measure of enforcement activity.
Performance Measures for States and Federal Agencies 08-08-08 - 20 -
The availability of citation and arrest data varies among States. DWI arrests are reported
nationally in the FBI uniform crime reports and most States are able to report DWI arrests from
most jurisdictions. Most States do not have a statewide reporting system for speeding or seat belt
citations. However, some jurisdictions in more than 30 States have implemented electronic
citation systems that will greatly improve citation data collection and access in future years.
Development Plans: States will report the number of citations and arrests from all grant-funded
enforcement activities for activity measures A-1, A-2, and A-3 annually beginning with their
2010 Highway Safety Plans and Annual Reports. States will extend reporting as the necessary
reporting technologies and systems are developed and implemented. NHTSA and GHSA will
convene a working group in 2008 to assist States in improving arrest and citation data collection
and reporting. The NHTSA-funded research effort to develop more comprehensive performance
measures for law enforcement activities will be completed in 2009.
Guidance for using performance measures
The following points apply both to the 14 measures in the initial minimum set and to additional
measures to be added as discussed previously.
1) NHTSA, with the assistance of the States, will develop uniform definitions, protocols,
and reporting requirements for each recommended performance measure. This is critical
for measures requiring data that all States do not collect and report at present.
2) NHTSA will assist States in establishing data collection and analysis systems for all
measures that not all States report at present.
3) States will set goals for and report progress on each of the 11 core outcome and behavior
measures annually beginning with their 2010 Highway Safety Plans and Annual Reports.
NHTSA will use the core outcome and behavior measures as an integral part of its
reporting to the Congress, the public, and others.
4) As additional measures from the developmental activities are added to the minimum set,
not all States may be able to implement them immediately.
5) Some behavior and activity measures may be reported only from a portion of a State. For
example, belt use observations currently sample only a portion of each State’s roads.
7) All core outcome and behavior measures should be reported on a calendar year basis.
That is, all counts of fatalities and serious injuries should be from January 1 to December
31 and belt use should be reported for the calendar year in which surveys were
conducted. Activity measures should be reported on a federal fiscal year (October 1 to
September 30) basis.
a. In their Highway Safety Plans, due September 1, States should report outcome
and behavior measures for the most recent calendar year for which data are
available on a timely basis and activity measures for the previous fiscal year. For
example, for the 2010 Highway Safety Plan, due September 1, 2009, States
should report outcome measures for calendar year 2007 and, if FARS data are
available on a timely basis, for 2008. They should report seat belt use data for
2008 and, if data are available on a timely basis, for spring 2009. They should
Performance Measures for States and Federal Agencies 08-08-08 - 21 -
report activity measures for the fiscal year October 1, 2007 to September 30,
2008.
b. In their Annual Reports, due December 31, States should report outcome and
behavior measures for the most recent calendar year for which data are available.
States should report activity measures for the federal fiscal year covered by the
annual report. For example, for the Annual Report due December 31, 2010, States
should report outcome measures for calendar year 2009 and seat belt use data for
2010. They should report activity measures for the federal fiscal year October 1,
2009 to September 30, 2010.
Performance Measures for States and Federal Agencies 08-08-08 - 22 -
References
Fell, JC and Lacey, JH (2004). Traffic Safety Measures for States and Communities. NHTSA
final report.
FHWA (2004). Transportation Performance Measures in Australia, Canada, Japan, and New
Zealand. international.fhwa.dot.gov/performance/04transperfmeasure.pdf.
GHSA (2004). Guidelines for Developing Highway Safety Performance Plans.
www.ghsa.org/html/projects/monitoringguide/ghsamonitoringadvisory.doc.
Lindley, J (2008). Presentation at 2008 Transportation Research Board annual meeting.
NHTSA (2006). Emergency Medical Services Performance Measures Project: Recommended
Attributes and Indicators for System/Service Performance. Draft final report.
OECD (2007). Working Group on Achieving Ambitious Road Safety Targets: Economy-wide
Benefits, Strategies and Actions. Draft final report.
Scovel, CL III (2007). Effectiveness of Federal Drunk Driving Programs. Statement before the
Committee on Environment and Public Works, Subcommittee on Transportation Safety,
Infrastructure Security, and Water Quality, United States Senate, Oct. 25, 2007. Washington,
DC: U.S. Department of Transportation.
epw.senate.gov/public/index.cfm?FuseAction=Files.View&FileStore_id=76d0dae3-d306-489d-
9736-4a8e0a61a33d.
SWOV (2005). State of the Art Report on Road Safety Performance Indicators. SafetyNet Work
Package WP-3: European Road Safety Observatory.
www.erso.eu/safetynet/content/safetynet_results.htm
U.S. Department of Transportation (2006). Announcement of grants to support state traffic safety
information system improvements. Federal Register: February 2, 2006 (Volume 71, Number 22),
pp. 5729-5734.
U.S. Department of Transportation (2007). Audit of the National Highway Traffic Safety
Administration’s Alcohol-Impaired Driving Traffic Safety Program. Report MN-2007-036.
Office of Inspector General, USDOT.
U.S. Government Accountability Office (2007). High-Visibility Enforcement Program Questions
for NHTSA meeting with USGAO on 10-26-2007.
Performance Measures for States and Federal Agencies 08-08-08 - 23 -
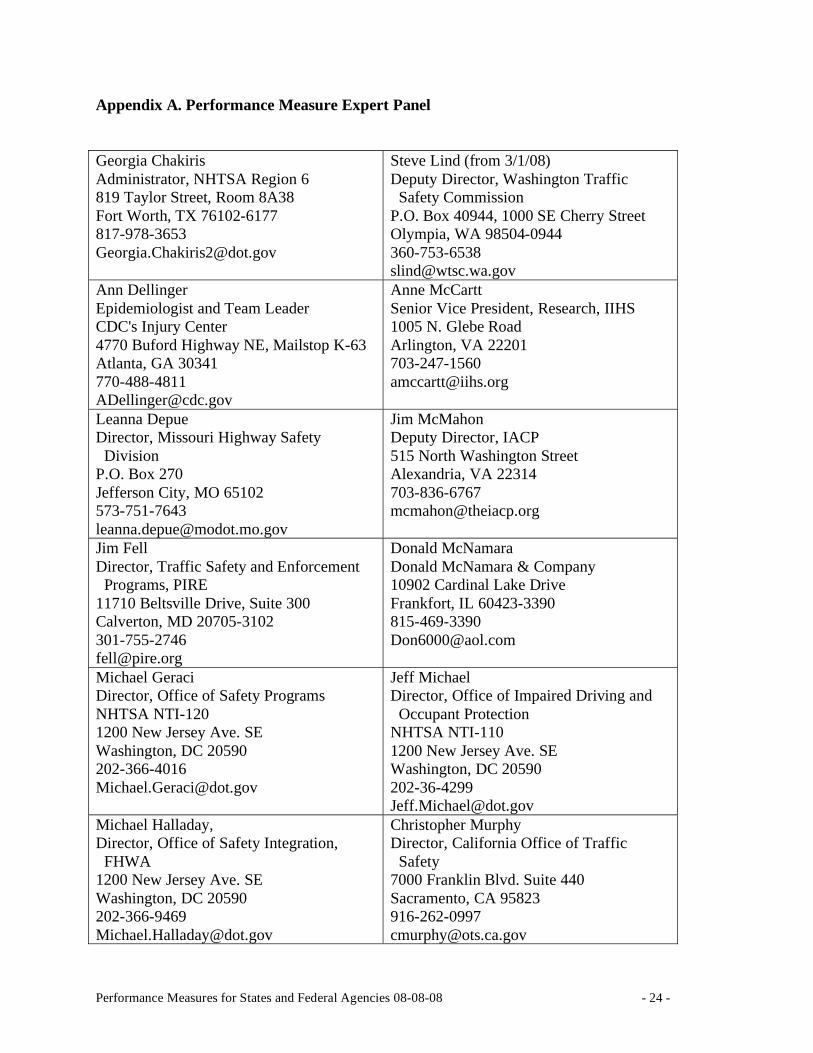
Appendix A. Performance Measure Expert Panel
Georgia Chakiris Steve Lind (from 3/1/08)
Administrator, NHTSA Region 6 Deputy Director, Washington Traffic
819 Taylor Street, Room 8A38 Safety Commission
Fort Worth, TX 76102-6177 P.O. Box 40944, 1000 SE Cherry Street
817-978-3653 Olympia, WA 98504-0944
[email protected] 360-753-6538
Ann Dellinger Anne McCartt
Epidemiologist and Team Leader Senior Vice President, Research, IIHS
CDC's Injury Center 1005 N. Glebe Road
4770 Buford Highway NE, Mailstop K-63 Arlington, VA 22201
Atlanta, GA 30341 703-247-1560
770-488-4811 [email protected]
Leanna Depue Jim McMahon
Director, Missouri Highway Safety Deputy Director, IACP
Division 515 North Washington Street
P.O. Box 270 Alexandria, VA 22314
Jefferson City, MO 65102 703-836-6767
573-751-7643 [email protected]
Jim Fell Donald McNamara
Director, Traffic Safety and Enforcement Donald McNamara & Company
Programs, PIRE 10902 Cardinal Lake Drive
11710 Beltsville Drive, Suite 300 Frankfort, IL 60423-3390
Calverton, MD 20705-3102 815-469-3390
301-755-2746 [email protected]
Michael Geraci Jeff Michael
Director, Office of Safety Programs Director, Office of Impaired Driving and
NHTSA NTI-120 Occupant Protection
1200 New Jersey Ave. SE NHTSA NTI-110
Washington, DC 20590 1200 New Jersey Ave. SE
202-366-4016 Washington, DC 20590
[email protected] 202-36-4299
Michael Halladay, Christopher Murphy
Director, Office of Safety Integration, Director, California Office of Traffic
FHWA Safety
1200 New Jersey Ave. SE 7000 Franklin Blvd. Suite 440
Washington, DC 20590 Sacramento, CA 95823
202-366-9469 916-262-0997
[email protected] [email protected]
Performance Measures for States and Federal Agencies 08-08-08 - 24 -
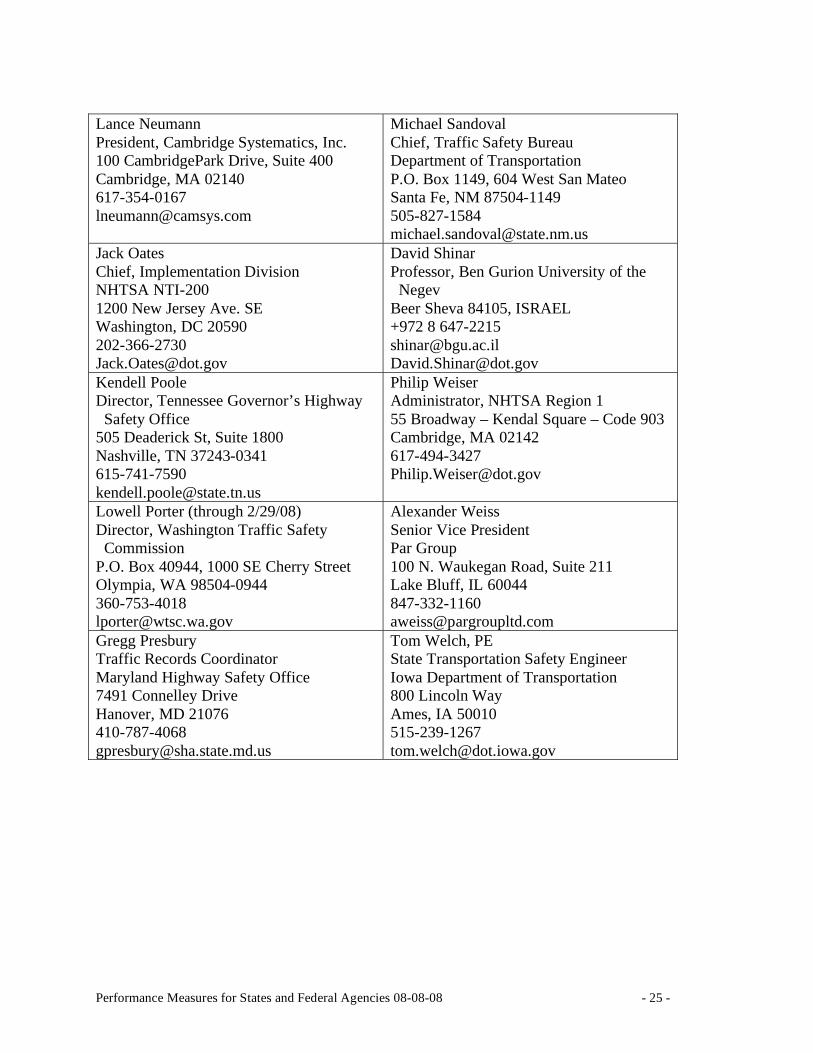
Lance Neumann Michael Sandoval
President, Cambridge Systematics, Inc. Chief, Traffic Safety Bureau
100 CambridgePark Drive, Suite 400 Department of Transportation
Cambridge, MA 02140 P.O. Box 1149, 604 West San Mateo
617-354-0167 Santa Fe, NM 87504-1149
[email protected] 505-827-1584
Jack Oates David Shinar
Chief, Implementation Division Professor, Ben Gurion University of the
NHTSA NTI-200 Negev
1200 New Jersey Ave. SE Beer Sheva 84105, ISRAEL
Washington, DC 20590 +972 8 647-2215
202-366-2730 [email protected]
[email protected] [email protected]
Kendell Poole Philip Weiser
Director, Tennessee Governor’s Highway Administrator, NHTSA Region 1
Safety Office 55 Broadway – Kendal Square – Code 903
505 Deaderick St, Suite 1800 Cambridge, MA 02142
Nashville, TN 37243-0341 617-494-3427
615-741-7590 [email protected]
Lowell Porter (through 2/29/08) Alexander Weiss
Director, Washington Traffic Safety Senior Vice President
Commission Par Group
P.O. Box 40944, 1000 SE Cherry Street 100 N. Waukegan Road, Suite 211
Olympia, WA 98504-0944 Lake Bluff, IL 60044
360-753-4018 847-332-1160
[email protected] [email protected]
Gregg Presbury Tom Welch, PE
Traffic Records Coordinator State Transportation Safety Engineer
Maryland Highway Safety Office Iowa Department of Transportation
7491 Connelley Drive 800 Lincoln Way
Hanover, MD 21076 Ames, IA 50010
410-787-4068 515-239-1267
[email protected] [email protected]
Performance Measures for States and Federal Agencies 08-08-08 - 25 -
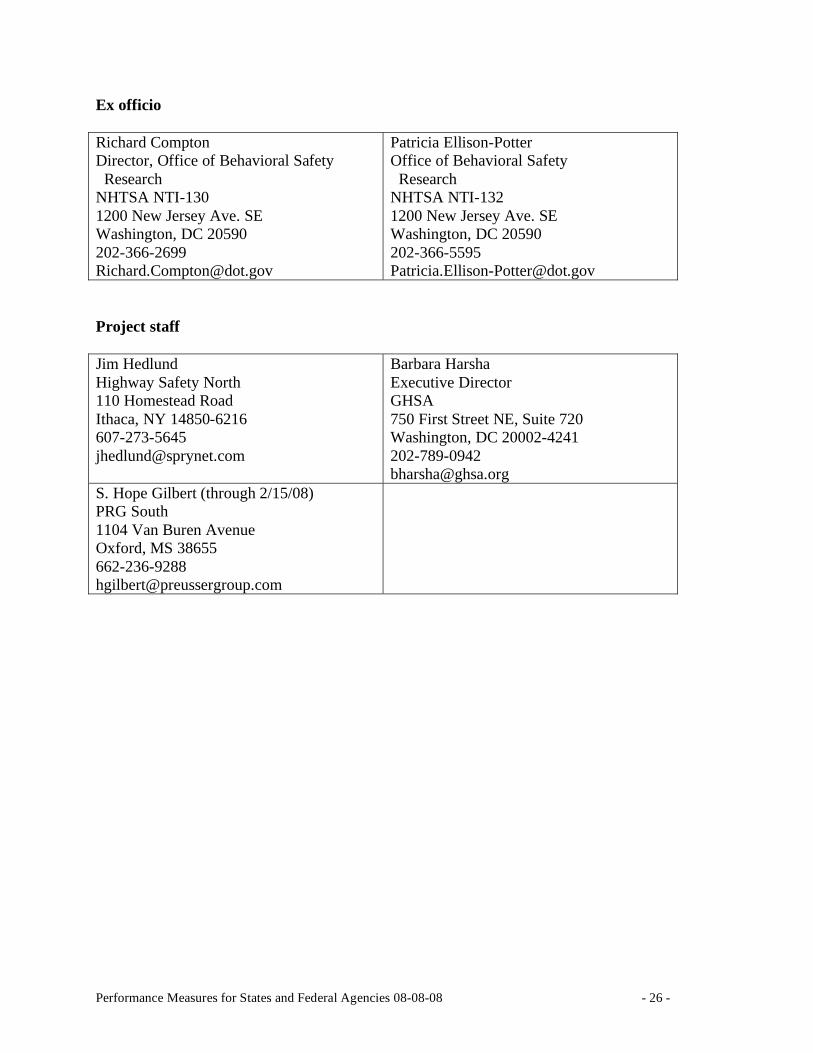
Ex officio
Richard Compton Patricia Ellison-Potter
Director, Office of Behavioral Safety Office of Behavioral Safety
Research Research
NHTSA NTI-130 NHTSA NTI-132
1200 New Jersey Ave. SE 1200 New Jersey Ave. SE
Washington, DC 20590 Washington, DC 20590
202-366-2699 202-366-5595
[email protected] [email protected]
Project staff
Jim Hedlund
Highway Safety North
110 Homestead Road
Ithaca, NY 14850-6216
607-273-5645
Barbara Harsha
Executive Director
GHSA
750 First Street NE, Suite 720
Washington, DC 20002-4241
202-789-0942
S. Hope Gilbert (through 2/15/08)
PRG South
1104 Van Buren Avenue
Oxford, MS 38655
662-236-9288
Performance Measures for States and Federal Agencies 08-08-08 - 26 -
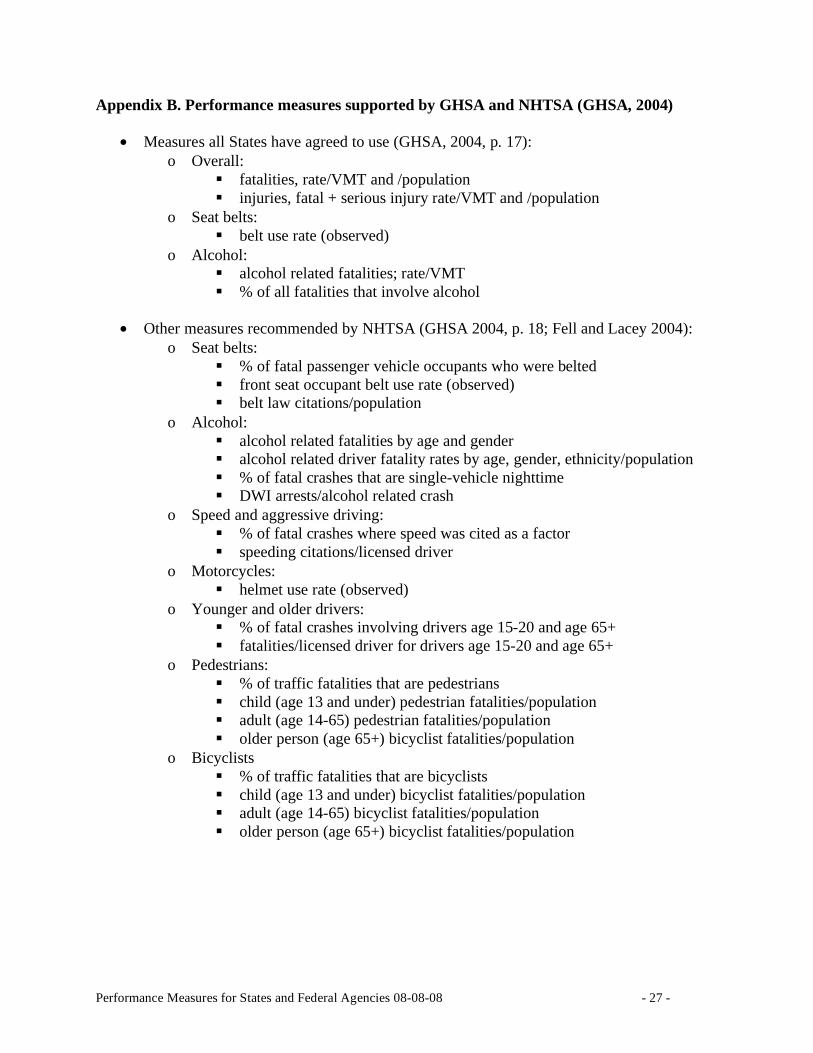
Appendix B. Performance measures supported by GHSA and NHTSA (GHSA, 2004)
• Measures all States have agreed to use (GHSA, 2004, p. 17):
o Overall:
� fatalities, rate/VMT and /population
� injuries, fatal + serious injury rate/VMT and /population
o Seat belts:
� belt use rate (observed)
o Alcohol:
� alcohol related fatalities; rate/VMT
� % of all fatalities that involve alcohol
• Other measures recommended by NHTSA (GHSA 2004, p. 18; Fell and Lacey 2004):
o Seat belts:
� % of fatal passenger vehicle occupants who were belted
� front seat occupant belt use rate (observed)
� belt law citations/population
o Alcohol:
� alcohol related fatalities by age and gender
� alcohol related driver fatality rates by age, gender, ethnicity/population
� % of fatal crashes that are single-vehicle nighttime
� DWI arrests/alcohol related crash
o Speed and aggressive driving:
� % of fatal crashes where speed was cited as a factor
� speeding citations/licensed driver
o Motorcycles:
� helmet use rate (observed)
o Younger and older drivers:
� % of fatal crashes involving drivers age 15-20 and age 65+
� fatalities/licensed driver for drivers age 15-20 and age 65+
o Pedestrians:
� % of traffic fatalities that are pedestrians
� child (age 13 and under) pedestrian fatalities/population
� adult (age 14-65) pedestrian fatalities/population
� older person (age 65+) bicyclist fatalities/population
o Bicyclists
� % of traffic fatalities that are bicyclists
� child (age 13 and under) bicyclist fatalities/population
� adult (age 14-65) bicyclist fatalities/population
� older person (age 65+) bicyclist fatalities/population
Performance Measures for States and Federal Agencies 08-08-08 - 27 -
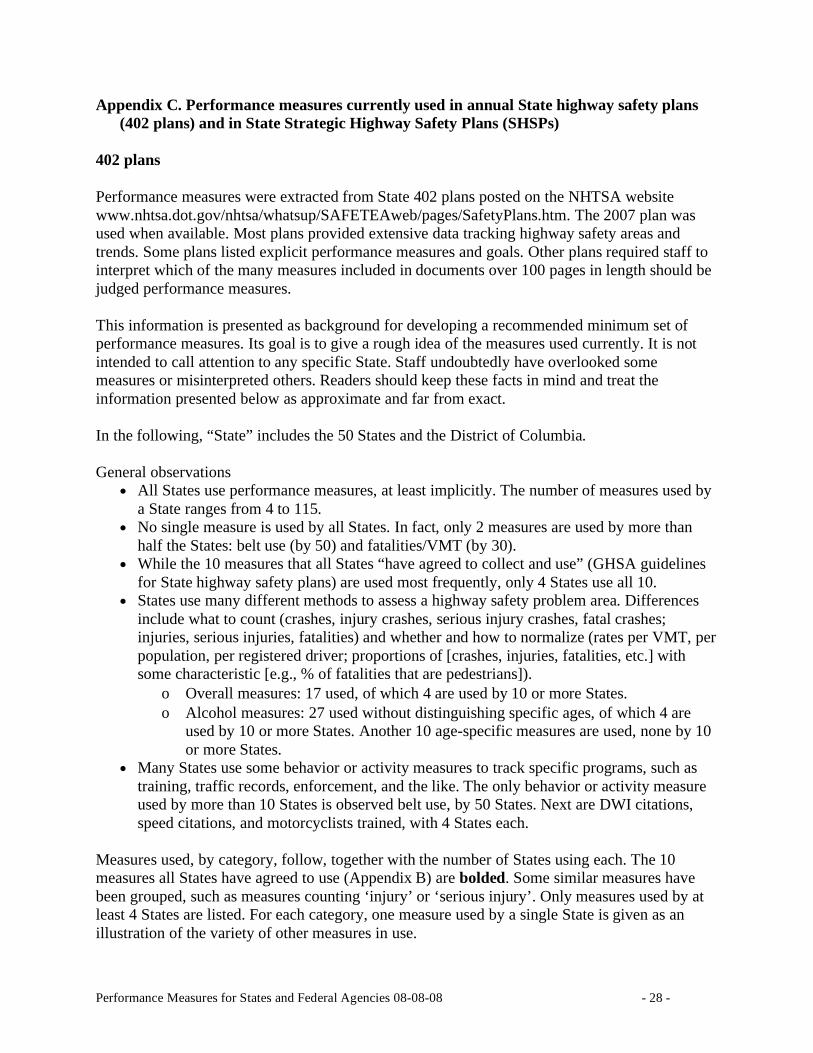
Appendix C. Performance measures currently used in annual State highway safety plans
(402 plans) and in State Strategic Highway Safety Plans (SHSPs)
402 plans
Performance measures were extracted from State 402 plans posted on the NHTSA website
www.nhtsa.dot.gov/nhtsa/whatsup/SAFETEAweb/pages/SafetyPlans.htm. The 2007 plan was
used when available. Most plans provided extensive data tracking highway safety areas and
trends. Some plans listed explicit performance measures and goals. Other plans required staff to
interpret which of the many measures included in documents over 100 pages in length should be
judged performance measures.
This information is presented as background for developing a recommended minimum set of
performance measures. Its goal is to give a rough idea of the measures used currently. It is not
intended to call attention to any specific State. Staff undoubtedly have overlooked some
measures or misinterpreted others. Readers should keep these facts in mind and treat the
information presented below as approximate and far from exact.
In the following, “State” includes the 50 States and the District of Columbia.
General observations
• All States use performance measures, at least implicitly. The number of measures used by
a State ranges from 4 to 115.
• No single measure is used by all States. In fact, only 2 measures are used by more than
half the States: belt use (by 50) and fatalities/VMT (by 30).
• While the 10 measures that all States “have agreed to collect and use” (GHSA guidelines
for State highway safety plans) are used most frequently, only 4 States use all 10.
• States use many different methods to assess a highway safety problem area. Differences
include what to count (crashes, injury crashes, serious injury crashes, fatal crashes;
injuries, serious injuries, fatalities) and whether and how to normalize (rates per VMT, per
population, per registered driver; proportions of [crashes, injuries, fatalities, etc.] with
some characteristic [e.g., % of fatalities that are pedestrians]).
o Overall measures: 17 used, of which 4 are used by 10 or more States.
o Alcohol measures: 27 used without distinguishing specific ages, of which 4 are
used by 10 or more States. Another 10 age-specific measures are used, none by 10
or more States.
• Many States use some behavior or activity measures to track specific programs, such as
training, traffic records, enforcement, and the like. The only behavior or activity measure
used by more than 10 States is observed belt use, by 50 States. Next are DWI citations,
speed citations, and motorcyclists trained, with 4 States each.
Measures used, by category, follow, together with the number of States using each. The 10
measures all States have agreed to use (Appendix B) are bolded. Some similar measures have
been grouped, such as measures counting ‘injury’ or ‘serious injury’. Only measures used by at
least 4 States are listed. For each category, one measure used by a single State is given as an
illustration of the variety of other measures in use.
Performance Measures for States and Federal Agencies 08-08-08 - 28 -
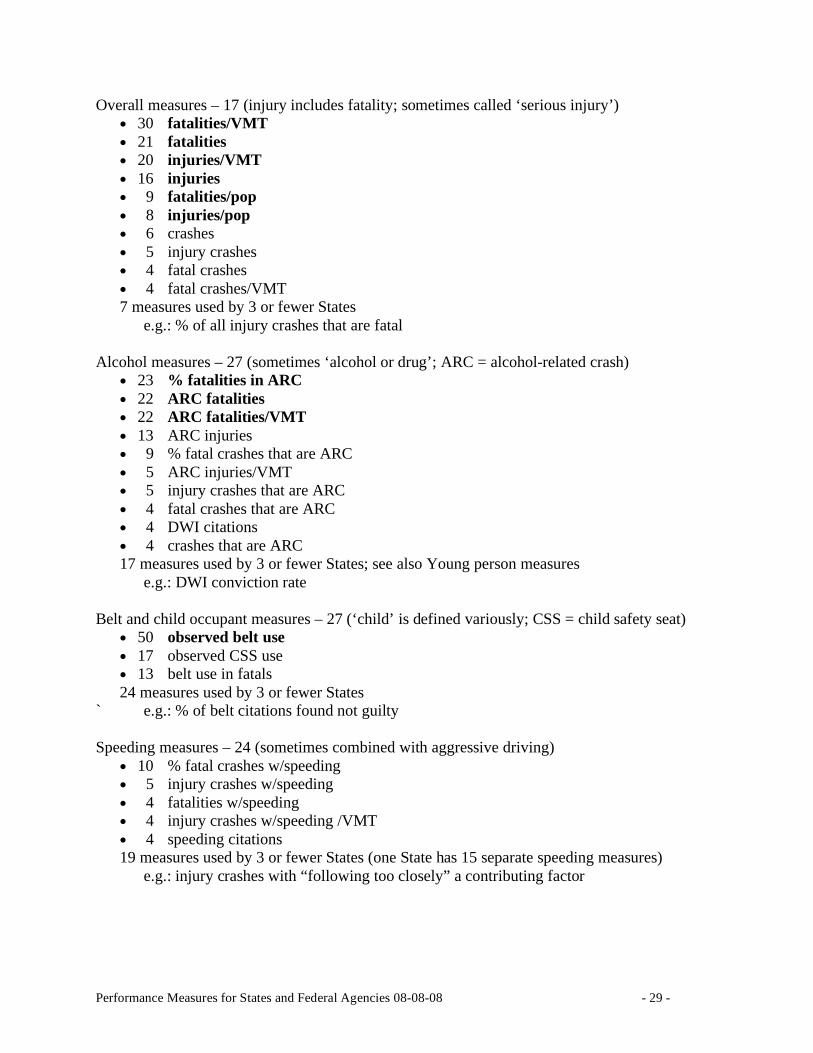
Overall measures – 17 (injury includes fatality; sometimes called ‘serious injury’)
• 30 fatalities/VMT
• 21 fatalities
• 20 injuries/VMT
• 16 injuries
• 9 fatalities/pop
• 8 injuries/pop
• 6 crashes
• 5 injury crashes
• 4 fatal crashes
• 4 fatal crashes/VMT
7 measures used by 3 or fewer States e.g.: % of all injury crashes that are fatal
Alcohol measures – 27 (sometimes ‘alcohol or drug’; ARC = alcohol-related crash)
• 23 % fatalities in ARC
• 22 ARC fatalities
• 22 ARC fatalities/VMT
• 13 ARC injuries
• 9 % fatal crashes that are ARC
• 5 ARC injuries/VMT
• 5 injury crashes that are ARC
• 4 fatal crashes that are ARC
• 4 DWI citations
• 4 crashes that are ARC
17 measures used by 3 or fewer States; see also Young person measures e.g.: DWI conviction rate
Belt and child occupant measures – 27 (‘child’ is defined variously; CSS = child safety seat)
• 50 observed belt use
• 17 observed CSS use
• 13 belt use in fatals
24 measures used by 3 or fewer States
` e.g.: % of belt citations found not guilty
Speeding measures – 24 (sometimes combined with aggressive driving)
• 10 % fatal crashes w/speeding
• 5 injury crashes w/speeding
• 4 fatalities w/speeding
• 4 injury crashes w/speeding /VMT
• 4 speeding citations
19 measures used by 3 or fewer States (one State has 15 separate speeding measures)
e.g.: injury crashes with “following too closely” a contributing factor
Performance Measures for States and Federal Agencies 08-08-08 - 29 -
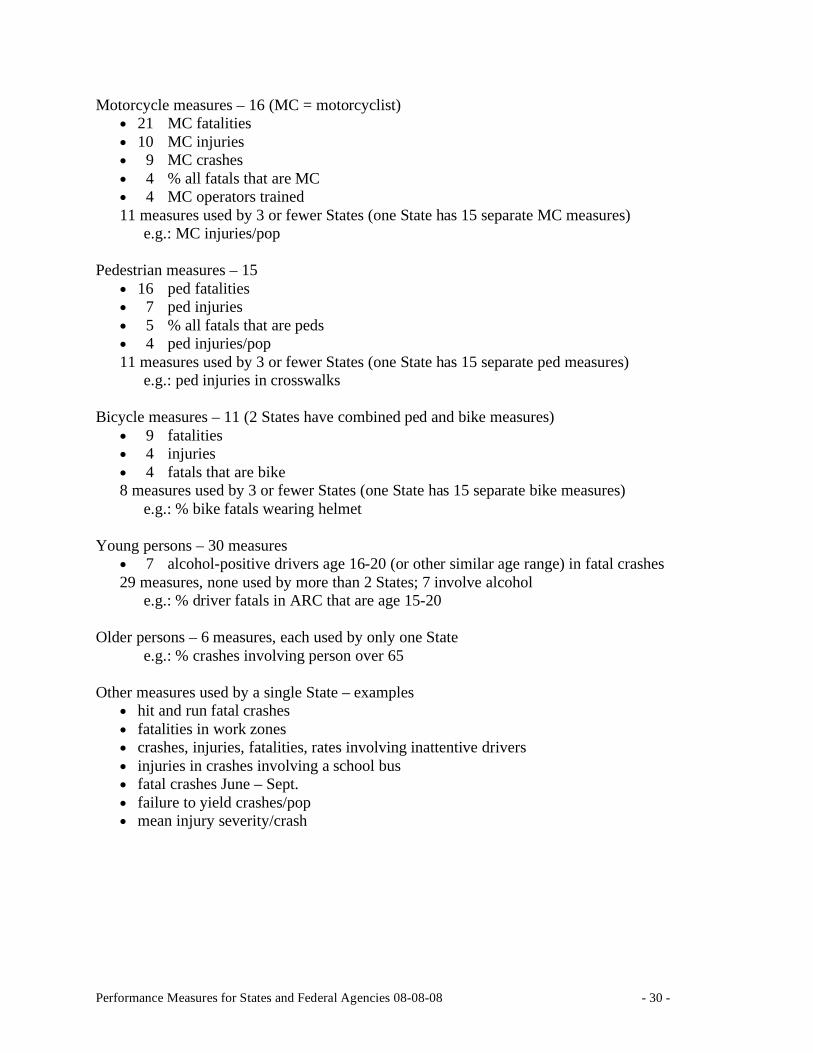
Motorcycle measures – 16 (MC = motorcyclist)
• 21 MC fatalities
• 10 MC injuries
• 9 MC crashes
• 4 % all fatals that are MC
• 4 MC operators trained
11 measures used by 3 or fewer States (one State has 15 separate MC measures)
e.g.: MC injuries/pop
Pedestrian measures – 15
• 16 ped fatalities
• 7 ped injuries
• 5 % all fatals that are peds
• 4 ped injuries/pop
11 measures used by 3 or fewer States (one State has 15 separate ped measures)
e.g.: ped injuries in crosswalks
Bicycle measures – 11 (2 States have combined ped and bike measures)
• 9 fatalities
• 4 injuries
• 4 fatals that are bike
8 measures used by 3 or fewer States (one State has 15 separate bike measures)
e.g.: % bike fatals wearing helmet
Young persons – 30 measures
• 7 alcohol-positive drivers age 16-20 (or other similar age range) in fatal crashes
29 measures, none used by more than 2 States; 7 involve alcohol e.g.: % driver fatals in ARC that are age 15-20
Older persons – 6 measures, each used by only one State
e.g.: % crashes involving person over 65
Other measures used by a single State – examples
• hit and run fatal crashes
• fatalities in work zones
• crashes, injuries, fatalities, rates involving inattentive drivers
• injuries in crashes involving a school bus
• fatal crashes June – Sept.
• failure to yield crashes/pop
• mean injury severity/crash
Performance Measures for States and Federal Agencies 08-08-08 - 30 -
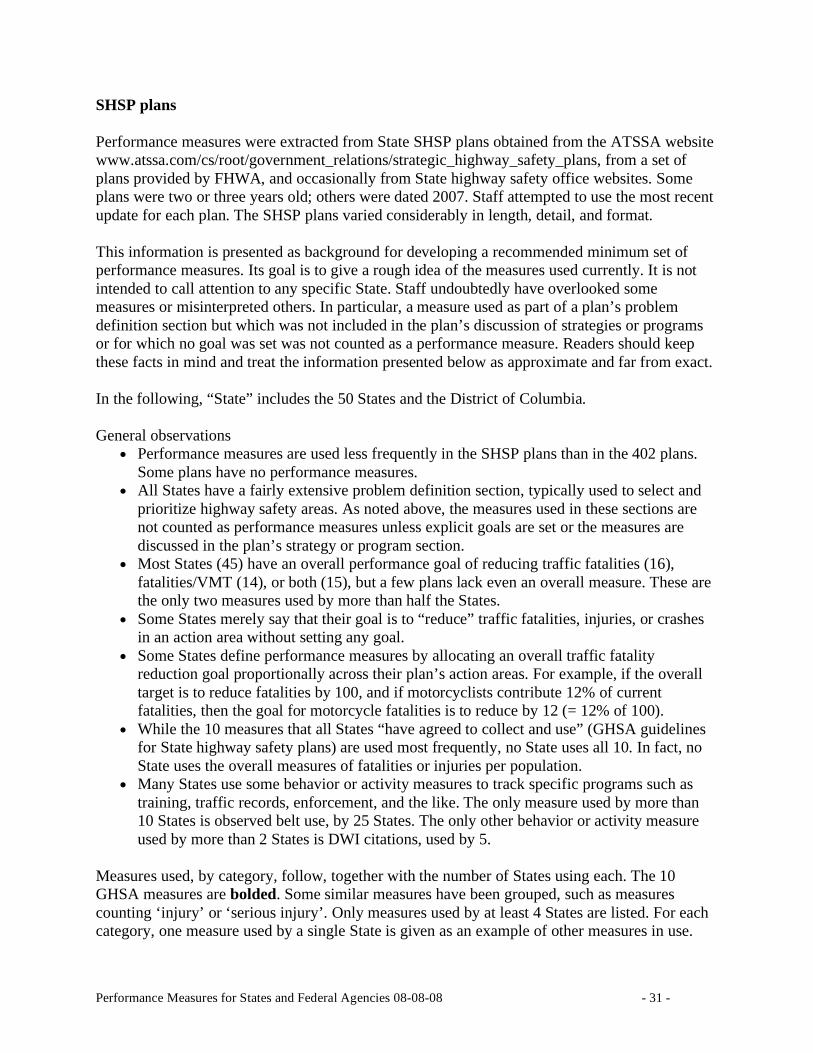
SHSP plans
Performance measures were extracted from State SHSP plans obtained from the ATSSA website
www.atssa.com/cs/root/government_relations/strategic_highway_safety_plans, from a set of
plans provided by FHWA, and occasionally from State highway safety office websites. Some
plans were two or three years old; others were dated 2007. Staff attempted to use the most recent
update for each plan. The SHSP plans varied considerably in length, detail, and format.
This information is presented as background for developing a recommended minimum set of
performance measures. Its goal is to give a rough idea of the measures used currently. It is not
intended to call attention to any specific State. Staff undoubtedly have overlooked some
measures or misinterpreted others. In particular, a measure used as part of a plan’s problem
definition section but which was not included in the plan’s discussion of strategies or programs
or for which no goal was set was not counted as a performance measure. Readers should keep
these facts in mind and treat the information presented below as approximate and far from exact.
In the following, “State” includes the 50 States and the District of Columbia.
General observations
• Performance measures are used less frequently in the SHSP plans than in the 402 plans.
Some plans have no performance measures.
• All States have a fairly extensive problem definition section, typically used to select and
prioritize highway safety areas. As noted above, the measures used in these sections are
not counted as performance measures unless explicit goals are set or the measures are
discussed in the plan’s strategy or program section.
• Most States (45) have an overall performance goal of reducing traffic fatalities (16),
fatalities/VMT (14), or both (15), but a few plans lack even an overall measure. These are
the only two measures used by more than half the States.
• Some States merely say that their goal is to “reduce” traffic fatalities, injuries, or crashes
in an action area without setting any goal.
• Some States define performance measures by allocating an overall traffic fatality
reduction goal proportionally across their plan’s action areas. For example, if the overall
target is to reduce fatalities by 100, and if motorcyclists contribute 12% of current
fatalities, then the goal for motorcycle fatalities is to reduce by 12 (= 12% of 100).
• While the 10 measures that all States “have agreed to collect and use” (GHSA guidelines
for State highway safety plans) are used most frequently, no State uses all 10. In fact, no
State uses the overall measures of fatalities or injuries per population.
• Many States use some behavior or activity measures to track specific programs such as
training, traffic records, enforcement, and the like. The only measure used by more than
10 States is observed belt use, by 25 States. The only other behavior or activity measure
used by more than 2 States is DWI citations, used by 5.
Measures used, by category, follow, together with the number of States using each. The 10
GHSA measures are bolded. Some similar measures have been grouped, such as measures
counting ‘injury’ or ‘serious injury’. Only measures used by at least 4 States are listed. For each
category, one measure used by a single State is given as an example of other measures in use.
Performance Measures for States and Federal Agencies 08-08-08 - 31 -
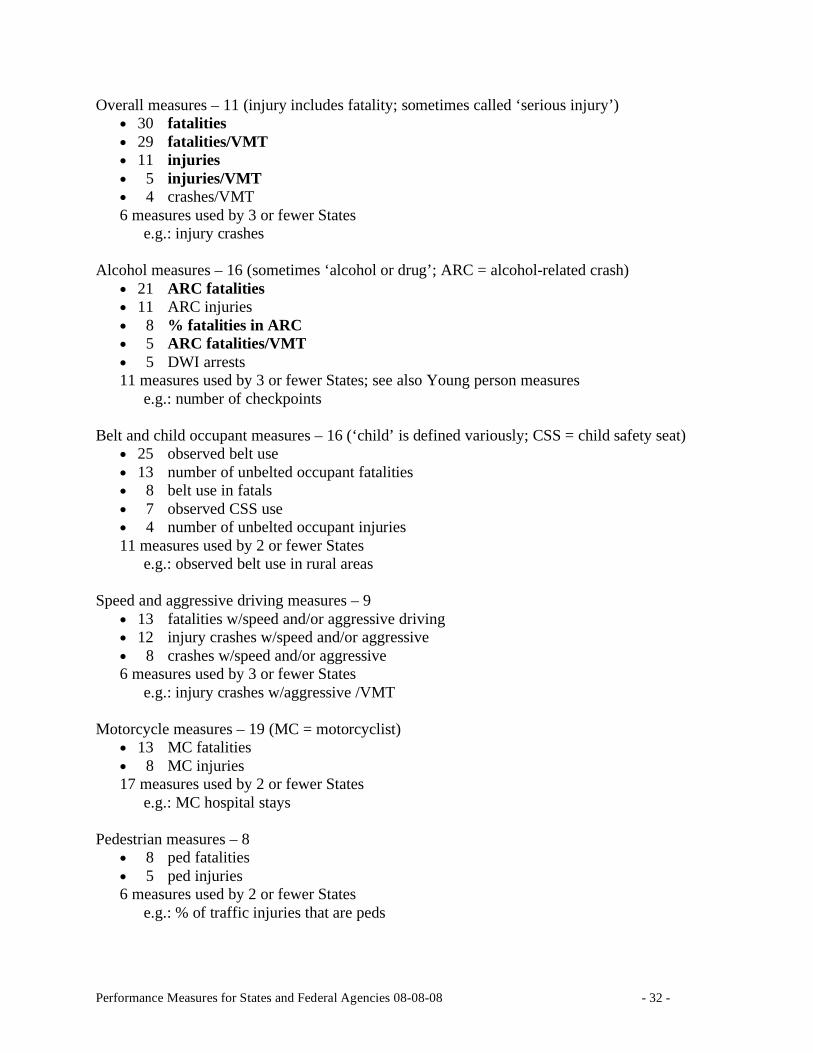
Overall measures – 11 (injury includes fatality; sometimes called ‘serious injury’)
• 30 fatalities
• 29 fatalities/VMT
• 11 injuries
• 5 injuries/VMT
• 4 crashes/VMT
6 measures used by 3 or fewer States e.g.: injury crashes
Alcohol measures – 16 (sometimes ‘alcohol or drug’; ARC = alcohol-related crash)
• 21 ARC fatalities
• 11 ARC injuries
• 8 % fatalities in ARC
• 5 ARC fatalities/VMT
• 5 DWI arrests
11 measures used by 3 or fewer States; see also Young person measures e.g.: number of checkpoints
Belt and child occupant measures – 16 (‘child’ is defined variously; CSS = child safety seat)
• 25 observed belt use
• 13 number of unbelted occupant fatalities
• 8 belt use in fatals
• 7 observed CSS use
• 4 number of unbelted occupant injuries
11 measures used by 2 or fewer States e.g.: observed belt use in rural areas
Speed and aggressive driving measures – 9
• 13 fatalities w/speed and/or aggressive driving
• 12 injury crashes w/speed and/or aggressive
• 8 crashes w/speed and/or aggressive
6 measures used by 3 or fewer States e.g.: injury crashes w/aggressive /VMT
Motorcycle measures – 19 (MC = motorcyclist)
• 13 MC fatalities
• 8 MC injuries
17 measures used by 2 or fewer States e.g.: MC hospital stays
Pedestrian measures – 8
• 8 ped fatalities
• 5 ped injuries
6 measures used by 2 or fewer States e.g.: % of traffic injuries that are peds
Performance Measures for States and Federal Agencies 08-08-08 - 32 -
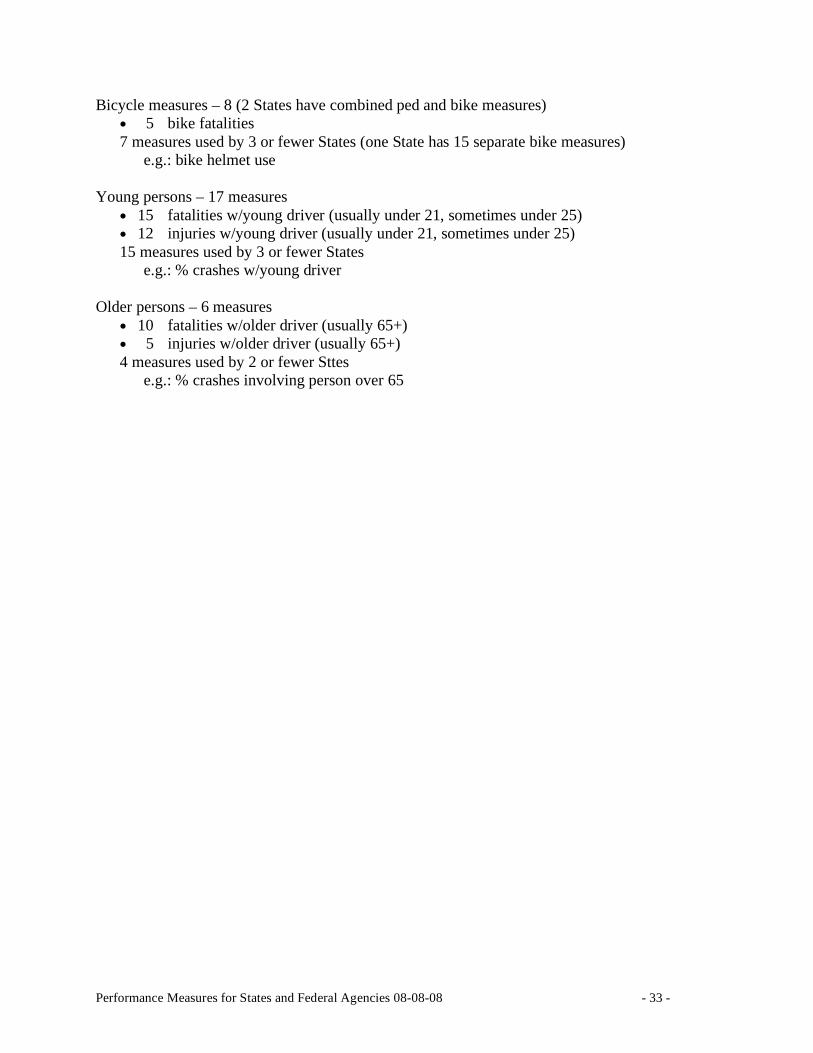
Bicycle measures – 8 (2 States have combined ped and bike measures)
• 5 bike fatalities
7 measures used by 3 or fewer States (one State has 15 separate bike measures)
e.g.: bike helmet use
Young persons – 17 measures
• 15 fatalities w/young driver (usually under 21, sometimes under 25)
• 12 injuries w/young driver (usually under 21, sometimes under 25)
15 measures used by 3 or fewer States e.g.: % crashes w/young driver
Older persons – 6 measures
• 10 fatalities w/older driver (usually 65+)
• 5 injuries w/older driver (usually 65+)
4 measures used by 2 or fewer Sttes e.g.: % crashes involving person over 65
Performance Measures for States and Federal Agencies 08-08-08 - 33 -
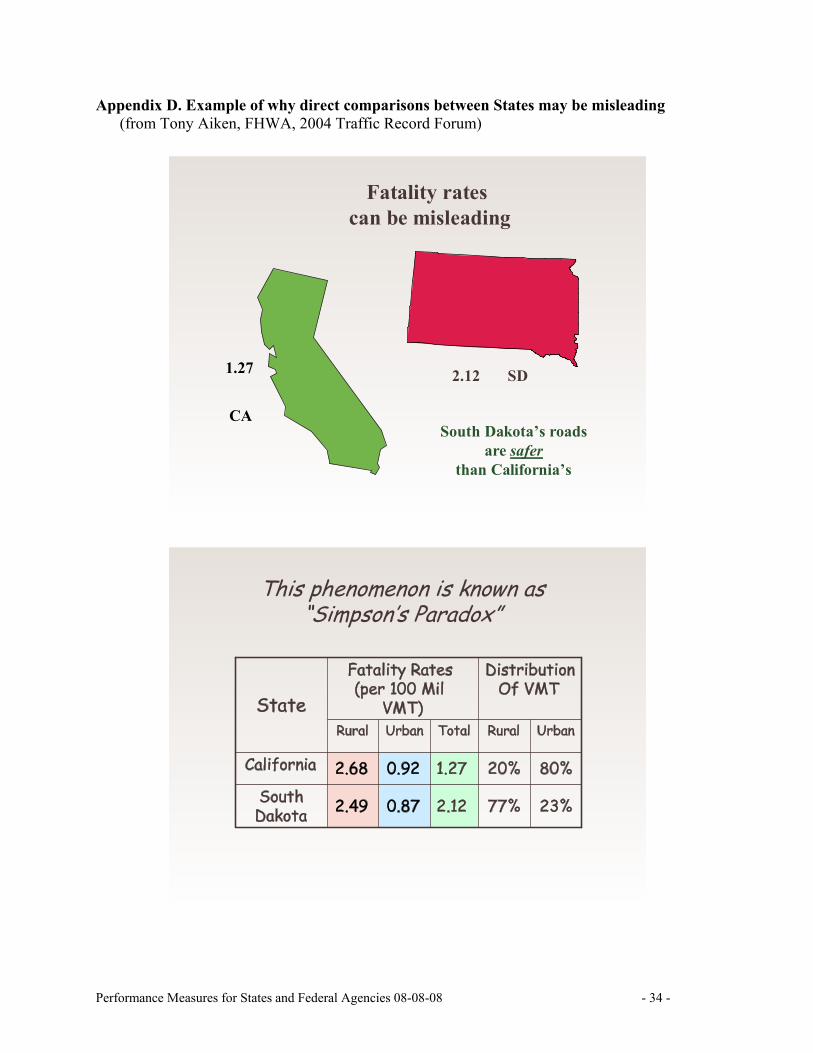
Appendix D. Example of why direct comparisons between States may be misleading (from Tony Aiken, FHWA, 2004 Traffic Record Forum)
1.27 2.12
Fatality rates can be misleading
CA
SD
South Dakota’s roads are safer
than California’s
This phenomenon is known as “Simpson’s Paradox”
State
Fatality Rates (per 100 Mil
VMT)
Distribution Of VMT
Rural Urban Total Rural Urban
California 2.68 0.92 1.27 20% 80%
South Dakota 2.49 0.87 2.12 77% 23%
Performance Measures for States and Federal Agencies 08-08-08 - 34 -
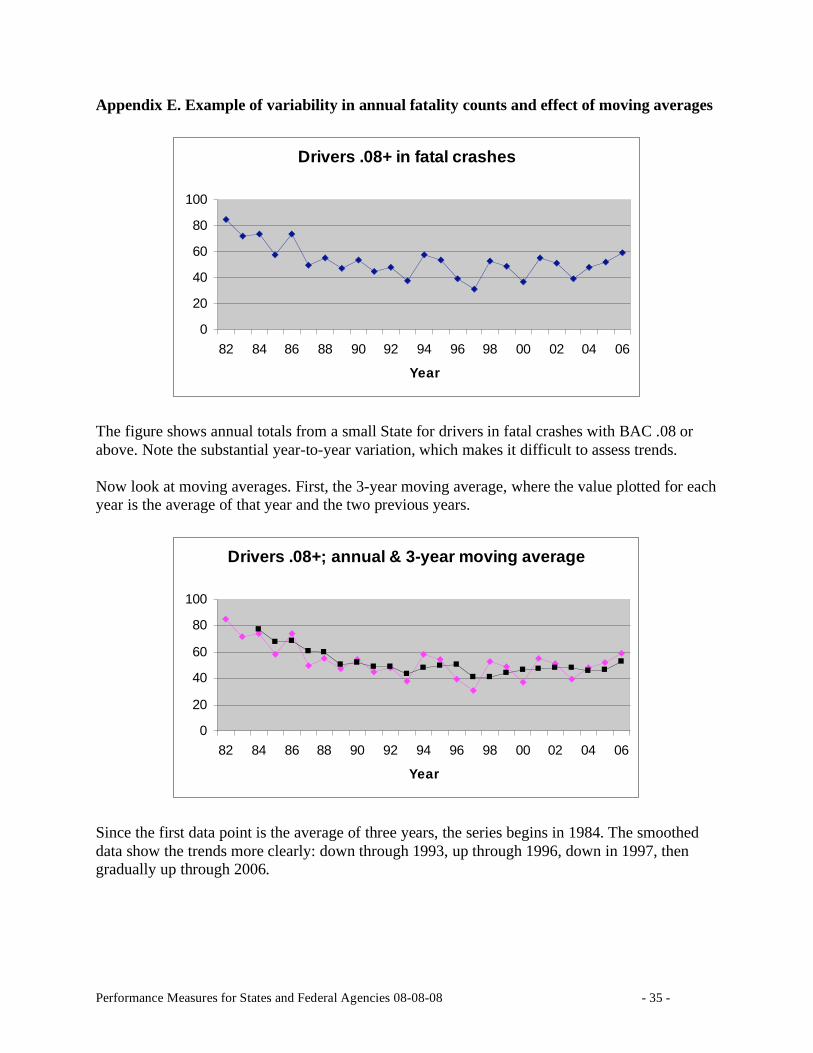
Appendix E. Example of variability in annual fatality counts and effect of moving averages
Drivers .08+ in fatal crashes
0
20
40
60
80
100
82 84 86 88 90 92 94 96 98 00 02 04 06
Year
The figure shows annual totals from a small State for drivers in fatal crashes with BAC .08 or
above. Note the substantial year-to-year variation, which makes it difficult to assess trends.
Now look at moving averages. First, the 3-year moving average, where the value plotted for each
year is the average of that year and the two previous years.
Drivers .08+; annual & 3-year moving average
0
20
40
60
80
100
82 84 86 88 90 92 94 96 98 00 02 04 06
Year
Since the first data point is the average of three years, the series begins in 1984. The smoothed
data show the trends more clearly: down through 1993, up through 1996, down in 1997, then
gradually up through 2006.
Performance Measures for States and Federal Agencies 08-08-08 - 35 -
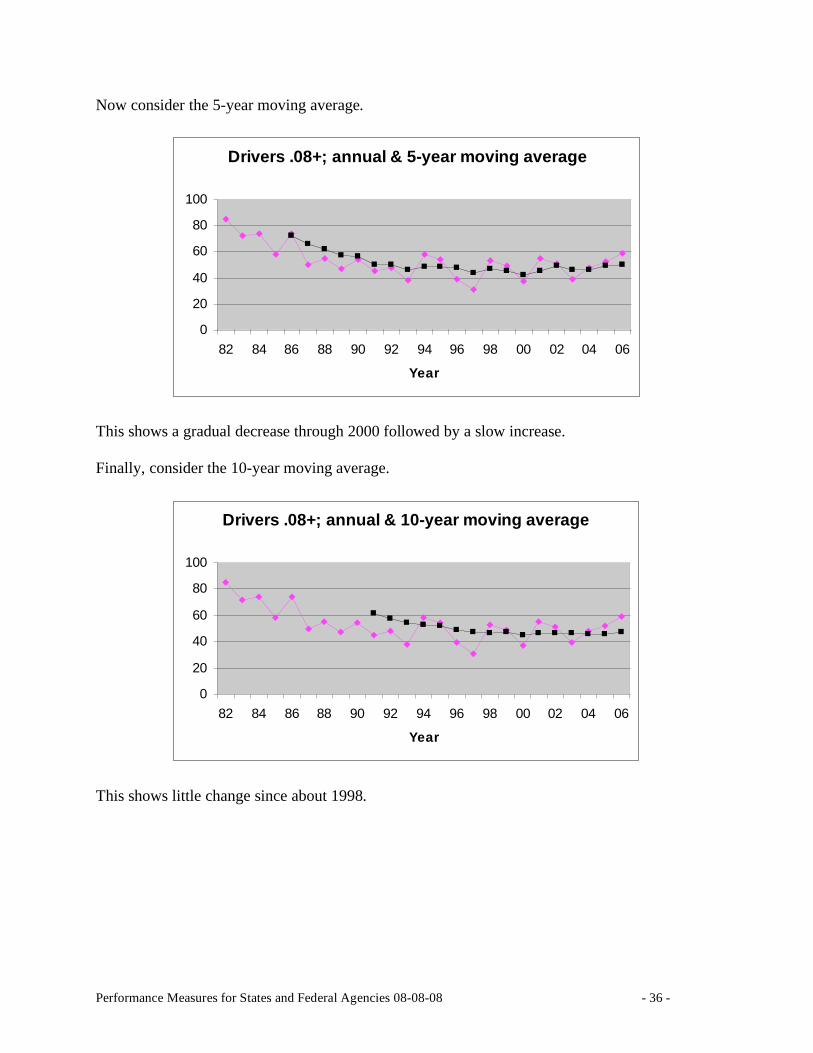
Now consider the 5-year moving average.
Drivers .08+; annual & 5-year moving average
0
20
40
60
80
100
82 84 86 88 90 92 94 96 98 00 02 04 06
Year
This shows a gradual decrease through 2000 followed by a slow increase.
Finally, consider the 10-year moving average.
Drivers .08+; annual & 10-year moving average
0
20
40
60
80
100
82 84 86 88 90 92 94 96 98 00 02 04 06
Year
This shows little change since about 1998.
Performance Measures for States and Federal Agencies 08-08-08 - 36 -
Appendix F. Extracts from FHWA (2004), Transportation Performance Measures in
Australia, Canada, Japan, and New Zealand
General observations (bold in the original).
1. ... the processes of setting priorities and making planning, investment, and management
decisions are based on, or use, performance measures to a much greater extent than is
typical in the United States.
4. Transportation officials appeared to have a general understanding of the distinction between
the concepts of outcomes and outputs. Outcomes were viewed as the ultimate characteristic
of transportation system performance, while outputs were the products and services of the
organizations that led to these outcomes.
5. ...transportation officials explained the initial movement toward performance measurement as
a means of providing greater accountability and visibility to the public of their agency’s
activities.
8. In Japan, the national ministry established a core set of 17 performance measures as a guide
for all regional offices and prefectures (states) in the country. This was an example of a
phenomenon common to all applications – the need and desire to determine a small set of
measures that were really important to an agency.
18. The key measure of success for performance measurement itself is the degree to which it
influences decisions and budget allocation.
Lessons for the United States.
1. Safety was viewed as a strategic use of performance measurement that has resulted in a
significant decline in fatalities. A great deal can be learned from this application of
performance measurement, especially as it relates to the identification of strategies and
actions that need to be put in place to achieve reductions in road fatalities.
2. Meaningful performance measurement is a product of extensive outreach, discussion, and
collaboration with partners. Performance measures are readily available and easy to create,
but without a comprehensive (internal and external) outreach process their value as a
behavioral influencer is limited. Open, inclusive planning processes are fundamental to good
performance measurement.
3. In the best examples of performance measurement, officials were still refining what
measures to use, and how to make sense of the political guidance they received. This
suggested that performance-based planning an decision-making are never-ending processes.
4. The key to success for measurement is accountability. This translates into the need for
understandable measures and systematic follow-through to determine the level of failure or
success in meeting the objectives defined by the measures. This issue is important across all
transportation areas, but has particular short-term relevance and application in the safety area.
5. Performance measurement is most relevant when linked to decision-making, especially
resource allocation.
7. For safety, enforcement strategies were the key to changing driving behavior and
affecting overall success.
12. Do not measure too many things.
Performance Measures for States and Federal Agencies 08-08-08 - 37 -
DOT HS 811 025 August 2008