Deutsche Bank screenshow template - db.com · — New business segment of Deutsche Bank Group ......
30
Deutsche Bank Investor Day, Frankfurt, 12 September 2012 Financial foundation Stefan Krause, Chief Financial Officer
Transcript of Deutsche Bank screenshow template - db.com · — New business segment of Deutsche Bank Group ......

Deutsche Bank
Investor Day, Frankfurt, 12 September 2012
Financial foundation Stefan Krause, Chief Financial Officer
financial transparency. Stefan Krause Investor Day, Frankfurt, 12 September 2012
Deutsche Bank Investor Relations
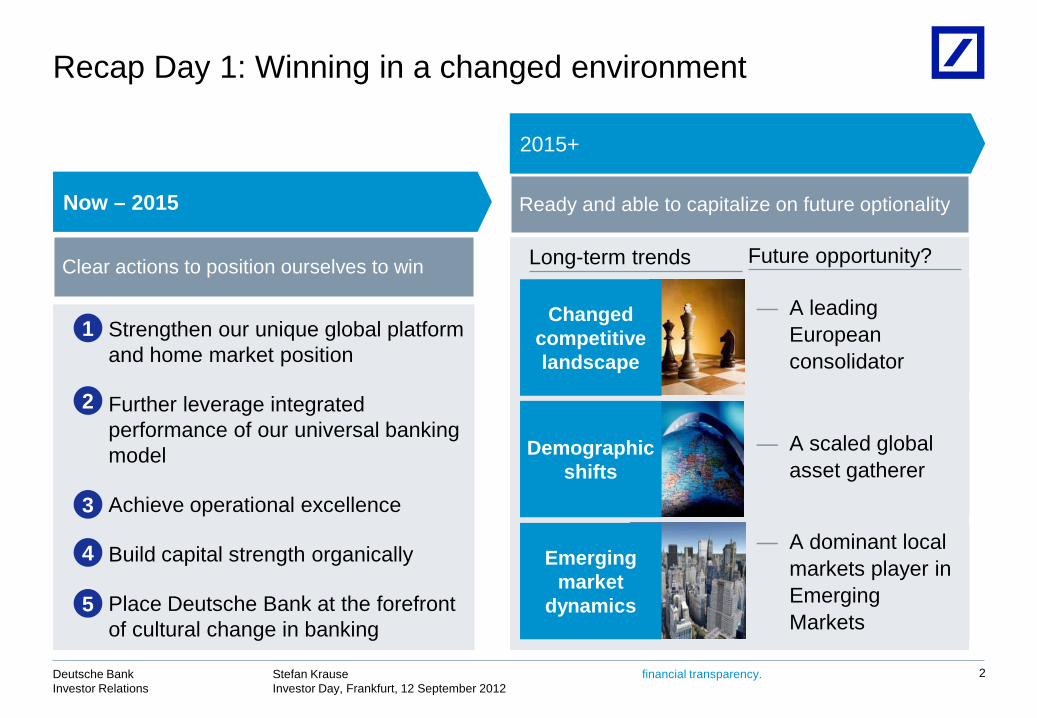
Recap Day 1: Winning in a changed environment
2
Strengthen our unique global platform and home market position
Further leverage integrated performance of our universal banking model
Achieve operational excellence
Build capital strength organically
Place Deutsche Bank at the forefront of cultural change in banking
1
2
3
4
5
Now – 2015
Clear actions to position ourselves to win
2015+
Ready and able to capitalize on future optionality
Long-term trends Future opportunity?
Changed competitive landscape
Demographic shifts
Emerging market
dynamics
— A leading European consolidator
— A scaled global asset gatherer
— A dominant local markets player in Emerging Markets

financial transparency. Stefan Krause Investor Day, Frankfurt, 12 September 2012
Deutsche Bank Investor Relations
Agenda
3
Non-Core Operations unit
1 Financial overview 2015
Operational Excellence Program
2
4
Strong liquidity and funding profile 5
Capital toolbox 3
financial transparency. Stefan Krause Investor Day, Frankfurt, 12 September 2012
Deutsche Bank Investor Relations
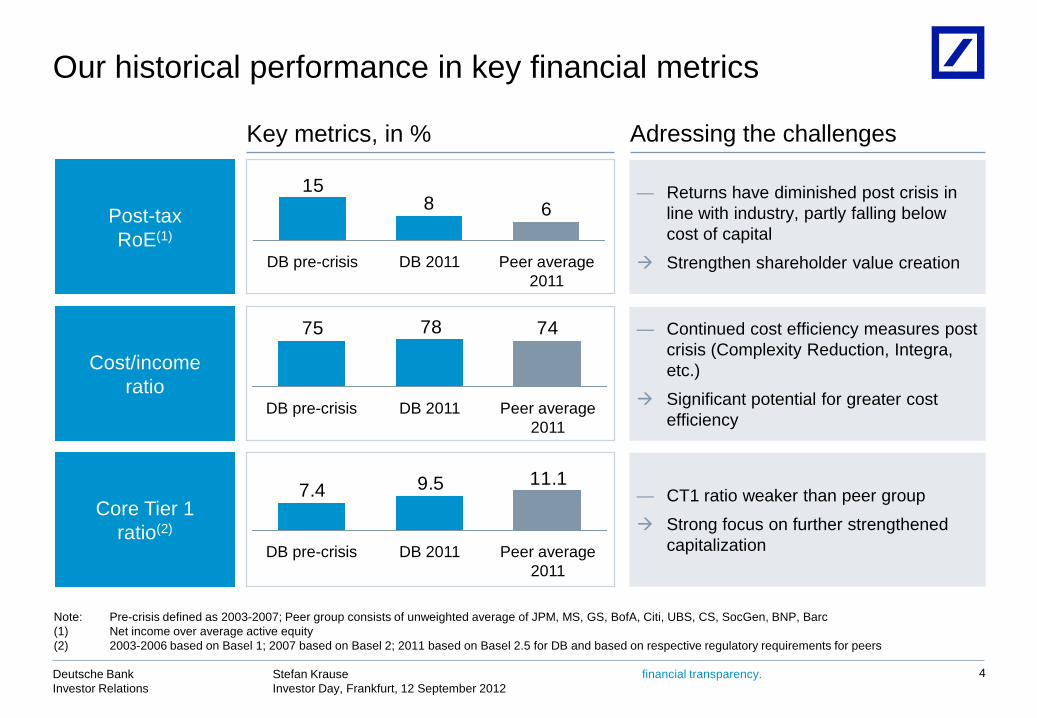
6815
Peer average 2011
DB 2011 DB pre-crisis
Post-tax RoE(1)
— Returns have diminished post crisis in line with industry, partly falling below cost of capital
Strengthen shareholder value creation
Our historical performance in key financial metrics
11.19.57.4
Peer average 2011
DB 2011
DB pre-crisis
Core Tier 1 ratio(2)
Cost/income ratio
— Continued cost efficiency measures post crisis (Complexity Reduction, Integra, etc.)
Significant potential for greater cost efficiency
— CT1 ratio weaker than peer group
Strong focus on further strengthened capitalization
747875
Peer average 2011
DB 2011
DB pre-crisis
Note: Pre-crisis defined as 2003-2007; Peer group consists of unweighted average of JPM, MS, GS, BofA, Citi, UBS, CS, SocGen, BNP, Barc (1) Net income over average active equity (2) 2003-2006 based on Basel 1; 2007 based on Basel 2; 2011 based on Basel 2.5 for DB and based on respective regulatory requirements for peers
4
Key metrics, in % Adressing the challenges
financial transparency. Stefan Krause Investor Day, Frankfurt, 12 September 2012
Deutsche Bank Investor Relations
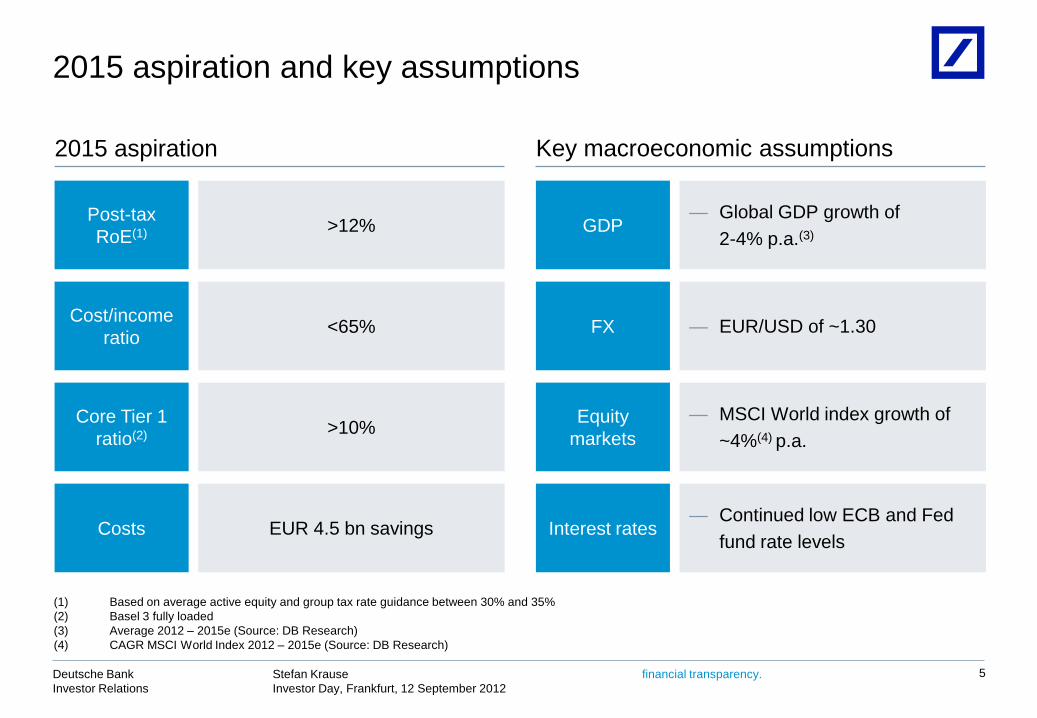
2015 aspiration and key assumptions
— EUR/USD of ~1.30 FX
— MSCI World index growth of ~4%(4) p.a.
Equity markets
— Continued low ECB and Fed fund rate levels
Interest rates
— Global GDP growth of 2-4% p.a.(3) GDP
EUR 4.5 bn savings
Costs
<65% Cost/income ratio
>12% Post-tax RoE(1)
>10% Core Tier 1 ratio(2)
(1) Based on average active equity and group tax rate guidance between 30% and 35% (2) Basel 3 fully loaded (3) Average 2012 – 2015e (Source: DB Research) (4) CAGR MSCI World Index 2012 – 2015e (Source: DB Research)
5
2015 aspiration Key macroeconomic assumptions

financial transparency. Stefan Krause Investor Day, Frankfurt, 12 September 2012
Deutsche Bank Investor Relations
New Deutsche Bank – Overview of changes in segment composition
6
(1) Consolidation & Adjustments: No business activities, but fully included in “Operating Businesses” figures throughout this document (2) Adjustment to coverage cost allocation following the closer integration of these activities under project Integra
1
2
3
Reassignment of management responsibilities for non-core operations
Changes to the allocation of coverage costs to reflect new organizational responsibilities(2)
Reassignment of management responsibilities for asset-gathering business
GTB CB&S AWM PBC C&A(1) CI
Non-Core Operations
Operating Businesses
GTB CB&S AWM PBC C&A(1)
1
2 3
New segmentation effective from 4Q2012

financial transparency. Stefan Krause Investor Day, Frankfurt, 12 September 2012
Deutsche Bank Investor Relations
Focus on improving value creation in new Operating Businesses(1)
>15%
13%
2015 aspiration
<65%
2011
72%
(1) Consolidation & Adjustments fully included (2) 2011 based on Basel 2, domestic statutory tax rate of 30.8% and average active equity; 2015 based on Basel 3 fully loaded, group tax rate guidance between 30%
and 35% and average active equity
7
SPLIT OPERATING vs. NON-CORE INDICATIVE
Post-tax RoE(2) Cost/income ratio
2015 aspiration
2011

financial transparency. Stefan Krause Investor Day, Frankfurt, 12 September 2012
Deutsche Bank Investor Relations
Overview on aspirations for our Operating Businesses(1)
(1) All numbers exclude Non-Core Operations unit; 2011 numbers already reflect re-segmentation and will therefore not reconcile to reported numbers (2) 2011 based on Basel 2 and domestic statutory tax rate of 30.8%; 2015 based on Basel 3 fully loaded and group tax rate guidance between 30% and 35% (3) Assumes overall bank capitalization consistent with an 8% CET1 ratio under Basel 3 fully loaded and Basel 3 RWA impact commensurate with year-end 2012 targets.
Based on 2011 domestic statutory tax rate of 30.8% (4) RWA plus equivalent of items currently deducted 50/50 from Tier 1/Tier 2 capital whereby the Tier 1 deduction amount is scaled at 10% (5) Based on pro-forma Basel 3 (6) Based on Basel 2.5
8
SPLIT OPERATING vs. NON-CORE INDICATIVE
CB&S GTB
2011 2015 aspiration
Post-tax RoE(2) 11%(3)/16% ~15%
CIR 71% <65%
RWA equivalent(4), in EUR bn 184(6)/244(5) <200(5)
2011 2015 aspiration
IBIT, in EUR bn 1.0 ~2.4
AWM PBC
2011 2015 aspiration
IBIT, in EUR bn 0.8 ~1.7
2011 2015 aspiration
IBIT, in EUR bn 2.0 ~3.0
CIR 68% ~60%

financial transparency. Stefan Krause Investor Day, Frankfurt, 12 September 2012
Deutsche Bank Investor Relations
Agenda
9
Non-Core Operations unit
1 Financial overview 2015
Operational Excellence Program
2
4
Strong liquidity and funding profile 5
Capital toolbox 3

financial transparency. Stefan Krause Investor Day, Frankfurt, 12 September 2012
Deutsche Bank Investor Relations
Non-Core Operations unit – Rationale and governance
— Improve external transparency on non-core positions — Increase management focus on underlying operating businesses — Accelerate de-risking
Rationale
Governance
Organization
Mandate
— New business segment of Deutsche Bank Group — One-time, irreversible assignment of assets to the business
segment – ring-fenced but with no change in legal entity ownership — Clearly defined and independent management team, utilizing
existing business expertise and infrastructure — Aligned incentives and de-risking objectives
— Wind down/exit assets to achieve deleveraging to free up capital — Protect shareholder value — Success measured on achieving de-risking and capital deployment — Specific KPIs to be developed to track progress
10

financial transparency. Stefan Krause Investor Day, Frankfurt, 12 September 2012
Deutsche Bank Investor Relations
Non-Core Operations unit – Overview of selection criteria and scope
Trading — Portfolios of trading assets, and trading assets reclassified under IAS 39, which are no longer operating business activities
Operating assets
— Stakes in non tradable operating companies where Deutsche Bank has influence/control
Portfolio run-off
— Portfolios in run-off which require administration from Deutsche Bank
Scope of Non-Core
Operations
— Non-core operations for Deutsche Bank going forward — Troubled assets from operating businesses — Assets in run-off mode or where exit is already identified as the preferred route — Suitable for separation — Significant capital absorption with sub-standard returns — Liabilities of businesses in run-off
Clear Selection Criteria
11

financial transparency. Stefan Krause Investor Day, Frankfurt, 12 September 2012
Deutsche Bank Investor Relations
Significant planned RWA equivalent reduction in Non-Core Operations unit
<90
Mar 2013
~100
~1 ~10 ~30
~60
Jun 2012
~125
~1
Dec 2015 Dec 2014 Dec 2013
~20 ~35
~70
PBC
— Trading: Postbank structured credit portfolio
— Assets and liabilities in run-off: non-core portfolios
AWM — Assets in run-off: Sal. Oppenheim workout credit portfolio
CI
— Trading: BHF bond portfolio — Operating Assets: Actavis,
Cosmopolitan, Maher, BHF, real estate assets, industrial holdings
CB&S
— Trading: securitization portfolio — Assets in run-off: CB&S monoline,
legally and regulatory challenged investments
— IAS 39 reclassified assets
IFRS assets, in EUR bn
Pro-forma Basel 3 RWA equivalent(1), in EUR bn
12
Major Components Size of Non-Core Operations unit
Dec 2015 Dec 2014 Dec 2013
<80
Mar 2013
~90
~2 ~5
~13
~70
Jun 2012
~135
~3 ~13 ~20
~100
Note: Numbers may not add up due to rounding (1) RWA plus equivalent of items currently deducted 50/50 from Tier 1/Tier 2 capital whereby the Tier 1 deduction amount is scaled at 10%
SPLIT OPERATING vs. NON-CORE INDICATIVE

financial transparency. Stefan Krause Investor Day, Frankfurt, 12 September 2012
Deutsche Bank Investor Relations
Agenda
13
Non-Core Operations unit
1 Financial overview 2015
Operational Excellence Program
2
4
Strong liquidity and funding profile 5
Capital toolbox 3

financial transparency. Stefan Krause Investor Day, Frankfurt, 12 September 2012
Deutsche Bank Investor Relations
Current and targeted Core Tier 1 ratio well above regulatory minimum
31 Dec 2011
2%
~10.0% (phased-in) 10.2%
9.5%
2%
31 Mar 2013
4% 3.5%
30 Jun 2012 1 Jan 2019
4.5%
2.5%
≤ 2.5%
≤ 2.5%
31 Dec 2015
4.5%
31 Dec 2014
Countercyclical buffer (1),(2)
G-SIB additional buffer requirement(1),(3)
Capital conservation buffer (1),(4)
Minimum CET1 requirement
Deutsche Bank
Regulatory minimum under Basel rules
(1) Pro-rata phased-in between 1 January 2016 and year-end 2018, becoming fully effective on 1 January 2019 (2) Can be deployed on an infrequent basis by national jurisdictions when excessive aggregate credit growth is determined, weighted average of buffers deployed
across all jurisdictions to which DB has credit exposures (3) Global systemically important banks buffer: Actual amount not yet fixed, actual level depends on regulators’ judgment of global systemic importance; based on
preliminary judgment buffer varies between 1% and 2.5%, further bucket with 3.5% buffer currently not populated (4) Should be held outside periods of stress; can be drawn down in periods of stress if discretionary distributions of earnings are reduced
14
Basel 2.5 Basel 3
3 years of retained earnings
≥ 8% (fully loaded)
fully loaded
>10% fully
loaded

financial transparency. Stefan Krause Investor Day, Frankfurt, 12 September 2012
Deutsche Bank Investor Relations
1Q2013 Basel 3 simulation(1) (fully loaded) In EUR bn
10.2%
Capital toolbox provides further flexibility
373 397
31 Mar 2013 Basel 3
fully loaded
Capital demand
measures by 31 Mar 2013
(85) (29)(4)
Basel 3 after targeted
mgmt. action
109(2)
56(3)
30 Jun 2012 Basel 2.5
38
31
31 Mar 2013
Basel 3 fully
loaded
>32
Available capital supply
measures by 31 Mar
2013
Net income
(2H2012 and
1Q2013)
31 Mar 2013
excl. net income
Dividend accrual and cost of add. mgmt.
action(6)
(1)
Basel 3 impact(5)
(6)
30 Jun 2012
Basel 2.5
≥ 8.0%
Note: Numbers may not add up due to rounding (1) Subject to final Basel rules and European/German implementation of the revised framework (2) Includes Basel 3 charges in relation to CVA, CCR, CCP, etc.; under phase-in Basel 3 impact would increase by EUR 10 bn RWA due to higher 10%/15% threshold (3) Securitizations (4) Additional management action announced on 31 July (5) Includes add-back of Basel 2.5 deductions on securitization positions and significant investment in financial institutions (6) Includes 75 ct per share dividend and reflects impact from change of 10%/15% threshold
15
Pro-forma RWA Pro-forma Core Tier 1 capital
7.7%
xx% Core Tier 1 ratio

financial transparency. Stefan Krause Investor Day, Frankfurt, 12 September 2012
Deutsche Bank Investor Relations
Capital toolbox - Planned usage focused on capital demand
Planned by 31 Mar 2013
Identified potential
Identified potential
Portfolio optimization
— Rightsizing of core portfolios — Optimizing risk mitigation
~17 bn
Roll out of advanced models — Regulatory roll-out program — Improved treatment of derivatives — Subject to BaFin approval
~31 bn
Improvement of operating model — Data & processes — Trade capture
~15 bn
Non-Core Operations (See next page) ~135 bn
~45 bn
~45 bn(2)
Up to 1.2 bn(4)
Capital toolbox potential continuously updated – Usage of toolbox subject to management discretion
Note: Numbers may not add up due to rounding (1) RWA plus equivalent of items currently deducted 50/50 from Tier 1/Tier 2 capital whereby the Tier 1 deduction amount is scaled at 10% (2) Including EUR 1 bn of RWA equivalent of expected loss shortfall and 4 bn in relation to Basel 3 management action (3) Not yet including shares without pre-emptive rights which could be issued to further develop equity compensation programs (4) Executable by 31 Mar 2013
16
Capital demand Pro-forma Basel 3 RWA equivalent(1) relief, in EUR
Capital supply CET 1 capital formation, in EUR
— DTA reduction
Available capital supply measures (not in Plan)
— Bonus reduction
— Equity compensation & deferrals(3)
Further capital supply measures (not in Plan)
— Dividend reduction
— Authorized capital

financial transparency. Stefan Krause Investor Day, Frankfurt, 12 September 2012
Deutsche Bank Investor Relations
De-risking focus of the Non-Core Operations unit
CB&S ~100 — Significant reduction of securitization positions
— Hedging/sale of correlation trading portfolio ~30
CI ~13 — BHF sale
— Completion of Actavis sale ~8
AWM ~3 — Maturity run-down of portfolio
— No acceleration planned ~1
PBC ~20 — Active de-risking of structured credit portfolio
— Further portfolio measures ~7
~45 ~135 Total
Note: Numbers may not add up due to rounding (1) RWA plus equivalent of items currently deducted 50/50 from Tier 1/Tier 2 capital whereby the Tier 1 deduction amount is scaled at 10%
17
Pro-forma Basel 3 RWA equivalent(1) of Non-Core Operations unit
Transferring segment June 2012 Action focus through to Mar 2013
Planned reduction by 31 Mar 2013
SPLIT OPERATING vs. NON-CORE INDICATIVE
financial transparency. Stefan Krause Investor Day, Frankfurt, 12 September 2012
Deutsche Bank Investor Relations
Agenda
18
Non-Core Operations unit
1 Financial overview 2015
Operational Excellence Program
2
4
Strong liquidity and funding profile 5
Capital toolbox 3

financial transparency. Stefan Krause Investor Day, Frankfurt, 12 September 2012
Deutsche Bank Investor Relations
Aspiration to improve efficiency from historical levels
Savings (aspiration by
2015)
Cumulative investments
(CtA) (plan 2012-
2015)
~EUR (4.0) bn
Investment (CtA)
efficiency(1) 0.9
EUR 4.5 bn
2015 aspiration
<65%
2011
78%
Pre-crisis
75%
Note: Pre-crisis defined as average of 2003-2007; Cost savings based on 1H2012 annualized cost base; cost savings will be achieved without including cost changes that relate to litigation, investments (CtA), severance unrelated to new cost program; regulatory spend assumed constant
(1) Cumulative investments (CtA) divided by run rate savings
19
Cost/income ratio aspiration in context Key levers

financial transparency. Stefan Krause Investor Day, Frankfurt, 12 September 2012
Deutsche Bank Investor Relations
Savings program: Phasing and contribution by business
Total(1)
4.5
2.8
1.7
2015
0.7
0.8
2014
0.9
0.5
2013
0.8
0.4
2012
0.3 <0.1
Note: Cost savings based on 1H2012 annualized cost base; cost savings will be achieved without including cost changes that relate to litigation, investments (CtA),
severance unrelated to new cost program; regulatory spend assumed constant; numbers may not add up due to rounding (1) Thereof Corporate Investments/Other: EUR ~0.1 bn (2) Thereof running Powerhouse initiatives: run rate 2015 savings of EUR ~0.5 bn
20
Targeted savings per year In EUR bn
Targeted savings by segment Run rate 2015, in EUR bn
0.2
Total(1)
4.5
2.8
1.7
PBC(2)
1.1
0.4
AWM
0.4 0.3
GTB
0.2
CB&S
1.1
0.8
Businesses Infrastructure
Businesses Infrastructure

financial transparency. Stefan Krause Investor Day, Frankfurt, 12 September 2012
Deutsche Bank Investor Relations
Breakdown of cost program - related investments (CtA)
Note: Numbers may not add up due to rounding (1) Thererof running Powerhouse initiatives: cumulative investments (CtA) of EUR ~0.8 bn
21
Targeted investments (CtA) per year In EUR bn
Targeted investments (CtA) by segment Cumulative 2012 – 2015, in EUR bn
Businesses Infrastructure
0.1
1.0
2013
~4.0
1.0
0.7
2012
0.5 0.1
Total
~2.2
~1.8
2015
0.1
2014
0.6
0.2 0.4 0.4
0.6
CB&S
~4.0
Total
~2.2
0.9
PBC(1)
~1.8
0.5
AWM
0.8
GTB
0.3
Businesses Infrastructure

financial transparency. Stefan Krause Investor Day, Frankfurt, 12 September 2012
Deutsche Bank Investor Relations
Agenda
22
Non-Core Operations unit
1 Financial overview 2015
Operational Excellence Program
2
4
Strong liquidity and funding profile 5
Capital toolbox 3

financial transparency. Stefan Krause Investor Day, Frankfurt, 12 September 2012
Deutsche Bank Investor Relations
Development of funding sources
12% 11%
7%
13% 13%
39%
5%
18%
24%
15%
10% 10%
21%
2%
Capital markets and equity
Retail Transaction Banking
Other customers
Discretionary wholesale
Secured funding
and shorts
Financing vehicles
Increased stability of funding mix ...
23
361 672
Stability of funding source + –
(1) Dec 2007 has been rebased to ensure consistency with Jun 2012 presentation (2) Includes Postbank
30 Jun 2012(2)
Most stable funding sources, in EUR bn
31 Dec 2007(1) Source as of percentage of total funding

financial transparency. Stefan Krause Investor Day, Frankfurt, 12 September 2012
Deutsche Bank Investor Relations
65
150
219 205
31 Dec 2007 31 Dec 2010 31 Dec 2011 30 Jun 2012
... with strong growth in liquidity reserves(1)
24
5% % of total assets adjusted 12% 17% 16%
Development through the crisis In EUR bn
(1) The bank's liquidity reserves include (a) available excess cash held primarily at central banks, (b) unencumbered central bank eligible business inventory, as well as (c) the strategic liquidity reserve of highly liquid government securities and other central bank eligible assets. Excludes any positions held by Postbank
215%
financial transparency. Stefan Krause Investor Day, Frankfurt, 12 September 2012
Deutsche Bank Investor Relations
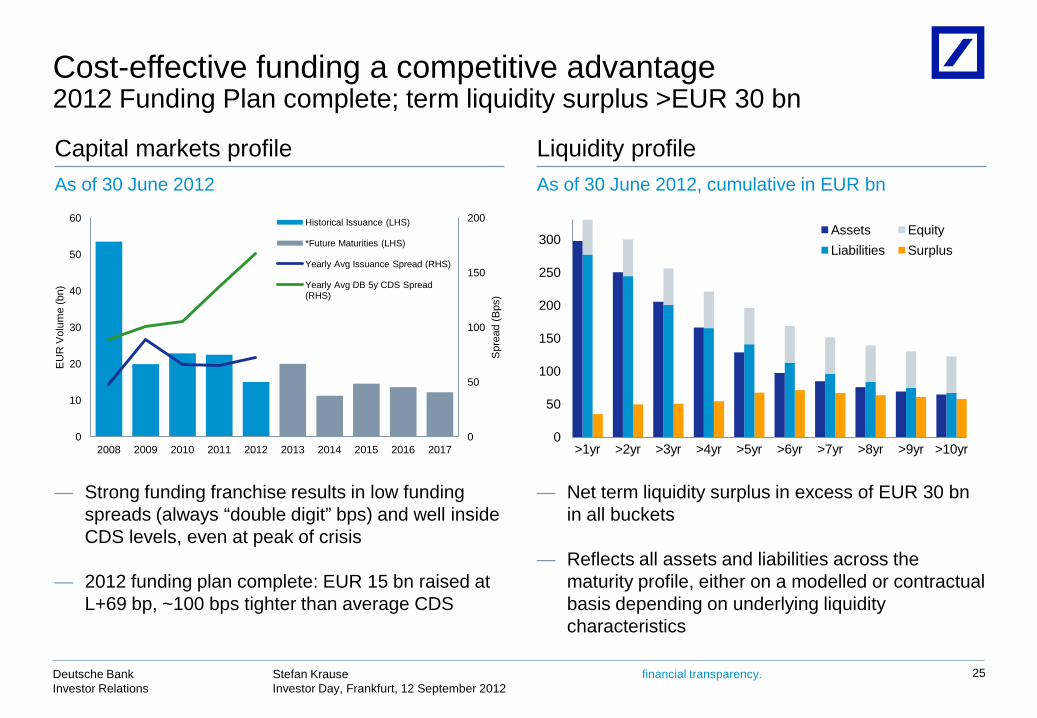
Cost-effective funding a competitive advantage 2012 Funding Plan complete; term liquidity surplus >EUR 30 bn
25
— Strong funding franchise results in low funding spreads (always “double digit” bps) and well inside CDS levels, even at peak of crisis
— 2012 funding plan complete: EUR 15 bn raised at L+69 bp, ~100 bps tighter than average CDS
— Net term liquidity surplus in excess of EUR 30 bn in all buckets
— Reflects all assets and liabilities across the maturity profile, either on a modelled or contractual basis depending on underlying liquidity characteristics
0
50
100
150
200
0
10
20
30
40
50
60
2008 2009 2010 2011 2012 2013 2014 2015 2016 2017
Spr
ead
(Bps
)
EU
R V
olum
e (b
n)
Historical Issuance (LHS)
*Future Maturities (LHS)
Yearly Avg Issuance Spread (RHS)
Yearly Avg DB 5y CDS Spread (RHS)
Capital markets profile As of 30 June 2012
Liquidity profile As of 30 June 2012, cumulative in EUR bn
0
50
100
150
200
250
300
>1yr >2yr >3yr >4yr >5yr >6yr >7yr >8yr >9yr >10yr
Assets Equity Liabilities Surplus

financial transparency. Stefan Krause Investor Day, Frankfurt, 12 September 2012
Deutsche Bank Investor Relations
— Continued full access to the USD wholesale funding market
— Highly conservative stress test assumptions applied which do not assign term funding value to short-term wholesale funding
— To be prudent, Deutsche Bank maintains liquidity reserves of more than the outstanding short-term wholesale funding in cash or highly liquid and central bank eligible securities. This applies to both, the group's position and to the USD only perspective
UWSF(1)
Liquidity Reserves(2)
Global UWSF vs. global liquidity reserves
126 116 118
219 196 205
Dec 2011 Mar 2012 Jun 2012
(1) Includes Postbank since 2010, Postbank holds equivalent liquidity reserves which exceed its standalone UWSF; Dec 2007 has been rebased to ensure consistency with Dec 2011 presentation
(2) The bank's liquidity reserves include (a) available excess cash held primarily at central banks, (b) unencumbered central bank eligible business inventory, as well as (c) the strategic liquidity reserve of highly liquid government securities and other central bank eligible assets. Excludes any positions held by Postbank
In EUR bn
USD UWSF vs. USD liquidity reserves USD UWSF USD Liquidity Reserves
89 71 69 94 76 73
Dec 2011 Mar 2012 Jun 2012
In EUR bn
26
Global/USD wholesale funding (UWSF) profile Short-term wholesale liabilities more than covered by liquidity reserves

financial transparency. Stefan Krause Investor Day, Frankfurt, 12 September 2012
Deutsche Bank Investor Relations
Key messages
Strong financial road map through 2015
Clear separation of operating businesses and non-core operations
Core Tier 1 ratio target supported by diverse capital toolbox
Launch of Operational Excellence Program
Strong liquidity and funding profile
27

Deutsche Bank
Investor Day, Frankfurt, 12 September 2012
28
Appendix

financial transparency. Stefan Krause Investor Day, Frankfurt, 12 September 2012
Deutsche Bank Investor Relations
Note: Numbers may not add up due to rounding. All RoE numbers in the table are based on average active equity. (1) Reassignment of management responsibilities for asset-gathering business and changes to the allocation of coverage costs between CB&S and GTB (2) RWA plus equivalent of items currently deducted 50/50 from Tier 1/Tier 2 capital whereby the Tier 1 deduction amount is scaled at 10% (3) Operating business of Group also includes Consolidation & Adjustments (4) Based on domestic statutory tax rate of 30.8% (5) The post-tax RoE of 7% is calculated as a memo item for the purposes of this slide using the domestic statutory tax rate. 2011 reported post-tax RoE is 8%, based on
average shareholders‘ equity
2011 SPLIT OPERATING vs. NON-CORE INDICATIVE
29
As reportedNon-Core
Operations Other(1) Operating
businesses
Cost/income ratio 78% (6)ppt (1)ppt 71%RWA (in EUR bn) 229 (52) (3) 173
Memo: RWA equivalent (in EUR bn)(2) 257 (70) (3) 184 Pre-tax RoE 13% +10ppt +1ppt 24%
Post-tax RoE(4) 9% +7ppt +1ppt 16%
GTB IBIT (in EUR bn) 1.1 - (0.2) 1.0
AWM IBIT (in EUR bn) 0.8 (0.1) 0.2 0.8 IBIT (in EUR bn) 1.8 0.2 - 2.0 Cost/income ratio 69% (1)ppt - 68%Cost/income ratio 78% (6)ppt - 72%Pre-tax RoE 10% +8ppt - 18%
Post-tax RoE(4) 7%(5) +6ppt - 13%
CB&S
PBC
Group(3)
Re-segmentation
Reconciliation of key financials shown in presentations

financial transparency. Stefan Krause Investor Day, Frankfurt, 12 September 2012
Deutsche Bank Investor Relations
This presentation contains forward-looking statements. Forward-looking statements are statements that are not historical facts; they include statements about our beliefs and expectations and the assumptions underlying them. These statements are based on plans, estimates and projections as they are currently available to the management of Deutsche Bank. Forward-looking statements therefore speak only as of the date they are made, and we undertake no obligation to update publicly any of them in light of new information or future events.
By their very nature, forward-looking statements involve risks and uncertainties. A number of important factors could therefore cause actual results to differ materially from those contained in any forward-looking statement. Such factors include the conditions in the financial markets in Germany, in Europe, in the United States and elsewhere from which we derive a substantial portion of our revenues and in which we hold a substantial portion of our assets, the development of asset prices and market volatility, potential defaults of borrowers or trading counterparties, the implementation of our strategic initiatives, the reliability of our risk management policies, procedures and methods, and other risks referenced in our filings with the U.S. Securities and Exchange Commission. Such factors are described in detail in our SEC Form 20-F of 20 March 2012 under the heading “Risk Factors.” Copies of this document are readily available upon request or can be downloaded from www.db.com/ir.
This presentation also contains non-IFRS financial measures. For a reconciliation to directly comparable figures reported under IFRS, to the extent such reconciliation is not provided in this presentation, refer to the 2Q2012 Financial Data Supplement, which is accompanying this presentation and available at www.db.com/ir.
Cautionary statements
30