Deutsche Bank – Q1 2018 results - db.com€¦ · Q1 2018 results 26 April 2018 Deutsche Bank...
34
Deutsche Bank Deutsche Bank – Q1 2018 results 26 April 2018
Transcript of Deutsche Bank – Q1 2018 results - db.com€¦ · Q1 2018 results 26 April 2018 Deutsche Bank...

Deutsche Bank
Deutsche Bank – Q1 2018 results
26 April 2018
Q1 2018 results 26 April 2018
Deutsche BankInvestor Relations
Summary
2
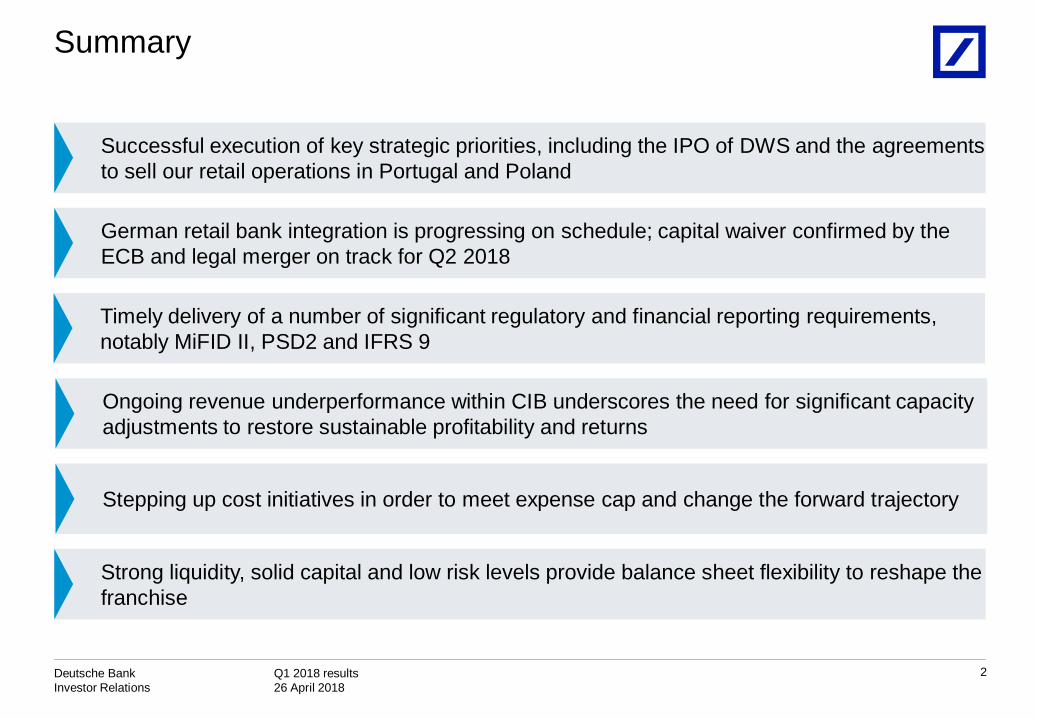
Successful execution of key strategic priorities, including the IPO of DWS and the agreements to sell our retail operations in Portugal and Poland
German retail bank integration is progressing on schedule; capital waiver confirmed by the ECB and legal merger on track for Q2 2018
Timely delivery of a number of significant regulatory and financial reporting requirements, notably MiFID II, PSD2 and IFRS 9
Stepping up cost initiatives in order to meet expense cap and change the forward trajectory
Strong liquidity, solid capital and low risk levels provide balance sheet flexibility to reshape the franchise
Ongoing revenue underperformance within CIB underscores the need for significant capacity adjustments to restore sustainable profitability and returns

Q1 2018 results 26 April 2018
Deutsche BankInvestor Relations
3
Note: Figures may not sum due to rounding differences(1) Post-tax return on average tangible shareholders' equity(2) Figures as of period end
Group financial summary€ bn, unless stated otherwise
Q1 2018 Q1 2017 Q1 2018 vs.Q1 2017 Q4 2017 Q1 2018 vs.
Q4 2017
Profit & Loss
Net revenues 7.0 7.3 (5)% 5.7 22%
Provision for credit losses (0.1) (0.1) (34)% (0.1) (32)%
Noninterest expenses (6.5) (6.3) 2% (7.0) (8)%
of which : Adjusted costs (6.3) (6.3) 0% (6.4) (1)%
Income before income taxes 0.4 0.9 (51)% (1.4) n.m.
Net income / loss 0.1 0.6 (79)% (2.4) n.m.
MetricsRoTE (1) 0.9% 4.5% (3.6)ppt (17.2)% 18.1 ppt
Cost / income ratio 93% 86% 6 ppt 122% (30)ppt
Resources (2)
Tangible book value per share (in €) 25.70 32.00 (20)% 25.94 (1)%
CET1 ratio (CRR/CRD4, fully loaded) 13.4% 11.8% 1.6 ppt 14.0% (0.7)ppt
Leverage ratio (fully loaded) 3.7% 3.4% 0.3 ppt 3.8% (0.1)ppt
Q1 2018 results 26 April 2018
Deutsche BankInvestor Relations
4
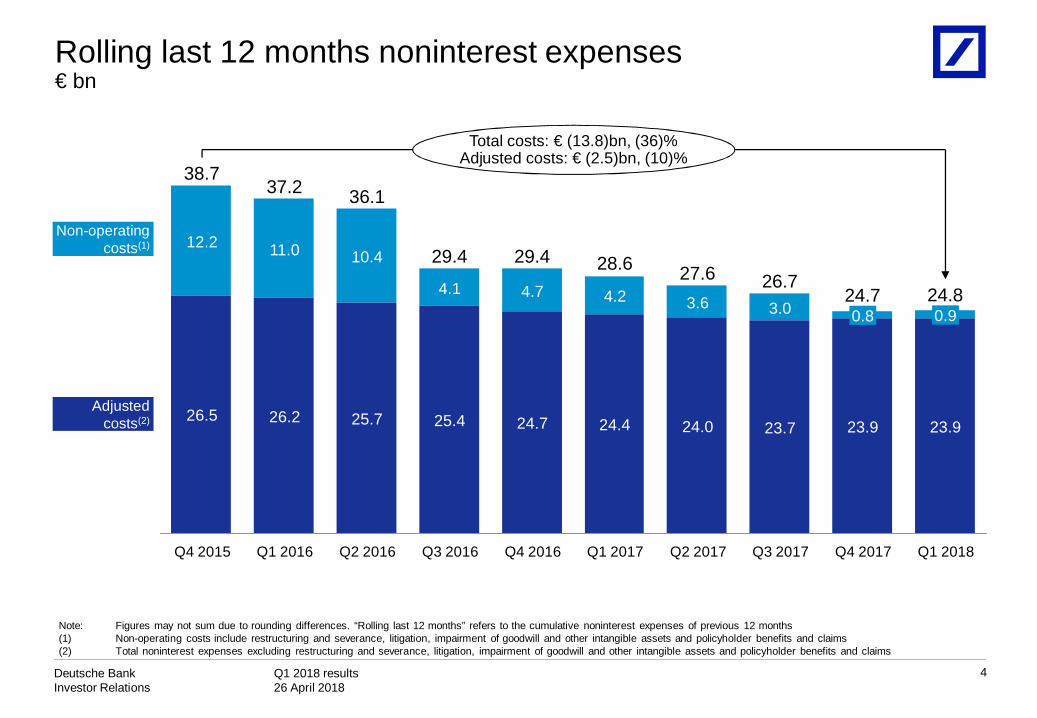
Rolling last 12 months noninterest expenses€ bn
3.0
Q1 2017
4.24.727.6
24.0
3.6
24.4
Q4 2016
29.4 28.6
24.7
36.1
25.7
10.4
Q1 2016
37.2
26.2
11.0
Q4 2015
38.7
26.5
12.2
Q3 2017
0.8
23.9
24.7
Q4 2017
0.9
23.9
26.7
Q1 2018
Total costs: € (13.8)bn, (36)%Adjusted costs: € (2.5)bn, (10)%
25.4
29.4
24.84.1
Q2 2017Q3 2016
23.7
Q2 2016
Adjusted costs(2)
Non-operating costs(1)
Note: Figures may not sum due to rounding differences. “Rolling last 12 months” refers to the cumulative noninterest expenses of previous 12 months(1) Non-operating costs include restructuring and severance, litigation, impairment of goodwill and other intangible assets and policyholder benefits and claims(2) Total noninterest expenses excluding restructuring and severance, litigation, impairment of goodwill and other intangible assets and policyholder benefits and claims

Q1 2018 results 26 April 2018
Deutsche BankInvestor Relations
Adjusted costs(1)€ m, unless stated otherwise
5
Note: Figures may not sum due to rounding differences(1) Total noninterest expense excluding restructuring and severance, litigation, impairment of goodwill and other intangibles and policyholder benefits and claims (2) To exclude the FX effects the prior year figures were recalculated using the corresponding current year's monthly FX rates. Q1 2017 adjusted costs without exclusion of FX effects were
€ 6,336m of which: Compensation and benefits (ex severance): € 3,104m, IT costs: € 936m, professional service fees: € 416m, occupancy: € 449m, Other: € 830m and bank levies: € 600m
(3) Does not include severance (Q1 2017: € 43m, Q1 2017 ex FX: € 41m, Q1 2018: € 42m)(4) Includes deposit protection guarantee schemes (Q1 2017: € 60m, Q1 2017 ex FX: € 59m, Q1 2018: € 67m)(5) Internal full time equivalents at period end
Q1 2018 Q1 2017ex FX(2) YoY
Compensation and benefits(3) 2,960 2,979 (1)%
IT costs 1,022 904 13%
Professional service fees 392 393 (0)%
Occupancy 435 433 0%
Other 809 795 2%
Adjusted costs ex bank levies 5,619 5,504 2%
Bank levies(4) 731 599 22%
Adjusted costs 6,350 6,103 4%
Headcount(5) 97,130 98,177 (1)%
— Compensation and benefits costs slightly lower. Effects from headcount reduction and lower retention accruals more than offset wage inflation
— IT costs increased driven by depreciation of self-developed software, platform investments in PCB and IT infrastructure modernisation
— Professional service fees and occupancy costs broadly flat
— Increase in Other costs, driven by higher banking and transaction charges
— Increase in bank levies reflects mainly higher contributions for the SRF
— Headcount reduced by 1,047 over the past twelve months
YoY drivers (ex FX)

Q1 2018 results 26 April 2018
Deutsche BankInvestor Relations
Common Equity Tier 1 Capital and Risk-weighted assetsCRD4
6
CET1, € bn
CET1 ratio 13.4%14.0%
RWA, € bn
Note: Figures may not sum due to rounding differences
— Q1 2018 CET1 capital down by € (0.7)bn on an FX neutral basis — € (0.4)bn from ECB mandated deduction of
irrevocable payment commitments to Single Resolution Fund/Deposit Guarantee Schemes
— € (0.4)bn impact from IFRS9 adoption— € 0.6bn CET 1 capital uplift from minority sale of
DWS in Q1 2018— € (0.5)bn other primarily due to a reduction in Other
Comprehensive Income and deductions for DVA/Own Credit
— No interim profit recognition in CET 1 capital in 2018 based on CRR/ECB guidance
— Q1 2018 RWA up by € 12bn on an FX neutral basis, principally in CIB, and reflecting € 7bn higher Credit risk RWA from business growth in Corporate Finance and FIC, € 2bn higher Market risk RWA from SVaR increase in the quarter and € 2bn higher Operational risk RWA
— Q2 2018 CET 1 capital to be reduced by payment of the proposed 11cts/share dividend and the AT1 coupon in respect of 2017, partially offset by € 0.3bn additional minority interest benefit from DWS following transfer of the US Asset Management business to DWS in April 2018PCB
0
CIB
12
FX effect
(2)
31 Dec 2017
344
31 Mar 2018
354
C&O
0
AM
0
31 Mar 2018
47.3
Other
(0.5)
DWS
0.6
IFRS 9
(0.4)
Irrevocable Payment
Commitments
(0.4)
FX Effect
(0.3)
31 Dec 2017
48.3
Q1 2018 results 26 April 2018
Deutsche BankInvestor Relations
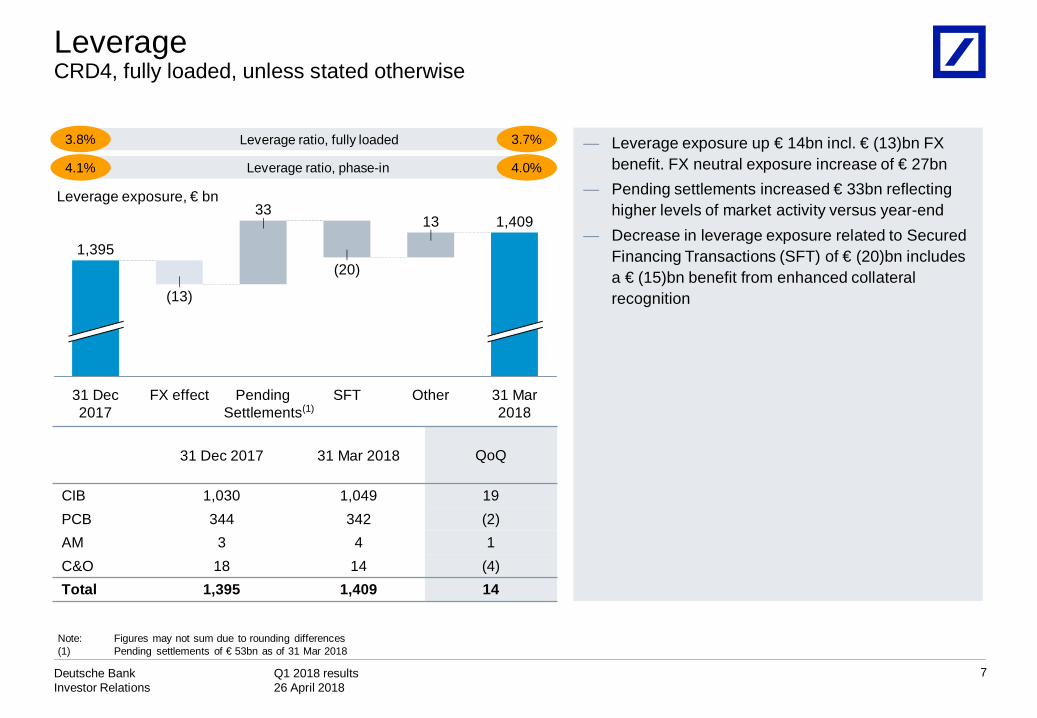
LeverageCRD4, fully loaded, unless stated otherwise
7
Leverage exposure, € bn
31 Mar 2018
1,409
Other
13
SFT
(20)
Pending Settlements
33
FX effect
(13)
31 Dec 2017
1,395
Leverage ratio, phase-in
Leverage ratio, fully loaded
4.0%
3.7%3.8%
4.1%
— Leverage exposure up € 14bn incl. € (13)bn FX benefit. FX neutral exposure increase of € 27bn
— Pending settlements increased € 33bn reflecting higher levels of market activity versus year-end
— Decrease in leverage exposure related to Secured Financing Transactions (SFT) of € (20)bn includes a € (15)bn benefit from enhanced collateral recognition
31 Dec 2017 31 Mar 2018 QoQ
CIB 1,030 1,049 19PCB 344 342 (2)AM 3 4 1C&O 18 14 (4)Total 1,395 1,409 14
Note: Figures may not sum due to rounding differences(1) Pending settlements of € 53bn as of 31 Mar 2018
(1)

Q1 2018 results 26 April 2018
Deutsche BankInvestor Relations
8
Segment results

Q1 2018 results 26 April 2018
Deutsche BankInvestor Relations
Corporate & Investment Bank (CIB)€ m, unless stated otherwise
9
Income before income taxes Financial overviewQ1 2018 Q1 2017 YoY Q4 2017 QoQ
Net revenues 3,846 4,408 (13)% 2,732 41%
Prov. for credit losses 3 (57) n.m. (7) n.m.
Noninterest expenses (3,641) (3,570) 2% (3,423) 6%
Adjusted costs (3,555) (3,536) 1% (3,366) 6%
IBIT 205 777 (74)% (700) n.m.
RWA (€ bn) 241 244 (1)% 232 4%
CIR 95% 81% 14 ppt 125% (31)ppt
RoTE (1) 1.5% 5.6% (4)ppt (4.4)% 6 ppt
205
(700)
406
610777
Q4 Q1Q3Q2Q1
DVA(219) (104) (7) (19) 61
Restructuring and severance(62) (79) (10) (1) (27)
Litigation27 78 (93) (56) (58)
Impairment of goodwill and other intangible assets- (6) - - -
Note: Figures may not sum due to rounding differences(1) Post-tax return on average tangible shareholders' equity
— Q1 2018 revenues were down 11% YoY excluding the impact of DVA, FX movements and changes to funding allocations
— Provisions for credit losses reflected releases in the quarter, primarily driven by favourable developments in the shipping segment which offset provisions taken
— Noninterest expenses were 2 % higher YoY. Increased bank levy and higher litigation were partly offset by favourable FX movements. Adjusted costs increased 1 % YoY
— RWA increased 4% QoQ driven by business growth, partly offset by favourable FX movements
2017 2018

Q1 2018 results 26 April 2018
Deutsche BankInvestor Relations
Global Transaction Banking
CIB business unit revenues and YoY drivers€ m, unless stated otherwise
10
Revenues Q1 2018 YoY revenue drivers
918944964967
Q1
(12)%
Q4Q3Q2Q1
1,042
480537
475563
657
Q1 Q4
(27)%
Q1Q2 Q3
Origination & Advisory
Note: Figures may not sum due to rounding differences(1) Source: Dealogic, in €
— GTB revenues were impacted by unfavourable FX movements and changes in the funding allocation methodology implemented in Q2 2017
— Cash management revenues were lower as a result of client perimeter reductions, despite positive impact from US interest rates
— Trade revenues were slightly lower, in particular in Structured Products
— Trust, Agency and Securities Services revenues were higher
— Total Corporate Finance fee pool down ~25%(1) YoY, with lower volumes across most businesses
— Debt Origination revenues were 19% lower compared to a strong prior year quarter due to reduced client demand
— Equity Origination revenues were 50% lower compared to a strong prior year quarter, and due to the impact of a block trade loss
— Advisory revenues were 22% lower as the industry fee pool was lower in the quarter
2017 2018
Q1 2018 results 26 April 2018
Deutsche BankInvestor Relations
11
Revenues Q1 2018 YoY revenue drivers
Note: Figures may not sum due to rounding differences
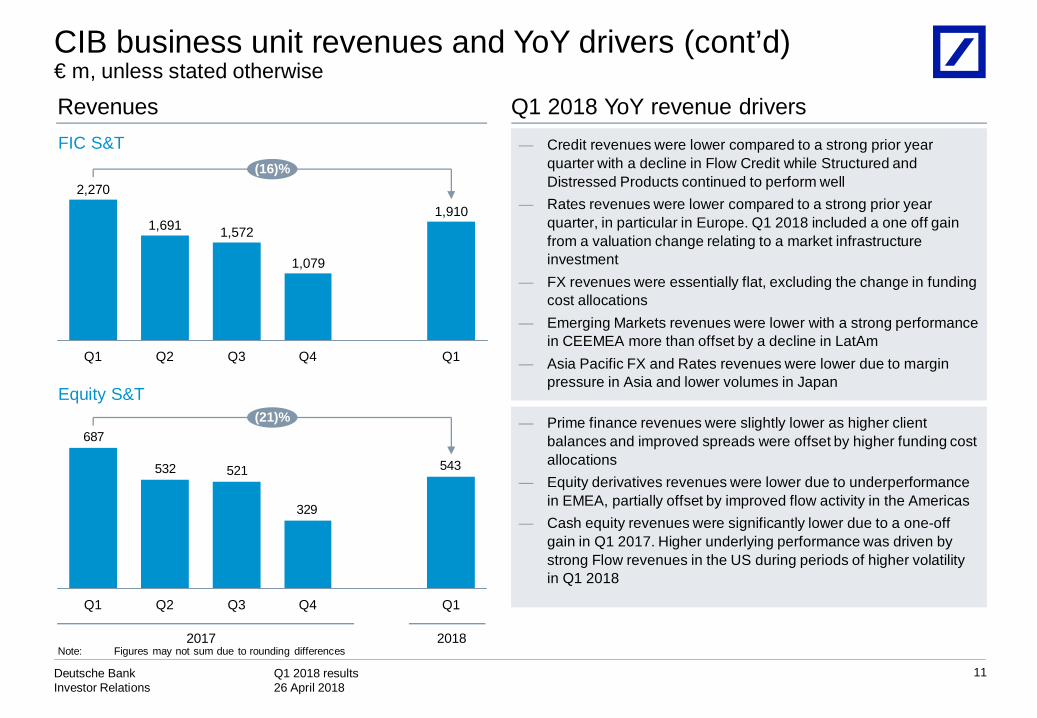
CIB business unit revenues and YoY drivers (cont’d)€ m, unless stated otherwise
2017 2018
— Credit revenues were lower compared to a strong prior year quarter with a decline in Flow Credit while Structured and Distressed Products continued to perform well
— Rates revenues were lower compared to a strong prior year quarter, in particular in Europe. Q1 2018 included a one off gain from a valuation change relating to a market infrastructure investment
— FX revenues were essentially flat, excluding the change in funding cost allocations
— Emerging Markets revenues were lower with a strong performance in CEEMEA more than offset by a decline in LatAm
— Asia Pacific FX and Rates revenues were lower due to margin pressure in Asia and lower volumes in Japan
— Prime finance revenues were slightly lower as higher client balances and improved spreads were offset by higher funding cost allocations
— Equity derivatives revenues were lower due to underperformance in EMEA, partially offset by improved flow activity in the Americas
— Cash equity revenues were significantly lower due to a one-off gain in Q1 2017. Higher underlying performance was driven by strong Flow revenues in the US during periods of higher volatility in Q1 2018
FIC S&T
Equity S&T
1,910
Q4Q3
1,079
2,270
Q2Q1
1,5721,691
(16)%
Q1
543
329
521532
687
Q3 Q4 Q1
(21)%
Q2Q1

Q1 2018 results 26 April 2018
Deutsche BankInvestor Relations
12
Income before income taxes Financial overviewQ1 2018 Q1 2017 YoY Q4 2017 QoQ
Net revenues 2,639 2,704 (2)% 2,313 14 %
Prov. for credit losses (88) (78) 14% (123) (28)%
Noninterest expenses (2,229) (2,197) 1% (2,853) (22)%
Adjusted costs (2,240) (2,237) 0% (2,415) (7)%
IBIT 322 430 (25)% (651) n.m.Assets underManagement (€ bn) 497 508 (2)% 506 (2)%
CIR 84% 81% 3 ppt 123% (39)ppt
RoTE (1) 7.5% 9.3% (2)ppt (13.7)% 21 ppt
322
(651)
348338430
Q1Q4Q3Q2Q1
Restructuring and severance37 (9) 3 (429) (9)
Litigation3 (48) (11) 3 20
Impairment of goodwill and other intangible assets- - - (12) -
Disposal impacts: Revenues (2)
18 2 - (157) (57)
Disposal impacts: IBIT (2)
18 2 - (182) (80)
2017 2018
Private & Commercial Bank (PCB)€ m, unless stated otherwise
Note: Figures may not sum due to rounding differences(1) Post-tax return on average allocated tangible shareholders' equity(2) Includes PCC Poland, PCC Portugal and Private Client Services (disposal impacts)(3) The net impact of ~€ (80)m includes YoY revenue impacts of € (75)m from business disposals and of € (162)m from Sal. Oppenheim legacy positions, in part offset by a € 156m gain
from a property sale in Postbank
— Q1 2018 revenues essentially flat excluding a ~€ 80m lower net contribution from specific items YoY(3). Growth in loan revenues was offset by negative impacts from low interest rates and lower investment revenues (in part impacted by MiFID II implementation)
— Q1 2018 provision for credit losses higher mainly due to a single credit case in the current quarter and very low levels in Q1 2017
— Q1 2018 adjusted cost base flat as lower compensation expenses offset incremental investment spend. Noninterest expenses up 1% mainly due to a benefit from net releases of restructuring provisions in Q1 2017
— FTE down by ~160 versus Q4 2017 and ~1,350 YoY

Q1 2018 results 26 April 2018
Deutsche BankInvestor Relations
13
Revenues Q1 2018 YoY revenue driversPrivate & Commercial Clients (PCC)
Postbank
Wealth Management
PCB business unit revenues and YoY drivers€ m, unless stated otherwise
Note: Figures may not sum due to rounding differences
(5)%
Q1
1,229
Q4
1,059
Q3
1,348
Q2
1,307
Q1
1,299
985802824726771
28%
Q1Q4Q3Q2Q1
426452429526
634
Q2 Q3Q1
(33)%
Q1Q4
— Q1 2018 revenues down 5% mainly due to negative impacts of € 57m from the announced sales of the retail businesses in Portugal and Poland
— Excluding these items, revenues broadly flat — The impact of continued low interest rates and lower investment
revenues (in part impacted by the implementation of MiFID II) were mitigated by growth in loan revenues
— Q1 2018 revenues up 28% versus Q1 2017, mainly due to a € 156m gain from a property sale in the current quarter, the non-recurrence of an adjustment in the home savings business in Q1 2017 and a positive YoY impact from home savings loans which were measured at fair value prior to the adoption of IFRS 9
— Excluding these effects, revenues were essentially flat as higher loan revenues were offset by the continued impact of deposit margin compression
— Q1 2018 revenues down 33% driven by positive impacts in Q1 2017 related to legacy positions in Sal. Oppenheim (€ 175m) and the sale of the Private Client Services unit (€ 18m). Revenues were also negatively impacted by FX rate movements
— Excluding these items, revenues were essentially flat. Revenue growth in Asia Pacific was offset by lower revenues in EMEA and Germany (in part impacted by the implementation of MiFID II)
2017 2018

Q1 2018 results 26 April 2018
Deutsche BankInvestor Relations
14
Income before income taxes Financial overview
72
114
197
238
185
Q4Q3Q2Q1 Q1
Q1 2018 Q1 2017 YoY Q4 2017 QoQ
Net revenues 545 607 (10)% 621 (12)%Noninterest expenses (472) (421) 12% (507) (7)%
Adjusted costs (441) (418) 6% (491) (10)%IBIT 72 185 (61)% 114 (36)%Assets underManagement (€ bn) 678 723 (6)% 702 (3)%
Net flows (€ bn) (8) 5 n.m. 1 n.m.CIR 87% 69% 17 ppt 82% 5 pptRoTE (1) 22.1% 74.3% (52)ppt 30.1% (8)ppt
Asset Management (AM)€ m, unless stated otherwise
Restructuring and severance(4) (4) - (10) (4)
Impairment of goodwill and other intangible assets- - - (3) -
Litigation1 - (1) (4) (27)
Note: Figures may not sum due to rounding differences(1) Post-tax return on average allocated tangible shareholders' equity(2) Change in revenues for sold and discontinued businesses was € (22)m YoY; FX movement was € (21)m YoY(3) Change in total noninterest expenses for sold and discontinued businesses was € (1)m YoY and € (27)m litigation related to a legacy sold business in Q1 2018; FX movement was
€ 20m YoY
— Reported revenues are 10% lower YoY; excluding sold & discontinued businesses and unfavourable FX movements revenues declined YoY 3%(2)
— Q1 2018 noninterest expenses up 11% excluding sold & discontinued businesses, litigation and favourable FX effects, driven by higher MiFID II related research costs, additional company set-up costs and the absence of nonrecurring VAT reimbursement in Q1 2017(3)
— Net asset outflows of € (8)bn mainly in the Americas given US tax reform and outflows in low margin cash and insurance assets, partly offset by strong ETF inflows. AuM were also affected by negative market and USD movements during the quarter
2017 2018
Q1 2018 results 26 April 2018
Deutsche BankInvestor Relations
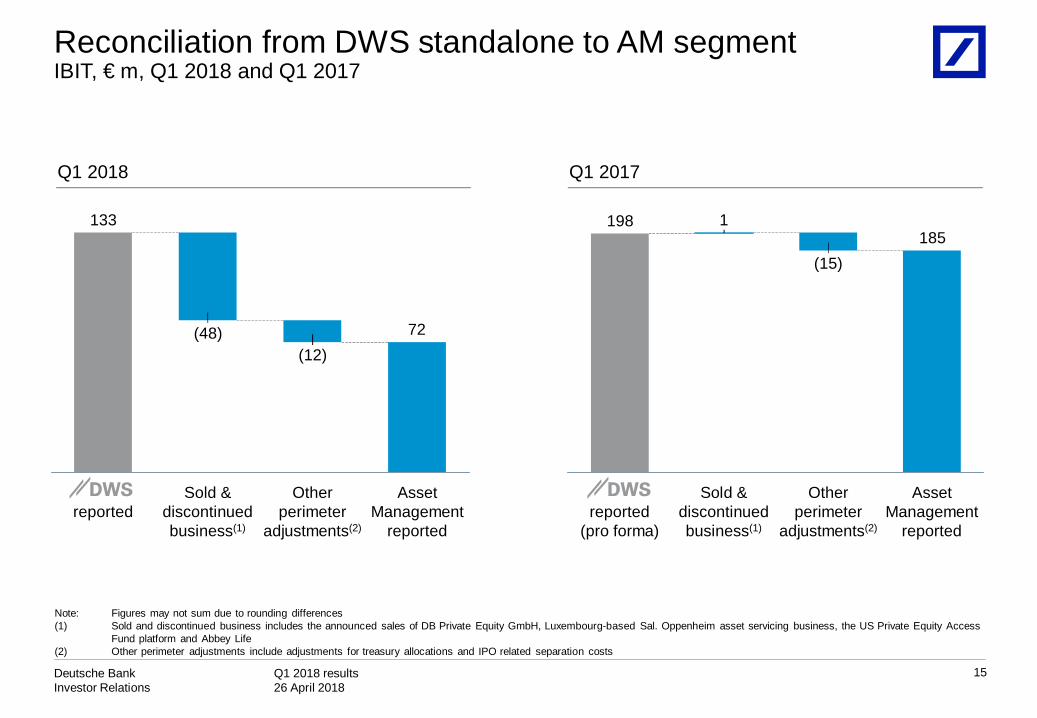
Reconciliation from DWS standalone to AM segmentIBIT, € m, Q1 2018 and Q1 2017
15
Note: Figures may not sum due to rounding differences(1) Sold and discontinued business includes the announced sales of DB Private Equity GmbH, Luxembourg-based Sal. Oppenheim asset servicing business, the US Private Equity Access
Fund platform and Abbey Life(2) Other perimeter adjustments include adjustments for treasury allocations and IPO related separation costs
72
133
(12)
Sold & discontinued business(1)
(48)
reportedAsset
Managementreported
Other perimeter
adjustments(2)
185 1 198
Other perimeter
adjustments(2)
(15)
Sold & discontinued business(1)
reported(pro forma)
Asset Management
reported
Q1 2018 Q1 2017

Q1 2018 results 26 April 2018
Deutsche BankInvestor Relations
16
Income before income taxes Financial overview
(168)(168)
(19)
(364)
(514)
Q1Q4Q3Q2Q1
Litigation- (4) (34) (74) (2)
Q1 2018 Q1 2017 YoY Q4 2017 QoQ
IBIT (168) (514) (67)% (168) (0)%
of which :
Shareholder expenses (97) (108) (10)% (92) 5%
Litigation (2) (0) n.m. (74) (97)%
Funding and liquidity (49) (116) (58)% 3 n.m.
V&T differences(1) 9 (182) n.m. 96 (90)%
Remaining (30) (108) (72)% (102) (71)%
Note: Figures may not sum due to rounding differences(1) Valuation and Timing (V&T) reflects the mismatch in revenue from instruments accounted on a non mark-to-market basis under IFRS that are economically hedged with derivatives that
are accounted for on a mark-to-market basis. In addition, in Q1 2017 it included own credit risk related valuation effects of the group’s own debt measured at fair value while with the introduction of IFRS 9 in Q1 2018 the own credit risk component is transferred into OCI
Corporate & Other (C&O)€ m
Q1 2018 IBIT improved by € 346m compared to Q1 2017 primarily driven by favourable V&T differences as Q1 2017 was negatively impacted by own credit losses on Fair Value Option debtFunding and liquidity represents funding costs that have not been allocated to businessesFrom Q1 2018 expenses associated with shareholder activities reported in C&O. Prior periods were restated accordinglyRemaining YoY improvement is attributable to a number of effectsincluding the absence of a negative hedge result in Q1 2017 related to the sale of the Hua Xia Bank stake
2017 2018

Q1 2018 results 26 April 2018
Deutsche BankInvestor Relations
17
Appendix

Q1 2018 results 26 April 2018
Deutsche BankInvestor Relations
Appendix: Table of contents
18
P&L details
CRD4 – Leverage Exposure and Risk Weighted Assets
Loan book
Stage 3 loans
Value-at-Risk
Asset Management / DWS Reconciliation
Assets under Management
IFRS 9 impact
Headcount
Net Interest Income sensitivity

Q1 2018 results 26 April 2018
Deutsche BankInvestor Relations
Profit & Loss€ m
19
Q1 2017 Q1 2017ex FX(1)
Q1 2018 Q1 2018 vs.Q1 2017
Q1 2018 vs.Q1 2017ex FX(1)
Net revenues 7,346 7,025 6,976 (5)% (1)%
Provision for credit losses (133) (137) (88) (34)% (36)%
Noninterest expenses (6,334) (6,099) (6,457) 2% 6%
of which: Adjusted costs(2) (6,336) (6,103) (6,350) 0% 4%
Income before income tax 878 789 432 (51)% (45)%
Note: Figures may not sum due to rounding differences(1) To exclude the FX effects the prior year figures were recalculated using the corresponding current year's monthly FX rates(2) Total noninterest expenses excluding restructuring and severance, litigation and impairment of goodwill and other intangible assets

Q1 2018 results 26 April 2018
Deutsche BankInvestor Relations
Indicative regional mix of revenues/expensesQ1 2018
Net Revenues
AM
USD
GBP
EUR
Group
Other
PCBCIB
39%
87%
61% 63%0%
0%
13% 1%40%
4%19%
25%
21%9% 7% 11% — The information presented provides an illustrative
currency mix of Revenues and Noninterest expenses
— Classification is based primarily on the currency of DB’s Group office in which the Revenues and Noninterest expenses are recorded and therefore only provide an indicative approximation
— Category “Other” for Revenues primarily includes Indian Rupee (INR), Australian Dollar (AUD), Polish Zloty (PLN) and Hong Kong Dollar (HKD)
— Category “Other” for Noninterest expenses primarily includes Singapore Dollar, INR, HKD and Swiss Francs
20
Total Noninterest expenses
AM
USD
GBP
EUR
Group
Other
PCBCIB
20%
86%
47% 51%
34%
1%
24% 18%32%
4%23% 19%
14% 9% 6% 12%
Q1 2018 results 26 April 2018
Deutsche BankInvestor Relations
21
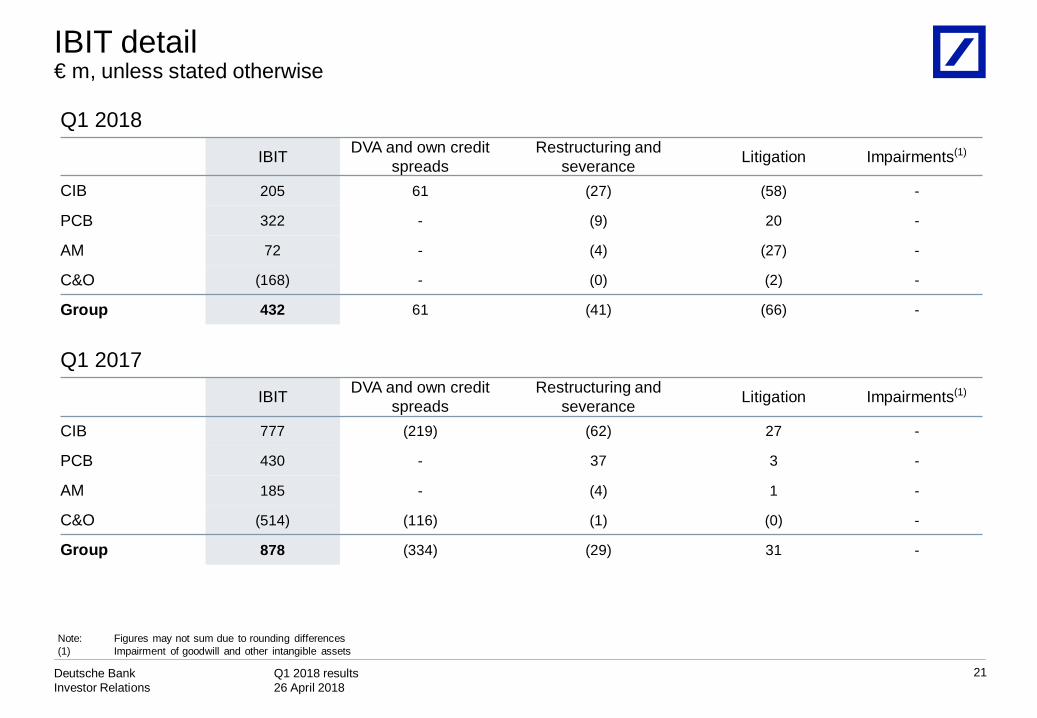
Q1 2018IBIT DVA and own credit
spreadsRestructuring and
severance Litigation Impairments(1)
CIB 205 61 (27) (58) -
PCB 322 - (9) 20 -
AM 72 - (4) (27) -
C&O (168) - (0) (2) -
Group 432 61 (41) (66) -
Q1 2017IBIT DVA and own credit
spreadsRestructuring and
severance Litigation Impairments(1)
CIB 777 (219) (62) 27 -
PCB 430 - 37 3 -
AM 185 - (4) 1 -
C&O (514) (116) (1) (0) -
Group 878 (334) (29) 31 -
IBIT detail€ m, unless stated otherwise
Note: Figures may not sum due to rounding differences(1) Impairment of goodwill and other intangible assets

Q1 2018 results 26 April 2018
Deutsche BankInvestor Relations
Reported and adjusted costs€ m, unless stated otherwise
22
Noninterest expenses excl. compensation and benefits (in € bn)
Noninterest expenses 6,334 5,715 5,660 6,986 6,457Cost / income ratio (reported) 86% 86% 84% 122% 93%Compensation ratio (reported) 43% 44% 41% 59% 43%exclusions:
Impairment of goodwill and other intangible assets - 6 - 15 -Litigation (31) (26) 140 131 66Restructuring and severance 29 95 7 440 41
Adjusted costs 6,336 5,641 5,513 6,401 6,350
3.1 2.9 2.8 3.4 3.0
3.22.8 2.9
3.63.5
Q1
6.5
Q4
7.0
Q3
5.7
Q1
6.35.7
Q2
Note: Adjusted costs is a non-GAAP financial measure most directly comparable to the IFRS financial measure noninterest expenses. Adjusted costs is calculated by adjusting noninterest expenses under IFRS for the excluded items mentioned above. Figures may not sum due to rounding differences
Compensation and benefits (in € bn)
2017 2018
Q1 2018 results 26 April 2018
Deutsche BankInvestor Relations
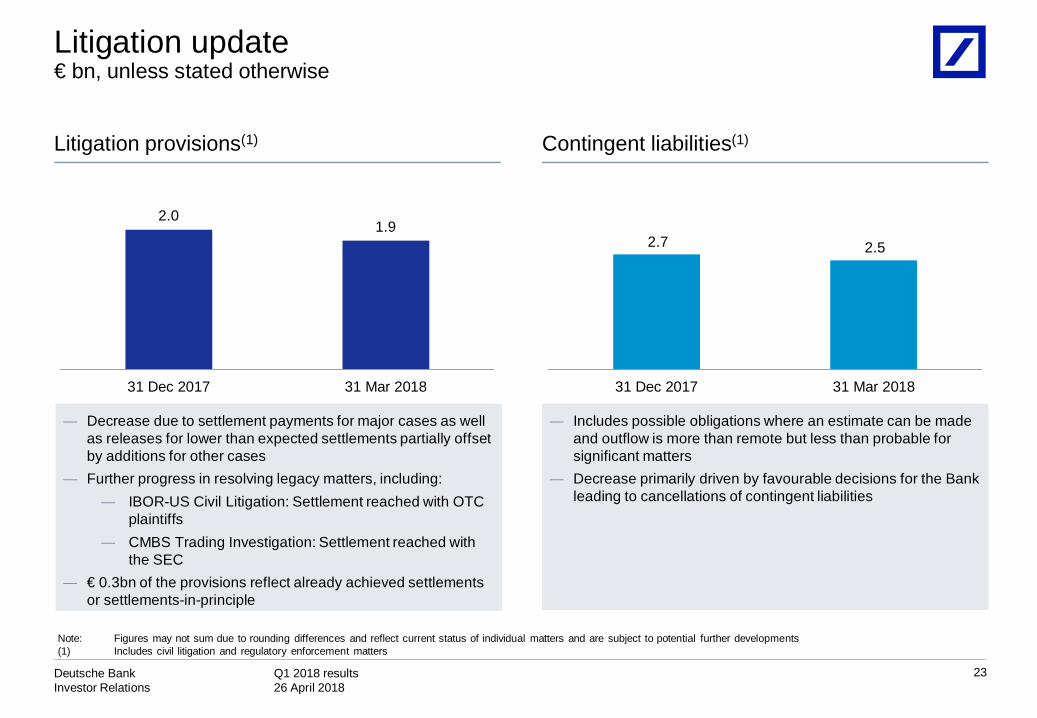
Litigation update€ bn, unless stated otherwise
23
Note: Figures may not sum due to rounding differences and reflect current status of individual matters and are subject to potential further developments(1) Includes civil litigation and regulatory enforcement matters
Litigation provisions(1) Contingent liabilities(1)
2.01.9
31 Dec 2017 31 Mar 2018
2.7 2.5
31 Dec 2017 31 Mar 2018
Decrease due to settlement payments for major cases as well as releases for lower than expected settlements partially offset by additions for other casesFurther progress in resolving legacy matters, including:
IBOR-US Civil Litigation: Settlement reached with OTC plaintiffsCMBS Trading Investigation: Settlement reached with the SEC
€ 0.3bn of the provisions reflect already achieved settlements or settlements-in-principle
Includes possible obligations where an estimate can be made and outflow is more than remote but less than probable for significant mattersDecrease primarily driven by favourable decisions for the Bank leading to cancellations of contingent liabilities

Q1 2018 results 26 April 2018
Deutsche BankInvestor Relations
Provision for credit losses€ m
24
2017
90
1238894
757 56
78
0.13%
Q3
184
0.13%
Q2
79
Q1
88
(3)
22
0.11%
Q1
133
0.13%
0.05%(1)
Q4
129
Cost of risk DB Group(1) CIBPCB
0.16% 0.17% 0.21%
0.10%0.12% 0.08%
Cost of risk CIB
Cost of risk PCB
Note: Figures may not sum due to rounding differences. Provisions for credit losses in the Corporate & Other and Asset Management segments are not shown on this chart but are included in the DB Group totals
(1) For 2017: Year-to-date provision for credit losses annualized as a % of loans at amortized cost (€ 406 bn); for 2018: Year-to-date provision for credit losses annualized as a % of financial assets at amortized cost (€ 702 bn, of which loans at amortized cost € 392 bn)
0.15%
0.12%
(0.0)%
0.12%
2018
Provision for credit losses under IAS 39 Provision for credit lossesunder IFRS 9

Q1 2018 results 26 April 2018
Deutsche BankInvestor Relations
Leverage exposure and RWACRD4, fully loaded, € bn
25
Leverage Exposure vs. RWA(1)
250
6464
261
220
833
Credit Risk RWA
CVA
Market Risk RWA
31 Mar 2018
Lending
Derivatives(2)
Non-derivativetrading assets
31 Mar 2018
261
36
293 10
32
395
1,395
13395
234
113
158
195
185
Reverse repo /securitiesborrowed
39
31 Mar 2018
1,409
185
95
237
136
389
194
172
31 Dec 2017
Other
Off B/S(3)
Cash and depositswith banks
CRD4 – Leverage Exposure RWA
Note: Figures may not sum due to rounding differences(1) RWA excludes operational risk RWA of € 93.0bn(2) Excludes any related market risk RWA which has been fully allocated to non-derivatives trading assets(3) Lending commitments and contingent liabilities
Q1 2018 results 26 April 2018
Deutsche BankInvestor Relations
26
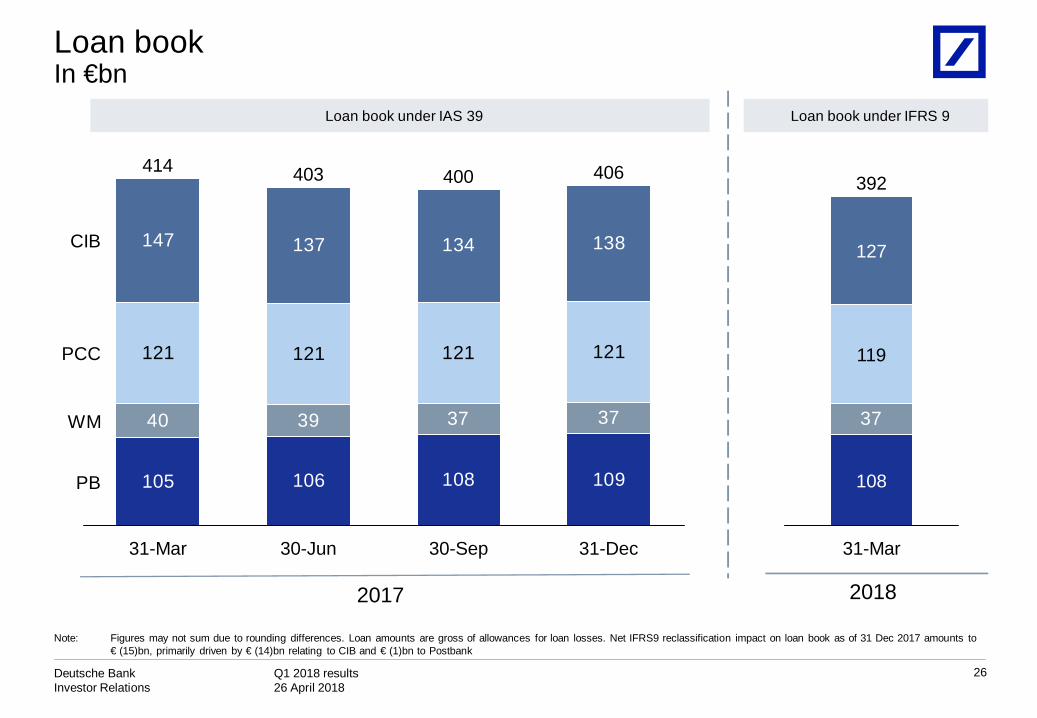
Loan bookIn €bn
Note: Figures may not sum due to rounding differences. Loan amounts are gross of allowances for loan losses. Net IFRS9 reclassification impact on loan book as of 31 Dec 2017 amounts to € (15)bn, primarily driven by € (14)bn relating to CIB and € (1)bn to Postbank
2017 2018
105 106 108 109
40 39 37 37
121 121 121 121
147 137 134 138
30-Jun
403
31-Mar
414
CIB
PCC
WM
PB
406
31-Dec
400
30-Sep
37
127
31-Mar
392
119
108
Loan book under IAS 39 Loan book under IFRS 9

Q1 2018 results 26 April 2018
Deutsche BankInvestor Relations
Impact of IFRS 9
27
Shareholders’ equityIFRS 9 introduction
changes accounting classification of certain portfolios/positionsaccelerates provisioning of credit losses taking into account forward looking informationimpact reflects current favourable credit environment
Higher provisions / classification & measurement effects reduce shareholders’ equity partially offset by tax impact
(0.9)
(0.6)
(0.7)
IFRS 9 impact pre-tax Tax impact
(0.7)
0.10.1
(0.1)(0.2)
0.2
After-tax impact on shareholders’ equity
ImpairmentsClassification & measurement
Note: Figures may not sum due to rounding differences
CET 1CET 1 capital impact of post tax adjustment offset by partial reversal of current expected loss shortfallRWA increase due to higher DTA on temporary differences offset by exposure recognition of additional impairments in credit risk standard approachOverall CET 1 ratio effect ~13 bpsDB will not apply transitional rules
0.3
Expected loss shortfall
(0.3)
(0.1)
Gross CET1 impact from
IFRS9
(0.7)
(0.1)
(0.6) (0.4)
CET 1 capital impact
Additional DTA RWA
0.3
0.4
0.1
€ bn
€ bn (11)bps (2)bps (13)bpsTotal impact
Q1 2018 results 26 April 2018
Deutsche BankInvestor Relations
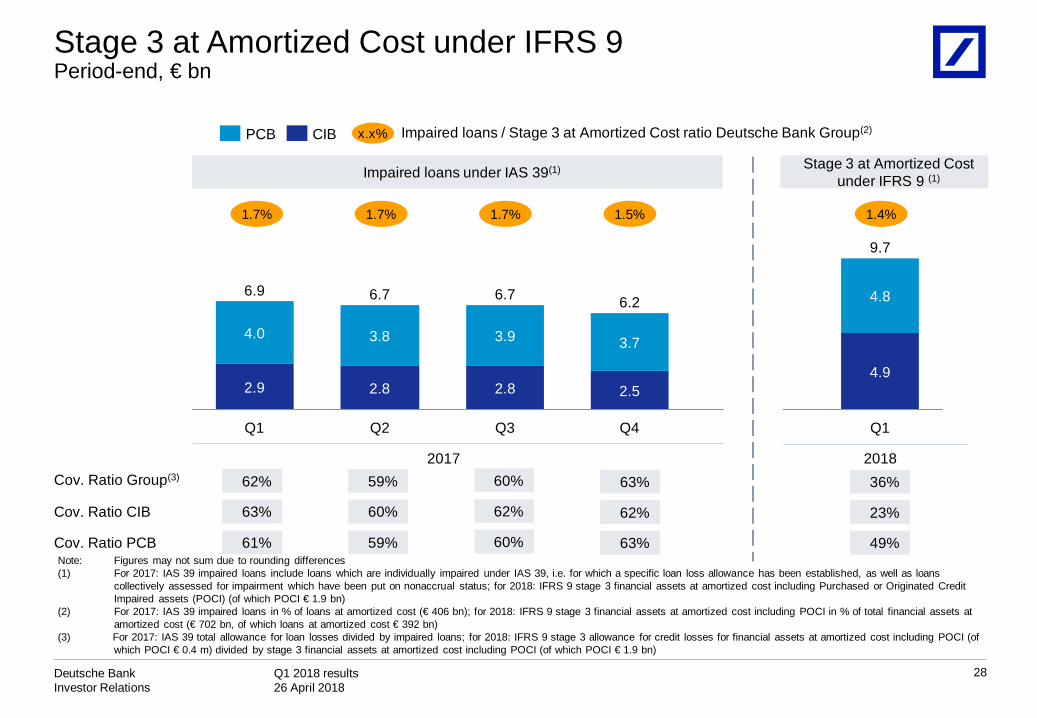
Stage 3 at Amortized Cost under IFRS 9Period-end, € bn
28
201836%
23%
49%
Cov. Ratio Group(3)
Cov. Ratio CIB
Cov. Ratio PCB
x.x% Impaired loans / Stage 3 at Amortized Cost ratio Deutsche Bank Group(2)
1.4%
Note: Figures may not sum due to rounding differences(1) For 2017: IAS 39 impaired loans include loans which are individually impaired under IAS 39, i.e. for which a specific loan loss allowance has been established, as well as loans
collectively assessed for impairment which have been put on nonaccrual status; for 2018: IFRS 9 stage 3 financial assets at amortized cost including Purchased or Originated Credit Impaired assets (POCI) (of which POCI € 1.9 bn)
(2) For 2017: IAS 39 impaired loans in % of loans at amortized cost (€ 406 bn); for 2018: IFRS 9 stage 3 financial assets at amortized cost including POCI in % of total financial assets at amortized cost (€ 702 bn, of which loans at amortized cost € 392 bn)
(3) For 2017: IAS 39 total allowance for loan losses divided by impaired loans; for 2018: IFRS 9 stage 3 allowance for credit losses for financial assets at amortized cost including POCI (of which POCI € 0.4 m) divided by stage 3 financial assets at amortized cost including POCI (of which POCI € 1.9 bn)
2017
9.7
2.9
4.0
Q1
4.9
4.8
Q4
6.2
2.5
3.7
Q3
6.7
2.8
3.9
Q2
6.7
2.8
3.8
Q1
6.9
CIBPCB
62% 59% 60%
62%
60%
63% 60%
61% 59%
1.7% 1.7% 1.7%
63%
62%
63%
1.5%
Impaired loans under IAS 39(1) Stage 3 at Amortized Costunder IFRS 9 (1)

Q1 2018 results 26 April 2018
Deutsche BankInvestor Relations
Net Interest Income sensitivityHypothetical +100bps parallel shift impact by business line and major currency, € bn
29
EUR
USD
3M> 3M
1.4
1.1
0.3
0.70.7
3M> 3M
1.7
1.0
0.6
0.80.9
0.1
0.2
3M> 3M
0.10.1
0.1 0.1
0.1
0.1
0.1 3M> 3M
0.2
PCB CIB Group
0.8 0.8 1.6
PCB CIB Group
1.0 0.9 1.9
First year Second year
Total (EUR + USD)
Note: Figures may not sum due to rounding differences; all estimates are based on a static balance sheet, excluding trading positions & Deutsche AM, and at constant exchange rates. The parallel yield curve shift by +100 basis points assumes an immediate increase of all interest rate tenors and no additional management action. Short term is calculated based on applying the shock only to tenors up to and including 3 months. The delta NII shown is the difference between projected NII in the scenario with shifted rates vs unchanged rates. Figures do not include MtM/OCI effects on centrally managed positions not eligible for hedge accounting

Q1 2018 results 26 April 2018
Deutsche BankInvestor Relations
Sales & Trading revenues€ 3.0bn € 2.5bn
Value-at-RiskDB Group, 99%, 1 day, € m unless stated otherwise
30
(1) Stressed Value-at-Risk is calculated on the same portfolio as VaR but uses a historical market data from a period of significant financial stress (i.e. characterized by high volatilities and extreme price movements)
Average VaRStressed VaR(1)
Q1 2017 Q1 2018
76 83 87
Q2 2017
81
Q3 2017 Q4 2017
67
20
40
60
80
100
120
140
160
180
32 32 30 2825

Q1 2018 results 26 April 2018
Deutsche BankInvestor Relations
Reconciliation from AM reported segment to DWS standaloneQ1 2018 and Q1 2017
31
AM Reported Q1 2017
Perimeter adjustmentsDWS reported
Q1 2017(pro forma)Sold & discontinued
business(1)Other perimeter adjustments(2)
Revenues (€m) 607 (12) 12 606 Noninterest expenses (€m) (421) 11 3 (408)Noncontrolling interests (€m) (0) - 0 -
Profit before tax (€m) 185 (1) 15 198 AuM (€bn) 723 (16) - 706 FTE (#) 3,980 (176) (26) 3,778
AM reported Q1 2018
Perimeter adjustmentsDWS reported
Q1 2018Sold & discontinued business(1)
Other perimeter adjustments(2)
Revenues (€m) 545 10 7 561 Noninterest expenses (€m) (472) 39 5 (428)Noncontrolling interests (€m) (0) 0 -
Profit before tax (€m) 72 48 12 133 AuM (€bn) 678 (2) 676 FTE (#) 3,998 (26) (7) 3,965
Note: Figures may not sum due to rounding differences(1) Sold and discontinued business includes the announced sales of DB Private Equity GmbH, Luxembourg-based Sal. Oppenheim asset servicing business, the US Private Equity Access
Fund platform and Abbey Life(2) Other perimeter adjustments include adjustments for treasury allocations and IPO related separation costs

Q1 2018 results 26 April 2018
Deutsche BankInvestor Relations
Assets under Management / Client Assets – PCB€ bn
32
Note: Figures may not sum due to rounding differences(1) Assets under Administration include assets over which DB provides non investment services such as custody, risk management, administration and reporting (including execution only
brokerage) as well as current accounts / non-investment deposits(2) Regional view is based on a client view
FY2016 Q1 2017 Q2 2017 Q3 2017 Q4 2017 Q1 2018Assets under Management 501 508 504 505 506 497Assets under Administration (1) 194 198 201 206 217 217Client Assets 694 706 705 711 722 715
Breakdown of Assets under Management 501 508 504 505 506 497 Private & Commercial Clients (PCC) 207 213 213 214 215 211 therein: PCC Germany 141 145 146 147 148 144 therein: PCC International 66 67 67 67 67 66 Postbank 77 76 76 76 77 76 Wealth Management (WM) (2) 216 219 215 215 214 211 therein: Americas 35 34 31 30 30 29 therein: Asia-Pacific 45 48 47 48 49 49 therein: EMEA ex GY 50 48 48 47 45 43 therein: Germany 85 89 90 91 90 90
Breakdown of Client Assets 694 706 705 711 722 715 Private & Commercial Clients (PCC) 278 285 289 292 297 295 therein: PCC Germany 194 199 203 206 211 209 therein: PCC International 84 86 86 86 86 86 Postbank 117 117 118 119 120 121 Wealth Management (WM) (2) 300 304 299 300 304 299 therein: Americas 62 61 57 56 57 55 therein: Asia-Pacific 45 48 47 48 49 49 therein: EMEA ex GY 58 56 55 54 53 49 therein: Germany 135 140 140 142 146 146
Net flows - Assets under Management (42) 2 3 (0) (0) 1 Private & Commercial Clients (PCC) (7) 2 2 0 0 1 Postbank (3) (1) (0) (0) 0 0 Wealth Management (WM) (32) 1 1 (0) (1) (0)

Q1 2018 results 26 April 2018
Deutsche BankInvestor Relations
Group headcountFull-time equivalents, at period end
33
31 Mar 2017 30 Jun 2017 30 Sep 2017 31 Dec 2017 31 Mar 201831 Mar 2018
vs.31 Dec 2017
CIB 17,263 16,783 17,247 17,699 17,523 (175)
PCB 44,803 44,281 43,829 43,620 43,458 (163)
AM 3,980 3,953 3,998 3,967 3,998 31
Infrastructure 32,130 31,634 31,743 32,249 32,151 (98)
Total 98,177 96,652 96,817 97,535 97,130 (404)
Note: Figures may not sum due to rounding differences

Q1 2018 results 26 April 2018
Deutsche BankInvestor Relations
Cautionary statements
34
This presentation contains forward-looking statements. Forward-looking statements are statements that are not historicalfacts; they include statements about our beliefs and expectations and the assumptions underlying them. Thesestatements are based on plans, estimates and projections as they are currently available to the management of DeutscheBank. Forward-looking statements therefore speak only as of the date they are made, and we undertake no obligation toupdate publicly any of them in light of new information or future events.
By their very nature, forward-looking statements involve risks and uncertainties. A number of important factors couldtherefore cause actual results to differ materially from those contained in any forward-looking statement. Such factorsinclude the conditions in the financial markets in Germany, in Europe, in the United States and elsewhere from which wederive a substantial portion of our revenues and in which we hold a substantial portion of our assets, the development ofasset prices and market volatility, potential defaults of borrowers or trading counterparties, the implementation of ourstrategic initiatives, the reliability of our risk management policies, procedures and methods, and other risks referenced inour filings with the U.S. Securities and Exchange Commission. Such factors are described in detail in our SEC Form20-F of 16 March 2018 under the heading “Risk Factors.” Copies of this document are readily available upon request orcan be downloaded from www.db.com/ir.
This presentation also contains non-IFRS financial measures. For a reconciliation to directly comparable figures reportedunder IFRS, to the extent such reconciliation is not provided in this presentation, refer to the Q1 2018 Financial DataSupplement, which is accompanying this presentation and available at www.db.com/ir.