DESIGNING AND TESTING A GAZE TRACKER CALIBRATION …
76
DESIGNING AND TESTING A GAZE TRACKER CALIBRATION GAME FOR SCHOOL CHILDREN Tiia Viitanen Bachelor’s thesis March 2018 Degree Programme in Media and Arts Interactive Media
Transcript of DESIGNING AND TESTING A GAZE TRACKER CALIBRATION …

DESIGNING AND TESTING A GAZE TRACKER CALIBRATION GAME
FOR SCHOOL CHILDREN
Tiia Viitanen
Bachelor’s thesis March 2018
Degree Programme in Media and Arts Interactive Media

ABSTRACT
Tampereen ammattikorkeakoulu Tampere University of Applied Sciences Degree Programme in Media and Arts Interactive Media VIITANEN, TIIA: Designing and Testing a Gaze Tracker Calibration Game for School Children Bachelor's thesis 59 pages, appendices 17 pages March 2018
The purpose of this paper is to describe what went into the process of designing a gamified
gaze tracker calibration targeted at elementary school children. In the beginning, the gaze-
tracking technology, the calibration process and the GaSP project are introduced. The
challenge was to combine the technical and design requirements in order to create a mo-
tivating and gamified way for young children to perform a personal calibration inde-
pendently.
In the project section, the design of the calibration game is discussed, as well as the user
testing and the feedback analysis. Based on the testing, improvements were made to the
game design. Through this process, a good understanding of the many aspects one must
consider before, while and after designing a game or an app for children was gained.
Working with and collecting feedback from young users gave valuable experience for
further user testing opportunities.
The results show that a gamified calibration offers much better calibration results than
the standard calibration method. With child users of the game mechanic based method,
the calibration results were 11% better than with adults who calibrated under supervision
using the standard calibration method.
Key words: gamification, gaze-tracking calibration, usability, game testing, games for children.

3
CONTENTS
1 INTRODUCTION ............................................................................................. 7
2 GAZE TRACKING ........................................................................................... 8
2.1.1 Tracking and calibration ................................................................. 8
2.1.2 Gaze points, fixations and saccades ................................................ 9
2.2 The GaSP project ..................................................................................... 10
3 GAME DESIGN .............................................................................................. 12
3.1 Game thinking in calibration ................................................................... 13
3.1.1 Adjusting the player’s position ..................................................... 14
3.1.2 Initial calibration and validation ................................................... 15
3.1.3 Motivating with points and reward systems.................................. 17
3.1.4 Character customization ................................................................ 18
3.2 Usability and UI for children ................................................................... 20
3.2.1 Game rules and how to play .......................................................... 21
4 GAME TESTING ............................................................................................ 24
4.1 Research questions ................................................................................... 24
4.2 Research ethics......................................................................................... 24
4.3 Comparing three different calibrations .................................................... 26
4.3.1 Firefly calibration game ................................................................ 26
4.4 Game testing setup and environment ....................................................... 28
4.4.1 Equipment ..................................................................................... 29
4.4.2 Questionnaires ............................................................................... 30
4.4.3 Observations .................................................................................. 30
4.4.4 The effects of game difficulty level on player feedback ............... 32
4.5 Survey results ........................................................................................... 33
4.5.1 The Standard Calibration .............................................................. 33
4.5.2 The Firefly Game .......................................................................... 34
4.5.3 The Mission Game ........................................................................ 35
4.6 Calibration results for study 1 .................................................................. 36
4.6.1 Accuracy and precision ................................................................. 36
4.6.2 Recalibrations and calibration durations ....................................... 38
4.7 Calibration by control group of adults ..................................................... 41
4.8 Calibration results for study 2 .................................................................. 42
5 DISCUSSION.................................................................................................. 45
5.1 Points of interest after testing .................................................................. 45
5.2 Improvements on Mission Game ............................................................. 47
5.2.1 Difficulty level .............................................................................. 48
4
5.2.2 Shortening the time spent on each calibration point ..................... 48
5.2.3 Affordances and fonts ................................................................... 49
5.2.4 Improvements on visual feedback ................................................. 51
5.3 Improved troll hunt .................................................................................. 53
6 CONCLUSION ............................................................................................... 55
REFERENCES ...................................................................................................... 57
APPENDICES....................................................................................................... 60
Appendix 1. The first game design document without improvements ............ 60
Appendix 2. Second graders survey results ..................................................... 70
Appendix 3. Example of a filled survey .......................................................... 73
Appendix 4. Survey results by game ............................................................... 74
5
ABBREVIATIONS AND TERMS
Human cognition the mental process of acquiring knowledge and understanding
through different interactions such as gaze.
GaSP team of researchers specializing in Private and Shared Gaze.
Calibration the process of configuring a device to provide accurate result.
Eye tracking the process measuring the motion of an eye.
Gaze tracking the process of measuring where the eyes are looking.
Headbox specific area in front of an eye tracker, where the tracker cam-
eras can correctly record the eye positions.
Hz Hertz, a unit of frequency defined as one cycle per second..
Gaze Point basic unit of measure in tracking visual attention.
Fixation period of time in which the eyes are fixated on or towards a
specific object.
Saccade an extremely fast “jump” of the eyes between two fixations.
Spatial location coordinates of where an object is located.
Smooth pursuit eye movement that allows the eyes to closely follow a moving
object.
Visual span the amount of words a person is able to read without moving
the eyes.

6
Methodology a body of procedures and methods used in a particular area of
study or activity.
Mechanic a rule defining how things work in game design.
System a collection of mechanics that produce an event.
Gamification bringing concepts familiar from games into non-game con-
texts.
Core task the most important main task a system is developed to per-
form.
Initial calibration measurement of the gaze data on five separate points.
Validation additional gaze data measurements if the initial calibration did
not produce high enough quality calibration data.
Usability the degree to which a system or a product can be used.
Intrinsic motivation behaviour driven by internal motivation.
UI user interface.
Control group a group in an experiment or study that is used as a basis to
measure the qualities of the studied group.
Affordance a quality of an object or an environment that allows an action
to be performed.

7
1 INTRODUCTION
We use our eyes almost constantly, and the human eye is always “on”. (Hyrskykari, 2006,
173.) The relationship between our eye movements and the human cognition is well es-
tablished. As eye movements reflect attention, it makes sense that they can provide infor-
mation about some of the processes going through our minds. Measuring and recording
eye movement gives us information about where, when and what are we looking at, and
for how long are we looking at it. Eye tracking is an important method in human behavior
research, as it measures the eye movements (the visual attention) objectively and in real
time. With this information we gain knowledge about things such as which visual ele-
ments attract our attention immediately, which hold them the longest and whether some
visual stimuli are ignored or overlooked. (Williams, Eye movements and cognitive psy-
chology: How eye movements work as window on mental processes?).
Although not a novel idea, and having studies stretching back more than 100 years, we
are now, in the last few years, beginning to gain access to modern, effective and most
importantly, unobtrusive eye tracking technologies. It has been used in psychological re-
search, both academic and commercial, and it is an important consideration in design. As
the applications and equipment we have today are getting more and more accessible and
easy to use, the popularity of these tools is rapidly increasing. Some of the modern eye
trackers are very small and can easily be attached to your laptop or computer screen.
One of the many possibilities of this technology could be to use it as a tool for learning
to read. The GaSP team at the Tampere University, the computer-human interaction de-
partment (TAUCHI), is conducting studies to develop a tool for monitoring the reading
progress of school children attending a reading class. This would enable the teacher to
see which readers are having problems and localize the specific problem areas. Collecting
this data would allow the teacher to monitor the progress of the students over time.
As the eye trackers need to be calibrated each time before starting a new session, a way
to motivate the children to carefully and quickly calibrate their own devices has to be
developed. The teacher cannot possibly supervise each child individually, so the method
must be easy enough for the children to perform independently, and it must be fun and
motivational to ensure an acceptable calibration each time. In this thesis the development,
testing, and suggested improvements to the developed calibration game are explained.

8
2 GAZE TRACKING
2.1.1 Tracking and calibration
The gaze tracker measures and records the eye tracking data. The term gaze tracking is
used instead of eye tracking, as the task is to measure the direction of gaze, and even more
accurately, the point of gaze (Hyrskykari, 2006, 18). There are many different types of
trackers available at the market today, but the main components generally include an in-
frared light source, and a camera. The light, not perceivable by the human eye, is directed
towards the eye, and the tracker camera records where the light reflects from the cornea.
The camera also tracks the pupils, and the tracking process is simply the camera tracking
two points: the pupil center, and the reflection spot. The reflection spot always remains
the same, and the measured distance to the pupil is the key to defining where the user is
looking.
FIGURE 1. The relationship between the pupils and the infrared light reflections. (Illus-
tration: Tobii Dynavox, 2018.)
The eye tracker must be taught the individual characteristics of each user’s eyes. This is
measured by how the eyes are positioned when different parts of the screen are being
looked at. The accuracy usually decreases over time, especially with lower-cost trackers,
so new calibration is necessary after a while. (Hyrskykari, 2006, 9). In the calibration
process, the user is asked to follow a point or some other visual element on the screen so
that the reader can record the different eye positions. The position data is collected either
by triggering the collection point automatically, or by allowing the user to press a button
when their gaze is in the correct spot. During the calibration the user is required to keep
their eye on the object at all times, while maintaining a position inside the headbox area.

9
This is the area where the reader can successfully “see” the user’s eyes, or one of them.
The position inside the headbox area has to be maintained when the tracker is used, be-
cause obviously, if the cameras cannot see your eyes, the tracking won’t work.
FIGURE 2. How the eye tracker works. (Illustration: Haptic R&D Consulting SRL 2016.)
During the calibration the tracker filters the data and performs different calculations to
create the personal calibration profile of the user. This data is then written to a file that
can be accessed through analyzing software.
2.1.2 Gaze points, fixations and saccades
Gaze points are the basic unit of measure in gaze tracking. One gaze point equals one
sample recorded by the tracker. The sampling frequency (sample rate) is one of the most
important performance features of eye tracker systems. If the tracker is operating at 60
Hz, it will collect 60 individual gaze point per second.
When several gaze points are collected together, they form fixations. Fixations happen
when our eyes stop looking around, and hold the attention towards a specific object or an
area. What sets fixations apart from a single gaze point, is the fact that they have a dura-
tion, start and end timestamps and a spatial location (x, y). The duration of a single fixa-
tion typically varies between 100-800 milliseconds (0,1-0,8 seconds). Fixation allows the

10
brain to start processing the visual information received through the eyes. Fixations can
provide insight on attention and cognitive processing, such as understanding. If a school
child learning to read shows an increase in average fixation duration on a specific word,
that could indicate that the word is difficult for them to read.
Analysing of the gaze paths of the user on a computer screen interface is one of the com-
mon methods used by researchers. These metrics can be analysed further to find answers
on gaze-related questions, such as what part of an advertisement is noticed first or is being
looked at for the longest.
Saccades are the rapid jumps of both eyes from one fixation to another. Because of the
fast movement of the eye during a saccade, vision is largely supressed (saccadic suppres-
sion), so mostly the information intake happens during the fixations. Saccades can be
triggered voluntarily, but they can also be involuntary. For example, when we are reading,
the eyes do not travel smoothly, and the eyes tend to lock towards every third or fourth
word. Visual span is a term used to define how many words we are able to read before
and after a fixation. The average duration of a saccade is 20-40 milliseconds (0,02-0,04
seconds).
In contrast to saccades, smooth pursuit is a way to closely follow a slowly moving target
while maintaining a stable eye position on it. During smooth pursuit any other objects
besides the target are suppressed. If the object moves too fast to maintain the smooth
pursuit, saccades occur to keep up with it.
2.2 The GaSP project
A group of researchers in the Tampere Unit for Computer-Human Interaction TAUCHI
at the University of Tampere, funded by the Academy of Finland and working under the
name GaSP (Private and Shared Gaze: Enablers, Applications, Experiences), are devel-
oping publicly available software that would enable gaze data collection. The research is
specially focused in applications that share gaze data, and that could be utilized in every-
day computer interactions. Their goals include creating a methodology for remote usabil-
ity testing, and being a large-scale demonstrator of the potential of gaze data in the edu-
cational context. They produce scientific publications on gaze, attention, and education.

11
Currently one of the main focuses are in developing a collaborative reading aid, possibly
an application, that would allow the gaze data of school children learning to read to be
collected and used as an aid for the teacher. Teachers could be better able to offer targeted
help for individual students, if they had access to the gaze-based performance data of each
child. This would provide the chance to detect changes in performance, and a way to find
problematic words.
The cost of the eye trackers should be relatively low, as many schools cannot afford the
expensive, but more accurate trackers with higher sample rates. The affordable, low-sam-
ple trackers could provide sufficient data accuracy through the duration of a lesson, given
that they are calibrated properly. The need for calibration brings up a dilemma: the chil-
dren would need to calibrate their respective eye trackers each time they begin a reading
lesson, and be able to do so unsupervised.
Successful implementation of the unsupervised tracker calibration can additionally pro-
vide the basis for further work such as gamifying reading.

12
3 GAME DESIGN
“Good game design is player-centric. That means that above all else, the player and their
desires are truly considered.” (Brathwaite and Schreiber, 2009, 2.) There are rules in
games, but good game design does not force the player to proceed by following them, it
motivates them to continue to the direction predefined by the design. (2009, 2.)
Games generally consist of several building blocks. Mechanics define how things work
in the game. A game mechanic is something that can commonly be called a rule. If the
player does a thing X, a thing Y then occurs. A non-digital mechanic would be, for ex-
ample, rolling a die. Common examples for mechanics in video games include running
and jumping. Actions are the interactions between the player and the game, such as shoot-
ing an enemy. The rules for these interactions are defined by the mechanics. Progression
and goals mark how far along the player has gotten within the game. Progress can be
displayed by increasing player level, for example. Fulfilling goals provide rewards, that
can in turn play an important role in the player progression. Goals are often referred to as
missions or quests. The ultimate goal is of course victory, which is defined by the victory
condition. Not all games, however have the ultimate victory condition, and it is a debated
question whether sand-box games, for example, should be defined as games or not. Infi-
nite runner games are a good example of a genre that does not have a victory condition,
but are clearly defined as games because they have a goal. The player has to keep running
for as long and far as they can, and generally high scores of the achievements are kept. A
collection of game mechanics that produce an event or an outcome within a game, such
as character creation or progressing to the next level, is called a system. (Brathwaite and
Schreiber, 2009, 12, 28-31.)
Game thinking, and more specifically gamification, is a term that can mean many differ-
ent things depending on who you ask, but in its most basic, it can be summarized as
bringing concepts familiar from games into non-game contexts. Gamification commonly
uses game design elements in order to improve user engagement and loyalty, solve prob-
lems and create better experiences (Marczewski, 2015, 15).

13
3.1 Game thinking in calibration
The reason for applying game thinking to the calibration is to give the user a motivation
to perform the calibration with the attention and accuracy necessary to get a good cali-
bration result. The assumption is that especially children need this additional incentive to
complete a task that they could easily consider boring, as the child does not necessarily
see the value in going through the calibration process. If they see the process as meaning-
less and unnecessary, the calibration quality can be compromised. The design must con-
sider the point of view of the user; what is the reason for me doing this, what do I get out
of it? And most importantly, why would I do this again? In short, the calibration should
be fun.
Flatla, Gutwin, Nacke, Bateman, and Mandryk have conducted a study where they looked
into the practices concerning a creation of calibration games. They approached the task
by creating guidelines mapping the common types of calibration core tasks that provide
the calibration data. Then they matched each of these tasks to common game mechanics
usable for collecting calibration data and lastly implemented additional game elements to
improve the final game. (Flatla et al. 2011, 403.) The design of calibration game should
always begin from the standpoint of what is its main purpose. Building around the cali-
bration core task instead of starting from the game’s point of view is crucial in order to
succeed. Flatla et al. remind us that the quality of the calibration data must be the priority.
They concluded that well designed game elements do not necessarily compromise the
data quality, but that it’s important to consider if the added game elements change the
user’s strategies in a way that calibration itself can be compromised. (2011, 411.)
However, the technical requirements and restrictions are not the only things that need to
be taken into account. The goal is to create an experience that is enjoyable, motivational
and that has replay value. The personal calibration should not only be precise, but the
process should also be fast and it should not take away from the limited time available
during the class. Flatla et al. studies show that gamified calibrations are significantly more
enjoyable than the standard procedures. (2011, 403.)

14
3.1.1 Adjusting the player’s position
The first thing to get right when starting a calibration is the user's position and making
sure they are within the headbox area. The child needs to be sitting directly in front of the
screen, in a comfortable position and in the appropriate distance. The idea for achieving
this in a way that is easy for a child to understand without long written instructions was
to use an avatar character to give them a visual example of the position they should be
sitting in. The character would be facing the child, and they would have to sit in a spot
where their eyes are on the same height and distance as the character. Circle guides rep-
resenting their own eyes would appear on the screen and the child would need to adjust
their position in a way that the circles are in the same spot and of the same size as the
characters eyes. If the user is too close, the circles are too big and when they are too far
away, they are too small.
PICTURE 1. The circle guides tell the player if they are sitting in an appropriate position.
During the calibration, it is important for the user to stay in a relatively still position and
not to move their heads too much in order for the gaze tracker to give accurate readings.
If, during the calibration or perhaps even after the calibration, during their reading exer-
cises, the user started to move around and get out of the head box area, the avatar character
could appear on the screen again to remind them to keep a good posture. In a situation
like this, the avatar could change their face expression and thus underline the importance
of remaining in the right position.
15
3.1.2 Initial calibration and validation
The initial calibration process measures the data of up to five separate points on the
screen. These points can appear in any position on the screen, and the user needs to look
precisely at these points, and keep looking at them while the eye position data is being
collected. After the collection, the point disappears and a new point comes to the screen.
After the initial calibration, the system needs to run the validation of the data. Validation
happens in the same way as the initial calibration, by collecting the gaze data from dif-
ferent locations on the screen. Unless the data is of acceptable quality right away, the
amount points where the user may have to concentrate their gaze can grow. This process
is cumbersome and becomes a time-consuming chore especially when repeated several
times. For this reason, according to Ohno, Hara and Inagaki (2008, 111-131), developing
a way to track human gaze without personal calibration is one of the most important goals
in the field of gaze tracking technology. As the development of affordable gaze trackers
is not there yet, we are attempting to make the calibration process more motivational
instead.
The idea for gamifying the initial calibration and validation was to make a sort of a mini
game for each calibration point. The point would appear as a button that changes shapes.
For the next point to appear, the player would need to catch the shape on a predefined
option and activate it with a space bar press. In theory, the child would automatically
concentrate on that spot to catch the right option. By using the space bar as the trigger
button, it was assumed that it is easy for the child to just keep their finger on this one
trigger and keep their concentration on the calibration screen. Using the mouse button is
another option that came into consideration afterwards, because during testing some feed-
back suggested that the possibility of accidentally pressing the space button could be an
issue for the more sensitive keyboards. Additionally, Heather Nam tells in her article
about a key finding they discovered in four separate usability studies with children up to
age 9. In their tests they observed that children prefer to use a mouse as a controller when
using the computer. As children generally might not have a need for typing, they are not
as comfortable with a keyboard as they are with pointing and clicking with a mouse.
(Nam, 2010.)

16
FIGURE 3. The mechanic of the catching the correct option.
Figure 3 explains the mechanic that takes place in each data collection point. The button
is quite small at 40x40px, and the point changes options in a continuous loop. Feedback
about if the player caught the right option is displayed immediately after the click trig-
gering the data collection. The green or red lock appears directly on top of the spot to
keep the gaze on point for a little longer. This allows the data to be collected reliably, as
the gaze data is collected when the player presses the mouse button. The game mechanic
design must make sure that the player is looking at the spot the system assumes the player
is looking at during the button press, for long enough to collect the data. For calibration
purposes, it does not matter if the player catches the right option or not, but for the game
purposes, additional motivation for the child to want to activate these buttons had to be
thought of.
Initially the game would begin with a scenario where the player needs to catch enough of
the buttons to open a locked door. Behind that door, they would find prizes, such as game
currency and bonus items. This kind of a mission with its very simple core mechanic is
possible to implement in many different scenarios, with different background stories, but-
ton shapes and colours. When the player has attempted to unlock all the game objects, the
round ends and the results are revealed. In case there is a need for re-calibration, it could
present itself in the form of a bonus level (when the player succeeded in the mission), or
getting to try again (when the last mission was not successful). Here a future consideration
would be to design this possibility in a way, that the player would not be able to try to get
a bad result on purpose to get additional play time or more rewards.

17
3.1.3 Motivating with points and reward systems
“The designer must create a careful interplay of system and player, relentlessly testing
those interactions to find that point between anxiety and boredom.” (Zichermann, Cun-
ningham, 2011, 17). The point and reward system is the most complex and potentially
dangerous part of this game. Different factors including the speed of the blinking buttons,
the amount of successful activations that would be required to open the door, the amount
of points needed for receiving bonus items and how many coins would be received, just
to mention the basics, had to be carefully considered. All of these calculations have to
work without knowing exactly how many calibration points the player will need to go
through. The quality of the reward versus the work that should be put in to receive it is
one of the key elements that can make the game enjoyable and add replay value, or destroy
the whole idea.
In this design, the buttons had four different options that blink in a loop, speeding up
towards the end in two intervals. The player gets points based on how quickly they catch
the right option. Those points collect into their personal experience bar, and eventually
the player reaches a new player level. New playable Missions are unlocked as the player
rises in level. In the beginning just the factory mission is available, but after the player
has collected enough experience points, their character reaches player level 2 and a sec-
ond mission is unlocked.
PICTURE 2. The playable missions to choose from. The last two are still locked.
The calibration game was designed for school children in elementary school, starting from
second graders. In Finland children start school at age 7, so second graders would be

18
about 8 years old. With an audience of quite a young age, finding the right balance is
challenging. Balance is a term used to describe a game’s system. It can be balanced or
unbalanced. Unbalanced game is either too easy too difficult, while a balanced gameplay
provides some target audience -appropriate challenge constantly without being over-
whelming. (Brathwaite and Schreiber, 2009, 12.) It would be a mistake to underestimating
the children’s reflex and concentration skills, but a scenario where they would catch eve-
rything correctly right away and get bored due to a lack of challenge after a few plays
needs to be avoided as well. If the game is too difficult, the player will become frustrated
and lose focus. Especially for young children, continually failing will cause them to dis-
like the game making the possibility of a good calibration unlikely. Defining when the
player gets a bonus item was also one point that needed careful consideration. It should
not be a given that the player gets an item every time, as it should be an additional reward
for doing especially well. Finding the right balance can usually be reached only through
game testing. In the beginning, the designer can only make educated guesses on what the
appropriate difficulty would be. If there already are similar games directed to the same
age group, they could be used as references.
To keep a good flow during the game, the player needs to feel that they are making pro-
gress. This is achieved, among other things, through getting positive feedback and re-
wards. According to Chen it is a common mistake to only focus on balancing the system
between challenge and ability and forget about the overall feel that the user gets from the
game. (Chen, 2006.) In the spirit of this, further means for displaying the rewards gained
from gameplay were added by the ability to modify one’s player character.
3.1.4 Character customization
The user will see the character in the beginning of each session when they need to use the
circle guides to adjust their position. The character is not visible during gameplay unless
the player is required to adjust their position in the middle of a mission. The player has
their own personal home screen, where they can modify their character and where the
bonus items gained from successful missions are collected. They can spend the coins they
earned in the store where additional modifications and items are available. A further de-
sign idea was to use this home page as a platform from where the students could begin to
go through their reading tasks and lessons. In order for the children to not spend too long

19
playing with their character, a good solution could be implementing a timer or limiting
the amount of possible modifications allowed during one school lesson.
PICTURE 3. Home screen mock-up after clicking the “Customize”-button.
In Picture 3 the player has collected three different bonus items and selected to wear two
of them. There was not enough time to make the shop functional, but the button to it was
added anyway. During the game tests, the shop was kept closed, but the implication that
there will be an option to go shopping later was there to offer the incentive and explana-
tion for collecting the coins. The motivational aspect of this was however, due to the lack
of time, not tested at all. The assumption remains that it could offer a significant amount
of additional motivation, but more evaluation is required to make further claims.
Mostly out of convenience, but partly out of curiosity to what reactions, if any, the chil-
dren would have, a gender for the player character was not provided. All the children used
the same character that had four different options that they could change in the beginning:
skin, hair, eye and shirt colour. These changes are only available once, and after that, the
character would become their personal avatar. All the children seemed fine with this de-
cision, and accepted it as is apart a single comment from a very perceptive individual.
This student wanted to know if the character had to be a girl, and after that, the discussion
with him and a classmate included interesting points about how the hair colour makes the
character look like either a girl or a boy. They were in the group of second graders and
addressed the topic during the initial character creation. The older groups did not mention
the gender at all. Some testers, however, inquired about more options such as different
hairstyles, which gives a reason to believe that at least some of the children found the

20
character customization interesting, and that the possibility to buy more characteristics
would work as an incentive.
PICTURE 4. The character customizing screen mock-up.
Allowing the player to cosmetically customize their game character attempts to create a
feeling of personal ownership and empathy towards it. This way, collecting more items
to wear and modifying the avatar further can work as an additional intrinsic motivation
to continue playing. Customizations in games can be an important subcomponent in
player motivation, even when it does not directly affect gameplay. A study by Cordova
and Lepper (2006, 716) shows that even small, trivial seeming customization aspects such
as picking a colour for a shirt, hair or a vehicle create a more meaningful and interesting
experience and give the player feelings of ownership. They found that children who were
given more control over their visual representation in a learning game environment en-
joyed the game more and exhibited better learning. Several other studies have also found
that playing with a personally customized character increases character identification,
which in turn can make the experience more motivational and enjoyable. (Fischer,
Kastenmüller and Greitemeyer 2010, 194; Turkay 2014, 18; Bailey, Wise and Bolls 2009,
281; Trepte and Reinecke 2011, 556).
3.2 Usability and UI for children
According to the online School of Game Design, when designing games for children, the
age groups are generally broken down to ages 4-6, 7-9, 10-11, and 12-14. These age

21
groups are all very different from each other. “In the youngest demographic you can’t
guarantee that your audience will know how to read. The oldest group is much more
socially aware than children just a few years younger than them.” (School of Game De-
sign: Design Games for Kids). In this project, we worked with children aged 9-12. It is a
challenge to design something that appeals to and motivates children of such drastically
different ages. In two studies conducted by Jacob Nielsen, it was discovered that children
are also very aware of age differences. The children in their usability tests reacted nega-
tively to content that was designed for children that were even one year, or a school grade,
below or above their own level. (Children's Websites: Usability Issues in Designing for
Young People, 2010.)
As the goal was to create a system that the children can use without adult help during
each step, it was important that what the user was expected to do, was clear and easy to
figure out. A consistent user experience throughout is extremely important, and the final
product needs to have a simple, graphical and intuitive UI. While adults tend to find com-
fort in simplistic and non-distracting design, children thrive in environments with colour-
ful and big pictures, as they hold their attention and help them navigate. (Gallavin, 2015.)
The wide range of group diversity must also be considered, and the interface should work
in a way that children with different skillsets can successfully calibrate their tracker, with-
out offending the older children with too childish design choices. Additionally, for the
younger children this might be their first experience with this type of a game, and many
might not have yet a familiarity with computers and the basic functions that already feel
obvious to adults. It is very easy to assume that a child would automatically know how to
do something, especially when that something comes so naturally for us.
3.2.1 Game rules and how to play
From a player’s point of view, animated or highlighted in-game hints popping up when-
ever a new kind of action needs to take place could be the most fluent and effortless
option. It is also important that when the player already knows what they need to do, they
can easily skip the part where this is explained. Finding the right balance between too
much and too little help requires a lot of user testing.
22
School of Game Design web resource explains that many players just skip written instruc-
tions altogether. Many even skip all the instructions, regardless of what form they are
presented in. Like everything else in games, the instructions and tutorial should be inter-
active. If the player plays through the actions, it creates a better, more fluent experience.
Throwing all the information at once at the player in the beginning of the game will most
likely result in them forgetting it by the time they get to play. (School of Game Design:
Good Video Game Tutorial). We need to make sure that the children understand exactly
what they need to do before they begin the mission, so that their gaze remains in the areas
where we want them to instead of browsing around the screen looking for information. If
the child becomes confused during the calibration, the calibration results will suffer and
a need for re-calibration might become inevitable. This is something to be avoided, as the
time is quite limited.
When children are asked to read instructions, it is good to keep in mind that some children
may find hyphenating the words helpful. The reading aid system developed by the GaSP
team uses this in the reading exercises. If the system detects that the reader is spending a
lot of time looking at a specific word, it becomes automatically hyphenated, as the as-
sumption is that they are struggling to read it. Using easy and familiar words is a given.
Children learning to read often remember words from how they look like. These are re-
ferred to as sight-words. (Fisher, 2015, 99). Hearing the instructions in audio form with
karaoke-like highlight on the word spoken at that moment is also a good option if it does
not disrupt the rest of the class.
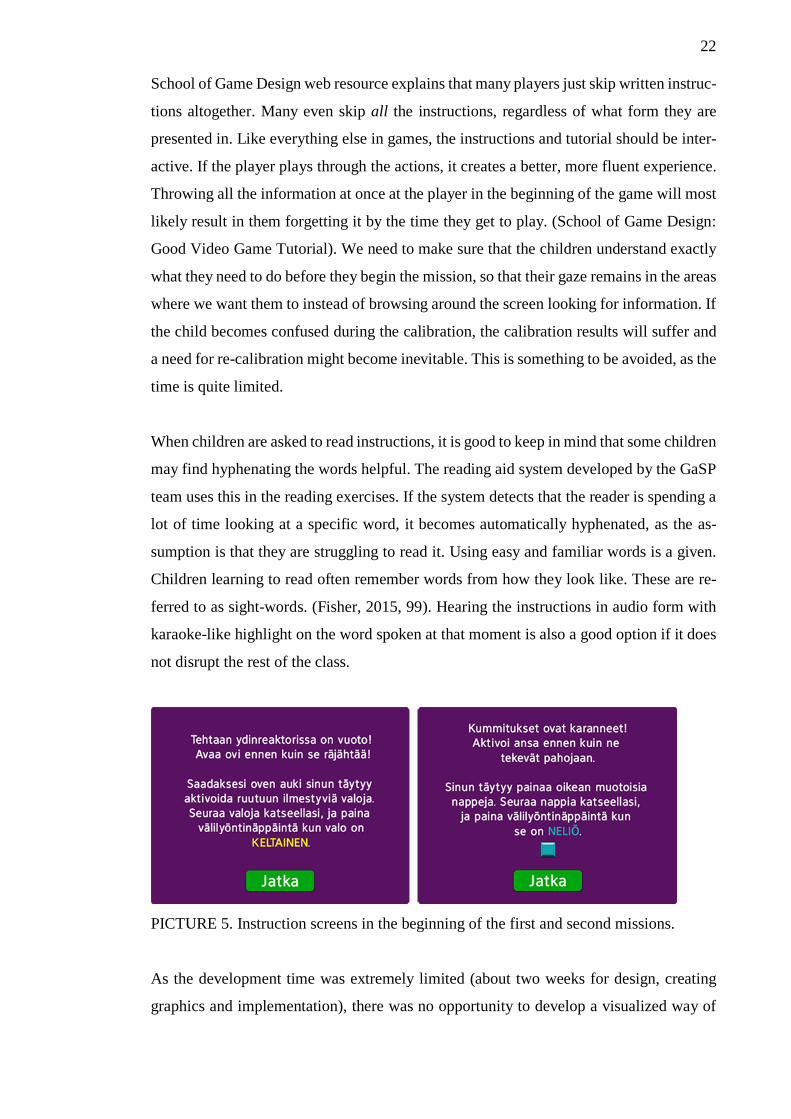
PICTURE 5. Instruction screens in the beginning of the first and second missions.
As the development time was extremely limited (about two weeks for design, creating
graphics and implementation), there was no opportunity to develop a visualized way of

23
displaying the rules. To compensate for the long instructions and balance their time-con-
suming effect, some visual clues were added to the UI and the children were told before-
hand what the mission was and what they should keep an eye on. This worked reasonable
well, and towards the end, when they had learned what to do, the testers skipped reading
the long instruction and picked out the information needed.
There were two different missions, the first taking place in a nuclear factory where the
task was to catch right coloured lights. The second, ghost-themed mission which unlocks
after the player has reached player level 2, required the player to catch specific shapes.
The original game design document can be reviewed in Appendix 1 on page 59. Coloured
text and an image of the shape was incorporated in the rules screen, so that it was quick
to understand what option the player should look for. This way, instead of every time
reading the whole box of text, they could just look at the required shape or coloured text
and continue the game. Which option to catch is random, so that the mission has some
variety when played for the next time. Before a mission starts, a quick animation plays
where the premise leading to the mission is set, and what the player should do is described
the text box.

24
4 GAME TESTING
4.1 Research questions
We had four separate groups of children from three different schools who would test all
the calibration methods. Each group consisted of one whole school class. During these
tests the aim of the Gasp-team was to collect information for two studies.
The first study compares the data when the same students go through the same calibration
procedures in several separate occasions. One group of second grade children would per-
form the testing on six different days so that we could compare their feedback and cali-
bration results over the different sessions and find out whether there were changes. The
assumption was that if the user finds the task boring and/or unrewarding, they will con-
centrate on it less and get worse calibration results. We had three different options for
calibration, which they played in a different order each day.
The second study compares the results of children in different age groups, and if the age
of the children has an impact on the calibration quality. We had two different groups of
third graders (group A and B) and one group of fifth graders who would test all the games
once. The results of just the first day with the seconds graders group would be used in
this study.
4.2 Research ethics
“Ethical considerations in research are critical. Ethics are the norms or standards for con-
duct that distinguish between right and wrong. They help to determine the difference be-
tween acceptable and unacceptable behaviours.” (CIRT: Center for Innovation in Re-
search and Teaching.)
We asked for permissions to conduct the studies from the schools directly. The schools
then requested permissions from the parents. In some cases, the parents were asked for
written permissions, and in others they were asked to inform the teachers if they did not
want for their child to take part in the study. All of the children in the four different classes
25
had the permission from the school and the parents to take part. Every child in each class
took part, and all of the data collected was used without discrimination. Permissions for
taking photos during the study were asked for, and in most cases granted. A few parents
did not want their children photographed, and in these cases the group in which the child
was, was not photographed at all. The research results will be published without any per-
sonal information, and the data collected is stored confidentially. One of the class teachers
asked and was granted access to the individual children’s calibration results, as this might
offer valuable information about the students in order to consider personalized teaching
methods.
The children were introduced to the study before the tests by a presentation held before
the class. In the presentation, the team introduced themselves, the gaze trackers and the
concept of calibration. The children were explained the premise that the team was trying
to study better ways for personal calibration, and that the children were now the official
game testers and we needed their feedback in order to better the designs. It was explained
that the feedback they provide is confidential and that they were not required to sign their
name in the evaluation forms.
PICTURE 6. Official game tester name tags given to the second graders’ group.
As an incentive to get school classes to join the study, we offered a visit to the University
of Tampere, where the children could take part in a game design workshop, where they
got to design their own game and learn about coding. In addition, the second graders’
group received official game tester name tags that they were able to take home after the
six testing sessions. The name tags served an additional purpose on assigning the correct
computer to each student on the different days of testing.

26
4.3 Comparing three different calibrations
The first was the standard calibration, where the player is required to follow a ball moving
on the screen with their eyes, without moving their heads too much. When the ball stops,
the player needs to look at the spot for at least a second and then press a space bar. This
would set a calibration point. To get comparable feedback, the standard calibration was
called the Ball Game in the questionnaire, even though it really is just a ball moving on
the screen which the player has no control over and does not have any game-like feedback
available. Mainly we expected the standard calibration to be boring, or in the least become
boring after several repetitions, thus reducing the accuracy of the calibration. The second
game was something that had been designed a year before and delivered to the research
team as a small student project. It was similar to the standard calibration, but it was visu-
alized as a firefly flying on the screen and turning on lamps. Further introduction of the
game is in the next section. The third game was the newly designed Mission Game.
4.3.1 Firefly calibration game
Originally, the room was intended to start appearing from the darkness as the firefly
turned the lamps on one by one. The lights would also repel small trolls. Because the
calibration point is quite small, with graphics only 45x45 pixels, a bullseye was made and
put on top of the light bulb to which the user was instructed to look at.
PICTURE 7. Firefly game initial calibration in progress, the original design.

27
To gamify, in addition to visualize, a small game was planned for each calibration point,
in which the fly would fly in pattern around the bullseye and the player would have to
catch the fly when it was on top of it with a spacebar or mouse press. After that, the light
would turn on and the trolls around it would be repelled. After all the lights were turned
on, a room would appear where all the repelled trolls would be hiding, and the player gets
to play a hidden object game where they had to find the trolls.
PICTURE 8. Finding the hidden trolls.
The troll hunt was first intended to be a reward for finishing the calibration and turning
on all the lamps, but instead, it was transformed into a chance to validate the initial cali-
bration. In the original plan both initial calibration and validation would have happened
during the firefly-section, and if recalibrations were required, a troll would appear from
the darkness to turn off the lamp correlating to that calibration point. Since the need was
to know where the player is looking at that moment when they press the button, it could
have been problematic to have additional things on the screen to distract their gaze from
the calibration point.
For the story of the game, it was important to have the trolls lurking around the lamp and
have the player catch the firefly on the bullseye to turn on the lamp, but for getting a good
calibration result, it was not ideal. The game used in the testing did not have the slowly
appearing room or the trolls around the lamps. This turned out to create some confusion
with our game testers, as they did not understand that the troll hunting, lamps and firefly
were all a part of the same game. After realizing this, attempts were made to make sure
to tell the participants what the three games were before we started each testing session.
However, I was still afterwards required to explain to several testers that the troll game
was part of the firefly and lamps game.

28
4.4 Game testing setup and environment
We had a great collaboration with the class teacher of our second-grade tester group. We
got our own room where we were able to set up the computers, and the teacher would
send the children to the sessions in groups of six. We arranged the computers to have two
rows of three facing each other.
In this setup, with a separate testing room close to the other classrooms, we had eliminated
some of distractions that occur in regular lesson situations, but still had some comfort of
having a small group of classmates doing the same exercises. This allowed them to per-
form the task in peace and give feedback more freely. As the second graders’ group be-
came more confident on the following testing days, they started to have discussions
among themselves, while still playing, on which game they were now and what points
they received. This is great feedback for the games, but probably not an ideal situation to
have in a classroom while teaching, as it might disrupt the class.
FIGURE 4. The different groups, the participant number and the testing environment.
Third graders group A also performed the tests in a private area where they arrived in
groups of six. With the third graders group B and the fifth graders group, we performed
the testing in one big classroom, where the rest of the students of the class were present.
We set up the six computers in one part of the room, and the rest of the children were
doing their homework or engaging in other activities freely while they were waiting for
their turn. Normally the calibration would be done in a regular classroom before the read-
ing lesson, so this was also a good opportunity to see how the environment influences the
calibration results and the tester feedback.

29
4.4.1 Equipment
During the first session, one of the biggest challenges we found out were the ergonomics
of the furniture. The tables were somewhat too high compared to the chairs used. Some
of the second grade children were too small for the furniture, and therefore easily too far
away or in a wrong angle from the screen. This was fixed the next day by bringing in
pillows that were placed on the seats. This also seemed to improve the posture of some
of the children. For the older students the pillows were no longer necessary. When setting
up a testing area, it is important to keep in mind, especially with a product that relies on
following the eyes of the user from a correct position, that the hardware and the environ-
ment is adjusted correctly. In this case, the tracker is pointing up in a slight angle, so it
was very important for the child to be in a position where they were high enough for the
tracker to detect their eyes.
PICTURE 10. One of the laptops used in the testing sessions.
The laptops (Dell E7520 with screen resolution of 1366 x 768 and a 12.5 inch screen)
used were quite small, which worked well for children. Visual Interaction myGaze eye
trackers operating at 30Hz were attached below the screen of each laptop. The computer
mice used were gathered from the university, and they were all different. A few problems
occurred with them, as some of them were quite large (clearly designed for adults) making
it at times challenging for some of the children to reach or press properly. This required
some encouragement and instructions from an adult on how to use the mouse.

30
4.4.2 Questionnaires
For the second graders, a simple smiley face survey was made that the children were
asked to fill out after each session. In the survey they rated each game by choosing one
out of five different smiley faces. The happiest face represented that they liked the game
and that it was not boring at all, and the sad face would let us know that they found that
game to be very boring. After all of the six sessions were done, we had five-minute inter-
views with the children which were recorded, while the children were still divided in their
small groups. For the older children, a written feedback section was added to the survey,
in which they were asked to tell the best part and the worst part of each game (appendix
3 on page 72).
FIGURE 5. Smiley Face Survey Options.
In addition to the surveys, a team member was present at all the testing sessions to guide
and aid the children, and during the process, was able to observe their reactions and re-
ceive immediate comments and feedback.
4.4.3 Observations
The second grade children were very concentrated and responsive, and after the first ses-
sion, in which we still encountered some technical difficulties, they were able to perform
the tests quickly, efficiently and mostly without our help. During the testing, it was im-
portant to have a team of people at standby, ready to step in and help our young testers if
they needed assistance or advice. It was noticed quite early on that children tend to be-
come somewhat frustrated if things do not run the way as they expect. The best response
in this kind of situation seemed to be to offer support and positive reinforcement. The
children got over the moment very quickly, if they were reassured that they were doing
well.

31
PICTURE 9. Second graders testing the calibration games.
Out of the one-time testers, we got by far the best quality feedback from the third graders
group A, that came out of the classroom in groups of six. This gave them peace and time
to first test the games and then fill out the questionnaires in a separate desk area. The
interaction between the class teacher and the children seemed to contribute to a different
dynamic and to the very conscientious task making of this group. This group took the
game test and the survey very seriously and spent a good amount of time constructing
their answers. When comparing them to the third graders group B, who did the testing
and feedback surveys in the classroom, the difference in enthusiasm was very noticeable.
The third graders group B seemed quite interested in the games and gave in general more
written feedback in the surveys than the fifth graders. The overall dynamic of this group
was enthusiastic and involved children wanting to play again and again. This created a
social situation where the other children also wanted to play more, inspired by the keenest
of the students. They did not seem to feel pressure to impress their peers, and were happy
to share their experiences and what points they got with their classmates, unlike the fifth
graders who mainly just played the games through and returned to their other activities.
When testing with the fifth graders, the assumption was that they will probably not be as
easily impressed as the younger students. At age twelve, people have much more critical
thinking, and based on age limits on many games, they can already be playing some of
the same games as adults do. With the fifth graders, a few students were not as keen on

32
the testing as the rest of the students. Two students sitting together even asked in between
games if it was required that they finish all the parts, and seemed uninterested in the whole
thing. None of the second or third graders expressed lack of motivation to continue. Of
course, if a child, or any tester, really wants to stop during the session, they must be
allowed to step away at any point without the requirement of giving a reason. In this case,
a gentle nudge towards finishing was enough for them to continue. Based on the overall
atmosphere of the classroom, the fifth graders seemed most distracted, wanting to engage
in their own activities within their own group of friends rather than focus on the games
or giving thought-out feedback. Many of the students returned the questionnaires without
any written comments, and one tester even neglected to fill the smiley face rating.
4.4.4 The effects of game difficulty level on player feedback
The emotional development of the age group is an important factor when trying to under-
stand the feedback. Fisher (2015, 145) observed that in general, children are far more
likely to give up on a game if they find it difficult to succeed in. This is of course true
with adults too, but the threshold is undoubtedly bigger for children who are still devel-
oping and learning to control their emotions. It might be even bigger factor for children
in their tweens (ages 9-12) as this is the time when they are spending most of their time
with peers, develop cliques and start to look for examples from their environment instead
of mainly their parents and teachers.
While the expectation was that the older students would be better players, some of the
fifth graders still gave feedback expressing that the Mission Game was too difficult and
that the worst part of it was when they failed to catch the right option. Older students
seemed to take not catching the right option more personally. The distractions in the class-
room could have made concentrating on the game more difficult, and the pressure of pos-
sibly feeling embarrassed in front of their peers could have added to the trouble of con-
centrating. We did the testing in a classroom where everyone was potentially able to see
what the testers were doing, and that could have created a more stressful environment.
The testers themselves were facing a wall and could not see whether the other students
were watching. These different factors make understanding the feedback again less
straightforward.
33
Games and apps for children should be designed specifically for easy or even accidental
success, and have quite a gradual incline in difficulty (Fisher, 2015, 145). This was a rule
especially taken into consideration in the design of the Mission Game, where the blinking
options would first change slowly and gradually get faster. Based on the collected feed-
back of all the students, this was not a success, as a good number of testers in each group
found at least the last setting to be excessively difficult. Of course, we had also more
experienced players who could get almost all the options correct, but they were not in the
majority. The skill level between second and third grade was noticeable. The second grad-
ers played the game six times, and the best result that was discovered by observing the
sessions was seven correct while the third graders reached this result during the one ses-
sion. At least one third grader, as far as observed, even managed to catch all correctly
with eleven calibration points.
4.5 Survey results
4.5.1 The Standard Calibration
To our surprise, we were receiving very positive feedback about the standard calibration
from the second graders while getting calibration results with a noticeable decline in qual-
ity, showing that they were in fact not performing it with the same attention and accuracy
as before. In general, the biggest part of the smiley face ratings were very clearly on the
positive side on all the games (appendix 2 on page 69). The Standard Calibration was
received very well by the other groups as well, and overall 49% of all the reviewers gave
it the highest, the green smiley face ranking (figure 6 and appendix 4.1 on page 73). With
the older groups we did not have the opportunity to study the effect of multiple sessions,
and could not prove declining quality in the calibration results as with the second graders.
Very surprisingly the fifth graders gave it 61%, while the second graders overall average
ranking after the six days was 55%. To compare the third graders, group A that did the
testing in a peaceful environment rated it at 43% while group B that tested the games in
a free roaming environment, rated it at 37%.
In both the third graders groups the two of the highest-ranking spots for the Standard
Calibration had quite equally divided number of votes, and they had the bigger amount
of neutral rankings with 3-5 students against one student in the second and fifth graders

34
groups. The overall hypotheses is that these are perhaps a little too positive reviews con-
sidering that many students in all the groups also thought the standard calibration to be
boring and too simple.
When interviewing the second graders, one question was which of the games they thought
was the worst, and 10 out of the 20 students present on the last session ranked the standard
as the worst out of the three. The positive things mentioned several times were the easi-
ness of the game, and that many seemed to find it pleasant. Following the ball was con-
sidered as a positive feature, and many seemed to respond positively to the movement of
the ball and that it was changing its size. Some thought it was nice that the ball waited for
you to click, while others thought it was boring. The fact that the students felt they were
doing well in the game, could have affected the overall smiley face rating.
4.5.2 The Firefly Game
The Firefly game divided opinions a bit more than the standard calibration, although over-
all it seemed to be more popular (figure 6 and appendix 4.2 on page 74). 58% of all votes
were cast on the green smiley face. The highest amount of votes came from the second
graders with 69%, followed by fifth graders with 66%. The third graders groups have a
significant difference between each other. Group A rated the game at 57% with 33% for
the second best rating and two students totalling at 10% rated it neutral. Group B on the
other hand has ratings reaching all the way to the negative end of the spectrum with only
37% rating it with the green smiley face. 34% were given to the second highest rating
while the rest of the votes are divided between the neutral and the negative options. Nine
out of 20 second graders rated the Firefly game the best out of the three, and even three
fifth graders added this note in their written feedback out of their own initiative. However,
10 of the second graders rated the game as the worst out of the three, equalling with the
standard calibration.

35
FIGURE 6. Number of votes cast on the smiley face surveys shown in percentages.
The positive comments included turning on the lamps, the fly, and that the game was nice
and easy. The troll hunting section of the game received a lot of attention with children
coming to the supervisors asking where they can rate the troll game. As mentioned before,
some of the testers were unclear on the fact that the trolls were a part of the Firefly-game,
and were looking for an opportunity to rate it individually. Still, some feedback made
their way into the surveys, and all of it was positive; except a few comments disapproving
of the time limit on the troll hunt or the number of trolls being too few. This tells me that
many of the children would have liked to play more of this specific game. Overall, the
troll section was popular among all the testers, even in the cases where the lamp section
was not.
As Fisher explains, starting from six years old, children become familiar with shapes and
tend to enjoy finding hidden shapes inside other pictures (2015, 100). This development
continues as they get older, and it was no surprise that all of the testers starting from the
second graders, aged approximately nine years old, to the fifth graders at about twelve
years old, seemed to enjoy the hidden troll hunt in the Firefly Game the most out of all
the activities.
4.5.3 The Mission Game
The Mission Game is also somewhat dividing the opinions, but overall, especially con-
sidering that many found it too difficult, the feedback seems to be quite positive (figure
6 and appendix 4.3 on page 75). 61% of all votes are given to the green smiley face with

36
the second graders group giving the most positive review with 75%. Rest of the groups
are on somewhat similar levels between 55-58% positive.
11 out of the 20 second graders present at the final session ranked the Mission Game as
the best out of the three. The gameplay received many positive comments including open-
ing the locks, liking the shapes and finding the right timing and hence catching the right
option. The background, story and the character (customization and the circle guides) had
a few mentions as the most positive thing. On the negative side, the biggest complaint
was that it was too difficult, and that they did not like it when they caught the wrong
option.
Based on purely the average percentage of votes given in the smiley face reviews, the
best received game out of the three was the Mission Game with 61% (average of all votes
on green). Standard Calibration finished last with 49% and the Firefly Game was a very
close second favourite with 57% of all votes cast on the green smiley face. Due to some
confusion with the testers about where to give points to the much-liked troll hunting game,
the Firefly including the troll hunt might have been more popular overall than the Mission
Game.
In the end, the subjective survey results are very similar and do not offer undeniable evi-
dence on which game was really preferred in the end, if any. The combined feedback and
calibration results, however, give a good idea on what parts can be improved.
4.6 Calibration results for study 1
4.6.1 Accuracy and precision
The calibration results from the six different testing sessions with the second graders pro-
vided a good amount of comparable data. We measured the accuracy and precision of the
calibrations, as well as the durations and the amount of recalibration required to get an
acceptable result.

37
FIGURE 7. Accuracy vs. precision.
In Figure 7 the black crosses represent the gaze points that the reader is registering. Ac-
curacy is telling us how close to the calibration point the gaze is. Precision tells how close
to each other the gaze points are. If the data reported by the eye tracker shows variation
around the general area of the calibration point, we can tell that the user is looking at that
spot accurately, but that the gaze is not necessarily precise. Precision is independent of
accuracy. It is possible for the gaze reading to be very precise but inaccurate, as in the
middle example. It is also possible for the reading to be accurate but imprecise.
The accuracy and precision of all the individual calibration verification points were com-
puted into averages. These averages were then displayed in centimetres in figure 8. The
smaller the value, the higher the accuracy.
FIGURE 8. Average accuracy (cm), study 1, sessions 1 to 6. (Špakov et al., submitted for
publication.)

38
The accuracy of the Mission Game was much better when compared with the standard
calibration; it was about twice as good at about 0,5cm to the standard calibrations 1cm.
Error bars are presented on top of both the accuracy and precision charts, and they tell us
the possible error margin. Even when the possible error margin is considered, the accu-
racy remained clearly superior to the other two calibrations throughout all the sessions.
FIGURE 9. Average precision (cm), study 1, sessions 1 to 6. (Špakov et al., submitted for
publication.)
The precision for the Mission game was relatively good, with the average variation be-
tween 0,15-0,2 cm. However, the precision measurements have only minor differences
from game to game, and therefore the data does not provide solid enough evidence that a
clear winner could be determined.
4.6.2 Recalibrations and calibration durations
The eye tracker reports data quality during the initial calibration, and a need for recali-
bration happens when the initial calibration quality is too low. The chart below (Figure
9) shows the average number of recalibrations needed on each day of the seconds graders’
testing sessions.

39
FIGURE 10. The average number of recalibrations for every 5 calibration points, study
1. (Špakov et al., submitted for publication.)
Due to the specific game mechanic, which keeps the user focused on the calibration spot
very effectively, the Mission Game comes on top also when comparing the number of
required recalibrations. The amount of recalibration doubles for the standard method over
the following testing days, while the Mission Games amount remains basically the same
through all the days.
The duration was measured in three different ways: the total duration, calibration duration
and verification duration. The total duration shows how long each calibration method
took from the beginning of the game until the end. It is quite clear to see that the overall
duration of the Mission Game is higher than with the other methods.
FIGURE 11. Calibration total durations, study 1. (Špakov et al., submitted for publica-
tion.)

40
As mentioned before, in the Firefly Game the calibration happened during the lamp sec-
tion of the game, and verification during the hidden object game. For Mission Game and
standard calibration, the first 4-5 calibration spots were for calibration and the following
spots were for verification. The time used on recalibrations necessary in each game were
included in the overall calibration time.
FIGURE 12. Calibration and verification duration averages, study 1. (Visually modified
from original calculations and chart by Špakov et al., submitted for publication.)
On the first day, the children spent time on creating their character and reading the in-
structions. The time spent on the initial character creation explains the highest spike on
the Mission Game, but on the following days, the duration normalizes to about 1,5
minutes, which is somewhat around 40 seconds more than with the standard calibration.
The time spent on the Mission Game includes the short animations that are played to set
the premise, the position adjustments, reading the instructions and the actual calibration.
The standard version only includes one screen of instructions (that includes the position
check) and the calibration itself. These times sound short and seconds are being counted,

41
but the reason for this is to keep the time spent on calibration as short as possible, so that
it does not take too much time away from the lesson.
The overall time spent on the game could be shortened with better UI so that the user does
not have to spend so long on the instructions. From the chart, it can be estimated that the
time spent on the menus and activities that were not used for calibration was 60 seconds.
The calibration duration is similar at around 20+ seconds with all the games, but the ver-
ification duration seems to take somewhat over 10 seconds longer than with the standard
system. This subtly tells that the players were perhaps spending a longer time waiting to
catch the right option on the last, faster changing buttons. In addition to making them
easier, a timer could be considered, so that the player does not wait for too long before
attempting the catch.
4.7 Calibration by control group of adults
We ran an additional testing session with adults to see how good results the eye tracker
we used could be expected to provide, when calibrated under supervision by cooperative
adults. University staff and university students were asked to carefully calibrate the gaze
tracker using the standard calibration (Ball Game). They were given the instructions in
person and the calibration was monitored to assure that everything ran smoothly and that
the testers were performing as they were asked to. These results were then compared to
the unsupervised calibration results from the children.
FIGURE 13. Comparing supervised adults and unsupervised children’s results. (Špakov
et al., submitted for publication.)

42
Supervised adults had undoubtedly better accuracy with the standard method than the
unsupervised children, as expected. Adults were sitting further away from the screen at
around 60cm average distance, while the children’s distance was around 45cm. If the
distance is taken into account, and the accuracy is calculated in degrees, the adults’ cali-
bration is 53% better than the children’s is.
However, the significant and most important discovery here is that the unsupervised cal-
ibration by children, with the Mission Game, resulted in better calibration quality than
supervised adults using the standard method by 11%. These results show that a gamified
calibration based on this specific mechanic offers better calibration results than the stand-
ard calibration method.
4.8 Calibration results for study 2
The second research question was whether the age of the children makes a significant
difference in calibration quality. The data from the first day of the second graders group
was used and compared with the data from the two third graders groups and one fifth
graders group performing the calibrations once. A modification was made to the Firefly-
game’s troll hunting section, to encourage our testers to keep their gaze on the selection
area for long enough that we could be satisfied that the gaze fixation was on the estimated
spot, when the button was clicked and the data was gathered. This is explained further in
a following chapter, “Improved troll hunt”.
As mentioned before, there were differences in the environment where the data was gath-
ered. Third graders group A performed the calibrations in a separate area in small groups
with the maximum of six students, while the third graders group B did so in a class room
where the rest of the class was freely doing their homework or other tasks while waiting
for their turn. The setup was similar to this with the fifth graders group.

43
FIGURE 14. The average accuracy and number of recalibrations, study 2. (Modified from
original calculations and chart by Špakov et al., submitted for publication.)
Like in study 1, the data on the average precision was so similar in each game and age
group that it does not make sense to display further visualizations of it. The accuracy for
Mission Game remains better compared to the standard calibration, but the difference gets
subtler with the older groups. The Mission Game still requires fewer recalibrations as the
other methods, with the exception of the fifth graders group who needed to recalibrate the
same amount of times with the standard and the Mission Game methods, while the Firefly
Game needed the least amount of recalibrations. Third graders group B has the highest
number of recalibrations compared to all, but the spike is in fact due to two students, who
both together required 17 recalibrations, dragging the average higher. These can be the
result of the additional distraction in the class, as this group was very interested in the
games and some of the student waiting for their turn to play came over to the testing area
to see what the testers were doing.
Next to the second graders, they needed the least amount of recalibrations in the Mission
Game, which could be considered as evidence towards an engaging game experience and
higher concentration. The medians were calculated to reduce the impact of these individ-
ual students, and as a conclusion, the accuracy results are very much like the results from
the study 1, proving no significant difference in accuracy between different age groups.

44
FIGURE 15. Calibration total durations, study 2. (Špakov and Istance, 2018)
All of the overall durations are quite similar with the exception of the fifth graders group
during the Mission Game, where overall time used on the game decreased by 20 seconds.
As the Mission Game was the option requiring the most reading, it is most likely due to
the higher reading speed of older students. In conclusion, to the data obtained for study
2, there is no evidence towards making claims that age of the child has an impact on the
calibration quality.

45
5 DISCUSSION
5.1 Points of interest after testing
Additional point of interest towards further studies comes from the age groups. A study
was previously mentioned where the results show that children react negatively towards
a design if they identify it to be made for younger children than they are. (Nielsen). In the
studies conducted in this thesis, the children were not told that groups of different ages
are testing the same games. It would be interesting to see if the survey results would have
provided different information, if this fact had been disclosed with the testers. According
to the Nielsen studies, the reactions could be assumed to be more negative. In the case of
the fifth graders expressing the Mission Game to be too difficult, would knowing that
even three years younger students had played them, had made a difference in attitude? Of
course the second graders thought it was difficult as well, but based on their interviews,
it was not considered as negative as with the fifth graders.
The Mission game was the only one out of the three calibration games to introduce the
possibility of failure, which, in hindsight, was somewhat risky. It is crucial that the diffi-
culty is on the appropriate level to avoid frustrating the testers. Another key difference
between the Mission Game and the other games was that in the other games you follow
an object, wait for it to stop and then take action. The children seemed to be responding
to this quite positively, and surprisingly positively in the case of the plain ball game
(standard calibration). In the mission game, the game object appeared randomly, which
can break the momentum of following through one action. It would be interesting to per-
form further testing to compare these two different approaches and pay specific attention
to which one the children like more. Some feedback suggests that finding the right spot
on the game screen can be fun, but this was not a feature much addressed by the testers.
In the Mission Game, it would be quite easy to add the element of movement to the game-
play. An object similar to the images rotating during the catch-section of the game (that
can never be the correct option to click) would be visible when the object is moving.
When it stops at the calibration spot, the rotating images activate and the player has to
catch the right option just like in the original design.
As the children enjoyed the hidden trolls section of the Firefly game so much, it could be
a good possibility to add more of these types of tasks inside the Mission Game to create

46
more variety. These different games would then be available for selection before each
session, and every user could choose the calibration method they like the most. This
makes the calibration less of a mandatory task, and even users who do not usually play
games or who feel like they do not have the skills for them, would have the opportunity
to select the least annoying method. Even though the catching the right option mechanic
is working extremely well for calibration, it seems to be possible to adjust the hidden
object game to reach similar quality calibrations as well. As explained in chapter “Im-
proved troll hunt”, the calibration accuracy can be improved by adding visualization to
the spot that we want the player to be looking at when the calibration point gaze data is
collected. Additionally, only one hidden object could be seen on the screen at any given
time, thus reducing the possibility of the player already looking at the next object they
want to click. The problem with the original hidden troll game was the location of the
hidden objects. For verification purposes it was acceptable that the hidden objects were
located on a ready image and that the verification points were defined by the picture. But
for the initial calibration, the calibration spots appear on tracker defined spots that are not
known beforehand, so the game would need to be modified in a way that the hidden ob-
jects could appear anywhere on the screen. This creates interesting challenges for the
game graphics design.
The socializing element, which is one important factor in gamification, came into play
when the children were sharing the points they made, which games they played and what
rewards they received. However, the game itself does not have added socializing ele-
ments. Implementing different ways for the users to share their achievements or even gift
items could be interesting, as these might improve the motivation to play the game. When
these features are considered, the important thing to remember is the limited time that the
users have available to use and if these elements would create disruptions during the les-
son. The system GaSP is developing is based on the teacher being able to see what the
students are doing, to evaluate when additional tutoring is required. If social elements are
implemented, then an ability to enable or disable these activities could be added on the
teacher’s version. This way, the teacher could give permission to use the additional ele-
ments based on the situation in the classroom.

47
5.2 Improvements on Mission Game
The second level should be first, as the majority of testers considered it to be more fun.
This makes perfect sense, as the theme of the second mission is ghosts, and generally
children respond much better to topics they already know and that inspire their imagina-
tion, whereas the nuclear factory in the first mission can be a more distant and unfamiliar
topic especially for younger children. As children do not yet have a lot of life experiences,
they are drawn to familiar, recognizable elements. In addition, the shapes seemed easier
and more fun to the most of the children. The factory could be replaced altogether with a
different story.
PICTURE 11. The second level of Mission Game, after the ghosts have escaped from the
box.
With the colour catching, colour blindness could be an issue that may cause a problem at
some point. In this case, there should be an alternative option for colour blind users. New
background stories could include objects from nature, animals and other topics generally
of interest to children. In addition, the use of the background picture during the calibration
game was something that was thought about even before the testing. The calibration re-
sults of the second graders show a slight decrease in accuracy when a new background
story, and with it a picture, is introduced. For the duration of the calibration, the back-
ground picture could be muted with a transparent layer so that it does not distract the user.
This would be a feature especially beneficial and easy to implement, if new missions
requiring animations with many components to explain the story are created.

48
5.2.1 Difficulty level
Based on the feedback from the test groups, it is very clear that the levels need to be
easier, as explained before. In addition, the point system needs revising to make it easier
to get a bonus item. When testing with the second graders, not even one managed to get
enough points to get a bonus item on their own. We adjusted the game ourselves before
the second to last session in a way that all the children would reach level 2 and get a bonus
item before the last session. Even then, two players failed to reach the very small amount
of points needed to progress.
An adjustable difficulty level could be implemented to consider the variety of gaming
skills among children. Implementation of a system that detects the skill level of the player
would also help with the problem. If the system notices that the player is struggling to get
the selection right, it should automatically make the task easier. If the player continues to
do really well, the difficulty could be gradually increased to the level of the individual.
This way the experience serves all the skill levels and does not punish the not so good
players too much while boring the better players. After all, the point is to get the system
calibrated, not to put the children in the order of who is the best player.
Schools may also have policies where leaderboards based on performance should not be
used. The calibration game should be a rewarding and gratifying experience for all users.
Of course, the children would still be able to compare their scores, levels and prizes later
on, without necessarily knowing that difficulty adjusting mechanics are taking place in-
side the game system.
5.2.2 Shortening the time spent on each calibration point
The idea of a timer placed around each button to limit the time spent on one calibration
spot had been introduced before, but we did not have time to implement it. If the timer
runs out, that button would be counted as failed. This way, a player would not use too
much time on one calibration point, waiting infinitely for the perfect timing to catch the
correct option.

49
PICTURE 12. A timer around a calibration point.
In the tested version, the buttons had four different options in one cycle, and if the player
missed it on one round, they would have to wait for it to come around again. For the first
buttons, these options could be lowered to three or maybe even two for the first one to cut
down on that time. As learned from before, many of the testers felt that the buttons were
too difficult to catch because they were changing too fast especially in the end. With the
second graders’ group, we had several children who were unable to catch even one, or
only one (to our surprise). The speed could be slower so that they would have a chance
to get at least the first ones right. The right option could have a slightly longer turn in the
cycle. Despite two testers expressing an opinion that the first speed setting was too slow,
the amount of this feedback was not as significant as the opposite opinion. The amount
of different options could have also contributed to the feeling that it was too slow, as they
had to wait for all the options to cycle before they had a chance to try again. In theory,
the player would spend less time on each button, if they felt a bit more confident that they
could to catch the right option.
5.2.3 Affordances and fonts
Affordances in general are something that should have been considered more. An af-
fordance is a quality of an object or an environment that allows an action to be performed.
For example, a button affords clicking it. Children, who are now in elementary school,
are growing up in a generation where using technology from a very early age on is com-
mon. Most six years olds can use a computer mouse, but they have likely been using
mostly tablets before, where the main action triggers can often be buttons. The buttons
need to be big and easy enough for them to click, because the children’s fine motor skills
are not fully developed until they are ten years old. (Falbe, 2015.) During the sessions,
some of the testers seemed confused about what to do to continue, and the button to press
had to be pointed out to several of the students, including one of the fifth graders. Using
outlines on the buttons or adding drop shadows to them can make them look more inter-
active. Clickable items should draw the user’s attention, as children are not as used to

50
interfaces as adults are. They do not necessarily understand that an object is interactive if
it does not wiggle or sparkle. (White, 2016).
PICTURE 13. Original flat button vs. improved button.
The old button had a slight drop shadow applied, but it did not pop up enough from dif-
ferent backgrounds and looked too flat. The 3D-effect in the new button invites the user’s
attention to it and is more clearly a clickable item. In addition, the button should start to
glow after a time-out period, if it remains unclicked. A child-friendly font filling the qual-
ifications mentioned in the next paragraph, called Berlin Sans FB was used. The font also
looks more interesting, and it should appeal to young players.
Tim Murray (2015) suggests that using a font with one-story lowercase "a" and "g" rather
than the double-story form might make the text more accessible to children. Children are
not as used to recognizing different styles of letters as adults, so it is a good idea to keep
the fonts simple, easy to understand and similar to the type of letters that the children start
to learn in school. Adults simply compare the glyphs we see with the letter variations that
we are already familiar with, and then decode the given glyph based on the closest com-
parison. Most of the time, we are right, and are not even aware of this process happening
(Simply Robert: Fonts and Young Readers, 2009). Comic Sans and Futura, for example,
are fonts that fill the qualifications with one-story lower cases and as a bonus have a
closed 4 that makes the number easy to distinguish from the capital letter H or Y
(McCullough, 2015). Important qualities to consider when choosing a font for children
also includes checking how well the capital I can be told apart from lower case l and
number 1. Developed readers are able to determine which letter they are looking at by the
context of the word, but for children the similarity between those letters can be very con-
fusing. (Simply Robert: Fonts and Young Readers, 2009).

51
5.2.4 Improvements on visual feedback
It is especially beneficial for the motivation of a child to receive immediate feedback and
rewards for doing well. This was an essential part of the mechanic-based calibration
game, where in order for the players gaze to remain fixed on the calibration spot, a visu-
alization of success or failure was displayed as a green or red lock. In addition to knowing
if they succeeded or not, the player receives experience points and coins based on their
score. These were not visualized at all in the original design, and for added motivation
this should be fixed. The score should as well be visualized immediately during the game
when theplayers catch the right option.
PICTURE 14. Player sees the points they get immediately, displayed over the icon visu-
alizing the correct selection.
This way, in addition to the satisfaction of getting the selection correct, the child gets an
immediate value reward as well. The points need to be displayed only for a second, ap-
pearing on top of the green symbol and falling out of the screen. In addition, more atten-
tion should be brought to the feedback given to the player after attempting to catch all the
buttons, when all the scores are tallied. Attention grabbing graphics and effects are nec-
essary to catch the attention of a young user. As receiving feedback whenever anything
happens is crucial for children, the design has to offer extremely clear signs when some-
thing important happens. (Designing Apps for Kids is Not Child’s Play, 2016).

52
PICTURE 15. Improvements for tallying total points and coins.
The player should be able to see the experience bar filling while the new points are added,
and be able to distinguish between the new points received and the ones they already had.
The amount of coins received on this round should be displayed with a number starting
from zero, and increasing in value until the prize amount is reached. This amount is then
added to the already existing amount of coins. The display box should also be more ac-
cented, and pop out from the screen to better bring the players attention to it. Text “expe-
rience points” is replaced with the current level to simplify the implied message that the
points are converted into the experience bar thus bringing the player closer to a level up.
PICTURE 16. Original points screen mockup after receiving a bonus item.

53
Only a few testers noticed that they had in fact reached the second level and gained the
item. Many did not pay attention to the points screen for long enough to see this. For the
few children who realized that they had reached the second level and got the bonus item,
the reaction was as hoped. The children seemed very happy about their accomplishment
and prizes, and one even turned around with a huge smile and excitement on his face.
This was exactly the effect that was being attempted to create. To make sure that the
reward is significant enough, receiving the price needs to be an event on itself and it
should not be possible for it to go unnoticed.
An improved scene for when a player gains a level or a bonus item could be as follows:
Before the prize box, animated fireworks fill the screen for 1-2 seconds. An empty bonus
reward circle appears in the middle of the screen, followed by the “Bonus reward” text.
The random reward received appears on the circle. The circle levitates on the screen for
1-2 seconds and then moves to the assigned spot on the prize box. If the player reached a
new level, the text “level x” would appear in the similar way, first bigger on the screen
and after some flaunting around moving to its assigned spot on the box. The new level
achievement would play before the bonus item.
5.3 Improved troll hunt
During the first sessions, the troll hunt was based on the assumption that the player would
be looking at the troll at the same moment as they clicked the mouse to catch it. This
proved to be incorrect, and they were already looking for the next troll by the time they
clicked the button. As Hyrskykari (39, 2006) points out, the eyes always move on the
target first, and the cursor follows after. There needed to be a way to lure their attention
to the exact spot where the troll was hiding. Because the troll hunt was not a part of the
initial calibration, there were no calibration spots to measure. We still needed to know
what spot the player was looking at when they pressed the button in order to validate the
calibration made during the lamp section of the game.
We added a condition where the invisible gaze controlled cursor had to be in the same
area as the one that the player could see and control with the mouse. The difficulty with
this option is that if the initial calibration was not precise enough, then these cursors
would not be together in the same spot and the player could not catch the troll. This was

54
compensated with a higher tolerance for the distance allowed between these two spots.
Knowing the distance enables the programmer to make calculations on the location. The
cursors were drawn in a more visualized way to bring the players attention to it. It would
be red (1) when it was not on top of a troll or the visible and invisible cursors were not
aligned, and nothing would happen if the player clicked at that time. When the cursor was
in a correct spot, and the distance between the visible cursor and the invisible gaze con-
trolled cursor was less than the threshold value, it would turn green (2) and have an ani-
mation of it getting bigger and smaller. In order to hold the players attention a little longer,
a third pointer (3) to visualize a successfully caught troll was added. After these changes,
the calibration results got better.
PICTURE 17. The different phases of the aim cursor in the hidden trolls -game.
The cursors could still be more obviously visualized, as some of the testers did not see or
understand the difference between the red and the green cursor. This was something that
had to be specifically told many of the testers and they needed to be reminded to look
directly at the troll. In some cases, there was some delay in getting the cursor to turn
green, and a few times, it did not change at all, but mostly the solution seemed to work
well and did not disrupt the smoothness of the gameplay in a significant way.

55
6 CONCLUSION
Both studies show that gamified calibration method, specifically the Mission Game based
on the specific mechanic, provide a good incentive for school children to carefully cali-
brate their eye trackers while maintaining a good calibration accuracy. The calibration
data shows that out of the three tested options significantly better calibration results come
from the Mission Game, even when the children are performing the calibration inde-
pendently. The testing sessions provided good information on the calibration quality of
the different methods, while the subjective feedback somewhat failed to show the ex-
pected outcome of children finding the standard calibration boring.
The subjective feedback could have been collected in a different way, to produce more
detailed information. When we started the testing with the second graders, the survey was
very simple, and focused on the testers to choose from options between fun and boring.
After it became clear that the children were rating all the games pretty much the same,
contrary to the comments made during the testing, we ended up having to do interviews
in order to get more specific information. Gunnar Tvedt explains in his paper “How to
design for children” that in user testing situations, children are unlikely to give any ana-
lytical feedback, which means that the developers have to rely on observations on the
behaviour and reactions of the children in order to find out whether they like the product
or not. (2016, 8.)
Given the option to do the surveys again, it might be a better idea to ask the children to
put the games into order starting from the most liked one and ending in the least favorite
one. It should also be emphasized that the children are rating the game itself, not their
own performance. We did not want to take too much of each group’ time after each ses-
sion, but a few pre-planned questions could be fitted into the time frame by having an
additional person waiting right outside the testing area or going around in the class room
asking the questions and making notes of the answers. The questions should provide in-
formation such as what were the most enjoyable / disliked aspects of a specific game. The
children could also be asked to rate the difficulty level of each game, and comment on if
they find it to be a good or a bad thing.
Overall, considering the tight schedule, the project could be considered successful. If
given the chance to redo the game design and the testing sessions, many improvements

56
could still be made based on this experience. If the previously suggested improvements
would be made to the game(s), the time spent on them could be reduced, they would be
more user-friendly, motivational and in general a more fluent experience for the players.
At this point there is already a good amount of data on the standard calibration, so further
user testing could be made specifically to improve the gamified calibration method. Based
on the experiences and feedback collected during these testing sessions, it seems quite
realistic to expect that a gamified calibration can be an effective and motivational way for
school children to calibrate their eye trackers before each use. With more work, improve-
ments, user testing and further customized options to accommodate a variety of age
groups, the calibration game could become a product suitable for using in many different
schools.

57
REFERENCES
7 Most Used Eye Tracking Metrics and Terms.2015. iMotions Blog. Read 18.2.2018. https://imotions.com/blog/7-terms-metrics-eye-tracking Bailey, R., Wise, K., Bolls, P. 2009. How Avatar Customizability Affects Children’s Arousal and Subjective Presence During Junk Food–Sponsored Online Video Games. Cyberpsychology & Behavior, Volume 12, Number 3, 2009. Mary Ann Liebert, Inc. Brathwaite, B., Schrieber, I. 2008. Challenges for Game Designers. Boston, USA. Course Technology, a part of Cengage Learning. Chen, J. 2006. Flow in Games, a Jenova Chen MFA Thesis. Read 03.02.2018. https://www.jenovachen.com/flowingames/flowing.htm Cordova, D, & Lepper, M. 1996. Intrinsic motivation and the process of learning: Bene-ficial effects of contextualization, personalization and choice. Journal of Educational Psychology, 88, 715–730. Eye Trackers & Sampling frequency. 2016. Objective Experience SG Blog. Read 18.2.2018. https://eyetracking.com.sg/2016/05/16/eye-trackers-sampling-frequency Eye Tracking Inc.: What is Eye Tracking? Read 04.02.2018. http://www.eyetracking.com/About-Us/What-Is-Eye-Tracking Falbe, T. 2015. Designing Web Interfaces for Kids. Published 10.8.2015 in SMASH-ING Magazine. https://www.smashingmagazine.com/2015/08/designing-web-inter-faces-for-kids/ Fischer, P. Kastenmüller, A., Greitemeyer, T. 2009. Media violence and the self: The impact of personalized gaming characters in aggressive video games on aggressive be-havior. Journal of Experimental Social Psychology 46 (2010) 192–195. Fisher, C. 2015. Designing Games for Children: Developmental, Usability, and Design Considerations for Making Games for Kids. Unites States: Focal Press, Taylor & Fran-cis Group. Flatla D., Gutwin, C. Nacke, L., Bateman, S., Mandryk. 2011. Calibration Games: Mak-ing Calibration Tasks Enjoyable by Adding Motivating Game Elements. ACM, NewYork, NY, USA, 403–412. https://doi.org/10.1145/2047196.2047248 Gallavin, G. 2015. UX for Kids’ Products: Designing for the Youngest of Users. Read 03.02.2018. https://www.usertesting.com/blog/2015/04/29/ux-for-kids/ Hyrskykari, A. 2006. Eyes in Attentive Interfaces: Experiences from Creating iDict, a Gaze-Aware Reading Aid. Department of Computer Sciences, University of Tampere. iMotions. 2017. Eye Tracking, The Complete Pocket Guide. Downloaded and read on 04.02.2018. https://imotions.com/eyetracking-guide-ebook

58
Marczewski, A. 2015. Game Thinking. Even Ninja Monkeys Like to Play: Gamifica-tion, Game Thinking and Motivational Design. CreateSpace Independent Publishing Platform. Murray, T., McCullough, I. 2015. Readability is relative. Read 4.1.2018. https://www.quora.com/What-is-the-easiest-font-for-kids-to-read Nam, H. 2010. Designing User Experiences for Children. Published 17.05.2018 in ux-matters.com. Read on 11.02.2018. https://www.uxmatters.com/mt/archives/2010/05/designing-user-experiences-for-children.php Nielsen, J. 2010. Children's Websites: Usability Issues in Designing for Young People. Read 03.02.2018. https://www.nngroup.com/articles/childrens-websites-usability-is-sues/ Ohno, T., Hara, K. & Inagaki, H. 2008. Simple to Calibrate Gaze Tracking Method, in book: Passive Eye Monitoring, 111-131. School of Game Design: Design Games for Kids. Read 27.12.2017. https://schoolofgamedesign.com/project/design-games-for-kids/ Simply Robert: Fonts and Young Readers. Read 4.1.2018. https://simplyrobert.wordpress.com/2009/12/15/fonts-and-young-readers/ Špakov, O., Siirtola, H., Istance, H., Räihä, K. 2017. Visualizing the Reading Activity of People Learning to Read, in Journal of Eye Movement Research. Finland: University of Tampere. Špakov, O., Siirtola, H., Istance, H., Räihä, K., Viitanen, T. 2018. Enabling Unsuper-vised Eye Tracker Calibration by School Children through Games. Submitted for pub-lishing in Proceedings of ACM CHI Symposium on Eye Tracking Research and Appli-cations (ETRA’18). ACM, New York, NY, USA. Tobii Dynavox: How Eye Tracking Works? Read 04.02.2018. https://www.tobiidynavox.com/about/about-us/how-eye-tracking-works Trepte, S., Reinecke, L. 2011. The Pleasures of Success: Game-Related Efficacy Expe-riences as a Mediator Between Player Performance and Game Enjoyment. Cyberpsy-chology & Behavior, Volume 14, Number 9, 2011. Mary Ann Liebert, Inc. Turkay, S. 2014. The Effects of Avatar-based Customization on Player Identification. International Journal of Gaming and Computer-Mediated Simulations, 6(1), 1-26, Janu-ary-March 2014. Tvedt, G. 2016. How to design for children. Methods and considerations for product at-tachment. A specialization article for written in the Norwegian University of Science and Technology. Types of eye movement. Eye Tracking Essentials by Tobii Pro. Read 18.2.2018. https://www.tobiipro.com/learn-and-support/learn/eye-tracking-essentials/types-of-eye-movements

59
White, B. 2016. Designing for Kids Is Not Child’s Play. Published 20.1.2016 in SMASHING Magazine. https://www.smashingmagazine.com/2016/01/designing-apps-for-kids-is-not-childs-play/ Williams, C. Eye movements and cognitive psychology: How eye movements work as window on mental processes? Mississippi State University. https://create4stem.msu.edu/sites/default/files/event/files/WilliamsMSUeyeconferencepaper.pdf Zichermann, G., Cunningham, C. 2011. Gamification by Design: Implementing Game Mechanics in Web and Mobile Apps. Canada: O’Reilly Media, Inc.
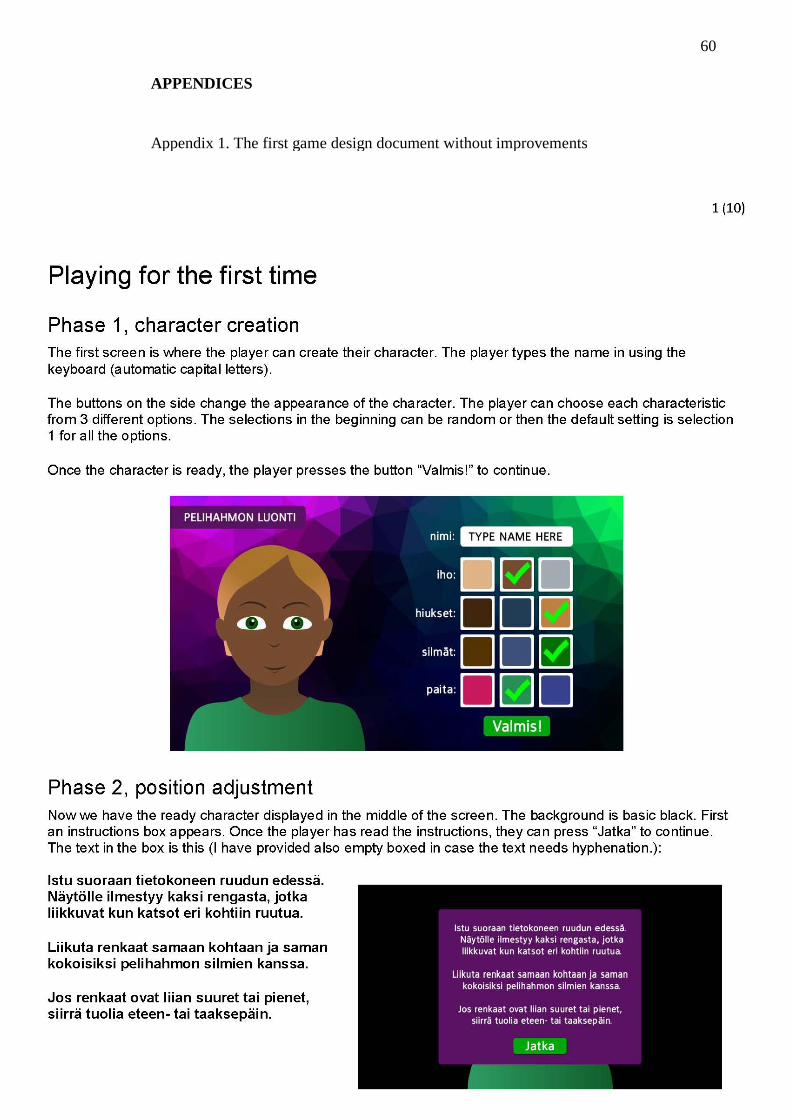
60
APPENDICES
Appendix 1. The first game design document without improvements

61

62

63
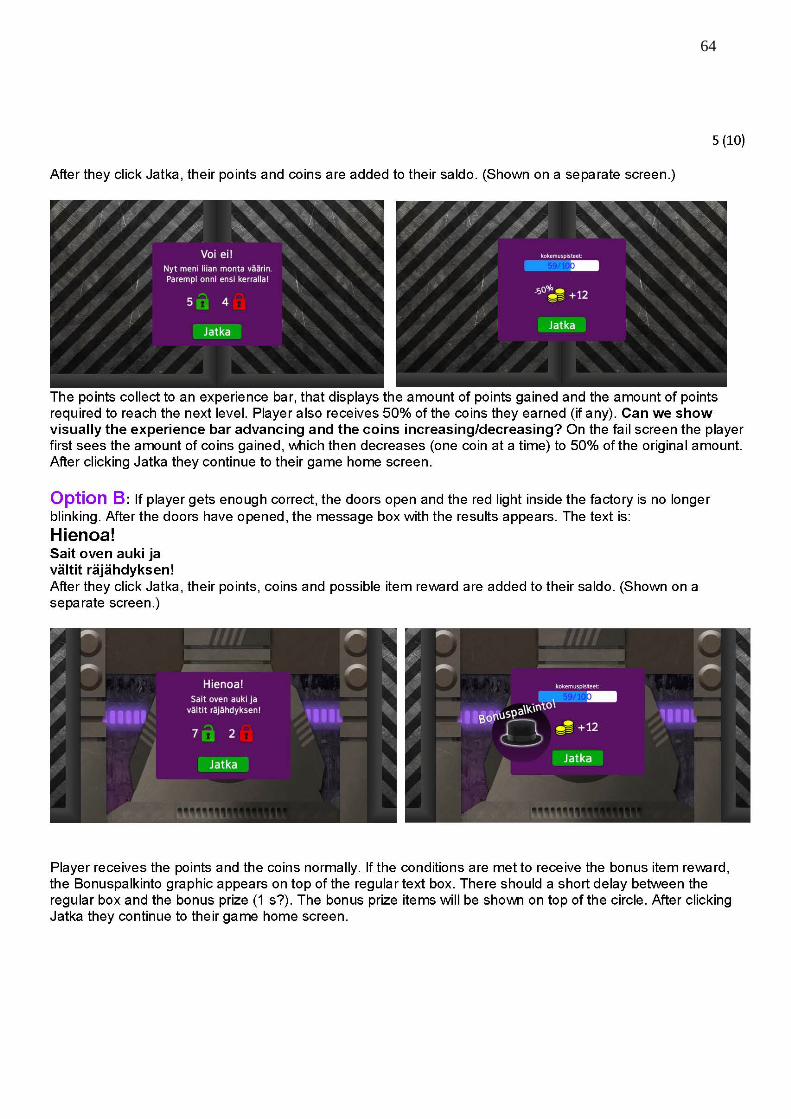
64
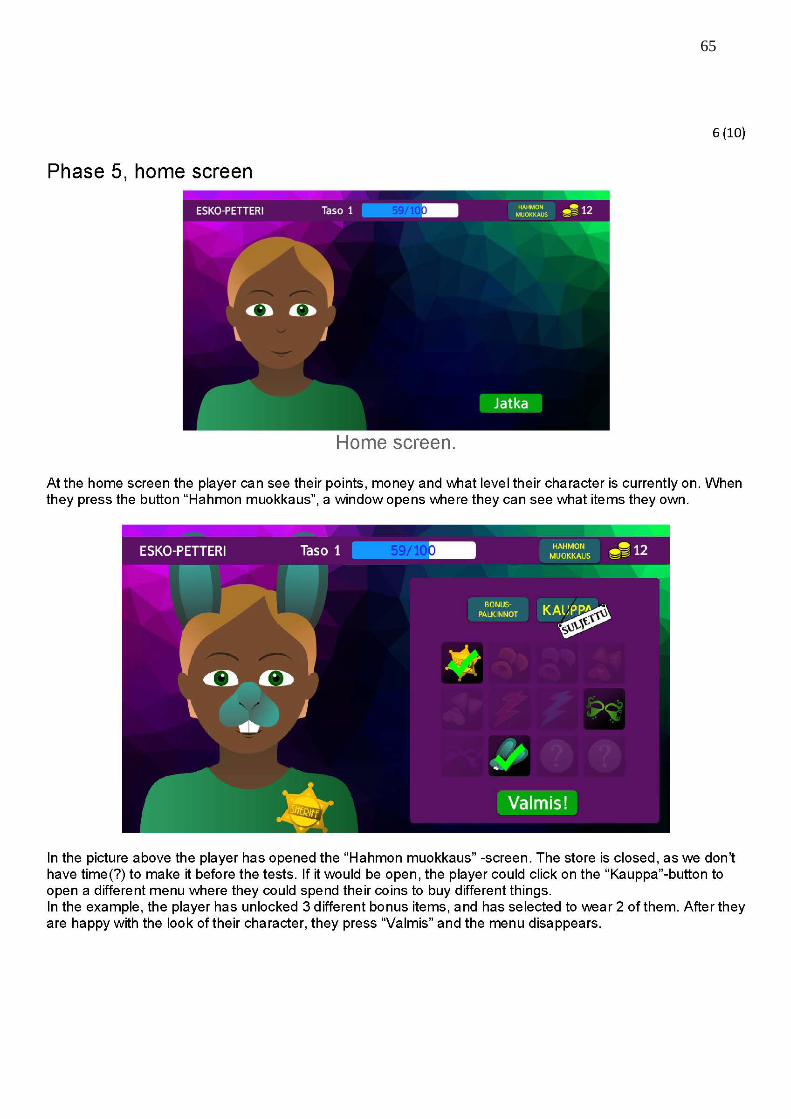
65

66

67
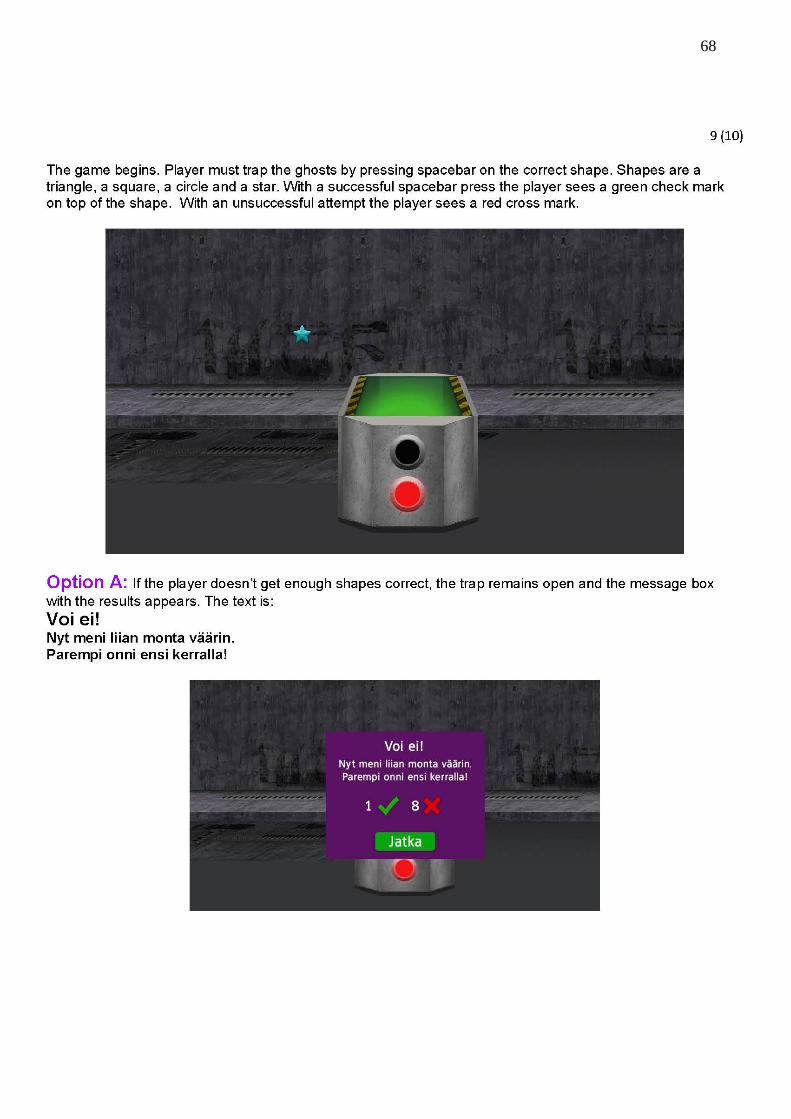
68

69

70
Appendix 2. Second graders survey results

71
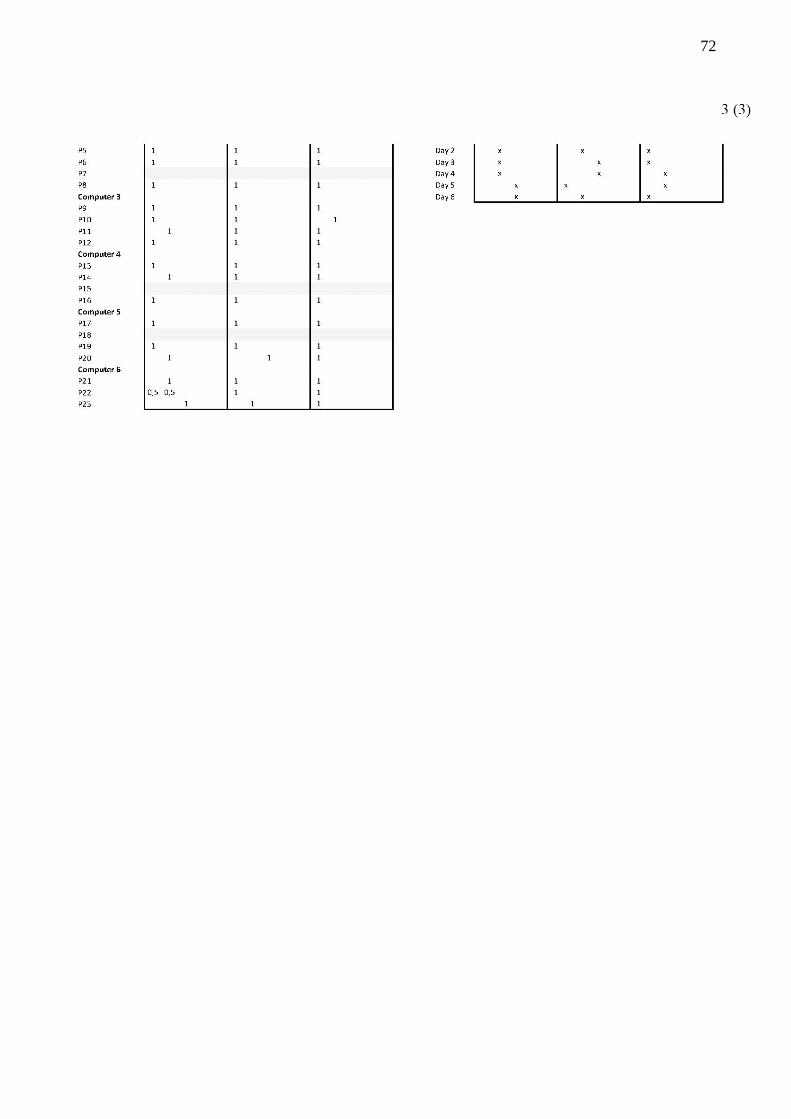
72

73
Appendix 3. Example of a filled survey

74
Appendix 4. Survey results by game

75

76


![arXiv:1612.04335v1 [cs.CV] 13 Dec 2016webdiis.unizar.es/~aserrano/docs/Sitzmann_arxiv2016_SaliencyVR.pdf · condition, the eye tracker yielded a single gaze position. We linearly](https://static.fdocuments.us/doc/165x107/5f5028a79c111538ca60553b/arxiv161204335v1-cscv-13-dec-aserranodocssitzmannarxiv2016saliencyvrpdf.jpg)

![A Gaze Gesture-Based User Authentication System to ...library.usc.edu.ph/ACM/CHI 2017/2exab/ea1978.pdfCamera, 2 - Authentication interface, 3 - Eye tracker]. Figure 2: Gaze gesture-based](https://static.fdocuments.us/doc/165x107/5faaaba9b03f6d34b2222ac9/a-gaze-gesture-based-user-authentication-system-to-20172exabea1978pdf-camera.jpg)

