Introduction to the Strategic Monitoring Plan · Update SMP sample tracker Scan and save meter...
52
Introduction To The Strategic Monitoring Plan (SMP) Curtis Musson Division of Environmental Assessment and Restoration September, 2018
-
Upload
truongduong -
Category
Documents
-
view
219 -
download
0
Transcript of Introduction to the Strategic Monitoring Plan · Update SMP sample tracker Scan and save meter...

Introduction To The Strategic Monitoring Plan (SMP)
Curtis MussonDivision of Environmental Assessment and Restoration
September, 2018

2
• A waterbody analyte specific annual sampling plan developed for each Regional Operations Center (ROC).
• Waterbodies are selected because they are potentially impaired but do not have sufficient data to be fully assessed.
• Additional waterbodies may be added to meet division goals.
What is the SMP

3
To generate sufficient, scientifically defensible water quality andbiological data to assess surface waters as defined in
Chapters 62‐302, and 62‐303, 62-304, F.A.C. The data generated are used by the department to update the 303(d) list.
Program Goal
62-302, F.A.C . Surface Water Quality Standards62-303, F.A.C. Identification of Impaired Surface Waters62-304, F.A.C . Total Maximum Daily Load

4
Section 303(d) of the Federal Clean Water Act requires states to:• Identify waters that do not meet applicable water quality standards
• Impaired Waters• Identify pollutant causing or expected to cause impairment• Submit the list of impaired waters to EPA
• 303(d) List• Establish water quality improvement targets
• TMDLs (Total Daily Maximum Loads)• Implement water quality restoration measures to achieve the TMDL targets
303(d) Clean Water Act

5
• Generate water quality data and upload the results to the Watershed Information Network (WIN).
• Conduct bioassessment and enter the observations into the Statewide Biological Database (SBIO).
Staff Responsibilities

6
Before Sampling � Create a WIN station
o If applicable create a new SBIO station � Create a WBID and Station folders in the appropriate year, organization, location in the Strategic Monitoring
folder on the FTP. � Create LIMS RQ � Save RQ in the appropriate year, organization, RQ folder location in the Strategic Monitoring folder on the FTP. � Schedule site in the Monitoring Activities Tracker. � Print labels and field sheets � QC labels. Site name and WIN ID need to match WIN exactly. Use WIN ID for the Field ID. � QC field sheets (if using prefilled field sheets) Site name and WIN ID need to match WIN exactly.
During Sampling � Fill out the field sheets(s) completely and correctly. Sign completed field sheets. Attach sampling labels to sheet. � Fill out Lab Submittal Form completely and correctly. Attach sampling labels to Submittal Form. If there are
errors on the label do not use them on the submittal form. After Sampling
� Review field sheets. Makes sure they are filled out completely, correctly and signed. � Update SMP sample tracker � Scan and save meter calibration log
o Scan/save daily calibration logs shortly after event o Scan/save temperature and depth calibration logs when applicable
� Enter Date Collected in the Monitoring Activities Tracker. � Enter field data into LIMS DMT
o QC WIN Station ID, Field ID, Date, Time in LIMS DMT o Initial and date the field sheet
� Enter Bioassessment data in to SBIO o Create Station Visit
Update field sheet and bioassessment forms with SBIO ID If LVS is less than 2 square meters check the LVS < 2 SQM box.
o Enter Habitat Assessment, RPS, PhysChem and Macrophyte data Update field sheet and bioassessment forms with HA, RPS and Macrophyte ID Note entered, Initial and date the bioassessment forms.
� Upload pictures to the appropriate year, organization, location in the Strategic Monitoring folder on the FTP. � QC the information in the LIMS DMT, not to be done by the person that entered the data.
o Field Data, WIN Station, Field ID, Date, Time o Initial and date the field sheet
� QC SBIO data. Not to be done by the person that entered the data o Note QC’ed, Initial and date bioassessment form.
� Scan/save field sheets, Submittal forms, CofC’s, bioassessment forms and calibration log to the appropriate year, organization, WBID, Station folder in the Strategic Monitoring folder on the FTP.
o Initial and date the field sheet � Authorize SBIO data
o Note Authorization, Initial and date bioassessment form. � Merge LIMS data in to WIN, SBIO
o Initial and date the field sheet � Verify data is in WIN
o Under the correct Station o Under the correct WBID o Initial and date the field sheet
� File hard copies of field sheets and calibration logs for long term storage.

7
• Basin Groups (5 Groups, 29 Basins)• WBID (Waterbody Identification Number)
Waterbody Data Management

8
Basin Groups• Assessments are done by
Basin Group Number, 1 -5
• The WBIDs of one Basin Group are assessed annually
• 2018 – Group 1
• 2019 – Group 2
• 2020 – Group 3
• 2021 – Group 4
• 2022 – Group 5
• 2023 – Group 1

9
Assessment Periods

10
Assessment Periods
11
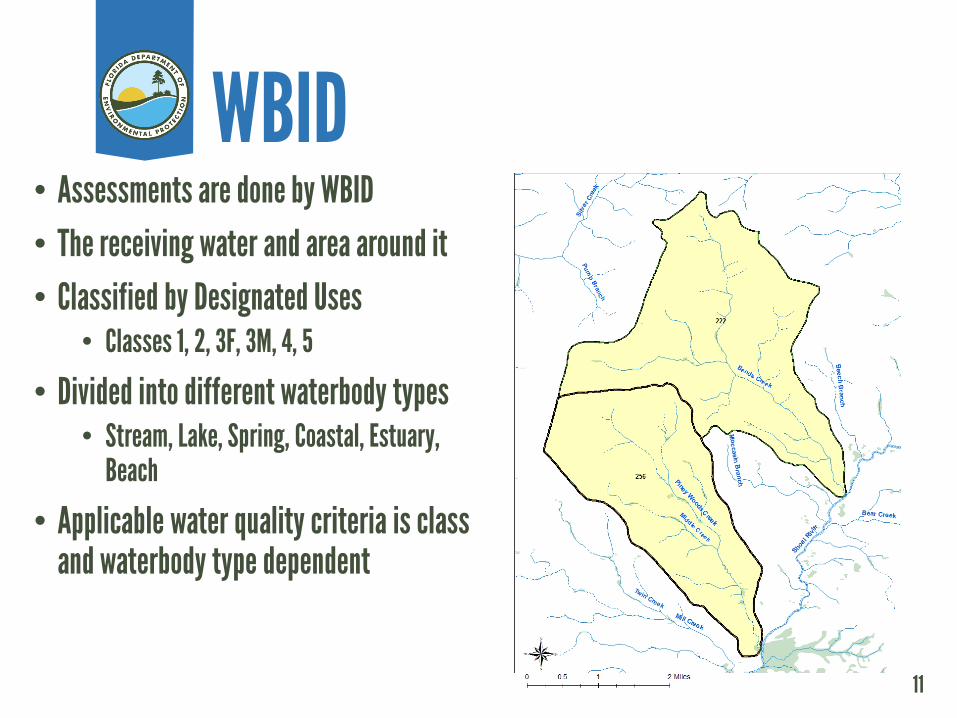
• Assessments are done by WBID• The receiving water and area around it• Classified by Designated Uses
• Classes 1, 2, 3F, 3M, 4, 5
• Divided into different waterbody types• Stream, Lake, Spring, Coastal, Estuary,
Beach
• Applicable water quality criteria is class and waterbody type dependent
WBID
12
• Class 1 – Potable water supplies• Class 2 -Shellfish propagation or harvesting • Class 3F, 3M – Fish consumption, recreation, propagation and
maintenance of a of a healthy, well balanced fish and wildlife population
• Class 4 – Agricultural water supply• Class 5 – Navigation, utility and industrial use
WBID Classification

13
• Stream: River segment, stream, spring run, or canal• Lake: A lake • Spring: The spring vent(s), not the spring run• Coastal: Open water marine water segments• Estuary: Near shore marine water segments• Beach: Bathing area subject to DOH advisories, warnings, and closures
WBID Waterbody Types
The above statements are generalizations, and may not be true for individual WBIDs.

14
Stream WBIDHydrology: Stream, Creek, Branch etc..

15
Stream WBIDHydrology: River

16
Lake WBID

17
Stream WBID
Spring WBID

18
Coastal WBID

19
Estuary WBID

20
• Water Quality• Dissolved Oxygen• Chlorophyll –a• Nutrients• Metals• Bacteria• Pesticides• Physical parameters (pH, Temp. Conductivity, Color, Alkalinity…)• quantitative polymerase chain reaction (qPCR)• Waste Water Tracers
• Medications• Artificial Sweeteners
• Bioassessments• Stream Condition Index• Rapid Periphyton Survey• Linear Vegetation Survey• Lake Vegetation Index
Target AnalytesAnalyte suites are WBID specific

21
• Exceedance Ratio• Bacteria, Metals, DO, Pesticides*, Physical parameters* • 62-303, F.A.C.
• Planning list, Table 1• Verified list, Table 3
• Numeric Nutrient Criteria (NNC)• Total Nitrogen, Total Phosphorus, Nitrate-Nitrite, & Chlorophyll – a
• Bioassessments • SCI, RPS, LVS, LVI
*Water quality standards may not exist
No water quality standards currently exist for qPCR or wastewater tracers
Assessment Types
22
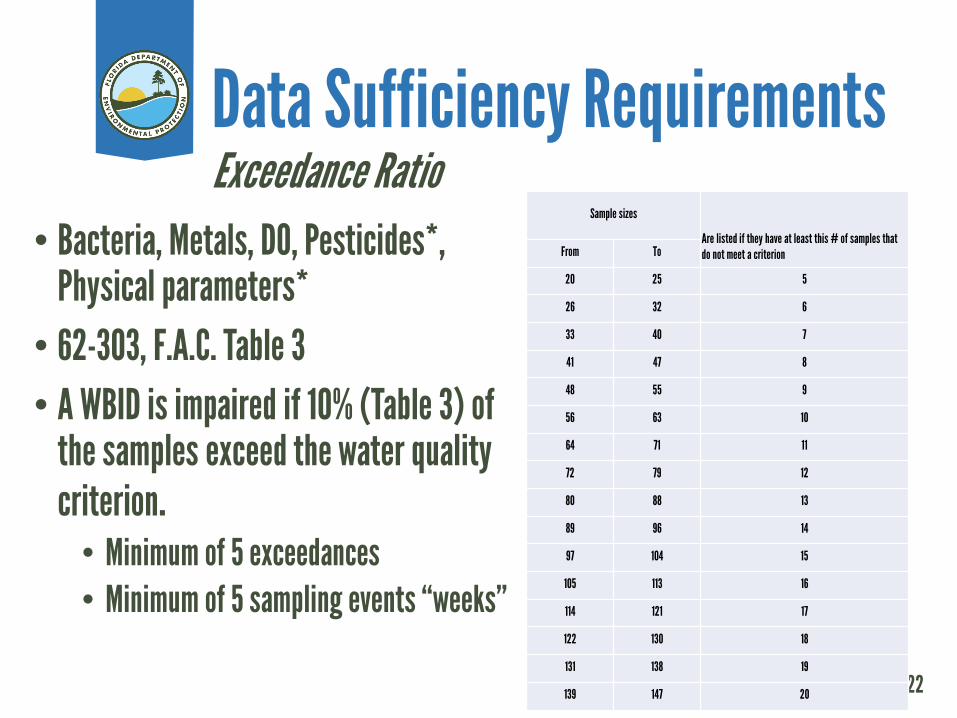
Data Sufficiency Requirements
• Bacteria, Metals, DO, Pesticides*, Physical parameters*
• 62-303, F.A.C. Table 3• A WBID is impaired if 10% (Table 3) of
the samples exceed the water quality criterion.
• Minimum of 5 exceedances• Minimum of 5 sampling events “weeks”
Exceedance RatioSample sizes
Are listed if they have at least this # of samples that do not meet a criterionFrom To
20 25 5
26 32 6
33 40 7
41 47 8
48 55 9
56 63 10
64 71 11
72 79 12
80 88 13
89 96 14
97 104 15
105 113 16
114 121 17
122 130 18
131 138 19
139 147 20
23
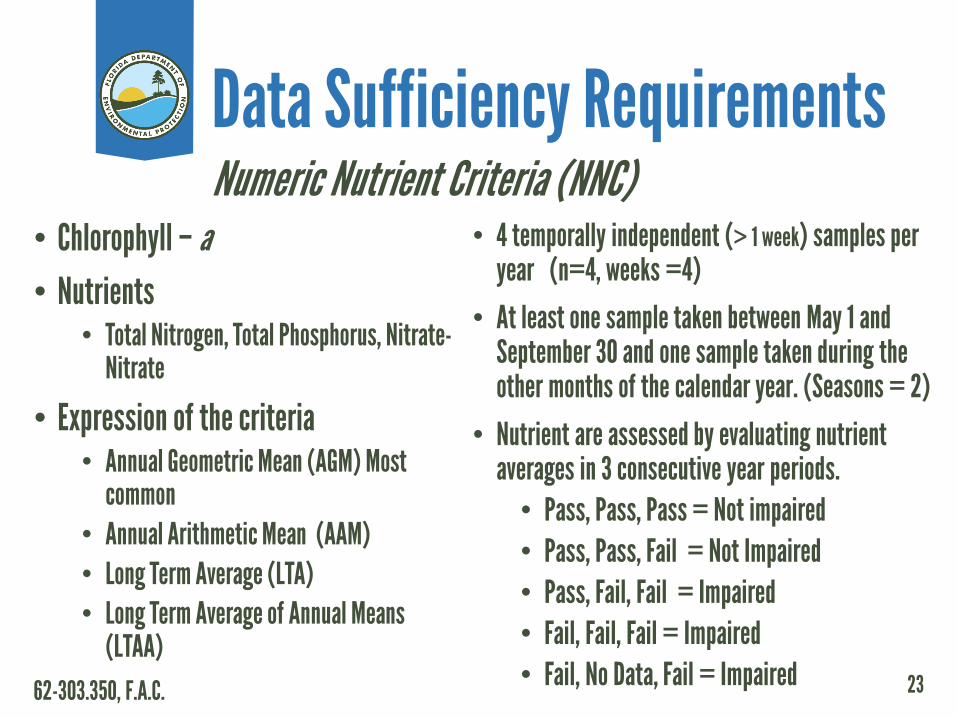
• Chlorophyll – a• Nutrients
• Total Nitrogen, Total Phosphorus, Nitrate-Nitrate
• Expression of the criteria• Annual Geometric Mean (AGM) Most
common• Annual Arithmetic Mean (AAM)• Long Term Average (LTA)• Long Term Average of Annual Means
(LTAA)62-303.350, F.A.C.
• 4 temporally independent (> 1 week) samples per year (n=4, weeks =4)
• At least one sample taken between May 1 and September 30 and one sample taken during the other months of the calendar year. (Seasons = 2)
• Nutrient are assessed by evaluating nutrient averages in 3 consecutive year periods.
• Pass, Pass, Pass = Not impaired• Pass, Pass, Fail = Not Impaired• Pass, Fail, Fail = Impaired• Fail, Fail, Fail = Impaired• Fail, No Data, Fail = Impaired
Data Sufficiency RequirementsNumeric Nutrient Criteria (NNC)
24
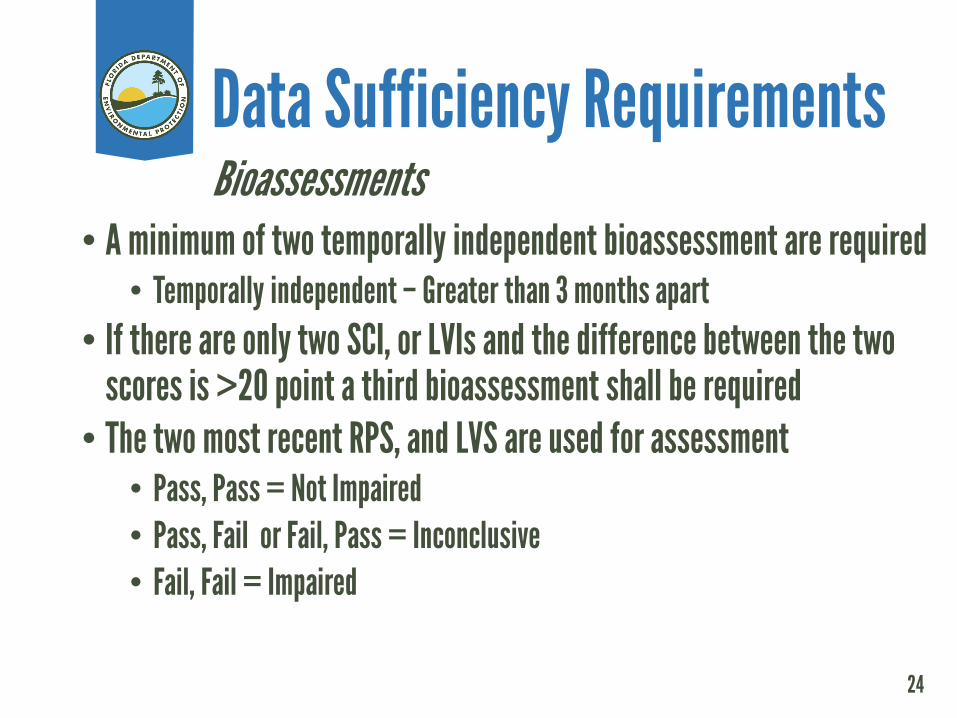
Data Sufficiency Requirements
• A minimum of two temporally independent bioassessment are required• Temporally independent – Greater than 3 months apart
• If there are only two SCI, or LVIs and the difference between the two scores is >20 point a third bioassessment shall be required
• The two most recent RPS, and LVS are used for assessment• Pass, Pass = Not Impaired• Pass, Fail or Fail, Pass = Inconclusive• Fail, Fail = Impaired
Bioassessments

25
Excerpt of the SMP

26
Status Network vs. SMPStatus SMP
Approach Random stratified Single Sampling event
TargetedMultiple sampling events per year, 1-3 years
EPA Rule 305(b) 303(d)
Analyte Suite 1 analyte suite per Resource WBID Specific
Matrix Surface water Ground waterSediment Bioassessments (LVI, HA)
Surface WaterBioassessments (SCI, LVI, RPS, LVS, HA)
Resource/Waterbodies Aquifer (Confined, Unconfined), CanalsLakes (Small, Large), Large Rivers, Small Streams
Streams, Lakes, Springs, Estuaries, Coastal waters
Water Quality Evaluation By Zone and Resource (ex. Z1-SL)Only use Status data points
By WBIDUse all available data in WIN, STORET, and SBIO
Site Selection Watershed Monitoring Section picks the site Watershed Assessment Section picks the WBIDs, You, the sampler pick the sites.


28
Assessment ExamplesTPTV aka Exceedance Ratio Sample sizes
Are listed if they have at least this # of samples that do not meet a criterionFrom To
20 25 5
26 32 6
33 40 7
41 47 8
48 55 9
56 63 10
64 71 11
72 79 12
80 88 13
89 96 14
97 104 15
105 113 16
114 121 17
122 130 18
131 138 19
139 147 20
WBID Waterbody Name
Parameter Data Assessment Call
1003 Dog Pond Iron 0/0
1006 Wakulla River Iron 0/64
1009A Western Lake Iron 1/1
10C Escambia River Iron 24/26
1943 Indian Creek Iron 4/4
Number of ExceedancesTotal Sample Size

29
Assessment ExamplesTPTV aka Exceedance Ratio Sample sizes
Are listed if they have at least this # of samples that do not meet a criterionFrom To
20 25 5
26 32 6
33 40 7
41 47 8
48 55 9
56 63 10
64 71 11
72 79 12
80 88 13
89 96 14
97 104 15
105 113 16
114 121 17
122 130 18
131 138 19
139 147 20
WBID Waterbody Name
Parameter Data Assessment Call
1003 Dog Pond Iron 0/0 No Data
1006 Wakulla River Iron 0/64
1009A Western Lake Iron 1/1
10C Escambia River Iron 24/26
1943 Indian Creek Iron 4/4
Number of ExceedancesTotal Sample Size

30
Assessment ExamplesTPTV aka Exceedance Ratio Sample sizes
Are listed if they have at least this # of samples that do not meet a criterionFrom To
20 25 5
26 32 6
33 40 7
41 47 8
48 55 9
56 63 10
64 71 11
72 79 12
80 88 13
89 96 14
97 104 15
105 113 16
114 121 17
122 130 18
131 138 19
139 147 20
WBID Waterbody Name
Parameter Data Assessment Call
1003 Dog Pond Iron 0/0 No data
1006 Wakulla River Iron 0/64 Not Impaired
1009A Western Lake Iron 1/1
10C Escambia River Iron 24/26
1943 Indian Creek Iron 4/4
Number of ExceedancesTotal Sample Size

31
Assessment ExamplesTPTV aka Exceedance Ratio Sample sizes
Are listed if they have at least this # of samples that do not meet a criterionFrom To
20 25 5
26 32 6
33 40 7
41 47 8
48 55 9
56 63 10
64 71 11
72 79 12
80 88 13
89 96 14
97 104 15
105 113 16
114 121 17
122 130 18
131 138 19
139 147 20
WBID Waterbody Name
Parameter Data Assessment Call
1003 Dog Pond Iron 0/0 No Data
1006 Wakulla River Iron 0/64 Not Impaired
1009A Western Lake Iron 1/1 Insufficient Data
10C Escambia River Iron 24/26
1943 Indian Creek Iron 4/4
Number of ExceedancesTotal Sample Size

32
Assessment ExamplesTPTV aka Exceedance Ratio Sample sizes
Are listed if they have at least this # of samples that do not meet a criterionFrom To
20 25 5
26 32 633 40 7
41 47 8
48 55 9
56 63 10
64 71 11
72 79 12
80 88 13
89 96 14
97 104 15
105 113 16
114 121 17
122 130 18
131 138 19
139 147 20
WBID Waterbody Name
Parameter Data Assessment Call
1003 Dog Pond Iron 0/0 No Data
1006 Wakulla River Iron 0/64 Not Impaired
1009A Western Lake Iron 1/1 Insufficient Data
10C Escambia River Iron 24/26 Impaired
1943 Indian Creek Iron 4/4
Number of ExceedancesTotal Sample Size

33
Assessment ExamplesTPTV aka Exceedance Ratio Sample sizes
Are listed if they have at least this # of samples that do not meet a criterionFrom To
20 25 5
26 32 6
33 40 7
41 47 8
48 55 9
56 63 10
64 71 11
72 79 12
80 88 13
89 96 14
97 104 15
105 113 16
114 121 17
122 130 18
131 138 19
139 147 20
WBID Waterbody Name
Parameter Data Assessment Call
1003 Dog Pond Iron 0/0 No Data
1006 Wakulla River Iron 0/64 Not Impaired
1009A Western Lake Iron 1/1 Insufficient Data
10C Escambia River Iron 24/26 Impaired
1943 Indian Creek Iron 4/4 Planning List
Number of ExceedancesTotal Sample Size

34
Assessment ExampleWBID Waterbody Name Waterbody
Type Class Parameters Criteria Assessment Data
Assessment Category
1043 Doyle Bayou Estuary 2 Nutrients (Chlorophyll-a) 11 µg/L No Data
1443E Hillsborough River Estuary 3M Nutrients (Chlorophyll-a) 11 µg/L
AGM2012 (4 µg/L)2013 (5 µg/L)2014 (7 µg/L)2015 (10 µg/L)2016 (6 µg/L)2017 (7 µg/L)
1508 Klosterman Bayou Estuary 3M Nutrients (Chlorophyll-a) 11 µg/L
AGM2015 (19 µg/L)2016 (18 µg/L)2017 (29 µg/L)
1530 Moccasin Creek Tidal Estuary 3M Nutrients (Chlorophyll-a) 11 µg/L
AGM2017 (7 µg/L)2018 (18 µg/L)
2059 Cleveland Cemetery Ditch Estuary 3M Nutrients
(Chlorophyll-a) 11 µg/L AGM2015 (2 µg/L)
Numeric Nutrient Criteria

35
Assessment ExampleWBID Waterbody Name Waterbody
Type Class Parameters Criteria Assessment Data
Assessment Category
1043 Doyle Bayou Estuary 2 Nutrients (Chlorophyll-a) 11 µg/L No Data No Data
1443E Hillsborough River Estuary 3M Nutrients (Chlorophyll-a) 11 µg/L
AGM2012 (4 µg/L)2013 (5 µg/L)2014 (7 µg/L)2015 (10 µg/L)2016 (6 µg/L)2017 (7 µg/L)
1508 Klosterman Bayou Estuary 3M Nutrients (Chlorophyll-a) 11 µg/L
AGM2015 (19 µg/L)2016 (18 µg/L)2017 (29 µg/L)
1530 Moccasin Creek Tidal Estuary 3M Nutrients (Chlorophyll-a) 11 µg/L
AGM2017 (7 µg/L)2018 (18 µg/L)
2059 Cleveland Cemetery Ditch Estuary 3M Nutrients
(Chlorophyll-a) 11 µg/L AGM2015 (2 µg/L)
Numeric Nutrient Criteria

36
Assessment ExampleWBID Waterbody Name Waterbody
Type Class Parameters Criteria Assessment Data
Assessment Category
1043 Doyle Bayou Estuary 2 Nutrients (Chlorophyll-a) 11 µg/L No Data No Data
1443E Hillsborough River Estuary 3M Nutrients (Chlorophyll-a) 11 µg/L
AGM2012 (4 µg/L)2013 (5 µg/L)2014 (7 µg/L)2015 (10 µg/L)2016 (6 µg/L)2017 (7 µg/L)
Not Impaired
1508 Klosterman Bayou Estuary 3M Nutrients (Chlorophyll-a) 11 µg/L
AGM2015 (19 µg/L)2016 (18 µg/L)2017 (29 µg/L)
1530 Moccasin Creek Tidal Estuary 3M Nutrients (Chlorophyll-a) 11 µg/L
AGM2017 (7 µg/L)2018 (18 µg/L)
2059 Cleveland Cemetery Ditch Estuary 3M Nutrients
(Chlorophyll-a) 11 µg/L AGM2015 (2 µg/L)
Numeric Nutrient Criteria

37
Assessment ExampleWBID Waterbody Name Waterbody
Type Class Parameters Criteria Assessment Data
Assessment Category
1043 Doyle Bayou Estuary 2 Nutrients (Chlorophyll-a) 11 µg/L No Data No Data
1443E Hillsborough River Estuary 3M Nutrients (Chlorophyll-a) 11 µg/L
AGM2012 (4 µg/L)2013 (5 µg/L)2014 (7 µg/L)2015 (10 µg/L)2016 (6 µg/L)2017 (7 µg/L)
Not Impaired
1508 Klosterman Bayou Estuary 3M Nutrients (Chlorophyll-a) 11 µg/L
AGM2015 (19 µg/L)2016 (18 µg/L)2017 (29 µg/L)
Impaired
1530 Moccasin Creek Tidal Estuary 3M Nutrients (Chlorophyll-a) 11 µg/L
AGM2017 (7 µg/L)2018 (18 µg/L)
2059 Cleveland Cemetery Ditch Estuary 3M Nutrients
(Chlorophyll-a) 11 µg/L AGM2015 (2 µg/L)
Numeric Nutrient Criteria

38
Assessment ExampleWBID Waterbody Name Waterbody
Type Class Parameters Criteria Assessment Data
Assessment Category
1043 Doyle Bayou Estuary 2 Nutrients (Chlorophyll-a) 11 µg/L No Data No Data
1443E Hillsborough River Estuary 3M Nutrients (Chlorophyll-a) 11 µg/L
AGM2012 (4 µg/L)2013 (5 µg/L)2014 (7 µg/L)2015 (10 µg/L)2016 (6 µg/L)2017 (7 µg/L)
Not Impaired
1508 Klosterman Bayou Estuary 3M Nutrients (Chlorophyll-a) 11 µg/L
AGM2015 (19 µg/L)2016 (18 µg/L)2017 (29 µg/L)
Impaired
1530 Moccasin Creek Tidal Estuary 3M Nutrients (Chlorophyll-a) 11 µg/L
AGM2017 (7 µg/L)2018 (18 µg/L)
Planning List
2059 Cleveland Cemetery Ditch Estuary 3M Nutrients
(Chlorophyll-a) 11 µg/L AGM2015 (2 µg/L)
Numeric Nutrient Criteria

39
Assessment ExampleWBID Waterbody Name Waterbody
Type Class Parameters Criteria Assessment Data
Assessment Category
1043 Doyle Bayou Estuary 2 Nutrients (Chlorophyll-a) 11 µg/L No Data No Data
1443E Hillsborough River Estuary 3M Nutrients (Chlorophyll-a) 11 µg/L
AGM2012 (4 µg/L)2013 (5 µg/L)2014 (7 µg/L)2015 (10 µg/L)2016 (6 µg/L)2017 (7 µg/L)
Not Impaired
1508 Klosterman Bayou Estuary 3M Nutrients (Chlorophyll-a) 11 µg/L
AGM2015 (19 µg/L)2016 (18 µg/L)2017 (29 µg/L)
Impaired
1530 Moccasin Creek Tidal Estuary 3M Nutrients (Chlorophyll-a) 11 µg/L
AGM2017 (7 µg/L)2018 (18 µg/L)
Planning List
2059 Cleveland Cemetery Ditch Estuary 3M Nutrients
(Chlorophyll-a) 11 µg/L AGM2015 (2 µg/L) Insufficient Data
Numeric Nutrient Criteria

40
Assessment ExampleGroup Name WBID Waterbody Name Waterbody
Type Class Parameter Criteria Data Assessmetn Call
Pensacola 104 Turkey Creek Stream 3F SCI 40SCI (N=1)
Big Mean (74)Mean 1 (74), Mean 2 (ND)
Tampa Bay Tributaries 1659 Rice Creek Stream 3F SCI 40
SCI (N=2)Big Mean (63)
Mean 1 (59), Mean 2 (67)
Sarasota Bay -Peace - Myakka 1997 Hawthorne Creek Stream 3F SCI 40
SCI (N=1)Big Mean (33)
Mean 1 (33), Mean 2 (ND)
Ocklawaha 2715 Gum Creek Stream 3F SCI 40 No Data
Caloosahatchee 3240L Powell Creek Stream 3F SCI 40SCI (N=2)
Big Mean (44.5)Mean 1 (62), Mean 2 (27)
Spring Coast 1567B Spring Branch Stream 3F SCI 40SCI (n=3)
Big Mean (32)Mean 1 (22), Mean 2 (41)
Stream Condition Index

41
Assessment ExampleGroup Name WBID Waterbody Name Waterbody
Type Class Parameter Criteria Data Assessmetn Call
Pensacola 104 Turkey Creek Stream 3F SCI 40SCI (N=1)
Big Mean (74)Mean 1 (74), Mean 2 (ND)
Insufficient Data
Tampa Bay Tributaries 1659 Rice Creek Stream 3F SCI 40
SCI (N=2)Big Mean (63)
Mean 1 (59), Mean 2 (67)
Sarasota Bay -Peace - Myakka 1997 Hawthorne Creek Stream 3F SCI 40
SCI (N=1)Big Mean (33)
Mean 1 (33), Mean 2 (ND)
Ocklawaha 2715 Gum Creek Stream 3F SCI 40 No Data
Caloosahatchee 3240L Powell Creek Stream 3F SCI 40SCI (N=2)
Big Mean (44.5)Mean 1 (62), Mean 2 (27)
Spring Coast 1567B Spring Branch Stream 3F SCI 40SCI (n=3)
Big Mean (32)Mean 1 (22), Mean 2 (41)
Stream Condition Index

42
Assessment ExampleGroup Name WBID Waterbody Name Waterbody
Type Class Parameter Criteria Data Assessmetn Call
Pensacola 104 Turkey Creek Stream 3F SCI 40SCI (N=1)
Big Mean (74)Mean 1 (74), Mean 2 (ND)
Insufficient Data
Tampa Bay Tributaries 1659 Rice Creek Stream 3F SCI 40
SCI (N=2)Big Mean (63)
Mean 1 (59), Mean 2 (67)Not Impaired
Sarasota Bay -Peace - Myakka 1997 Hawthorne Creek Stream 3F SCI 40
SCI (N=1)Big Mean (33)
Mean 1 (33), Mean 2 (ND)
Ocklawaha 2715 Gum Creek Stream 3F SCI 40 No Data
Caloosahatchee 3240L Powell Creek Stream 3F SCI 40SCI (N=2)
Big Mean (44.5)Mean 1 (62), Mean 2 (27)
Spring Coast 1567B Spring Branch Stream 3F SCI 40SCI (n=3)
Big Mean (32)Mean 1 (22), Mean 2 (41)
Stream Condition Index

43
Assessment ExampleGroup Name WBID Waterbody Name Waterbody
Type Class Parameter Criteria Data Assessmetn Call
Pensacola 104 Turkey Creek Stream 3F SCI 40SCI (N=1)
Big Mean (74)Mean 1 (74), Mean 2 (ND)
Insufficient Data
Tampa Bay Tributaries 1659 Rice Creek Stream 3F SCI 40
SCI (N=2)Big Mean (63)
Mean 1 (59), Mean 2 (67)Not Impaired
Sarasota Bay -Peace - Myakka 1997 Hawthorne Creek Stream 3F SCI 40
SCI (N=1)Big Mean (33)
Mean 1 (33), Mean 2 (ND)Planning List
Ocklawaha 2715 Gum Creek Stream 3F SCI 40 No Data
Caloosahatchee 3240L Powell Creek Stream 3F SCI 40SCI (N=2)
Big Mean (44.5)Mean 1 (62), Mean 2 (27)
Spring Coast 1567B Spring Branch Stream 3F SCI 40SCI (n=3)
Big Mean (32)Mean 1 (22), Mean 2 (41)
Stream Condition Index

44
Assessment ExampleGroup Name WBID Waterbody Name Waterbody
Type Class Parameter Criteria Data Assessmetn Call
Pensacola 104 Turkey Creek Stream 3F SCI 40SCI (N=1)
Big Mean (74)Mean 1 (74), Mean 2 (ND)
Insufficient Data
Tampa Bay Tributaries 1659 Rice Creek Stream 3F SCI 40
SCI (N=2)Big Mean (63)
Mean 1 (59), Mean 2 (67)Not Impaired
Sarasota Bay -Peace - Myakka 1997 Hawthorne Creek Stream 3F SCI 40
SCI (N=1)Big Mean (33)
Mean 1 (33), Mean 2 (ND)Planning List
Ocklawaha 2715 Gum Creek Stream 3F SCI 40 No Data No Data
Caloosahatchee 3240L Powell Creek Stream 3F SCI 40SCI (N=2)
Big Mean (44.5)Mean 1 (62), Mean 2 (27)
Spring Coast 1567B Spring Branch Stream 3F SCI 40SCI (n=3)
Big Mean (32)Mean 1 (22), Mean 2 (41)
Stream Condition Index

45
Assessment ExampleGroup Name WBID Waterbody Name Waterbody
Type Class Parameter Criteria Data Assessmetn Call
Pensacola 104 Turkey Creek Stream 3F SCI 40SCI (N=1)
Big Mean (74)Mean 1 (74), Mean 2 (ND)
Insufficient Data
Tampa Bay Tributaries 1659 Rice Creek Stream 3F SCI 40
SCI (N=2)Big Mean (63)
Mean 1 (59), Mean 2 (67)Not Impaired
Sarasota Bay -Peace - Myakka 1997 Hawthorne Creek Stream 3F SCI 40
SCI (N=1)Big Mean (33)
Mean 1 (33), Mean 2 (ND)Planning List
Ocklawaha 2715 Gum Creek Stream 3F SCI 40 No Data No Data
Caloosahatchee 3240L Powell Creek Stream 3F SCI 40SCI (N=2)
Big Mean (44.5)Mean 1 (62), Mean 2 (27)
Study List
Spring Coast 1567B Spring Branch Stream 3F SCI 40SCI (n=3)
Big Mean (32)Mean 1 (22), Mean 2 (41)
Stream Condition Index

46
Assessment ExampleGroup Name WBID Waterbody Name Waterbody
Type Class Parameter Criteria Data Assessmetn Call
Pensacola 104 Turkey Creek Stream 3F SCI 40SCI (N=1)
Big Mean (74)Mean 1 (74), Mean 2 (ND)
Insufficient Data
Tampa Bay Tributaries 1659 Rice Creek Stream 3F SCI 40
SCI (N=2)Big Mean (63)
Mean 1 (59), Mean 2 (67)Not Impaired
Sarasota Bay -Peace - Myakka 1997 Hawthorne Creek Stream 3F SCI 40
SCI (N=1)Big Mean (33)
Mean 1 (33), Mean 2 (ND)Planning List
Ocklawaha 2715 Gum Creek Stream 3F SCI 40 No Data No Data
Caloosahatchee 3240L Powell Creek Stream 3F SCI 40SCI (N=2)
Big Mean (44.5)Mean 1 (62), Mean 2 (27)
Study List
Spring Coast 1567B Spring Branch Stream 3F SCI 40SCI (n=3)
Big Mean (32)Mean 1 (22), Mean 2 (41)
Impaired
Stream Condition Index

47
Assessment ExampleGroup Name WBID Waterbody
NameWaterbod
y Type Class Parameter Criteria Data Call
Springs Coast 1392B Lake
Hancock Lake 3F LVI 43LVI (n=1)
Big Mean (22)Mean 1 (22), Mean 2 (ND)
Middle St. Johns 2899B Lake Kerr Lake 3F LVI 43
LVI (n=1)Big Mean (43)
Mean 1 (43), Mean 2 (ND)
Pensacola 179A Bear Lake Lake 3F LVI 43LVI (n=2)
Big Mean (53)Mean 1 (60), Mean 2 (46)
St. Lucie -Loxahatchee 3194G Lake Eden Lake 3F LVI 43
LVI (n=3)Big Mean (39)
Mean 1 (60), Mean 2 (54)
Kissimmee River 1860D Lake
Jackson Lake 3F LVI 43LVI (n=2)
Big Mean (39)Mean 1 (28), Mean 2 (50)
Lake Vegetation Index

48
Assessment ExampleGroup Name WBID Waterbody
NameWaterbod
y Type Class Parameter Criteria Data Call
Springs Coast 1392B Lake
Hancock Lake 3F LVI 43LVI (n=1)
Big Mean (22)Mean 1 (22), Mean 2 (ND)
Planning List
Middle St. Johns 2899B Lake Kerr Lake 3F LVI 43
LVI (n=1)Big Mean (43)
Mean 1 (43), Mean 2 (ND)
Pensacola 179A Bear Lake Lake 3F LVI 43LVI (n=2)
Big Mean (53)Mean 1 (60), Mean 2 (46)
St. Lucie -Loxahatchee 3194G Lake Eden Lake 3F LVI 43
LVI (n=3)Big Mean (39)
Mean 1 (60), Mean 2 (54)
Kissimmee River 1860D Lake
Jackson Lake 3F LVI 43LVI (n=2)
Big Mean (39)Mean 1 (28), Mean 2 (50)
Lake Vegetation Index

49
Assessment ExampleGroup Name WBID Waterbody
NameWaterbod
y Type Class Parameter Criteria Data Call
Springs Coast 1392B Lake
Hancock Lake 3F LVI 43LVI (n=1)
Big Mean (22)Mean 1 (22), Mean 2 (ND)
Planning List
Middle St. Johns 2899B Lake Kerr Lake 3F LVI 43
LVI (n=1)Big Mean (43)
Mean 1 (43), Mean 2 (ND)Insufficient Data
Pensacola 179A Bear Lake Lake 3F LVI 43LVI (n=2)
Big Mean (53)Mean 1 (60), Mean 2 (46)
St. Lucie -Loxahatchee 3194G Lake Eden Lake 3F LVI 43
LVI (n=3)Big Mean (39)
Mean 1 (60), Mean 2 (54)
Kissimmee River 1860D Lake
Jackson Lake 3F LVI 43LVI (n=2)
Big Mean (39)Mean 1 (28), Mean 2 (50)
Lake Vegetation Index

50
Assessment ExampleGroup Name WBID Waterbody
NameWaterbod
y Type Class Parameter Criteria Data Call
Springs Coast 1392B Lake
Hancock Lake 3F LVI 43LVI (n=1)
Big Mean (22)Mean 1 (22), Mean 2 (ND)
Planning List
Middle St. Johns 2899B Lake Kerr Lake 3F LVI 43
LVI (n=1)Big Mean (43)
Mean 1 (43), Mean 2 (ND)Insufficient Data
Pensacola 179A Bear Lake Lake 3F LVI 43LVI (n=2)
Big Mean (53)Mean 1 (60), Mean 2 (46)
Not Impaired
St. Lucie -Loxahatchee 3194G Lake Eden Lake 3F LVI 43
LVI (n=3)Big Mean (39)
Mean 1 (60), Mean 2 (54)
Kissimmee River 1860D Lake
Jackson Lake 3F LVI 43LVI (n=2)
Big Mean (39)Mean 1 (28), Mean 2 (50)
Lake Vegetation Index

51
Assessment ExampleGroup Name WBID Waterbody
NameWaterbod
y Type Class Parameter Criteria Data Call
Springs Coast 1392B Lake
Hancock Lake 3F LVI 43LVI (n=1)
Big Mean (22)Mean 1 (22), Mean 2 (ND)
Planning List
Middle St. Johns 2899B Lake Kerr Lake 3F LVI 43
LVI (n=1)Big Mean (43)
Mean 1 (43), Mean 2 (ND)Insufficient Data
Pensacola 179A Bear Lake Lake 3F LVI 43LVI (n=2)
Big Mean (53)Mean 1 (60), Mean 2 (46)
Not Impaired
St. Lucie -Loxahatchee 3194G Lake Eden Lake 3F LVI 43
LVI (n=3)Big Mean (39)
Mean 1 (60), Mean 2 (54)Impaired
Kissimmee River 1860D Lake
Jackson Lake 3F LVI 43LVI (n=2)
Big Mean (39)Mean 1 (28), Mean 2 (50)
Lake Vegetation Index

52
Assessment ExampleGroup Name WBID Waterbody
NameWaterbod
y Type Class Parameter Criteria Data Call
Springs Coast 1392B Lake
Hancock Lake 3F LVI 43LVI (n=1)
Big Mean (22)Mean 1 (22), Mean 2 (ND)
Planning List
Middle St. Johns 2899B Lake Kerr Lake 3F LVI 43
LVI (n=1)Big Mean (43)
Mean 1 (43), Mean 2 (ND)Insufficient Data
Pensacola 179A Bear Lake Lake 3F LVI 43LVI (n=2)
Big Mean (53)Mean 1 (60), Mean 2 (46)
Not Impaired
St. Lucie -Loxahatchee 3194G Lake Eden Lake 3F LVI 43
LVI (n=3)Big Mean (39)
Mean 1 (60), Mean 2 (54)Impaired
Kissimmee River 1860D Lake
Jackson Lake 3F LVI 43LVI (n=2)
Big Mean (39)Mean 1 (28), Mean 2 (50)
Study List
Lake Vegetation Index