Design of Sustainable Product Systems and Supply Chains ... · PDF filesustainable supply...
12
Design of Sustainable Product Systems and Supply Chains with Life Cycle Optimization Based on Functional Unit: General Modeling Framework, Mixed-Integer Nonlinear Programming Algorithms and Case Study on Hydrocarbon Biofuels Dajun Yue, Min Ah Kim, and Fengqi You* Department of Chemical and Biological Engineering, Northwestern University, Evanston, Illinois 60208, United States * S Supporting Information ABSTRACT: We propose a life cycle optimization framework for the design of sustainable product systems and supply chains considering the concept of “functional unit” under economic and environmental criteria. This general modeling framework integrates the life cycle analysis methodology with multiobjective optimization and measures both the economic and environmental performances based on a standard quantity of functional unit associated with final products. The Pareto-optimal frontier returned by the multiobjective optimization problem reveals the trade-off between the economic and environmental objectives. We also present tailored optimization algorithms for efficiently solving the mixed-integer linear fractional programming problems, which result from the life cycle optimization framework. We apply the proposed life cycle optimization framework to a case study on the hydrocarbon biofuels through a spatially explicit model for the county-level supply chain in Illinois. The Pareto-optimal results show that the environmental impact of hydrocarbon biofuels ranges from 10.66 to 23.83 kg CO 2 equiv per gasoline-equivalent gallon (GEG), corresponding to the unit cost ranging from $4.63 to $3.58/GEG. KEYWORDS: Sustainable supply chain, Life cycle optimization, MINLP, Biomass and biofuels ■ INTRODUCTION Concerns about climate change, waste pollution, energy security, and resource depletion are driving society to explore a more sustainable way for development and manufacturing. This leads to the question of how to evaluate and improve the sustainability of the product system, which is defined as the method, procedure, or arrangement that includes all functions required to accumulate the inputs, process the inputs, and deliver the marketable outputs. 1 The three core components of a product system are illustrated in Figure 1a. In general, a product system can be treated as a “conversion process” that uses common resources such as labor, capital (machinery and equipment, materials, etc.), and space (land, building, etc.) to convert resources into useful goods and services. From a value- add perspective, all the economic costs and environmental impacts will be accumulated and embedded into the last stage of the product systemfinal products. The supply chain, as a typical product system with the highest vertical hierarchy, 2 is a network of facilities and logistic options involving various activities such as procurement of feedstock, transportation and storage of feedstock, conversion of feedstock into finished products, distribution of products to demand zones, and product end use (Figure 1b). In the chemical process industry, there are various supply chains with multiple scales, echelons, and products. Extensive research both in academia and industry has been done to improve the overall economic performances for the design and operation of supply chains, among which the enterprisewide optimization is considered as a promising frontier in process systems engineering. 3-5 Though cost minimizing is critical to the economic viability and profitability of a chemical product system and supply chain, there has been an increasing awareness of the importance to achieve a sustainable design in the recent decade. 6,7 Srivastava 8 presented a comprehensive review on the scope of green supply chain management and remarked the importance of a more extensive use of mathematical programming tools that can contribute to a major advance in an environmentally conscious supply chain management. Considering the environmental impact as a design objective rather than merely a constraint on operations would lead to the discovery of novel alternatives with both better economic and environmental perform- ances. 9-11 However, life-cycle thinking is very critical when measuring the environmental metrics, and the consequences of ignoring impacts over the entire life cycle were illustrated by Received: March 15, 2013 Revised: May 16, 2013 Published: May 21, 2013 Research Article pubs.acs.org/journal/ascecg © 2013 American Chemical Society 1003 dx.doi.org/10.1021/sc400080x | ACS Sustainable Chem. Eng. 2013, 1, 1003-1014
Transcript of Design of Sustainable Product Systems and Supply Chains ... · PDF filesustainable supply...

Design of Sustainable Product Systems and Supply Chains with LifeCycle Optimization Based on Functional Unit: General ModelingFramework, Mixed-Integer Nonlinear Programming Algorithms andCase Study on Hydrocarbon BiofuelsDajun Yue, Min Ah Kim, and Fengqi You*
Department of Chemical and Biological Engineering, Northwestern University, Evanston, Illinois 60208, United States
*S Supporting Information
ABSTRACT: We propose a life cycle optimization frameworkfor the design of sustainable product systems and supply chainsconsidering the concept of “functional unit” under economic andenvironmental criteria. This general modeling frameworkintegrates the life cycle analysis methodology with multiobjectiveoptimization and measures both the economic and environmentalperformances based on a standard quantity of functional unitassociated with final products. The Pareto-optimal frontierreturned by the multiobjective optimization problem reveals thetrade-off between the economic and environmental objectives.We also present tailored optimization algorithms for efficientlysolving the mixed-integer linear fractional programming problems,which result from the life cycle optimization framework. We applythe proposed life cycle optimization framework to a case study on the hydrocarbon biofuels through a spatially explicit model forthe county-level supply chain in Illinois. The Pareto-optimal results show that the environmental impact of hydrocarbon biofuelsranges from 10.66 to 23.83 kg CO2 equiv per gasoline-equivalent gallon (GEG), corresponding to the unit cost ranging from$4.63 to $3.58/GEG.
KEYWORDS: Sustainable supply chain, Life cycle optimization, MINLP, Biomass and biofuels
■ INTRODUCTION
Concerns about climate change, waste pollution, energysecurity, and resource depletion are driving society to explorea more sustainable way for development and manufacturing.This leads to the question of how to evaluate and improve thesustainability of the product system, which is defined as themethod, procedure, or arrangement that includes all functionsrequired to accumulate the inputs, process the inputs, anddeliver the marketable outputs.1 The three core components ofa product system are illustrated in Figure 1a. In general, aproduct system can be treated as a “conversion process” thatuses common resources such as labor, capital (machinery andequipment, materials, etc.), and space (land, building, etc.) toconvert resources into useful goods and services. From a value-add perspective, all the economic costs and environmentalimpacts will be accumulated and embedded into the last stageof the product systemfinal products. The supply chain, as atypical product system with the highest vertical hierarchy,2 is anetwork of facilities and logistic options involving variousactivities such as procurement of feedstock, transportation andstorage of feedstock, conversion of feedstock into finishedproducts, distribution of products to demand zones, andproduct end use (Figure 1b). In the chemical process industry,there are various supply chains with multiple scales, echelons,
and products. Extensive research both in academia and industryhas been done to improve the overall economic performancesfor the design and operation of supply chains, among which theenterprisewide optimization is considered as a promisingfrontier in process systems engineering.3−5
Though cost minimizing is critical to the economic viabilityand profitability of a chemical product system and supply chain,there has been an increasing awareness of the importance toachieve a sustainable design in the recent decade.6,7 Srivastava8
presented a comprehensive review on the scope of green supplychain management and remarked the importance of a moreextensive use of mathematical programming tools that cancontribute to a major advance in an environmentally conscioussupply chain management. Considering the environmentalimpact as a design objective rather than merely a constraint onoperations would lead to the discovery of novel alternativeswith both better economic and environmental perform-ances.9−11 However, life-cycle thinking is very critical whenmeasuring the environmental metrics, and the consequences ofignoring impacts over the entire life cycle were illustrated by
Received: March 15, 2013Revised: May 16, 2013Published: May 21, 2013
Research Article
pubs.acs.org/journal/ascecg
© 2013 American Chemical Society 1003 dx.doi.org/10.1021/sc400080x | ACS Sustainable Chem. Eng. 2013, 1, 1003−1014

the works of Fava12 and Azapagic.13,14 Following the idea ofincorporating a life-cycle environmental objective into thedecision making process, a number of works based on themultiobjective optimization approach emerged to simultane-ously improve the economic and environmental performancesof the holistic product system and supply chain. Seuring andMuller15 proposed a conceptual framework for sustainablesupply chain management, in which specific features ofsustainable supply chains were discussed as well as limitationsand challenges in the research. Hugo and Pistikopoulos16
presented a mathematical programming-based methodologythat explicitly includes life cycle assessment criteria as part ofthe strategic investment decisions related to the design andplanning of supply chain networks. Liu et al.17 incorporated agreenhouse gas emissions indicator as one of the designobjectives when studying energy systems engineering problems.Elia et al.18 proposed an optimization framework for anationwide energy supply chain network considering CO2emissions reduction. Santibanez-Aguilar et al.19 presented amultiobjective optimization model for the optimal planning of abiorefinery considering both economic and environmentalaspects. You et al.20 and You and Wang21 proposed a life cycleoptimization framework and studied several applications on theoptimal design and scheduling on hydrocarbon biofuel supplychains. Giarola et al.22 and Akgul et al.23 proposed spatiallymultiobjective models for design and planning of hybrid first/second generation biorefineries and supply chain, whichoptimized the environmental and financial performancessimultaneously. Cucek et al.24 recommended a total foot-prints-based multicriteria optimization framework for thedesign of regional biomass energy supply chains. Recently,Santibanez-Aguilar et al.25 studied the synthesis of distributedbiorefining networks for sustainable elimination of waterhyacinth which would cause severe ecological problems in theinfested water bodies. Relevantly, the life cycle optimizationframework has also been applied to sustainable design ofbiorefineries under economic and environmental criteria.9,11,26
All the works reviewed above consider the absolute economicand environmental objectives. However, in a product system,the economic and environmental metrics associated with perfunctional unit of final products provide further space forimprovement regarding economic and environmental concerns,because all the costs and environmental impacts will beembedded and reflected in the functioning outputs of thesystem: functional unit. In light of this point, we propose twofractional objective functions. The economic objective isdefined as total cost divided by total quantity of the functionalunit. By using this economic objective, we can determine theoptimal sales amount between the demand upper and lower
bounds to guarantee the lowest unit cost per functional unit.This would make the final products more cost-competitive inthe marketplace. The environmental objective is defined as totalenvironmental impact divided by total quantity of thefunctional unit. By using this objective function, we canguarantee the lowest environmental impact per functional unit,which would lead to more environmentally friendly productpatterns.The bicriterion optimization problem is solved using the ε-
constraint method to obtain a set of Pareto optimal solutions.27
In this work, since both the economic and environmentalobjective functions are linear fractional functions, eachsubproblem in the ε-constraint method will be formulated asa mixed-integer linear fractional program (MILFP), which is aspecial class of nonconvex mixed-integer nonlinear programs(MINLPs) that can be computationally intractable for large-sizeproblems due to its combinatorial nature and the pseudocon-vexity of its objective function.28−30 Though general-purposeMINLP solvers and global optimizers can be utilized, it isdemonstrated that the tailored solution approaches for MILFPsare much more efficient and effective, namely the parametricalgorithm31 and reformulation-linearization method, becausethese two approaches can take advantage of the efficient mixed-integer linear programming (MILP) methods to globallyoptimize the MILFP problems with higher computationalefficiency and lower memory requirements.The major novelties of this work are summarized as follows.
• Novel functional-unit-based life cycle optimizationmodeling framework for the design of general productsystems and supply chains.
• Functional unit based economic and environmentalmodels as the optimization objectives and efficientsolution strategies.
• Application to sustainable hydrocarbon biofuel supplychain systems.
The rest of the article is organized as follows. We firstdescribe the proposed life cycle optimization modelingframework. Then, an illustrative example is analyzed todemonstrate the trade-offs between various criteria. Later, wepresent the general problem statement and model formulation,followed by the major solution approaches employed in thiswork. A county-level case study on the design of hydrocarbonbiofuel supply chains is presented to illustrate the application ofthe modeling framework and solution strategy. The article isconcluded in the last section.
Figure 1. Illustration of general product systems and supply chain networks: (a) general product systems; (b) general structure of supply chainsystems.
ACS Sustainable Chemistry & Engineering Research Article
dx.doi.org/10.1021/sc400080x | ACS Sustainable Chem. Eng. 2013, 1, 1003−10141004

■ LIFE CYCLE OPTIMIZATION FRAMEWORK
To overcome the drawbacks of classical life cycle assessment(LCA) methodology, we propose a novel life cycle optimizationframework which organically integrates the classical four-stepLCA methodology with multiobjective optimization meth-od.20,21 In the life cycle optimization framework, we will followthe first three phases of the classical LCA, which are goal andscope definition, inventory analysis, and impact assessment.Whereas, the remaining phase−LCA interpretationwill beperformed by coupling with multiobjective optimization. Theresults of life cycle optimization would be presented in the formof a Pareto frontier which reveals the trade-off between theeconomic and environmental objectives. The life cycleoptimization framework is illustrated in Figure 2.Goal and Scope Definition. This is the first and the most
critical phase which defines the main features of the LCAanalysis, including the goal of the study, system boundaries,allocation methods, and impact categories, etc. In the study ofproduct systems and supply chains, we restrict the domain ofstudy to all the life cycle stages from “cradle-to-gate”, whichinclude the following activities: feedstock acquisition, feedstocktransportation and storage, conversion from feedstock toproducts, storage and distribution of final products, andproduct end use. In certain situations, feedstock is notconverted directly to finished products but goes throughseveral intermediate processing steps. For example, thebiomass-derived gasoline can be converted directly from cropresidues at integrated biorefineries or it can be upgraded frombio-oil which is an intermediate product from preconversionfacilities using crop residues as feedstock.The “functional unit” is also defined in the first phase, which
is a key element of life cycle analysis. The functional unitprovides a reference to which the system’s inputs and outputscan be related, and a logical basis for comparing thesustainability performance for different products. In a productsystem, it is straightforward to define the functional unitassociated to the products. In single-product systems, thequantity of functional unit can simply be the number orweight/volume amount of the product. However, in multi-product systems, the quantity of functional unit is usuallycalculated based on some functioning properties of the variousproducts (e.g., density, heating value, market value). Forexample, gasoline-equivalent gallon (GEG) is defined as theamount of alternative fuel it takes to equal the energy contentof one liquid gallon of gasoline and, thus, can be considered asthe functional unit that characterize different fuel products (e.g.,gasoline, diesel, jet fuel). A general formula for the calculation
of standard quantity of total functional unit is given below. Anillustration regarding a product system involving 1 unit ofproduct A and 2 units of product B is given in Figure 3.
∑ λ= ·qt qtS
ii i
(1)
where qtS stands for the quantity of standard functional unit,qti is the quantity of product i and λi is the function weighting(characterization) factor defined as the amount of functionalunit associated with product i.
Inventory Analysis. In the second phase of LCA, the lifecycle inventory is analyzed related to each process/activity inthe life cycle stages confined within the system boundary. Massand energy balances are required to identify and quantify themost relevant inputs and outputs of materials and energy useassociated with the process/activity. Note that the life cycleinventory mentioned here is a different concept from thephysical inventory kept in stock keeping units, which is animportant part of the supply chain management.
Impact Assessment. In this phase, the inventory entriescan be translated into impacts using impact factors, and then,the impacts can be aggregated into a single metric. The mostwidely used LCA metrics include GWP (global warmingpotential), EI-99 (Eco-indicator 99), etc. GWP measures howmuch heat could be trapped by greenhouse gas (GHG)emissions relative to CO2. EI-99 evaluates the environmentalimpacts in more comprehensive categories (e.g., human health,ecosystem quality, and resources) and provides an environ-mental indicator point. The damage and environmental impactsis determined based on the life cycle inventory by multiplyingeach life cycle inventory entry with the corresponding impactfactor specified by the damage assessment model.
Interpretation. In the fourth phase, the LCA results areanalyzed to provide a set of conclusions and recommendations.In this regard, the goal of LCA is to provide criteria andquantitative measurements for comparing different supply chain
Figure 2. Life cycle optimization modeling framework.
Figure 3. Calculation of the standard quantity for a multiproductsystem (FU: functional unit).
ACS Sustainable Chemistry & Engineering Research Article
dx.doi.org/10.1021/sc400080x | ACS Sustainable Chem. Eng. 2013, 1, 1003−10141005

design and operation alternatives. However, one of the criticaldrawbacks of classical LCA framework is that it lacks asystematic approach for generating such alternatives andidentifying the best one in terms of environmental perform-ance. To circumvent these limitations, we couple optimizationtools with environmental impact assessment. This integratedframework would allow us to evaluate the environmentalimpacts of diverse process alternatives and identify the optimalsolution via multiobjective optimization. Note that variousimpact metrics can be employed as the environmentalobjective. A set of Pareto-optimal solutions can be obtainedby solving the multiobjective optimization problem. ThesePareto solutions form a Pareto curve which reveals the trade-offbetween the economic objective and environmental objective,thus allowing for a better decision-making for the design andoperation of sustainable product systems and supply chains.
■ ILLUSTRATIVE EXAMPLETo reveal the trade-offs between the economic and environ-mental objectives, we present an illustrative example for asimplified supply chain optimization problem in this section.The structure of the supply chain is given in Figure 4. As can be
seen, we consider a cradle-to-gate life cycle boundary in thisproblem. This product system includes three life cycle stages,which are raw material acquisition, conversion process, andproduct distribution, respectively. Specifically in this productsystem, raw material A is collected from the supplier; then rawmaterial A will be converted into product B or product C at agiven production ratio in the conversion process; and at the laststage product B and product C are distributed to the market tomeet the demand requirements. At every stage of the productsystem, costs and environmental impacts would occur, whichwould eventually be embedded and reflected in the finalproducts as economic and environmental footprints.On the basis of the structure given in Figure 4, we present
the economic and environmental data of this simplified supplychain model as follows. We first assume that the cost ismeasured by monetary units (e.g., USD) and the environmentalimpact is measured in terms of damage factors (e.g., Eco-
Indicator 9932 points). The costs and impact data are given inTable 1. The fixed costs and environmental impact account forthe setup and infrastructure. The production ratio of rawmaterial A to product B is 1:1. The production ratio of rawmaterial A to product C is also 1:1. The processing capacity ofthe conversion process is 3 ton of raw material A per day. Theminimum demand is 1 ton per day for both product B andproduct C, assuming there is no upper limit for the demands ofthe market. The amount of provision of functions (e.g.,electricity) is 1 functional unit (e.g., kW h) for per ton ofproduct B and 1.5 functional unit for per ton of product C.Here in this problem, we consider four metrics, namely the
absolute total cost, absolute total environmental impact, costper functional unit, and environmental impact per functionalunit. Let xB and xC stand for the produced quantity of productB and product C, respectively. The acquisition amount of rawmaterial A can be calculated according to its production ratioswith product B and product C, namely xA = xB + xC. For clarity,we show here how the total cost is calculated. The totalacquisition cost is 20xA = 20(xB + xC); the total production costequals to the variable part 70xB + 520xC plus the fixed part 250;The total distribution cost is 10xB + 60xC. By summing up allthe cost components, we can derive
= + +x xtotal cost 250 100 600B C (2)
Similarly, the other metrics can be derived and given asfollows.
= + +x xtotal environmental impact 300 400 200B C (3)
=+ +
+x x
x xunit cost
250 100 6001.5B C
B C (4)
=+ +
+x x
x xunit environmental impact
300 400 2001.5B C
B C (5)
The total production amount of product B and product Ccannot exceed the capacity of the conversion process, whichsuggests
+ ≤x x 3B C (6)
Also, minimum demands from the market have to be met,which leads to
≥ ≥ ∈ ∈ x x x x1, 1; ,B C B C (7)
We perform a scenario analysis for this illustrative example.Four scenarios producing different amounts of product B andproduct C are considered. By evaluating the objective functionsabove, we summarized the results in Table 2. Scenario 1produces minimum amount of product B and product C tosatisfy the minimum demand from the market. It is obvious thatthis scenario leads to the lowest total cost as well as the lowesttotal environmental impact. However, the unit cost and unitenvironmental impact are also important for a product system
Figure 4. Superstructure of the illustrative example.
Table 1. Inputs of the Illustrative Example
processes material variable cost ($/ton) variable environmental impact (points/ton) fixed cost ($) fixed environmental impact (points)
raw material acquisition A 20 40conversion process B 70 300 250 300
C 520 140product distribution B 10 60
C 60 20
ACS Sustainable Chemistry & Engineering Research Article
dx.doi.org/10.1021/sc400080x | ACS Sustainable Chem. Eng. 2013, 1, 1003−10141006

and supply chain in practice. We can see that the unit cost ofscenario 1 is much higher than that of scenario 3, while the unitenvironmental impact of scenario 1 is much higher than that ofscenario 4. In other words, scenario 3 appears to be the mostcost-effective design, while scenario 4 produces the products inthe most environmentally friendly way. Scenario 2 has mediateunit cost and unit environmental impact and, thus, can betreated as a balance solution between cost-reduction and greenmanufacturing. Besides, note that scenarios 2−4 fully utilize theproduction capacity while scenario 1 does not. Therefore, weconclude that employing the functional-unit-based economicand environmental objectives allows us to take full advantage ofthe process capacities of the product system and demandpotentials in the marketplace.
■ GENERAL PROBLEM STATEMENTIn the design of general product systems and supply chains, theparameters below are given.
• A set of locations, including feedstock harvesting sites,conversion facility candidates, storage sites, and demandzones.
• Technical and logistic options, including alternativeconversion technologies, types of storage, and trans-portation modes.
• Capacity limitations, including availability of feedstock atharvesting sites, demands of final products at demandzones, and production as well as inventory capacity atconversion facilities and storage sites.
• Timing parameters, including planning horizon, leadtimes of production and transportation.
• Costs data, including feedstock acquisition costs, trans-portation costs, capital investments, operation andmaintenance (O&M) costs, storage holding costs, finalproduct distribution costs, and government incentives.
• Environmental impact data, including impacts forfeedstock acquisition, transportation, material processing,storage, final product distribution, and environmentalcredits.
• Problem specific conditions, including material degrada-tion, seasonality, setup costs, backlogging and lost salepenalties, etc.
Major decision variables for the design of sustainable productsystems and supply chains are summarized as follows.
• Selection of feedstock suppliers, conversion facilities, andstorage sites.
• Selection of conversion technologies, storage types, andtransportation modes.
• Feedstock procurement amounts, product sales, produc-tion targets, inventory levels, and inter-region materialflow amounts.
There are two objectives as discussed in the section above:the economic objective is to minimize the unit cost per
functional unit and the environmental objective is to minimizethe environmental impact per functional unit.
■ GENERAL MODEL FORMULATIONAccording to the general problem statement mentioned in theprevious section, we present the general life cycle optimizationmodel for the design of sustainable product systems and supplychains in this section. The bicriterion optimization problem isgiven below and denoted as problem (P0).
∑ ∑ λ= ·ftc cost qt(P0) min /g
gi
i i(8)
∑ ∑ λ= ·fte env qtmin /g
gi
i i(9)
+ · + · =C C x C ys. t. 0 1 2 0 (10)
∈ ∈x yand {0, 1}n m(11)
where i is the set of products; qti is the quantity of products i; λiis the amount of functional unit associated with product i. For agiven system, once defined, a functional unit is used for all theobjectives and constraints, thus the weighting factors λi areconstants. g is the set of process stages (e.g., procurement,production, transportation, and storage), x is the vector of thecontinuous variables, y is the vector of binary 0−1 variables, andC0, C1, and C2 are parameters in matrix format. Note that, thevector x includes all the continuous variables, such as costg, envg,qti, etc. Distinguishing them from x is merely for betterunderstanding of the physical meaning of the model. Equation8 defines the economic objective, where f tc is the unit cost perfunctional unit, and costg is the total cost associated with stage g.Equation 9 defines the environmental objective, where f te is theenvironmental impact per functional unit, and envg is the totalenvironmental impact associated with stage g. All theconstraints (e.g., mass balance relationship, capacity constraints,and availability constraints) are written in a compact formatgiven as eq 10. Without loss of generality, all the inequalities areconverted into equations via the use of slack variables.As can be seen, we assume that all the constraints in eq 10
are linear, which is usually the case in supply chain designproblems.4,33,34 The economic objective 8 and environmentalobjective 9 are formulated as linear fractional functions, whereboth the numerator and denominator are linear functions.Continuous variables x model the purchase amounts, salesamounts, production amounts, transportation amounts, etc.Binary 0−1 variables y represent the discrete decisions for theselection of facility location, technology, capacity level, etc.
■ SOLUTION APPROACHESIn this section, we briefly introduce the major solutionapproaches that can be applied to the bicriterion optimizationproblem (P0) formulated in the previous section.
ε-Constraint Method. Due to its efficiency and simplicity,the ε-constraint method is widely used to obtain Pareto-optimalsolutions for multiobjective optimization problems. Consider-ing our two-dimensional case, the Pareto frontier will be aPareto curve. We convert the environmental objective inproblem (P0) into the ε-constraint while leaving the economicobjective in the resulting single-objective ε-constraint sub-problems (P1). Certainly, the other way around is also valid.Also, because the standard quantity of functional unit is always
Table 2. Results of Scenario Analysis
scenariosproductB (ton)
productC (ton)
totalcost($)
totalimpact(points)
unitcost
($/FU)
unit impact(points/FU)
1 1 1 950 900 380 3602 1.5 1.5 1300 1200 347 3203 2 1 1050 1300 300 3714 1 2 1550 1100 387 275
ACS Sustainable Chemistry & Engineering Research Article
dx.doi.org/10.1021/sc400080x | ACS Sustainable Chem. Eng. 2013, 1, 1003−10141007
positive, we can derive the following general model formulation(P1).
∑ ∑ λ= ·ftc cost qt(P1) min /g
gi
i i(12)
∑ ∑ε λ≤ · ·env qts. t.g
gi
i i(13)
+ · + · =C C x C y0 1 2 0 (14)
∈ ∈x yand {0, 1}n m(15)
As can be seen, in formulation (P1), all the constraints arelinear. The only nonlinearity is at the objective function, whichis a linear fractional term. This problem belongs to MILFP,which is a special class of nonconvex MINLP. In order toglobally optimize the MILFP problem (P1) efficiently, wepresent two tailored MILFP algorithms in the followingsections.Parametric Algorithm. We first introduce the parametric
algorithm which relies on the solution of a sequence of MILPsubproblems iteratively to obtain the global optimal solution ofthe original MILFP problem.31 The MILP subproblems of theparametric algorithm corresponding to (P1) are given asfollows and denoted as (P1-D).
∑ ∑ λ‐ = − · ·ftc Q qt(P1 D) min costg
gi
i i(16)
∑ ∑ε λ≤ · ·qts. t. envg
gi
i i(17)
+ · + · =C C x C y0 1 2 0 (18)
∈ ∈x yand {0, 1}n m(19)
where Q is the critical parameter that will be updated iterativelyand eventually approach the optimal value of the originalobjective function 12.34,35 The flowchart of the parametricalgorithm is given in Figure 5.The MILP subproblem (P1-D) has exactly the same
constraints as the original MILFP problem (P1), but it is alinear parametric objective function, instead of a nonlinear one.
A drawback of this approach is that the number of iterations isunpredictable and no absolute gap information is returned.
Reformulation-Linearization Method. Another alterna-tive, the reformulation-linearization method, transforms theoriginal MILFP problem into its exact equivalent MILPproblem, so that we can take advantage of the powerfulMILP optimization algorithms, such as the branch-and-cutmethods. The reformulation-linearization method integratesthe Charnes−Cooper transformation and Glover’s linearizationscheme, and the equivalent MILP formulation of (P1) is givenbelow and denoted as (P1-R).
∑‐ =Uftc Ucost(P1 R) ming
g(20)
∑ ε≤Uenvs. t.g
g(21)
· + · + · =C u C z C w0 1 2 0 (22)
∑ λ · =Uqt 1i
i i(23)
≤w u (24)
≤ · w M y (25)
≥ − − w u M y(1 ) (26)
∈ ∈ ∈ ∈ u z w y, , , and {0, 1}n n m
(27)
An important property of (P1-R) is that there exists a one-to-one correlation between the reformulated variables andvariables in the original formulation as shown in Figure 6.
Note that Uqti, Uftc, Ucostg, and Uenvg are continuous variablesincluded in z, similar as mentioned in the previous section. Thereformulated MILP problem (P1-R) would provide the sameoptimal objective value as the original MILFP problem (P1).Meanwhile, the optimal solution in the original feasible regioncan be calculated backward following the one-to-onecorrelation relationship.The concern regarding the reformulation-linearization
method is that the reformulated MILP problem can becomputationally more expensive to be optimized due to theintroduction of extra variables and constraints. However,problem (P1-R) only needs to be solved once, and thesolution process of which reflects the actual gap information inreal time.Figure 5. Flowchart of the parametric algorithm.
Figure 6. Illustration of the reformulation-linearization method.
ACS Sustainable Chemistry & Engineering Research Article
dx.doi.org/10.1021/sc400080x | ACS Sustainable Chem. Eng. 2013, 1, 1003−10141008
■ CASE STUDY
Over the past decades, our society is making continuous effortsto search for and improve renewable sources of liquidtransportation fuels. Among the various alternatives (e.g.,nuclear, wind, solar cells, etc.), the biofuels is considered as themost promising candidate because of its vast domestic supplyand environmental benefit.20 As the fourth-generation biofuel,cellulosic drop-in fuels can be converted from the residual,nonedible parts of food crops as well as other nonfood cropsthus avoiding the potential impacts on food supply.9,11,36
Furthermore, its “drop-in” feature enables the perfectcompatibility with the current vehicle engine technology andexisting fuel distribution infrastructure.21 Due to the RenewableFuel Standard, which is part of the Energy Independence andSecurity Act of 2007,37 the cellulosic biofuel industry isundergoing a rapid expansion. Hence, considering the relativematurity of biomass-to-liquid (BTL) technologies at the currentstage, the study of corresponding BTL supply chain networks issignificantly important and urgent.38
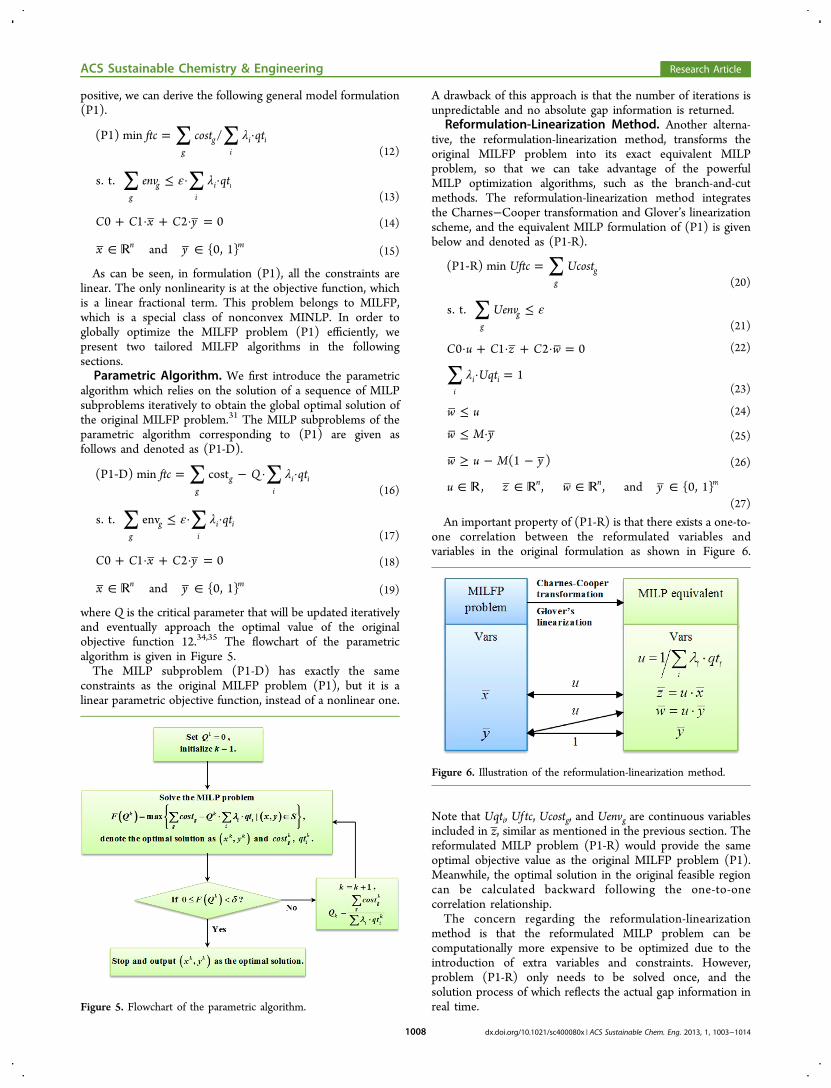
Specific Problem Statement. In this section, we study thesustainable design of a potential hydrocarbon biofuel supplychain network in the state of Illinois. We employ a spatiallyexplicit model, which is modified from the formulation
originally proposed by You and Wang.21 The underlyingsuperstructure is given in Figure 7. We need to determine theoptimal supply chain configuration (including the locations,technologies, and capacities for all the conversion facilities, aswell as the amount of material flows for all the transportationlinks), with respect to both the economic and environmentalcriteria. In this problem, we define the functional unit as pergasoline-equivalent gallon (GEG) liquid transportation fuelcharacterized in terms of energy content. Therefore, theeconomic objective is minimizing the cost per GEG (includingcapital and operation costs) and the environmental objective isminimizing the life cycle GHG emission (in terms of CO2
equivalent) associated with per GEG.Considering the computation complexity of the complete
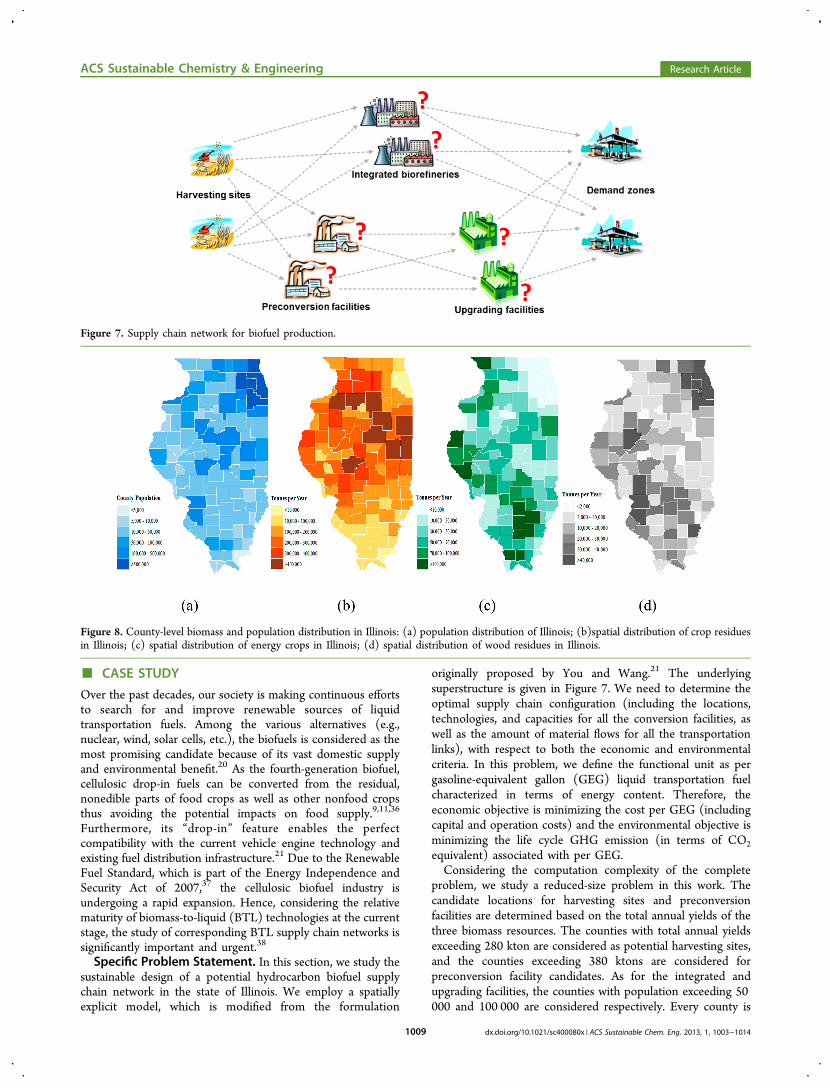
problem, we study a reduced-size problem in this work. Thecandidate locations for harvesting sites and preconversionfacilities are determined based on the total annual yields of thethree biomass resources. The counties with total annual yieldsexceeding 280 kton are considered as potential harvesting sites,and the counties exceeding 380 ktons are considered forpreconversion facility candidates. As for the integrated andupgrading facilities, the counties with population exceeding 50000 and 100 000 are considered respectively. Every county is
Figure 7. Supply chain network for biofuel production.
Figure 8. County-level biomass and population distribution in Illinois: (a) population distribution of Illinois; (b)spatial distribution of crop residuesin Illinois; (c) spatial distribution of energy crops in Illinois; (d) spatial distribution of wood residues in Illinois.
ACS Sustainable Chemistry & Engineering Research Article
dx.doi.org/10.1021/sc400080x | ACS Sustainable Chem. Eng. 2013, 1, 1003−10141009

considered as a demand zone. Hence, this BTL superstructurenetwork contains 30 harvesting sites, 20 potential integratedbiorefinery facilities, 20 possible locations of preconversionfacilities, 21 upgrading facilities, and 102 demand zones. Thepotential harvesting sites and the location of candidate plantsare illustrated in Figure 10a.Three types of biomass resources are explored in this study:
crop residues (including residues of corn, wheat, soybeans,etc.), energy crops (only including switchgrass), and woodresidues (including forest residues and primary mills, secondarymills, urban wood residues). On the basis of the statistical datafrom the U.S. Department of Agriculture,39 Figure 8b−dillustrates the spatial distribution of the annual yields of thethree major biomass resources in 102 counties. This BTLprocessing network produces two types of liquid biofuelproducts, namely gasoline and diesel, to the demand zones. Theannual demands of the entire state in 2013 are predicted basedon data from U.S. Energy Information Administration,40 whichare 4535.59 and 1891.25 MM gallons/year for gasoline anddiesel, respectively. We assume that the specific demand at eachdemand zone is proportional to the county population, which isbased on the Census 201241 data and illustrated in Figure 8a.We consider a near-term scenario to supply 5% of the fuelusage.We assumed the moisture content of all the biomass
feedstock to be 15%. The farm-to-gate acquisition costs ofthe feedstock are calculated from subtracting the cost oftransportation and storage from the 2008 baseline priceprovided in the study by America’s Energy Future Panel onAlternative Liquid Transportation Fuels.42 The acquisitioncosts (including pretreatment) for crop residues, energy crops,and wood residues are set to $84.5, $97.5, and $50/ton,respectively.Two types of conversion pathways are considered:
centralized and distributed, respectively. The integrated path-way consists of two conversion methods, which are gasificationwith Fischer−Tropsch (FT) synthesis and pyrolysis followedby hydroprocessing. On the other hand, the distributedpathway first converts the feedstock to intermediate products(e.g., bio-oil and bioslurry) at preconversion facilities and thenupgrades them into liquid fuel products at upgrading facilities.The two preconversion technologies considered are rotatingcone reactor pyrolysis and fluidized bed reactor pyrolysis. Thetwo upgrading technologies considered are hydroprocessingand gasification with Fisher−Tropsch (FT) synthesis. On thebasis of the annual production amount for integratedbiorefineries, two capacity levels are considered for both
conversion methods, which are 0−100 and 100−200 MMGEG/y. Two capacity levels for preconversion facilities withboth technologies are 0−1 and 1−2 MM dry tons/y, while thecapacity levels for upgrading facilities are 0−100 and 100−200MM GEG/y. The capital cost of the conversion facilities iscalculated based on literature data and a scale factor of 0.6,using the maximum and minimum of each capacitylevel.9,11,43−46 The total investment costs of the six conversionfacilities in each capacity level are modeled using piecewiselinear cost curve to include the economy of scale.21
The location of plants is set to the center of each county.Using the Google Distance Matrix API, the distance betweeneach pair of the counties is calculated.47 The data for trucktransportation are obtained from Searcy et al.48 and Mahmudiand Flynn.49 The emission data regarding transportation andbiomass production are based on the GREET model fromArgonne national laboratory50 and existing literature andreports.9,11,43−45
All the computational experiments are carried out on a PCwith Intel Core i5-2400 CPU at 3.10 GHz and 8.00 GB RAM.All models and solution procedures are coded in GAMS 23.9.51
MILP models are solved with CPLEX 12 with three processingcores under parallel mode. MINLP models are solved with SBB(simple branch-and-bound algorithm), DICOPT (outer-approximation algorithm), and the global optimizer BARON1252 utilizing one processing core. The stopping tolerance forthe parametric algorithm is set to 1%. The optimality tolerancesfor other methods are all set to 1%.
Model Formulation. The life cycle optimization modelemployed for this case study is a modification and simplificationof the one proposed in the work by You and Wang.21 For thecompactness of the article, detailed equations and notations arepresented in the Supporting Information. The model covers thebiomass feedstock supply system, integrated biorefineries,preconversion facilities, upgrading facilities, and the liquidfuel distribution system. The major properties of the BTLsupply chain are described by the constraints, including biomassfeedstock availability, material balance relationship, conversionfacility capacity, transportation link capacity, financial con-straints, etc.As given by eq 28, the economic objective is to minimize the
unit cost per GEG liquid fuel product, which is defined as thetotal annualized cost divided by the standard quantity offunctional unit. It covers the cost of capital investment forfacility establishment, biomass acquisition, production distribu-tion, material production, transportation, and governmentincentives.
φ=
+ + + + −∑ ∑ ·∈ ∈
ftcC C C C C C
soldmin
d D p P p d p
capital acquisition distribution production transportation incentive
, (28)
where φp is the quantity of the functional unit possessed by aunit of product p; soldd,p is the sales amount of product p atdemand zone d.As given by eq 29, the environmental objective is to minimize
the environmental impact per GEG liquid fuel product, which is
defined as the total emissions divided by the standard quantityof functional unit. It covers the environmental impact frombiomass acquisition, product distribution, material production,transportation, and sequestration credit.
φ=
+ + + −∑ ∑ ·∈ ∈
fteE E E E E
soldmin
d D p P p d p
acquisition distribution production transportation sequestration
, (29)
ACS Sustainable Chemistry & Engineering Research Article
dx.doi.org/10.1021/sc400080x | ACS Sustainable Chem. Eng. 2013, 1, 1003−10141010

Results and Discussion. The Pareto-optimal profiles forthe sustainable design of the potential hydrocarbon biofuelsupply chain are shown in this section. We derive theapproximated Pareto curve by investigating 10 instances ofthe aforementioned bicriterion optimization model using theproposed solution approach. The result is presented in Figure9. Point A corresponds to the most environmentally sustainable
solution, with the lowest GHG emission of 10.66 kg CO2equiv/GEG but the highest unit cost of $4.63/GEG. On theother hand, point C corresponds to the most economicalsolution, with the highest GHG emission of 23.82 kg CO2equiv/GEG but the lowest unit cost of $3.58/GEG.Considering the trade-offs between the economic and environ-mental criteria, we identify a “good choice” solution (point B)with the GHG emission of 12.12 kg CO2 equiv/GEG and theunit cost of $4.10/GEG, which significantly reduces the costwith a small sacrifice in the GHG emission. However, note thatall the solutions on the Pareto curve are considered Pareto-optimal, among which one can choose for the supply chaindesign according to the preference. Solutions on the leftemphasize more on reducing the environmental impact andgreen manufacturing, while the solutions on the right tend topursue a more cost-effective product system.The Pareto-optimal supply chain profile corresponding to the
most environmentally sustainable solution (point A) isillustrated in Figure 10b. Only the centralized pathway isobserved with 10 integrated biorefineries established mainly inthe northern Illinois. The installed production capacities ofthese integrated biorefineries range from 21.5 to 72.1 MMGEG per year. The technology of fast pyrolysis plushydroprocessing is selected by all the integrated biorefineries,which is consistent with our previous work.21 This suggests thatthe technology of fast pyrolysis followed by hydroprocessingyields biofuel products in a more environmentally friendly way,though can be more cost-intensive compared to the technologyof gasification plus FT synthesis. The results also indicate thatreduction of GHG emissions can be achieved by employing thecentralized pathway to avoid the additional emissions fromtransportation and distributed production.The Pareto-optimal supply chain profile corresponding to the
good choice solution (point B) is illustrated in Figure 10c. Weobserve 10 integrated biorefineries, 5 preconversion facilities,and 1 intermediate upgrading facility. The installed capacities ofthe integrated biorefineries range from 20.0 to 34.1 MM GEG/
y. The technology of pyrolysis plus hydroprocessing is selectedby all the integrated biorefineries. The installed capacities of thepreconversion facilities range from 200.0 to 465.0 kton/y. Thetechnology of the rotating cone process which produces bio-oilis selected by all the preconversion facilities. The installedcapacity of the upgrading facility is 106.4 MM GEG/y, and thetechnology of hydroprocessing is selected. Compared with themost environmentally sustainable solution, the total capacity ofthe integrated biorefineries has decreased. Instead, part of thedemand is supplied through the distributed pathway, whichhelps to achieve a lower cost per functional unit with a slightincrease in the product carbon footprint. The distributedpathway is first introduced in northeastern Illinois, becausethere is higher demand as well as higher biomass resourcesupply in that area. Also, we note that the upgrading facility inDupage County is located so that the transportation distancesfrom the five preconversion facilities and to the demand zonesin high population densities are optimized.The Pareto-optimal supply chain profile corresponding to the
most economical solution (point C) is illustrated in Figure 10d.As can be seen, 10 integrated biorefineries, 9 preconversionfacilities, and 2 upgrading facilities are established. The installedcapacities of the integrated biorefineries range from 20.0 to195.0 MM GEG/y. The technology of gasification plus FTsynthesis is selected by all the integrated biorefineries. Theinstalled capacities of the preconversion facilities range from200.0 to 725.5 kton/y. The rotating cone process is selected bypreconversion facilities with smaller (<400 kton/y) capacities,while the fluidized bed process is selected for relatively large-size preconversion facilities. The smaller upgrading facility inMadison County with installed capacity of 50 MM GEG/yselects the technology of hydroprocessing and receivesintermediate products from south Illinois. The larger upgradingfacility in Dupage County with installed capacity of 200 MMGEG/y selects the technology of gasification plus FT synthesisand mainly supplies northeastern Illinois. This solution profilereveals the trend that the more distributed the biofuel supplychain configuration, the more cost-effective the product system.Also, we note the optimal selection of conversion technologiesis influenced by the capacity levels of the facilities. In Figure 11,we present the cost breakdown for the most cost-effectivesolution. As can be observed, the acquisition cost for biomassfeedstock constitutes the most expensive part, which suggeststhat biomass price has a significant influence on the economicsustainability of the product system. Not as significant as inusual processes, the investment cost in this biofuel supply chainaccounts for 22% of the total cost. The ratio of fixed operationand maintenance (O&M) cost to the variable production costis largely dependent on the selected conversion technologies.Finally, the transportation cost contributes 14% to the totalcost.To illustrate the effectiveness of the proposed solution
strategy, we also present the computational results in thissection to compare the proposed tailored MILFP algorithmswith the general-purposed MINLP ones. The original MILFPmodel consists of 244 discrete variables, 131 351 continuousvariables, and 30 826 constraints. We have applied the tailoredMILFP methods (parametric algorithm and reformulation-linearization method) and general-purpose MINLP solvers(DICOPT, SBB, and BARON 1252) to optimize 10 instances ofthe ε-constraint method. The solution reports for the threeselected instances are summarized in Table 3. As can beobserved, the parametric algorithm is demonstrated to be the
Figure 9. Pareto curve showing trade-off between economic andenvironmental performances.
ACS Sustainable Chemistry & Engineering Research Article
dx.doi.org/10.1021/sc400080x | ACS Sustainable Chem. Eng. 2013, 1, 1003−10141011

most efficient among the five algorithms, of which the solutiontime for all 10 instances ranges from 1.5 to 373.5 CPUs. Thereformulation-linearization method tends to be slower for thisproblem, of which the solution time for all 10 instances rangesfrom 59.2 to 2853.7 CPUs. Though it is a local optimizer,DICOPT appears to be a good solver for this problem, whichalso converges fast for this problem. SBB and BARON 12exceed the preset computation time limit (2 h) in mostinstances, and the current best solutions are recorded. Overall,the parametric algorithm exhibits the best computationperformance among all the investigated solution methodsand, thus, is recommended for the global optimization ofMILFP models encountered in the life cycle optimization forsustainable design of product system.
Figure 10. Optimal design for minimized cost per GEG with population density background. (a) Candidate plants with potential harvesting sites asbackground. (b) Most environmentally sustainable biofuel supply chain profile with population distribution as background. (c) Good choice solutionwith biomass resouces distribution as background. (d) Most economical biofuel supply chain profile with population distribution as background.
Figure 11. Cost breakdown for most economical solution.
ACS Sustainable Chemistry & Engineering Research Article
dx.doi.org/10.1021/sc400080x | ACS Sustainable Chem. Eng. 2013, 1, 1003−10141012

■ CONCLUSIONSIn this paper, we proposed a life cycle optimization frameworkfor sustainable design of product system and supply chainnetwork under economic and environmental concerns. Thisgeneral modeling framework coupled the classic LCA method-ology with multiobjective optimization, which could provideenvironmental impact evaluation from a life cycle perspectivewhile generate and optimize solution alternatives automatically.Because the economic and environmental performances of aproduct system would be measured eventually through theprovision of function from the finished products, we proposedusing two functional-unit-based economic and environmentalobjectives, respectively, to achieve a more sustainable systemdesign. We also proposed effective solution strategies for theresulting bicriterion optimization problems. For illustration, weapplied the proposed life cycle optimization framework to thesustainable design of a hydrocarbon biofuel supply chain inIllinois. A Pareto curve was obtained which clearly revealed thetrade-off between economic and environmental concerns indecision making. The results indicated that the most environ-mentally sustainable design can be achieved with a unit cost of$4.63/GEG and GHG emission of 10.66 CO2 equiv/GEG forthe biomass-derived gasoline and diesel, while the mosteconomical design leads to a unit cost of $4.10/GEG andGHG emission of 12.12 CO2 equiv/GEG.
■ ASSOCIATED CONTENT*S Supporting InformationDetailed mathematical model formulation and notations for thecase study. This material is available free of charge via theInternet at http://pubs.acs.org.
■ AUTHOR INFORMATIONCorresponding Author*E-mail: [email protected] authors declare no competing financial interest.
■ ACKNOWLEDGMENTSWe gratefully acknowledge the financial support from theInitiative for Sustainability and Energy at NorthwesternUniversity (ISEN).
■ REFERENCES(1) Mejia, G, Velasco, N. Production Systems and Supply ChainManagement in Emerging Countries: Best Practices; Springer: Heidel-berg, 2012.(2) Grossmann, I. E.; Guillen-Gosalbez, G. Scope for the applicationof mathematical programming techniques in the synthesis andplanning of sustainable processes. Comput. Chem. Eng. 2010, 34 (9),1365−1376.(3) Shah, N. Process industry supply chains: Advances andchallenges. Comput. Chem. Eng. 2005, 29 (6), 1225−1235.(4) Grossmann, I. E. Enterprise-wide optimization: A new frontier inprocess systems engineering. AIChE J. 2005, 51 (7), 1846−1857.(5) Varma, V. A.; Reklaitis, G. V.; Blau, G. E.; Pekny, J. F. Enterprise-wide modeling & optimization - An overview of emerging researchchallenges and opportunities. Comput. Chem. Eng. 2007, 31 (5−6),692−711.(6) Othman, M. R.; Repke, J. U.; Wozny, G.; Huang, YL. A ModularApproach to Sustainability Assessment and Decision Support inChemical Process Design. Ind. Eng. Chem. Res. 2010, 49 (17), 7870−7881.(7) Nikolopoulou, A.; Ierapetritou, M. G. Optimal design ofsustainable chemical processes and supply chains: A review. Comput.Chem. Eng. 2012, 44, 94−103.(8) Srivastava, S. K. Green supply-chain management: A state-of-the-art literature review. Int. J. Manage. Rev. 2007, 9 (1), 53−80.(9) Wang, B.; Gebreslassie, B. H.; You, F. Sustainable design andsynthesis of hydrocarbon biorefinery via gasification pathway:Integrated life cycle assessment and technoeconomic analysis withmultiobjective superstructure optimization. Comput. Chem. Eng. 2013,52 (0), 55−76.(10) Cano-Ruiz, J. A.; McRae, G. J. Environmentally consciouschemical process design. Annu. Rev. Energy Environ. 1998, 23, 499−536.(11) Gebreslassie, B. H.; Slivinsky, M.; Wang, B.; You, F. Life cycleoptimization for sustainable design and operations of hydrocarbonbiorefinery via fast pyrolysis, hydrotreating and hydrocracking.Comput. Chem. Eng. 2013, 50 (0), 71−91.(12) Fava, J. A. A Techical Framework for Life-Cycle Assessment;SETAC Foudation: Pensacola, 1994.(13) Azapagic, A. Life cycle assessment and its application to processselection, design and optimization. Chem. Eng. J. 1999, 73 (1), 1−21.(14) Azapagic, A.; Clift, R. The application of life cycle assessment toprocess optimization. Comput. Chem. Eng. 1999, 23 (10), 1509−1526.(15) Seuring, S.; Muller, M. From a literature review to a conceptualframework for sustainable supply chain management. J. Cleaner Prod.2008, 16 (15), 1699−1710.
Table 3. Solution Reports for the Case Study
instances ε unit cost ($/GEG) unit impact (kg CO2 equiv/GEG) time (CPUs) gap solver
A 10.66
4.63 10.66 1.5 1% parametric algorithm
4.63 10.66 80.8 1% reformulation-linearization
4.63 10.66 3.7 1% DICOPT
7200 SBB
4.63 10.66 5276.3 1% BARON 12
B 12.12
4.10 12.12 20.0 1% parametric algorithm
4.10 12.12 125.1 1% reformulation-linearization
4.10 12.12 31.8 1% DICOPT
4.12 12.12 7200 4.7% SBB
4.15 12.12 7200 4.5% BARON 12
C 23.83
3.58 23.83 244.3 1% parametric algorithm
3.58 23.83 215.4 1% reformulation-linearization
3.58 23.83 406.3 1% DICOPT
3.62 22.44 7200 8.3% SBB
4.15 23.83 7200 20.7% BARON 12
ACS Sustainable Chemistry & Engineering Research Article
dx.doi.org/10.1021/sc400080x | ACS Sustainable Chem. Eng. 2013, 1, 1003−10141013

(16) Hugo, A.; Pistikopoulos, E. N. Environmentally conscious long-range planning and design of supply chain networks. J. Cleaner Prod.2005, 13 (15), 1471−1491.(17) Liu, P.; Georgiadis, M. C.; Pistikopoulos, E. N. Advances inEnergy Systems Engineering. Ind. Eng. Chem. Res. 2010, 50 (9), 4915−4926.(18) Elia, J. A.; Baliban, R. C.; Xiao, X.; Floudas, C. A. Optimalenergy supply network determination and life cycle analysis for hybridcoal, biomass, and natural gas to liquid (CBGTL) plants using carbon-based hydrogen production. Comput. Chem. Eng. 2011, 35 (8), 1399−1430.(19) Santibanez-Aguilar, J. E.; Gonzalez-Campos, J. B.; Ponce-Ortega,J. M.; Serna-Gonzalez, M.; El-Halwagi, M. M. Optimal Planning of aBiomass Conversion System Considering Economic and Environ-mental Aspects. Ind. Eng. Chem. Res. 2011, 50 (14), 8558−8570.(20) You, F. Q.; Tao, L.; Graziano, D. J.; Snyder, S. W. Optimaldesign of sustainable cellulosic biofuel supply chains: Multiobjectiveoptimization coupled with life cycle assessment and input-outputanalysis. AIChE J. 2012, 58 (4), 1157−1180.(21) You, F. Q.; Wang, B. Life Cycle Optimization of Biomass-to-Liquid Supply Chains with Distributed-Centralized Processing Net-works. Ind. Eng. Chem. Res. 2011, 50 (17), 10102−10127.(22) Giarola, S.; Zamboni, A.; Bezzo, F. Spatially explicit multi-objective optimization for design and planning of hybrid first andsecond generation biorefineries. Comput. Chem. Eng. 2011, 35 (9),1782−1797.(23) Akgul, O.; Shah, N.; Papageorgiou, L. G. An optimizationframework for a hybrid first/second generation bioethanol supplychain. Comput. Chem. Eng. 2012, 42, 101−114.(24) Cucek, L.; Varbanov, P. S.; Klemes, J. J.; Kravanja, Z. Totalfootprints-based multi-criteria optimization of regional biomass energysupply chains. Energy. 2012, 44 (1), 135−145.(25) Santibanez-Aguilar, J. E.; Ponce-Ortega, J. M.; Gonzalez-Campos, J. B.; Serna-Gonzalez, M.; El-Halwagi, M. M. Synthesis ofDistributed Biorefining Networks for the Value-Added Processing ofWater Hyacinth. ACS Sustain. Chem. Eng. 2013, 1 (2), 284−305.(26) Gebreslassie, B. H.; Waymire, R.; You, F. Sustainable design andsynthesis of algae-based biorefinery for simultaneous hydrocarbonbiofuel production and carbon sequestration. AIChE J. 2013, 59 (5),1599−1621.(27) Hwang, G. L., Masud, A. S. M. Multiple objective decision making- Methods and Applications; Springer: Berlin, 1979.(28) Bajalinov, E. B. Linear-fractional programming: theory, method,applications and software; Kluwer Academic Publishers: Boston, 2003.(29) Bazaraa, M. S.; Sherali, H. D.; Shetty, C. M. Nonlinearprogramming: theory and algorithms; Wiley: New York, 2004.(30) Floudas, C. A. Deterministic global optimization: theory, methodsand applications; Kluwer Academic Publishers: Boston, 1999.(31) You, F. Q.; Castro, P. M.; Grossmann, I. E. Dinkelbach’sAlgorithm as An Efficient Method to Solve A Class of MINLP Modelsfor Large-Scale Cyclic Scheduling Problems. Comput. Chem. Eng. 2009,33 (11), 1879−1889.(32) Goedkoop, M.; Spriensma, R. Eco-indicator 99: A DamageOriented Method for Life Cycle Impact Assessment ; Methodology Report;PRe, Product Ecology consultants: Washington, D.C., 2001.(33) You, F.; Pinto, J. M.; Grossmann, I. E.; Megan, L. OptimalDistribution-Inventory Planning of Industrial Gases. II. MINLPModels and Algorithms for Stochastic Cases. Ind. Eng. Chem. Res.2011, 50 (5), 2928−2945.(34) You, F.; Wassick, J. M.; Grossmann, I. E. Risk management for aglobal supply chain planning under uncertainty: Models andalgorithms. AIChE J. 2009, 55 (4), 931−946.(35) Chu, Y. F.; You, F. Q. Integration of scheduling and control withonline closed-loop implementation: Fast computational strategy andlarge-scale global optimization algorithm. Comput. Chem. Eng. 2012,47, 248−268.(36) An, H.; Wilhelm, W. E.; Searcy, S. W. Biofuel and petroleum-based fuel supply chain research: A literature review. Biomass Bioenergy2011, 35 (9), 3763−3774.
(37) Energy Independence and Security Act of 2007. Public Law 110-140; United States Government: Washtington, D.C., 2007; Vol In:RL34294.(38) Gebreslassie, B. H.; Yao, Y.; You, F. Design under uncertainty ofhydrocarbon biorefinery supply chains: Multiobjective stochasticprogramming models, decomposition algorithm, and a Comparisonbetween CVaR and downside risk. AIChE J. 2012, 58 (7), 2155−2179.(39) NASS. National Agricultural Statistics Service. 2012.(40) U.S. Energy Information Adminstration. www.eia.doe/gov(accessed Oct 2012).(41) U.S. Census Bureau. http://www.census.gov (accessed Oct2012).(42) Liquid Transportation Fuels from Coal and Biomass:Technological Status, Costs, and Environmental Impacts; The NationalAcademies Press: Washington, D.C., 2009.(43) Swanson, R. M.; Platon, A.; Satrio, J. A.; Brown, R. C. Techno-economic analysis of biomass-to-liquids production based on gas-ification. Fuel 2010, 89, S2−S10.(44) Wright, M. M.; Daugaard, D. E.; Satrio, J. A.; Brown, R. C.Techno-economic analysis of biomass fast pyrolysis to transportationfuels. Fuel 2010, 89, S11−S19.(45) Anex, R. P.; Aden, A.; Kazi, F. K.; et al. Techno-economiccomparison of biomass-to-transportation fuels via pyrolysis, gas-ification, and biochemical pathways. Fuel 2010, 89, S29−S35.(46) Wright, M. M.; Brown, R. C.; Boateng, A. A. Distributedprocessing of biomass to bio-oil for subsequent production ofFischer−Tropsch liquids. Biofuels, Bioprod. Biorefin. 2008, 2 (3),229−238.(47) Google Distances Matrix API. https://developers.google.com/maps/documentation/distancematrix/ (accessed Nov 2012).(48) Searcy, E.; Flynn, P.; Ghafoori, E.; Kumar, A. The relative costof biomass energy transport. Appl. Biochem. Biotechnol. 2007, 137,639−652.(49) Mahmudi, H.; Flynn, P. C. Rail vs truck transport of biomass.Appl. Biochem. Biotechnol. 2006, 129 (1−3), 88−103.(50) Argonne GREET Model. http://greet.es.anl.gov/ (accessed Oct2010).(51) Rosenthal, R. E. GAMS - A User’s Guide.: GAMS DevelopmentCorp.: Washington, D.C., 2011.(52) Tawarmalani, M.; Sahinidis, N. V. A polyhedral branch-and-cutapproach to global optimization. Math. Program. 2005, 103 (2), 225−249.
ACS Sustainable Chemistry & Engineering Research Article
dx.doi.org/10.1021/sc400080x | ACS Sustainable Chem. Eng. 2013, 1, 1003−10141014