Management Accounting in Supply Chains and Alliances€¦ · Management Accounting in Supply Chains...
47
Copyright S. Anderson 2009 Management Accounting in Supply Chains and Alliances Shannon Anderson Rice University and University of Melbourne
Transcript of Management Accounting in Supply Chains and Alliances€¦ · Management Accounting in Supply Chains...

Copyright S. Anderson 2009
Management Accounting in Supply Chains and Alliances Shannon Anderson
Rice University and University of Melbourne
Copyright S. Anderson 2009
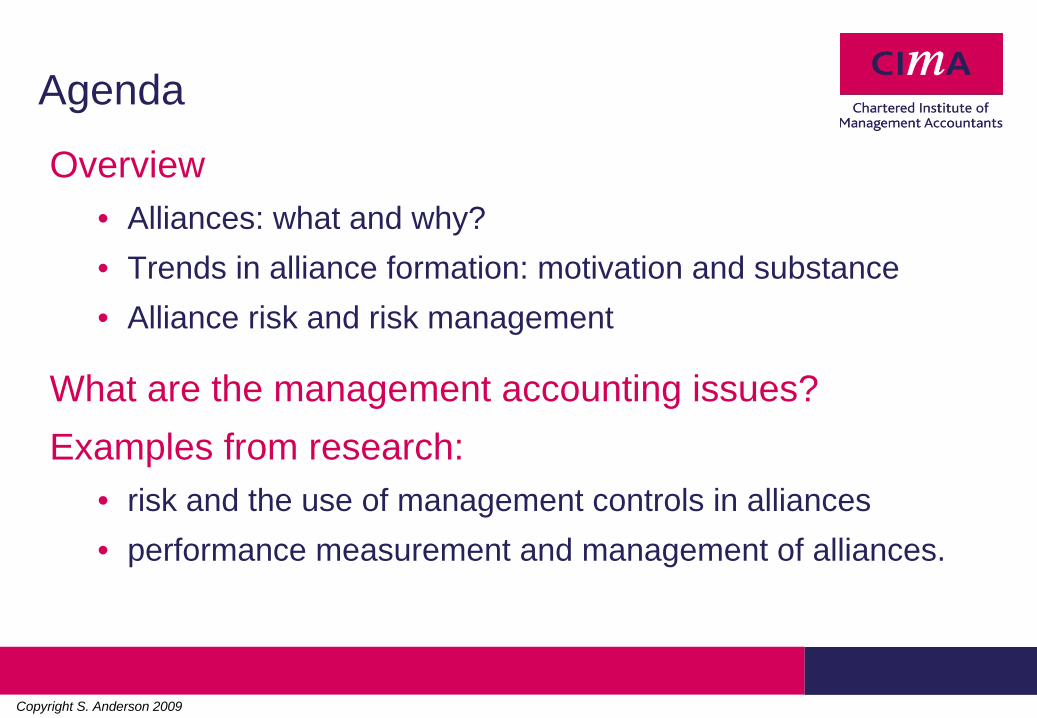
Agenda
Overview• Alliances: what and why?• Trends in alliance formation: motivation and substance• Alliance risk and risk management
What are the management accounting issues?Examples from research:
• risk and the use of management controls in alliances• performance measurement and management of alliances.
Copyright S. Anderson 2009
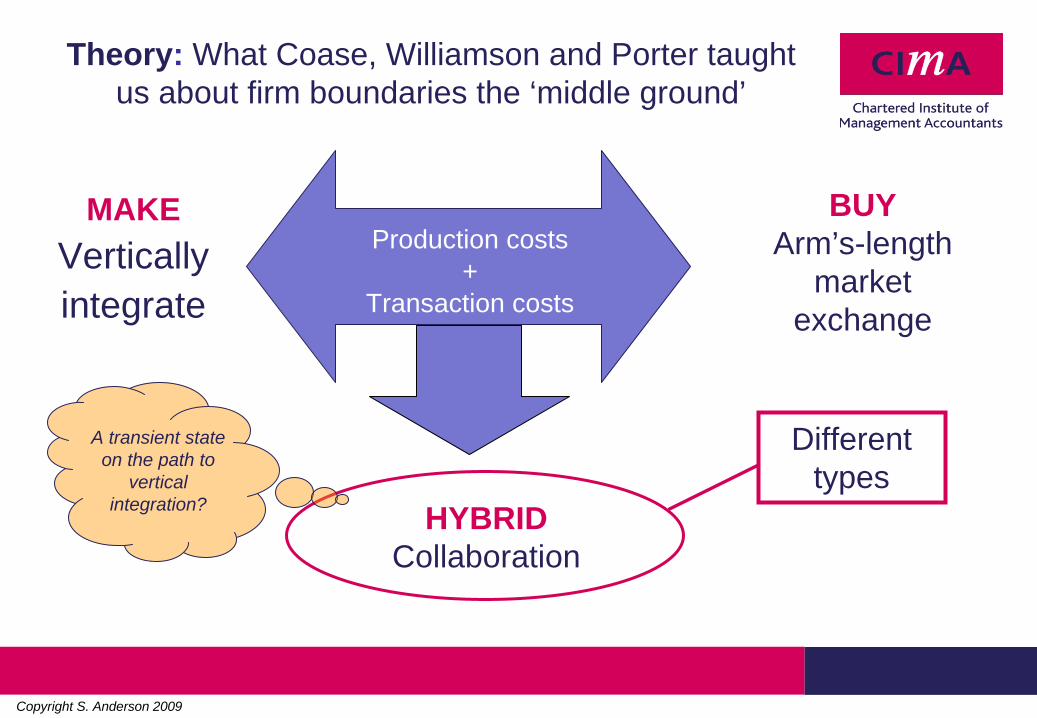
Theory: What Coase, Williamson and Porter taught us about firm boundaries the ‘middle ground’
MAKEVerticallyintegrate
BUYArm’s-length
marketexchange
xProduction costs
+ Transaction costs
HYBRIDCollaboration
A transient state on the path to
vertical integration?
Differenttypes

Copyright S. Anderson 2009
Types of inter-firm relationshipsFormal collaborative arrangements align the interests of partners through a shared profit opportunity and formal profit sharing rules.
Examples: • franchises • licensing arrangements • joint ventures• minority equity shares
Informal arrangements use fewer mechanisms from contract law to structure interactions or allocate gains from trade.
Examples: • strategic alliances• consortia• networks• supply chains

Copyright S. Anderson 2009
Inter-firm relationship formation
0
2,000
4,000
6,000
8,000
10,000
12,000
1985 1986 1987 1988 1989 1990 1991 1992 1993 1994 1995 1996 1997 1998 1999 2000
Year
Num
ber o
f Col
labo
ratio
ns
strategic alliancesjoint ventures
From 1997-2000, the typical large U.S. firm formed 177 alliances that accounted for
25%+ of firm revenues
Source: Anderson & Sedatole
(2003)

Copyright S. Anderson 2009
Why form an alliance?Alliances are formed to exploit unique resources, the ‘resource based view’ of alliance formation (Das and Teng 1998)
• Technological• Physical• Managerial• Financial
Alliances are used to achieve specific outcomes (Glaister and Brickley 1996)• Technology development• Risk reduction and speed of execution of large projects• Market development• Market power consolidation• Resource specialisation

Copyright S. Anderson 2009
The motivation has changed
Activities Crossing National Borders
0%
10%
20%
30%
40%
50%
60%
70%
80%
90%
100%
1985 1986 1987 1988 1989 1990 1991 1992 1993 1994 1995 1996 1997 1998 1999 2000
Data: Thomson Financial Services
Partners of Same Nationality
0%
10%
20%
30%
40%
50%
60%
70%
80%
90%
100%
1985 1986 1987 1988 1989 1990 1991 1992 1993 1994 1995 1996 1997 1998 1999 2000
Source: Anderson & Sedatole
(2003)
Copyright S. Anderson 2009
The substance of alliance activity changed• Less technology licensing… more meaningful collaboration
• Joint R&D• Joint marketing• Joint manufacturing
• More than 55% of alliances are between competitors
• A shift from dyad relationships to networks of collaborators
Copyright S. Anderson 2009
Less vertical integration means more ‘inter-firm’ transactions• Over the past 50 years the value of purchased materials and services has
grown from 20% to 56% of the selling price of finished goods• The global market for supply chain management software topped $6B in
2006 and is growing at a annual rate of 8.6% per year• The typical U.S. manufacturer manages over 30 contract relationships.
Complex supply chains typically include a mix of:• global material and service suppliers, • contract manufacturers, • company-owned plants and shared service centers, and• third party logistics and transportation providers
[AMR Research 2007]

Copyright S. Anderson 2009
The participants have changed
Alliances by Industry Category
0
2000
4000
6000
8000
10000
12000
1985
1986
1987
1988
1989
1990
1991
1992
1993
1994
1995
1996
1997
1998
1999
2000
OtherServiceWholesale/RetailManufacturing
Source: Anderson & Sedatole (2003)Data: Thomson Financial Services

Copyright S. Anderson 2009
Changes in technology and global trade policy enable firms to revisit vertical integration of non-manufacturing activities (i.e., back office operations, customer service functions).
Offshore vendors are shifting from a low cost strategy to a strategy of expanding their service offerings and building operational and strategic relationships with clients.
The participants have changed
Copyright S. Anderson 2009
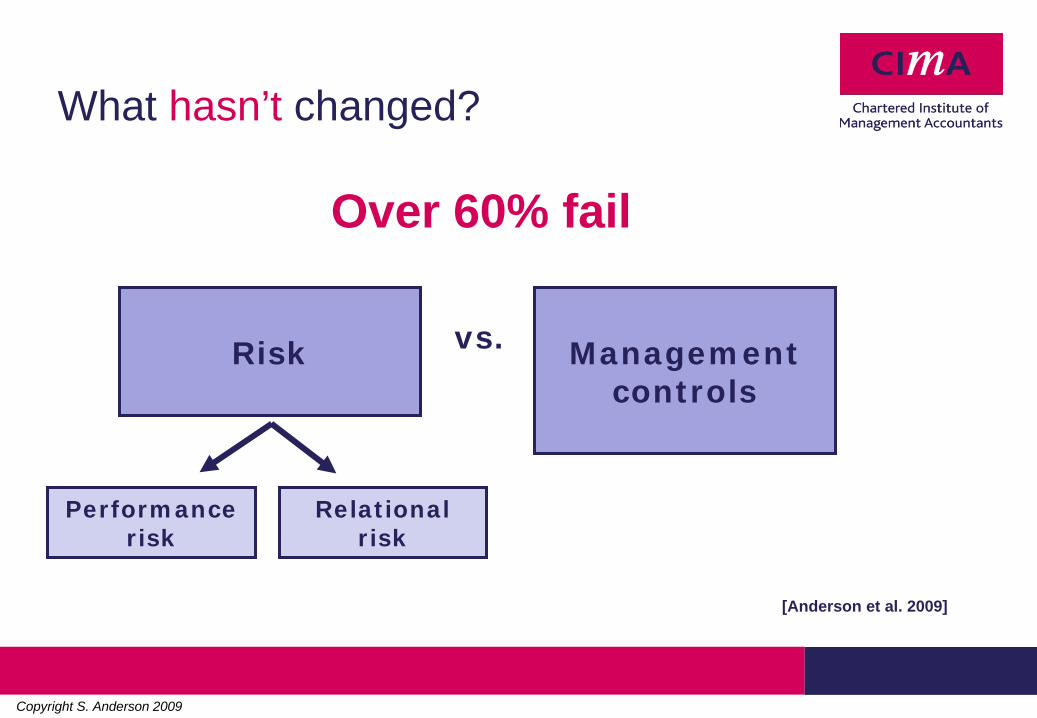
What hasn’t changed?
Over 60% fail
Performance risk
Relational risk
Risk vs. Management controls
[Anderson et al. 2009]

Copyright S. Anderson 2009
Risk in strategic alliancesDas and Teng 1996; Ring and Van de Ven 1992
•
Performance risk•
Relationship risk
COSO 2004: Enterprise risk management framework•
Strategic risk
•
Operational risk•
Reporting risk
•
Compliance risk
Anderson et al. (2009) 19 distinct alliance-specific risks identified in the research literature

Copyright S. Anderson 2009
Risk in strategic alliances
1. Quality performance risk2. Price renegotiation risk3. Innovation risk4. Co-ordination risk5. Intellectual property risk6. Product/service failure risk7. Misalignment of incentives8. Input supply risk9. Surge capacity risk10. Verification and evaluation risk
11. Compliance and regulatory risk12. Partnering lock-in risk13. Financial viability risk14. Contribution valuation risk15. Financial commitment risk16. Outside scope risk17. Output demand risk18. Surge demand risk19. Channel effectiveness risk
Copyright S. Anderson 2009
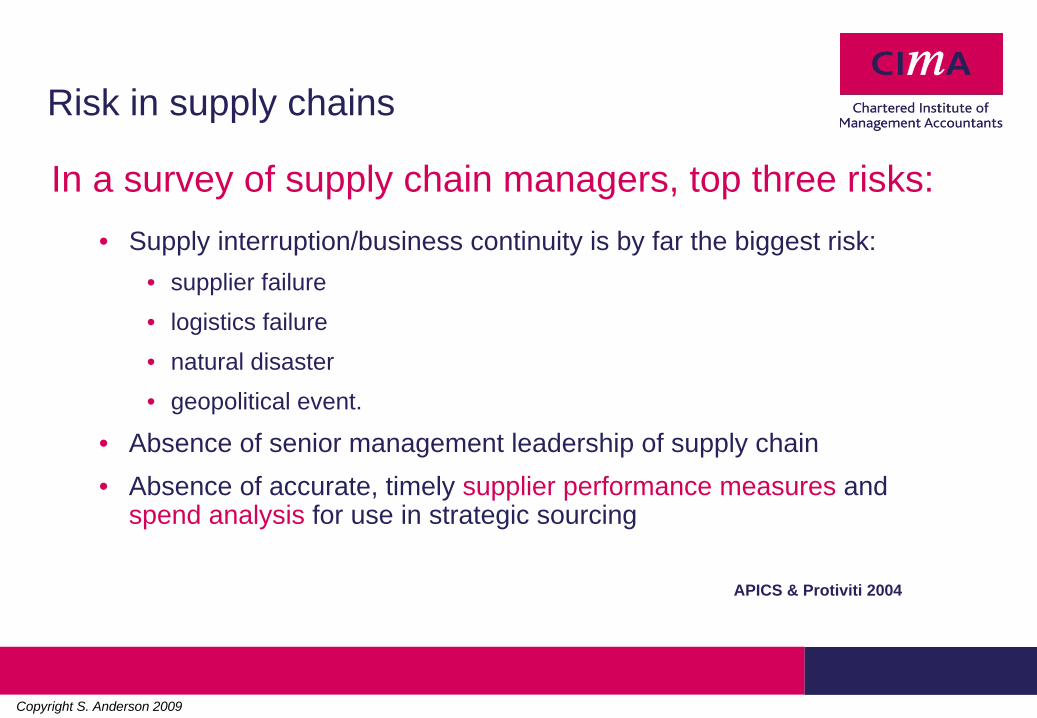
Risk in supply chains
In a survey of supply chain managers, top three risks:• Supply interruption/business continuity is by far the biggest risk:
• supplier failure• logistics failure• natural disaster• geopolitical event.
• Absence of senior management leadership of supply chain• Absence of accurate, timely supplier performance measures and
spend analysis for use in strategic sourcing
APICS & Protiviti 2004
Copyright S. Anderson 2009
‘With the shift to global sourcing and the pressure for low inventory levels and faster order fulfilment cycles, supply chains are more fragile, more extended and more time-sensitive than ever before… Supplier failures ripple through the supply chain.’
‘With the shift to global sourcing and the pressure for low inventory levels and faster order fulfilment cycles, supply chains are more fragile, more extended and more time-sensitive than ever before… Supplier failures ripple through the supply chain.’
Supply chain leaders reduce this liability by changing the way they measure and control their suppliers, and by rethinking the way they identify and resolve supply disruptions.
[AberdeenGroup, Sept 2004]
RISK

Copyright S. Anderson 2009
Risk management in supply chains [APICS & Protiviti 2004]
Top risk management solutions
Organisational design: Integrate procurement and supply chain management
Management processes:Supply chain risk assessmentSupplier selection processesSupplier evaluation processes
Opportunities to employ management accounting expertise
Opportunities to employ management accounting expertise

Copyright S. Anderson 2009
What are the management accounting issues?

Copyright S. Anderson 2009
Management accounting topics: Intra- vs. Inter-firm
Topic Intra-firm Inter-firm
Costing practices product/service cost, cost of qualitylifecycle cost
total cost of ownershipreverse supply chain costs
Cost management C-V-P analysisactivity-based management (ABM)process re-engineering
make-buy analysisspend analysisopen book accounting and value chain re- engineering
Planning and co-ordination
cost estimationbudgeting
joint target costingEDI /VMI/collaborative forecasting
Control practices decision delegationreward systemstransfer pricing policy
allocation of businessprofit sharing arrangementsinventory ownership rulesrisk management
Performance assessment
variance analysisscorecard analysis
supplier/buyer scorecardssupplier management system
Copyright S. Anderson 2009
Research examples1. Control practices: mitigating alliance risk with
management controls• Formal controls: contract design (Anderson and Dekker 2005)
• A portfolio of formal and informal controls (Anderson, Christ, Dekker and Sedatole 2009)
2. Performance measurement in alliances3. Cost management in alliances
Copyright S. Anderson 2009
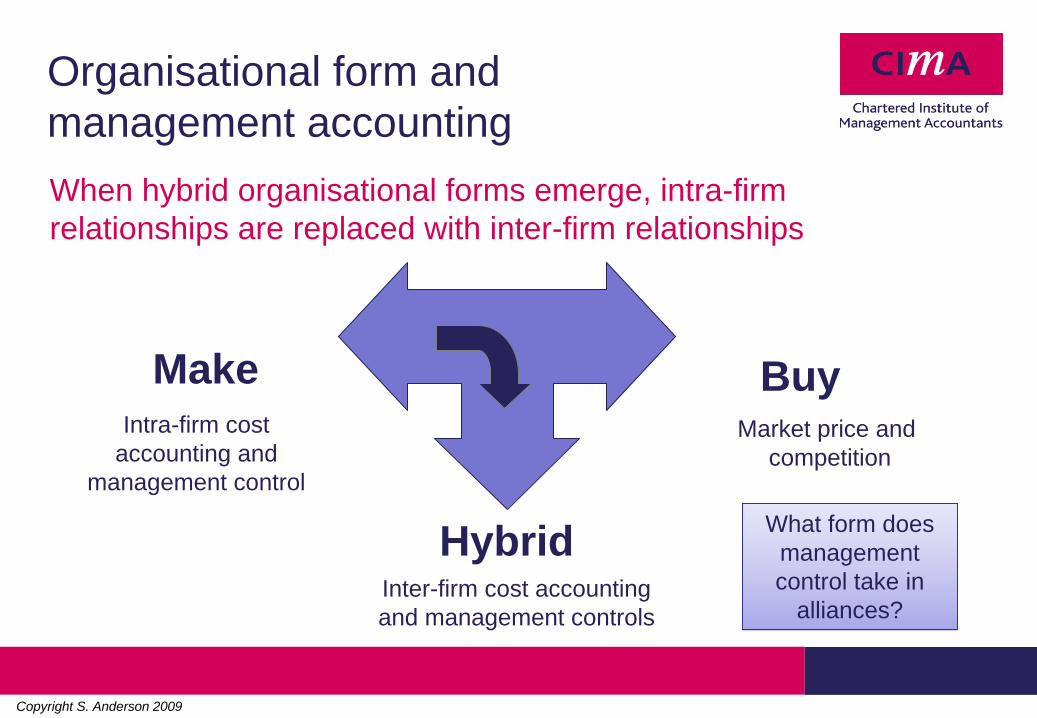
Organisational form and management accountingWhen hybrid organisational forms emerge, intra-firm relationships are replaced with inter-firm relationships
MakeIntra-firm cost
accounting and management control
BuyMarket price and
competition
HybridInter-firm cost accounting and management controls
What form does management control take in
alliances?
What form does management control take in
alliances?

Copyright S. Anderson 2009
Map of research questionsTransaction
characteristics:• Uncertainty (+)
• Size (+)
• Asset specificity (+)
• Task complexity (+)
Transaction partner characteristics
• Competition (-)
• Power (+)
Contract design
• Contract extensiveness (+)
• Contract structure (+)
Misalignment (+) between transaction hazards and
control structure
Ex post transaction problems
Costs ofcontracting
Risks and formal controlsAnderson and Dekker (2005)

Copyright S. Anderson 2009
Common intra-firm management control frameworks
• COSO (1992)• Preventive controls• Detection controls
• Simons (1995)• Belief systems• Boundary systems• Interactive systems• Diagnostic systems
• Merchant and Van der Stede (2003)• Culture controls• Personnel controls• Action controls• Outcome controls
• Jensen and Meckling (1992)• Decision rights allocation• Rewards and punishments• Performance measures
Risks and a portfolio of formal and informal controls Anderson, Christ, Dekker and Sedatole (2009)
Copyright S. Anderson 2009
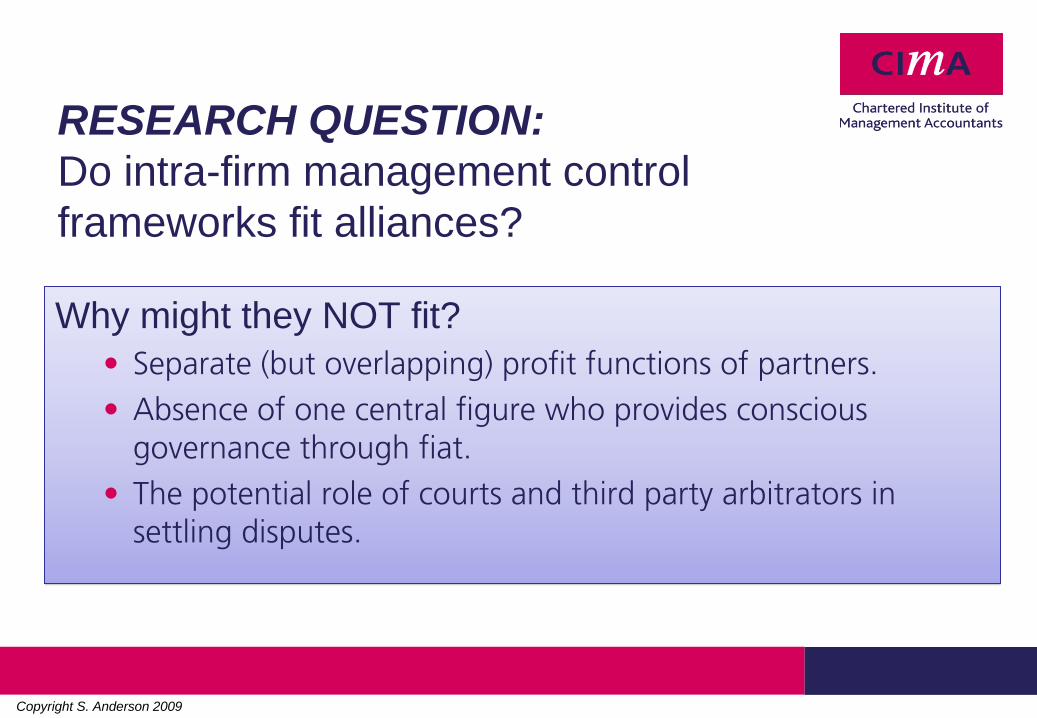
RESEARCH QUESTION: Do intra-firm management control frameworks fit alliances?
Why might they NOT fit?•
Separate (but overlapping) profit functions of
partners.
•
Absence of one central figure who provides conscious governance through fiat.
•
The potential role of
courts and third party arbitrators in settling disputes.
Why might they NOT fit?•
Separate (but overlapping) profit functions of
partners.
•
Absence of one central figure who provides conscious governance through fiat.
•
The potential role of
courts and third party arbitrators in settling disputes.

Copyright S. Anderson 2009
Research design: exploratory field studies
Three large, U.S.-headquartered firms with significant, varied alliance activity:
• BIOTECH international R&D, sales and production that combines biological, chemical and manufacturing expertise
• TECHNOLOGY international R&D, sales and production that sells consumer and business software, hardware and related support services
• RETAIL general merchandising firm that sells products in the U.S. through stores, catalog and internet

Copyright S. Anderson 2009
Focal risks and controlsBIOTECH‘We have had a number of situations where the joint ventures have actually gone out and operated outside the scope of… [how] they were supposed to operate.’
‘…make sure you have enough board representation… I think that’s an important way to really influence how the strategic alliance performs and operates. To keep people that you have in those key positions, especially if they’re your people, makes a big difference.’

Copyright S. Anderson 2009
Focal risks and controlsTECHNOLOGY‘One of the biggest issues that we face is piracy/counterfeiting of our products in distribution channels. Another risk that we have is under-reporting by our channel partners, specifically, by our [OEM] partners, who may or may not do it intentionally.’
‘You always negotiate in audit rights in order to go through... you want to make sure that the software is getting deployed properly and in the right numbers’.
Copyright S. Anderson 2009
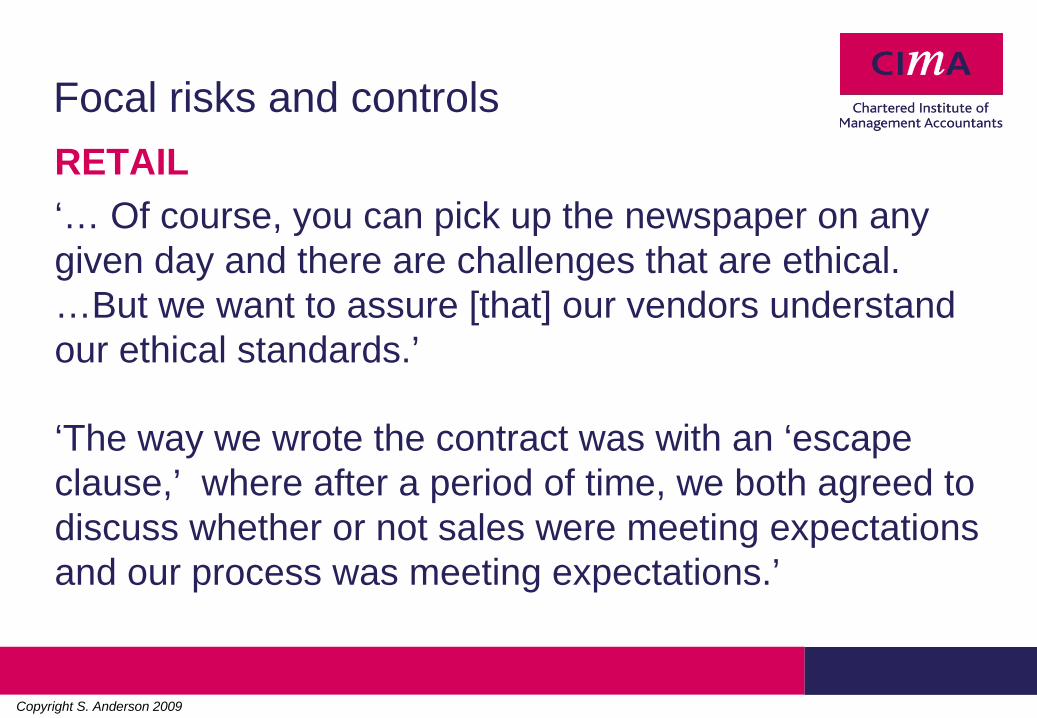
Focal risks and controlsRETAIL‘… Of course, you can pick up the newspaper on any given day and there are challenges that are ethical. …But we want to assure [that] our vendors understand our ethical standards.’
‘The way we wrote the contract was with an ‘escape clause,’ where after a period of time, we both agreed to discuss whether or not sales were meeting expectations and our process was meeting expectations.’

Copyright S. Anderson 2009
Evidence on risk exposureFirm
Risk frameworks: BIOTECH TECH RETAIL TotalDas and Teng (1996)Performance risk 20 45 32 97Relational risk 12 16 4 32
Total 32 61 36 129COSO (2004)Strategic risk 24 42 20 86Operations risk 7 21 14 42Reporting risk 0 7 1 8Compliance risk 1 4 3 8
Total 32 74 38 144
75% perf. risk
Relational risk with property rights concerns
80%
Sparsely represented but
important to accounting and
finance managers
All risks classifiable in both
frameworks
Copyright S. Anderson 2009
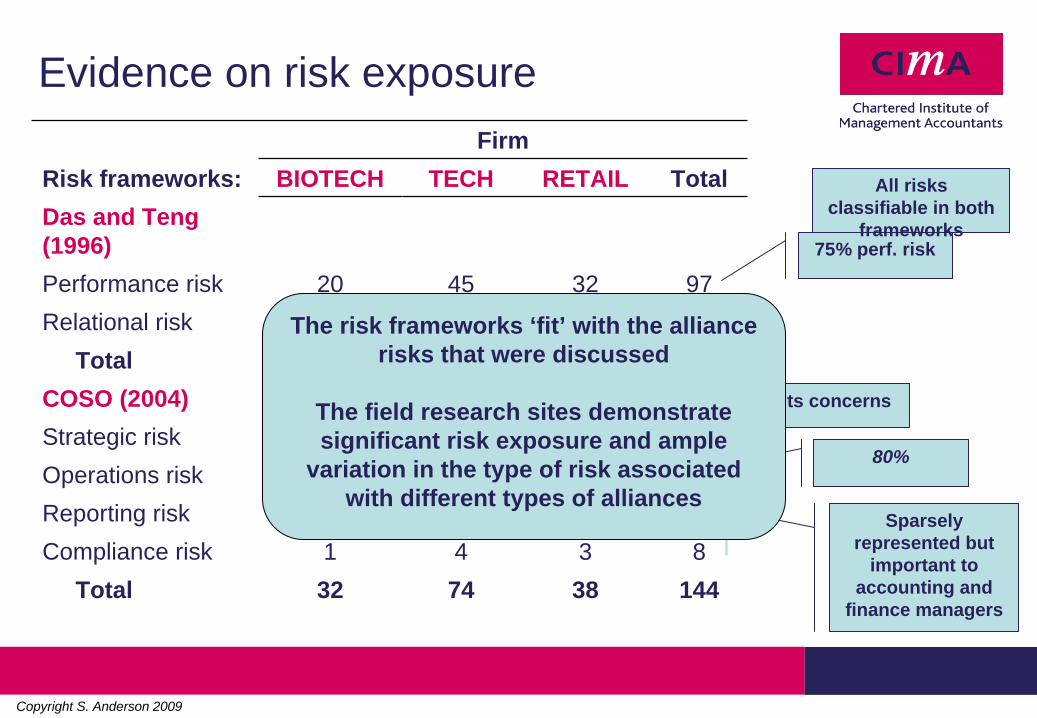
Evidence on risk exposureFirm
Risk frameworks: BIOTECH TECH RETAIL TotalDas and Teng (1996)Performance risk 20 45 32 97Relational risk 12 16 4 32
Total 32 61 36 129COSO (2004)Strategic risk 24 42 20 86Operations risk 7 21 14 42Reporting risk 0 7 1 8Compliance risk 1 4 3 8
Total 32 74 38 144
75% perf. risk
Relational risk with property rights concerns
80%
Sparsely represented but
important to accounting and
finance managers
The risk frameworks ‘fit’ with the alliance risks that were discussed
The field research sites demonstrate significant risk exposure and ample
variation in the type of risk associated with different types of alliances
All risks classifiable in both
frameworks

Copyright S. Anderson 2009
Evidence on the Portfolio of ControlsFirm
Control framework: BIOTECH TECH RETAIL TotalCOSO (1992)Preventive 78 72 37 187Detective 7 18 10 35Monitoring 4 18 18 40N/A 0 0 0 0
Total 89 107 64 262Simons (1995)Belief systems 8 5 8 22Boundary systems 62 46 25 133Diagnostic controls 15 43 28 86Interactive controls 9 17 4 30N/A 0 1 0 1
Total 95 112 65 272
Copyright S. Anderson 2009
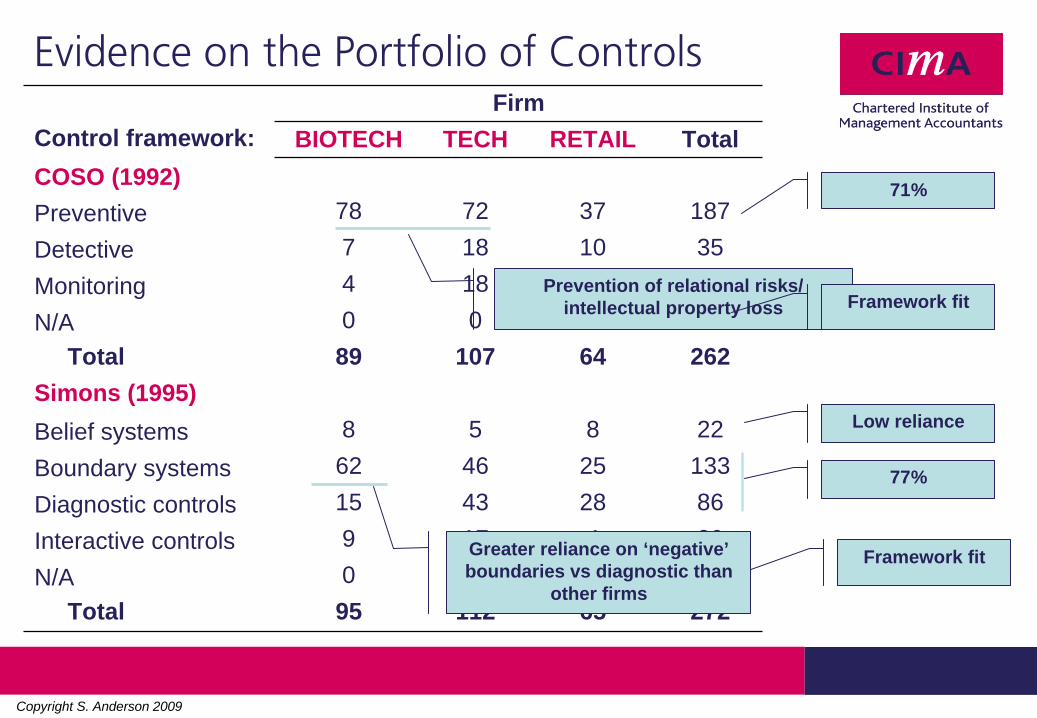
Evidence on the Portfolio of ControlsFirm
Control framework: BIOTECH TECH RETAIL TotalCOSO (1992)Preventive 78 72 37 187Detective 7 18 10 35Monitoring 4 18 18 40N/A 0 0 0 0
Total 89 107 64 262Simons (1995)Belief systems 8 5 8 22Boundary systems 62 46 25 133Diagnostic controls 15 43 28 86Interactive controls 9 17 4 30N/A 0 1 0 1
Total 95 112 65 272
71%
Prevention of relational risks/ intellectual property loss Framework fit
Framework fit
77%
Greater reliance on ‘negative’ boundaries vs diagnostic than
other firms
Low reliance

Copyright S. Anderson 2009
Evidence on the portfolio of controlsFirm
Control framework: BIOTECH TECH RETAIL TotalMerchant and Van der Stede (2003)Personnel 33 23 20 76Cultural 6 6 2 14Action 39 37 18 94Results/outcomes 14 45 26 85N/A 1 1 0 2
Total 93 112 69 282Jensen and Meckling (1992)Decision rights 63 58 30 151Performance measurement 15 34 20 69Rewards/punishment 8 14 7 29N/A 9 22 15 46
Total 95 128 72 295
Low reliance, like beliefs
greater reliance, unlike beliefs
Framework fit
Framework (mis)fit
47%
Greater reliance on decision rights, similar to ‘negative’
boundaries
Copyright S. Anderson 2009
Supplier performance management
Supplier performance management (SPM) includes the processes of:
• measuring and analysing supplier performance • managing the supplier relationship
to enhance efficiency (cost) and efficacy (profit and revenue) of the full value chain.

Copyright S. Anderson 2009
Trends in SPM• Firms employ a variety of measures in SPM. However, nearly half of
firms have no formal practices of measuring supplier performance.
• Among firms with formal SPM, better performance is found for those:• that have measured suppliers for more than 18 months • that standardise measurement practices at the SBU (versus the firm)• that measure performance for more than 25% of the total supply base• no performance differences are associated with different technological
(e.g. ERP, e-sourcing, VMI, spreadsheets) approaches.[Aberdeen Group Sept 2005]

Copyright S. Anderson 2009
What aspects of supplier performance are measured?
0 10 20 30 40 50 60 70 80 90 100
On time delivery
Quality of goods/services
Service capability/performance
Price Competitiveness
Compliance with Contract Terms
Response
Leadtime
Technical Capability
Environmental, health and safety performance
Innovation
Transaction
Current relationship
Future relationship
Source: AberdeenGroup, Sept 2005
Copyright S. Anderson 2009
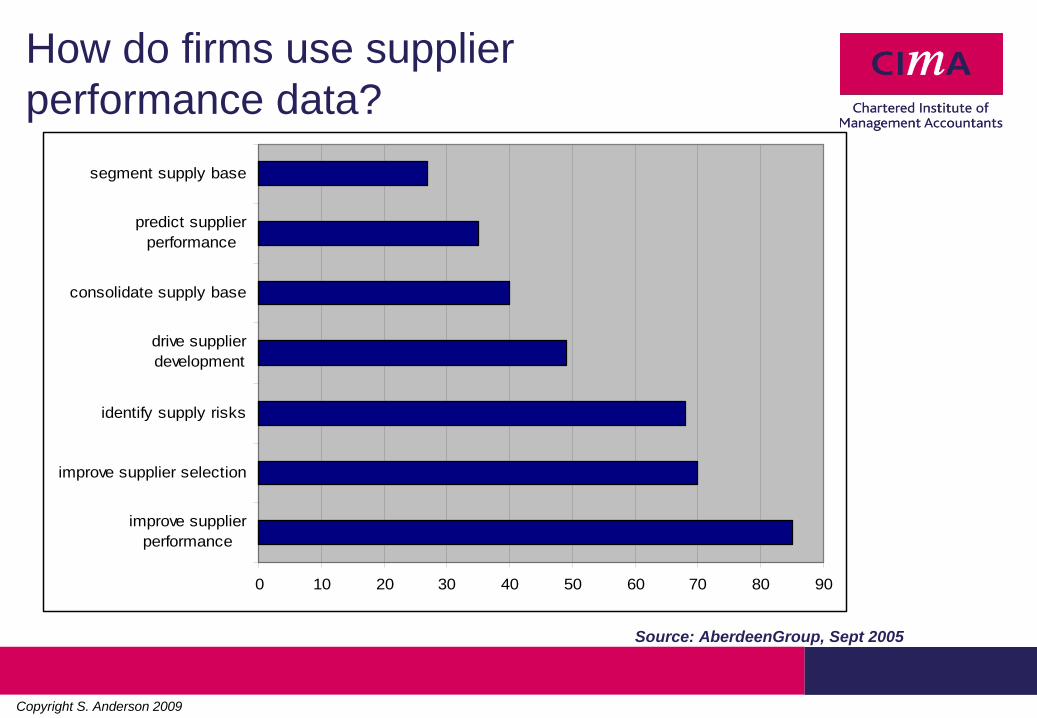
How do firms use supplier performance data?
0 10 20 30 40 50 60 70 80 90
improve supplierperformance
improve supplier selection
identify supply risks
drive supplierdevelopment
consolidate supply base
predict supplierperformance
segment supply base
Source: AberdeenGroup, Sept 2005
Copyright S. Anderson 2009
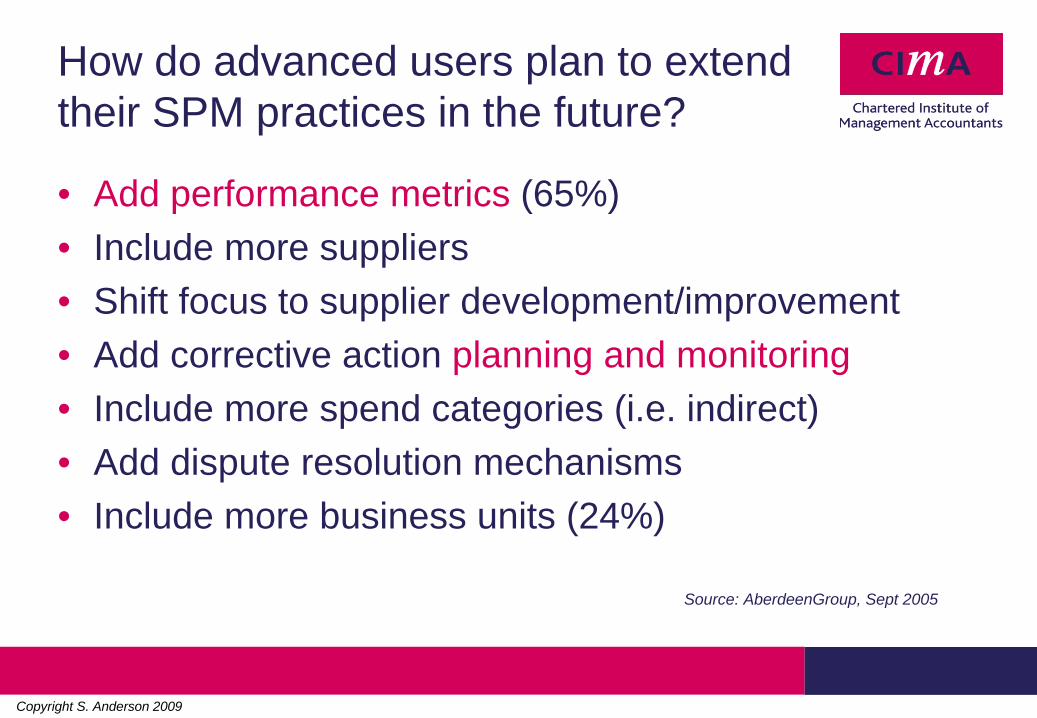
How do advanced users plan to extend their SPM practices in the future?
• Add performance metrics (65%)• Include more suppliers• Shift focus to supplier development/improvement• Add corrective action planning and monitoring• Include more spend categories (i.e. indirect)• Add dispute resolution mechanisms• Include more business units (24%)
Source: AberdeenGroup, Sept 2005
Copyright S. Anderson 2009
Putting it all together
An illustrative example with many unanswered questions:
`Supplier Management at Sun Microsystems (A)’
Putting it all together
An illustrative example with many unanswered questions:
`Supplier Management at Sun Microsystems (A)’
Stanford University Case, OIT-16A. Available through Harvard Case Services

Copyright S. Anderson 2009
SPM at Sun MicrosystemsCost management
• Boundary of the firm: not a simply make-versus-buy. Different combinations of design, make and buy
• What alternatives are considered and why?• What costs and values are assigned to each (real) option?• Is uncertainty incorporated in the decision? Whose uncertainty?
• Total cost of ownership: not a cost allocation. Assigned based on performance-to-goal for several non-financial metrics
• Does the method of calculation matter? Why - information properties vs cognitive processing?
• Does the link to subsequent sourcing decisions and individual compensation support/ undermine performance?

Copyright S. Anderson 2009
SPM at Sun MicrosystemsManagement control and governance
• Supplier selection: not simple cost minimisation
• How are non-financial factors weighed in the decision?• How does the make/buy/design decision interact with subsequent monitoring?
• Contracting: thoughtfully constructed, rarely consulted later
• Can we reconcile economic models of the role of the contract with the reality that it is rarely consulted or `enforced’? Are our negotiation models/ experiments premised on this `disuse’?
• Compensation design: supplier scorecard is an input to future supplier selection, scorecard results are used by some suppliers to compensate their managers
• Do issues of distributive and procedural justice affect supplier relations when competitive conditions cause suppliers with lower scorecard performance to receive bigger awards than those with higher performance?
Copyright S. Anderson 2009
SPM at Sun Microsystems
Performance measurement and evaluation
• Measurement Scorecard: designed and administered by Sun. Used interactively with suppliers. An input to future sourcing decisions
• Is Sun’s scorecard fully aligned with supplier strategies? • Will it maximize performance of the full value chain?
• Setting Performance Goals
• Do different goal-setting processes between buyer-supplier (i.e. participation, information sharing, ratcheting) produce different results?
• Does goal-setting interact with contract terms (i.e. take or pay contracts)

Copyright S. Anderson 2009
Sun Microsystems is a large, U.S. firm. The case focuses on their processes for organising suppliers. How would a change of perspective alter things?
Current research tends to focus on large, Western firms• How will the research questions, theory and/or results differ:
• if the ‘central’ firm is not Western• if the ‘supplier’ sells to several large firms that have different SPM practices• if the relations are not ‘hub and spoke’, but rather, fully networked (e.g.
interactions among suppliers)• with varying bilateral power in the buyer-supplier dyad.
Current research focuses on ‘forward’ supply chains - moving product/service to end customers. How will research questions, theory and/or results differ for ‘reverse’ supply chains --- recycling, reusing and disposing of goods?
Other issues for consideration

Copyright S. Anderson 2009
Conclusions• Inter-firm relationships account for an increasing share of firms’
costs and are associated with exposure to new risks (and returns).
• Although they are often initiated to reduce cost; they are increasingly a source of strategic advantage for firms pursing both low cost and differentiation strategies.
• Management control systems, cost accounting systems and performance management systems are adapting to address:• Alliance risk and decision-making under uncertainty• Performance of the value chain• Aligned incentives of all partners

Copyright S. Anderson 2009
Questions and comments