DEMYSTIFYIN L iDAR
31
www.abiresearch.com DEMYSTIFYING LiDAR: IoT AND AUTOMOTIVE APPLICATIONS, INDUSTRIES, AND BUSINESS MODELS Analysts: Dominique Bonte, Dan Shey, James Hodgson, Rian Whitton, Dimitrios Pavlakis EXECUTIVE SUMMARY INTRODUCTION While Light Detection and Ranging (LiDAR) sensor technology was initially developed and positioned for Three-Dimensional (3D) map making, surveying, and autonomous driving (the agenda of which has now been pushed to the second half of this decade), it is now ready for deployment in several Internet of Things (IoT) markets and verticals. This coincides with technological innovation, such as the shift from mechanical to solid-state LiDAR sensors and the maturity of 3D perception software that enable the integration into and the automation of a growing number of important processes and applications. This extends the opportunity for LiDAR manufacturers to not only serve highly competitive, concentrated, and price-sensitive markets like automotive, but also several large IoT markets, such as security, smart cities, and industrial automation, characterized by a larger and more diversified end-customer base. In this document, ABI Research demonstrates that, for this decade, the IoT market for 3D LiDAR perception is structurally highly attractive due to several key factors: Represents the largest total market, with a 2030 installed base of 16 million sensors versus 13 million for automotive, growing at a Compound Annual Growth Rate (CAGR) of 53% (2021 to 2030). Serves large and diversified verticals, such as security, industrial automation, smart cities, and smart spaces, with tens of thousands of potential target customers. TABLE OF CONTENTS Executive Summary ............................... 1 Introduction ........................................................... 1 IoT and Automotive Markets ................................... 2 LiDAR Principles and Technologies ......................... 5 LiDAR Principles......................................................................... 5 LiDAR Technologies.................................................................... 5 LiDAR versus Other Sensors ...................................................... 6 Smart Cities and Smart Spaces ................ 7 Overview of LiDAR Use Cases for Smart Cities ......... 7 Public Traffic Management and Safety ...................................... 7 Outdoor Smart Cities People Flow Management and Other Applications ....................................... 8 Indoor/Outdoor People Detection, Counting, and Flow Management at Microcities ....................................... 8 Benefits and Unique Selling Propositions of LiDAR Sensor Technologies ................................ 9 Business Model Analysis ....................................... 10 Market Opportunity ............................................. 10 Security Applications ............................ 13 Overview of LiDAR Use Cases for Security Applications........................................ 13 Access Control, Border Control, and Surveillance ..................... 13 Physical Perimeter Defense, Intruder Detection, and Kickstarting Security Operations........................................ 14 Data Privacy, Indoor Crowd Monitoring, and Safety ................. 15 Benefits and Unique Selling Propositions ............. 15 Business Model Analysis ....................................... 16 Security Market Opportunity ................................. 17
Transcript of DEMYSTIFYIN L iDAR

www.abiresearch.com
DEMYSTIFYING LiDAR: IoT AND AUTOMOTIVE APPLICATIONS, INDUSTRIES, AND BUSINESS MODELS
Analysts: Dominique Bonte, Dan Shey, James Hodgson, Rian Whitton, Dimitrios Pavlakis
EXECUTIVE SUMMARY INTRODUCTION While Light Detection and Ranging (LiDAR) sensor technology was initially developed
and positioned for Three-Dimensional (3D) map making, surveying, and autonomous
driving (the agenda of which has now been pushed to the second half of this decade),
it is now ready for deployment in several Internet of Things (IoT) markets and verticals.
This coincides with technological innovation, such as the shift from mechanical to
solid-state LiDAR sensors and the maturity of 3D perception software that enable the
integration into and the automation of a growing number of important processes and
applications. This extends the opportunity for LiDAR manufacturers to not only serve
highly competitive, concentrated, and price-sensitive markets like automotive, but also
several large IoT markets, such as security, smart cities, and industrial automation,
characterized by a larger and more diversified end-customer base.
In this document, ABI Research demonstrates that, for this decade, the IoT market for
3D LiDAR perception is structurally highly attractive due to several key factors:
� Represents the largest total market, with a 2030 installed base of 16 million sensors versus 13 million for automotive, growing at a Compound Annual Growth Rate (CAGR) of 53% (2021 to 2030).
� Serves large and diversified verticals, such as security, industrial automation, smart cities, and smart spaces, with tens of thousands of potential target customers.
TABLE OF CONTENTSExecutive Summary ...............................1Introduction ........................................................... 1IoT and Automotive Markets ................................... 2LiDAR Principles and Technologies ......................... 5
LiDAR Principles ......................................................................... 5LiDAR Technologies .................................................................... 5LiDAR versus Other Sensors ...................................................... 6
Smart Cities and Smart Spaces ................7Overview of LiDAR Use Cases for Smart Cities ......... 7
Public Traffic Management and Safety ...................................... 7Outdoor Smart Cities People Flow Management and Other Applications ....................................... 8Indoor/Outdoor People Detection, Counting, and Flow Management at Microcities ....................................... 8
Benefits and Unique Selling Propositions of LiDAR Sensor Technologies ................................ 9Business Model Analysis ....................................... 10Market Opportunity ............................................. 10
Security Applications ............................ 13Overview of LiDAR Use Cases for Security Applications ........................................ 13
Access Control, Border Control, and Surveillance ..................... 13Physical Perimeter Defense, Intruder Detection, and Kickstarting Security Operations ........................................ 14Data Privacy, Indoor Crowd Monitoring, and Safety ................. 15
Benefits and Unique Selling Propositions ............. 15Business Model Analysis ....................................... 16Security Market Opportunity ................................. 17

2DEMYSTIFYING LIDAR: IOT AND AUTOMOTIVE APPLICATIONS, INDUSTRIES, AND BUSINESS MODELSwww.abiresearch.com
� Given the much higher customer dispersion versus the automotive industry, it enables better business models and mid-high gross margins.
� LiDAR technology is already widely adopted in applications, such as industrial automation, therefore offering a much lower market timing risk.
� The market will support between 5 and 10 quality suppliers to address the breadth of applications and industries.
� Overall, it allows for a larger profit opportunity.
At the same time, while the automotive market will represent the largest single vertical
long-term opportunity, the LiDAR market for automotive is going through a number of key
architecture/product stages. Therefore, the following statements apply:
� Mass market adoption in the long term will be mainly enabled by solid-state architectures due to their lower cost and reduced wear and tear compared with mechanical architectures.
� Winners will be rewarded in the second half of the decade.
� Architectural efficacy will be relevant for the second half of the decade.
� Supply chain integrity and regional economic interests will require between 5 and 10 quality worldwide suppliers. Supply chain structure will not allow a “winner-takes-all” scenario.
� Supplier economics will be challenged and mature by the end of the decade.
IoT AND AUTOMOTIVE MARKETSFigure 1 summarizes the differences in market size, structure and dynamics between IoT markets
and Automotive.
Figure 1: LiDAR Market Size and Structure(Source: ABI Research)
MARKET SIZE AND STRUCTURE IOT AUTOMOTIVE
MARKET SIZE
LiDAR installed Base in 2023 (millions) 1.09 0.144
LiDAR installed Base in 2030 (millions) 15.98 12.95
Confidence of market timing HIGH MEDIUM
INDUSTRY STRUCTURE
Buyer dispersion More than 10000 15-20
Market Maturity
2D HIGH NOT APPLICABLE
3D In process Prospective
Supplier dispersion
2D 5 - 10 NOT APPLICABLE
3D 5 - 10 5 - 10
LiDAR for Industrial Automation ............ 19Overview of LiDAR Use Cases for Industrial Robotics .......................................... 20
2D Obstacle Detection ............................................................ 20LiDAR for Stationary Robotics ................................................... 203D LiDAR for Unstructured Environments................................. 20
Mapping LiDAR .................................................... 21Business Model for 3D LiDAR in Industrial Automation ....................................... 21Robotics Market Opportunity ............................... 21
LiDAR in Automotive ............................ 23Redundancy in Highly Autonomous Vehicle Applications .............................................. 23Automotive Use Cases ........................................... 24 Automotive LiDAR Technology Evolution .............. 24Automotive LiDAR Case Studies ............................. 26Automotive Business Model Analysis .................... 27Automotive Market Opportunity ............................ 29
Summary and Conclusions ..................... 30

3DEMYSTIFYING LIDAR: IOT AND AUTOMOTIVE APPLICATIONS, INDUSTRIES, AND BUSINESS MODELSwww.abiresearch.com
This decade, the IoT market is larger than automotive. Automotive will become the largest single
market beyond 2030.
Chart 1 and Chart 2 show projections for the number of LiDAR sensors (installed base) for automotive and
the different IoT markets, consolidated and individually, respectively. The aggregated IoT market size will be
substantially larger than automotive in the medium term with automotive catching up by 2030 and, ultimately,
expected to become the largest market.
Chart 1: Installed Base LiDAR Sensors – Automotive versus IoT Segments Consolidated World Markets: 2019 to 2030(Source: ABI Research)
Chart 2: Installed Base LiDAR Sensors – Automotive versus IoT Segments World Markets: 2019 to 2030(Source: ABI Research)
Within the IoT, the industrial segment will remain the largest market, followed by security and smart cities.
The IoT market provides lower customer concentration, therefore higher profitability opportunity.
The IoT market consists of very large and fast-growing segments, such as industrial automation, smart
cities, and security, with an aggregate end-user base that can be counted in the tens of thousands of
accounts across the globe. This contrasts with the automotive market where the top 10 Original
Equipment Manufacturers (OEMs) accounted for 68% of the market as a whole (2019).
0
2
4
6
8
10
12
14
16
18
2020 2021 2022 2023 2024 2025 2026 2027 2028 2029 2030
Automotive IoT - Total
(Milli
ons)
0
2
4
6
8
10
12
14
2020 2021 2022 2023 2024 2025 2026 2027 2028 2029 2030
(Milli
ons)
Automotive IoT - Smart Cities IoT - Industrial IoT - Security

4DEMYSTIFYING LIDAR: IOT AND AUTOMOTIVE APPLICATIONS, INDUSTRIES, AND BUSINESS MODELSwww.abiresearch.com
The automotive OEMs hold considerable monopsony power, with the ability of automakers to dictate prices
to their suppliers only expected to increase as the LiDAR market consolidation occurs. This will have the effect
of lowering the margin that LiDAR suppliers can achieve in the automotive market.
In contrast, the IoT market represents a much less concentrated ecosystem than automotive with its
end-customers exercising less influential power on pricing levels and, therefore, providing an overall more
level competitive environment. This, in turn, will translate to mid-high gross margin potentials for the LiDAR
vendors servicing it.
The IoT market will reach mass-market faster than the automotive.
The LiDAR market will support 10 to 20 qualified vendors, with no “winner-takes-all” scenario.
Today, there are more than 100 LiDAR vendors in the market, but few with enough capital, revenue, and
mature product portfolios to be able to address the significant market opportunity. Therefore, consolidation
will naturally occur during this decade with ABI Research anticipating that 10 to 20 quality vendors will serve
the entire IoT and automotive markets by 2030, with roughly 5 to 10 per market.
The automotive industry, for instance, rarely accepts a single-point-of-failure in the supply chain by
engaging with a single technology supplier; in fact, each major OEM will typically qualify three suppliers for
each high-volume design slot. This is evidenced by the major supply chain issues and long lead times that are
impacting all major markets today.
Furthermore, OEMs in certain regions prefer to engage with local sensor technology developers and
suppliers, increasing the number of qualified vendors. As a result, ABI Research expects that the dozens
of LiDAR developers targeting the automotive industry today will eventually consolidate to a handful of
suppliers, and that no single LiDAR supplier can expect to become a monopolistic supplier of LiDAR sensors
to the automotive market.
IoT is a bridge to automotive.
The diverse dynamics at play allow for a complementary strategy, whereby investing in solutions targeting the
IoT will enable LiDAR vendors to reap the benefits of the larger and more certain market in the earlier part of
this decade, while preparing their solutions for the aggressive cost, manufacturing, and scale of automotive
OEM requirements.
For instance, the industrial Autonomous Mobile Robot (AMR) market exhibits similar scaling
challenges to automotive. AMRs are expected to reach an installed base of about 10 million units
(by 2030). In addition to high-performance sensors, they will require manufacturing scale, a strong
supply chain, and low-cost designs.
Optimizing these processes in the first half of the decade will enable manufacturers to effectively engage
the automotive OEMs when they are ready to scale.

5DEMYSTIFYING LIDAR: IOT AND AUTOMOTIVE APPLICATIONS, INDUSTRIES, AND BUSINESS MODELSwww.abiresearch.com
LIDAR PRINCIPLES AND TECHNOLOGIES LIDAR PRINCIPLESFundamentally, LiDAR is a distance measurement device. There are two principles to measure the distance
as illustrated in Figure 2. Direct detection is based on sending out laser pulses and measuring the
Time-of-Flight (ToF) of the return photons. Coherent detection is based on Frequency Modulated Continuous
Wave (FMCW) to provide indirect measurement of both distance and velocity (doppler effect) along the radial
direction. ToF and FMCW are shown in Figure 2 and Figure 3.
Figure 2: LiDAR Principles(Source: ABI Research)
LIDAR TECHNOLOGIESVarious mechanisms are employed to expand the single point range finding to both azimuth and vertical
directions and generate aggregated 3D distance measurements (point cloud). There are typically two main
categories of LiDAR, classified as mechanical LiDAR and solid-state LiDAR. Mechanical LiDAR uses either
macroscopic rotational transceiver construction (see (a) in Figure 3) or microscopic mirrors (see (b) in
Figure 3) as in Micro-Electro-Mechanical Systems (MEMS) to scan or steer the laser beam. There are two
types of solid-state LiDAR. One is flash LiDAR (see (c) in Figure 3) where the light source illuminates the
whole scene and uses a Two-Dimensional (2D) detector array to capture the return signal. Despite its
solid-state nature, flash LiDAR’s detection range is limited due to the large amount of power required
to spread out to cover the field of view, resulting in unfavorable thermal and power consumption
implications. The other one is Optical Phased Array (OPA)-based electronics beam steering solid-state
LiDAR (see (d) in Figure 3). OPA LiDAR steers laser beam through a series of phase modulators, where phase
shifters control the optical wave-front interference, electronically steering the laser beam to different angles.
This unique approach combines the solid-state characteristics with an electronic scanning mechanism.
time
t
distance d
2C td
Transmit Signal
Receive Signal Range is direct function ofFrequency shift of returning signal
fcfg
tc

6DEMYSTIFYING LIDAR: IOT AND AUTOMOTIVE APPLICATIONS, INDUSTRIES, AND BUSINESS MODELSwww.abiresearch.com
Figure 3: LiDAR Technologies(Source: Li, You and J. Ibañez-Guzmán. )
While mechanical LiDAR is currently dominant, both in IoT and automotive (mainly in driverless concepts
and trials), various forms of solid-state LiDAR will become prevalent in both automotive and IoT verticals due
to their inherent cost and reliability benefits. Within industrial contexts, 3D LiDAR will gradually displace 2D
LiDAR.
LIDAR VERSUS OTHER SENSORS Table 1 provides a high-level, cross-vertical comparison between LiDAR and other types of sensors.
While LiDAR has some unique advantages compared to other sensors, it will often be combined with
other sensors, either for increasing reliability via sensor fusion in automotive, for example, or offering a
wider range of applications, such as by combining them with camera sensors for biometrics applications
like facial recognition in security contexts or for number plate recognition in traffic management. It is
also worth noting that both High-Definition (HD) radar and Infrared (IR) are starting to be deployed in
automotive and traffic management markets, for example, by FLIR, leveraging the higher robustness
compared with camera sensors.

7DEMYSTIFYING LIDAR: IOT AND AUTOMOTIVE APPLICATIONS, INDUSTRIES, AND BUSINESS MODELSwww.abiresearch.com
Table 1: Comparison of LiDAR versus Other Sensors(Source: ABI Research)
SENSOR TYPE/ CAPABILITIES COST AT SCALE RANGE RESOLUTION ROBUSTNESS TO
POOR WEATHERROBUSTNESS TO POOR LIGHTING
LiDAR M M/H M/H H H
Camera L M H L/M L/M
Radar L H L H H
HD Radar L H M H H
FIR M M/L M/L H H
The following sections cover key use cases, including case studies, mapping of LiDAR benefits to use cases,
business models, ecosystem dynamics, market opportunities, and sizing for the following key markets:
� IoT
- Smart cities and smart spaces
- Security
- Industrial automation
� Automotive
SMART CITIES AND SMART SPACES Over the past years, LiDAR has started to enable a wide range of smart cities use cases, centered around
vehicle traffic and people flow tracking, monitoring, and management. While safety-related use cases, such
as pedestrian detection and traffic management at intersections, are well known, COVID-19 has brought
people density tracking and overall flow management to the foreground. However, crowd management
has many other benefits, most importantly offering a better overall Customer Experience (CX) at retail outlets,
airports, and other microcity venues through better line management, while, at the same time, providing
critical information about customer behavior and attitudes for marketing purposes. Finally, LiDAR is used to
survey the physical infrastructure and assets of cities to inform 3D mapping of digital twins.
OVERVIEW OF LIDAR USE CASES FOR SMART CITIES LiDAR use cases for smart cities can be categorized according to various criteria:
� Outdoor versus indoor applications
� Vehicle versus people tracking, monitoring, and management
� Intelligent Transportation Systems (ITSs) versus generic smart cities applications
PUBLIC TRAFFIC MANAGEMENT AND SAFETY Traffic management is mainly an opportunity at junctions/intersections as part of the wider ITS market
with key use cases including vehicle traffic monitoring and pedestrian detection. Cities are increasingly
focusing on understanding fluctuating traffic patterns and mix, as well as vulnerable road user safety.
At the same time, overall traffic management is increasingly being automated via on machine vision
solutions based on connected Artificial Intelligence (AI) sensors to enable (cooperative) Adaptive Traffic

8DEMYSTIFYING LIDAR: IOT AND AUTOMOTIVE APPLICATIONS, INDUSTRIES, AND BUSINESS MODELSwww.abiresearch.com
Lights. Other ITS use cases include parking space information and management, classification for tolling,
and highway speed detection and enforcement. Key examples and case studies are listed below:
� Europe, LiDAR-Enabled Obstacle Detection at Railway Level Crossings: Based on Cepton’s Helius Smart LiDAR System.
� France, Highway Speed Monitoring and Enforcement: Quanergy supplying M-Series Long-Range 3D-LiDAR sensors to Parifex, which also partners with Ouster.
� Adelaide, Lane-Based Traffic Management: Use of Quanergy M-Series LiDAR sensors and the QORTEX DTC (Detection, Tracking, and Classification) solution to collect information about pedestrians and vehicle traffic approaching intersections.
� Seoul, Pedestrian Safety at Schools: 3D LiDAR-based Smart Safety School Zone solution in partnership with iCent, consisting of M-Series LiDAR sensors from Quanergy, actively monitors the movement of objects, including people and vehicle, at crosswalks to protect pedestrian safety and prevent accidents, as well as capturing vehicle traffic patterns and pedestrian numbers.
� Pittsburg, Curb and Parking Analysis: Partnerships between Velodyne and Kaarta to visualize urban curbside use and occupancy.
� Reno, Nevada, Smart and Safer Transportation Infrastructure: Velodyne partnering with the University of Reno to detect, count, and track pedestrians, cyclists, and traffic.
� Busan, South Korea, Pedestrian and Vehicle Safety: Solution developed based on the Quanergy MQ-8 sensor and QORTEX DTC in partnership with iCent.
� Austin, Texas, Traffic Monitoring: Velodyne LiDAR-based intersection traffic monitoring solution replacing inductive-loop detectors, cameras, and radars in partnership with NVIDIA Metropolis.
OUTDOOR SMART CITIES PEOPLE FLOW MANAGEMENT AND OTHER APPLICATIONS Very much put on the map by COVID-19 for social distancing monitoring and enforcement, but also already
used previously to manage pedestrians flows in crowded city centers, data can also be gathered to inform the
urban planning process. Key applications include people counting and density measurements. Key examples
and case studies are listed below:
� Las Vegas, Tracking and Management of Pedestrian Flows: Quanergy’s M-Series LiDAR sensor technology powering Cisco’s Smart City Connected Roadway solutions to track the flow of pedestrians and vehicles at intersections.
� South Korea, People Counting for Tourism: Quanergy LiDAR solution for optimizing beach operations and guaranteeing tourist safety in partnership with iCent.
� Frankfurt Airport: Leonardo uses LiDAR to assess weather quality, pollution, and aviation conditions.
INDOOR/OUTDOOR PEOPLE DETECTION, COUNTING, AND FLOW MANAGEMENT AT MICROCITIES Both informed by COVID-19 restrictions and the need for better crowd flow management to minimize
delays caused by lining up at a range of microcity categories, including airports, train stations, passenger
ports, malls, venues, and campuses. Additionally, LiDAR tracking data provides critical data about behavior
and usage patterns for marketing purposes (dwell time, line time, path, intent, and journey). Finally, LiDAR
sensors are now also being used for building occupancy detection and management in terms of optimized
energy management of Heating, Ventilation, and Air Conditioning (HVAC) and lighting. Key examples and case
studies are listed below:
9DEMYSTIFYING LIDAR: IOT AND AUTOMOTIVE APPLICATIONS, INDUSTRIES, AND BUSINESS MODELSwww.abiresearch.com
� Miami International Airport, Real-Time Crowd Monitoring and Line Management: Quanergy and SkyFii partnership.
� Jackson-Medgar Wiley Evers International Airport in Jackson, Mississippi, Crowd Management at Transportation Security Administration (TSA) Security Lines and Departure and Arrival Gates: Based on Quanergy’s M-Series LiDAR-based technology combined with SkyFii’s Motion Analytics Platform.
� Quanergy and Digital Mortar Partnership, LiDAR-Based Retail Analytics: End-to-end shoppers’ journey analytics, including conversion patterns, detailed merchandising analytics, foot-traffic comparisons, forecasting, and visualizations of indoor and outdoor spaces.
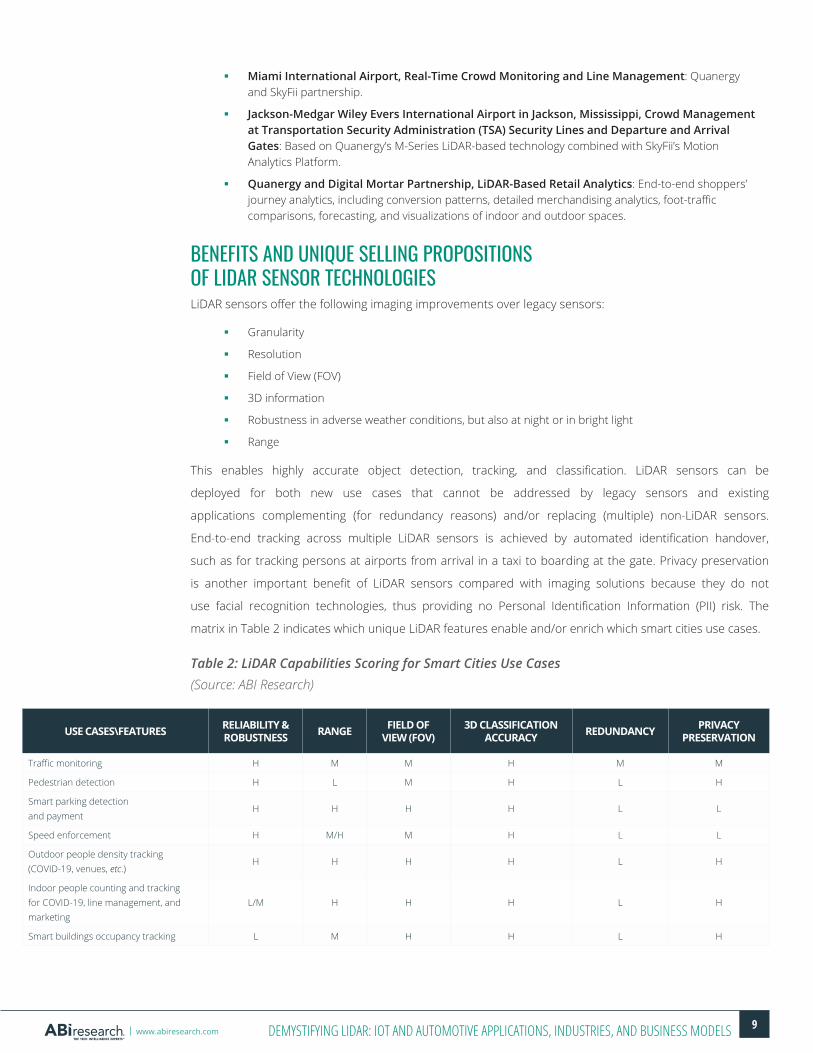
BENEFITS AND UNIQUE SELLING PROPOSITIONS OF LIDAR SENSOR TECHNOLOGIES LiDAR sensors offer the following imaging improvements over legacy sensors:
� Granularity
� Resolution
� Field of View (FOV)
� 3D information
� Robustness in adverse weather conditions, but also at night or in bright light
� Range
This enables highly accurate object detection, tracking, and classification. LiDAR sensors can be
deployed for both new use cases that cannot be addressed by legacy sensors and existing
applications complementing (for redundancy reasons) and/or replacing (multiple) non-LiDAR sensors.
End-to-end tracking across multiple LiDAR sensors is achieved by automated identification handover,
such as for tracking persons at airports from arrival in a taxi to boarding at the gate. Privacy preservation
is another important benefit of LiDAR sensors compared with imaging solutions because they do not
use facial recognition technologies, thus providing no Personal Identification Information (PII) risk. The
matrix in Table 2 indicates which unique LiDAR features enable and/or enrich which smart cities use cases.
Table 2: LiDAR Capabilities Scoring for Smart Cities Use Cases(Source: ABI Research)
USE CASES\FEATURES RELIABILITY & ROBUSTNESS RANGE FIELD OF
VIEW (FOV)3D CLASSIFICATION
ACCURACY REDUNDANCY PRIVACY PRESERVATION
Traffic monitoring H M M H M M
Pedestrian detection H L M H L H
Smart parking detection and payment
H H H H L L
Speed enforcement H M/H M H L L
Outdoor people density tracking (COVID-19, venues, etc.)
H H H H L H
Indoor people counting and tracking for COVID-19, line management, and marketing
L/M H H H L H
Smart buildings occupancy tracking L M H H L H
10DEMYSTIFYING LIDAR: IOT AND AUTOMOTIVE APPLICATIONS, INDUSTRIES, AND BUSINESS MODELSwww.abiresearch.com
BUSINESS MODEL ANALYSISFor smart cities and smart spaces applications covering large areas, such as parking, airports, malls, etc., the
business case for LiDAR can be built on the premise of substitution, with 1 LiDAR sensor capable of replacing
up to 10 legacy imaging sensors. This is possible thanks to the much longer range and, therefore, broader
coverage area provided by LiDAR sensors. The lower number of sensors also reduces installation, cabling,
networking, and maintenance costs. The opportunity for LiDAR is attractive, even in cases where it will co-exist
and be fused with other sensors. While the straight economic Return on Investment (ROI) is strong, additional
business value, such as enabling increased productivity, will also be very important. For some applications,
the business model is driven by the higher level of accuracy and predictable performance under various
weather conditions, which are key to enabling higher safety levels.
MARKET OPPORTUNITY LiDAR has the potential to both enable new use cases and replace existing legacy sensors for a range of
applications. To gauge the size of the LiDAR market, Tables 3, 4, and 5 provide numbers and/or
capacities of the key infrastructure components of smart cities, such and intersections and microcities.
Capacities are directly related to the potential number of LiDAR systems that can be installed in terms
of the Total Addressable Market (TAM).
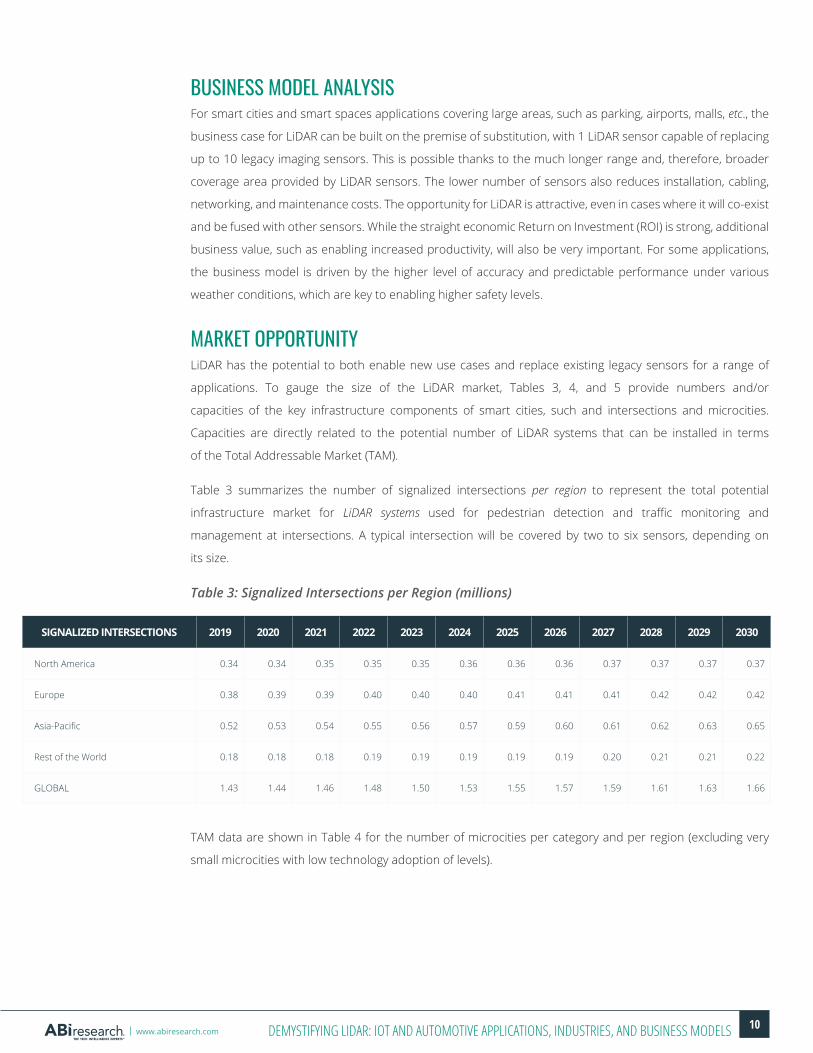
Table 3 summarizes the number of signalized intersections per region to represent the total potential
infrastructure market for LiDAR systems used for pedestrian detection and traffic monitoring and
management at intersections. A typical intersection will be covered by two to six sensors, depending on
its size.
Table 3: Signalized Intersections per Region (millions)
TAM data are shown in Table 4 for the number of microcities per category and per region (excluding very
small microcities with low technology adoption of levels).
SIGNALIZED INTERSECTIONS 2019 2020 2021 2022 2023 2024 2025 2026 2027 2028 2029 2030
North America 0.34 0.34 0.35 0.35 0.35 0.36 0.36 0.36 0.37 0.37 0.37 0.37
Europe 0.38 0.39 0.39 0.40 0.40 0.40 0.41 0.41 0.41 0.42 0.42 0.42
Asia-Pacific 0.52 0.53 0.54 0.55 0.56 0.57 0.59 0.60 0.61 0.62 0.63 0.65
Rest of the World 0.18 0.18 0.18 0.19 0.19 0.19 0.19 0.19 0.20 0.21 0.21 0.22
GLOBAL 1.43 1.44 1.46 1.48 1.50 1.53 1.55 1.57 1.59 1.61 1.63 1.66

11DEMYSTIFYING LIDAR: IOT AND AUTOMOTIVE APPLICATIONS, INDUSTRIES, AND BUSINESS MODELSwww.abiresearch.com
Table 4: Number of Microcities per Category and Region 2021(Source: ABI Research)
Table 5 shows the global capacity of microcities per category, which is directly related to the potential for
LiDAR systems for multiple use cases. The number of LiDAR sensors deployed per microcity category varies
by type and size, from just a few sensors to hundreds for the largest microcities, such as large airports.
Table 5: Capacity per Microcity Category World Markets: 2018 to 2030(Source: ABI Research)
REGIONAL DISTRIBUTION NORTH AMERICA EUROPE ASIA-PACIFIC REST OF WORLD GOBAL
Airports 170 128 176 62 536
Passenger Ports 8 58 36 18 120
Railway and Metro Stations 116 1290 747 168 2321
Malls 350 500 1250 250 2350
Venues 492 820 921 368 2600
Campuses 737 724 1299 259 3019
Others 308 434 1059 420 2221
Total 2181 3953 5487 1545 13166
CAPACITY PER MICROCITY CATEGORY METRIC 2018 2019 2020 2021 2022 2023 2024 2025 2026 2027 2028 2029 2030
Airports(Billions of Passengers)
4.30 4.42 4.42 4.42 4.42 4.43 4.47 4.54 4.64 4.75 4.85 4.96 5.08
Passenger ports(Billions of Passengers)
0.75 0.76 0.76 0.76 0.76 0.77 0.77 0.78 0.79 0.80 0.81 0.83 0.84
Railway and metro stations
(Billions of Passengers)
87.63 89.20 89.32 89.63 90.18 91.10 92.38 94.13 96.37 98.68 101.05 103.49 106.00
Malls(Millions of Square Meters)
237.50 243.23 241.85 241.93 242.46 245.14 248.34 250.12 250.26 250.40 250.55 250.70 250.85
Venues(Millions of Visitor Capacity)
92.00 93.26 93.48 94.34 96.72 99.48 102.61 106.20 110.27 114.23 118.05 121.69 125.15
Campuses(Millions of Occupants)
80.26 81.43 81.51 81.71 82.10 82.76 83.67 84.93 86.10 87.28 88.49 89.72 90.97

12DEMYSTIFYING LIDAR: IOT AND AUTOMOTIVE APPLICATIONS, INDUSTRIES, AND BUSINESS MODELSwww.abiresearch.com
The data above clearly show that the smart cities opportunity for LiDAR is fundamentally different from
automotive. For instance, the number of targetable entities runs in the tens of thousands, representing
a much less concentrated ecosystem than automotive, therefore exercising less influential power on
pricing levels and providing an overall more level competitive environment. This, in turn, will translate to
mid-high gross margin potentials for the LiDAR vendors servicing it. Procurement practices in these
segments tend to follow the traditional enterprise models, with sales cycles measured in 9 to 18 months,
significantly shorter than that of the automotive sector’s, which typically runs in 3 to 5 years. As a
consequence, this segment needs to be addressed differently in terms of the sales and marketing
approach versus the automotive OEM market, leveraging direct and indirect channels, and, importantly,
taking into account government procurement and purchasing cycles, procedures, and practices. It will
also require a level of flexibility in terms of the capability of IT toolsets to customize solutions to address
a wide range of requirements across the long tail of use cases and customers.
Chart 3 shows projections for the number of LiDAR sensors (installed base) for each of the smart
cities categories.
Chart 3: Installed Base LiDAR Sensors by Smart City Category World Markets: 2020 to 2030(Source: ABI Research)
In terms of market size, the ITS market seems to be the one having reached the highest level of maturity
currently, as evident from the large number of announcements from multiple LiDAR suppliers (see above).
It will be the largest opportunity in the smart cities market, as is shown in Chart 3. However, microcities
seem to have the biggest potential moving forward in the short term, due to the large number of applications,
benefits, and use cases. The more general smart cities market, despite the recent focus on the use of LiDAR
for social distancing, is still in an early phase but will become significant beyond 2025.
0.0
0.5
1.0
1.5
2.0
2.5
3.0
2020 2021 2022 2023 2024 2025 2026 2027 2028 2029 2030
(Milli
ons)
Trac Intersections Other Smart Cities Campuses Venues Malls
AirportsRailway and Metro Stations
13DEMYSTIFYING LIDAR: IOT AND AUTOMOTIVE APPLICATIONS, INDUSTRIES, AND BUSINESS MODELSwww.abiresearch.com
SECURITY APPLICATIONSA new market entrant in the security and surveillance market, LiDAR has gained considerable
technological momentum and popularity over the past few years. From enhancing security protocols
and synergizing with surveillance, intruder detection, and personnel authorization technologies, to
assisting governments in transportation, border control, and even social distancing protocols, LiDAR is
steadily increasing its reach and penetration rate across a wide spectrum of markets worldwide.
LiDAR’s versatile nature allows the formation of powerful synergies with existing technological solutions
ranging from monitoring operations to biometrics and behavioral analytics, security optimization and
user safety, establishing itself as a valuable component of overarching security agendas for a variety of
use case scenarios.
OVERVIEW OF LIDAR USE CASES FOR SECURITY APPLICATIONSLiDAR technologies offer highly versatile security uses cases, including the following:
� Surveillance, personnel protection, access control, and border control
� Physical perimeter defense, intruder detection, and kickstarting security operations
� Crowd monitoring, flow management, and social distancing protocols
ACCESS CONTROL, BORDER CONTROL, AND SURVEILLANCEPoint-Cloud Visualization: Through the use of multiple LiDAR sensors with the capability of horizonal
360° spinning, the system can generate point-cloud visualization to provide reliable overwatch in
designated areas. LiDAR point cloud can visualize physical objects and their unique contours, trajectory,
velocity, and acceleration.
Access Control: During access control, authorized personnel may take advantage of the technology by
having the system detect any anomalous features. The most important use case in access control is the use
of LiDAR as a powerful deterrent for tailgating, providing additional security against intruders attempting to
take advantage of a legitimate user’s attempt to verify themselves and access secured premises.
Emerging Applications: Additionally, emerging LiDAR applications include protection of property for
insider threat, hygiene, and social distancing protocols, and the safety of personnel from hazardous
areas and heavy machinery. Additionally, the technology has the potential to set the foundation for the next
generation of security monitoring and detection of potential biological warfare using LiDAR as the Biological
Point Detection (BPD) for urban biological defense protocols.
Surveillance and Border Control: Designated areas in LiDAR system can be easily “marked” by
implementers to include specific entry points in building or facilities, points of interest, or even spanning
an extended perimetry that may include commercial property, border control hubs, shipyards and
airports, security checkpoints and their adjoining areas, industrial settings, critical infrastructure, or
even defense compounds, among many others. LiDAR can be used for a versatile range of applications,
including surveillance, flow management, enhancing security systems, and defense protocols.

14DEMYSTIFYING LIDAR: IOT AND AUTOMOTIVE APPLICATIONS, INDUSTRIES, AND BUSINESS MODELSwww.abiresearch.com
Case Studies: � Quanergy provides security automation and worker protection for Korea’s Shadong Port using a
host of LiDAR solutions.
� Global security services company integrates Quanergy M-Series LiDAR with video-based mobile camera solution to significantly reduce false alarms.
� OPTEX implements LiDAR security and access control to Belfast Call Centers.
� Cepton’s LiDAR solutions implemented in Orlando International Airport for security and crowd monitoring.
PHYSICAL PERIMETER DEFENSE, INTRUDER DETECTION, AND KICKSTARTING SECURITY OPERATIONSIntruder Detection and Preventing Alert Fatigue: LiDAR’s true strength in security applications rests
in intruder detection. In the event the system detects a human intruder, an unidentified terrestrial vehicle,
or even an encroaching Unmanned Aerial Vehicle (UAV), the system can assign a unique identification
label to that intruder/vehicle and continuously track its trajectory and position regardless of most
disruptive environmental or lightning effects. LiDAR’s reliability can also prevent false alerts and, by extension,
alert fatigue for security personnel.
Critical Infrastructure Perimeter Defense: Critical infrastructure is of the utmost priority for governments
worldwide. LiDAR sensors can be used in critical applications, such as data centers, energy, water and utilities,
nuclear facilities, and oil & gas, among many others, to provide enhanced perimeter defense with a much
lower Total Cost of Ownership (TCO) compared to standard cameras. The implementation of far fewer LiDAR
sensors can achieve a highly sophisticated and reliable perimeter defense, which can also provide a host of
additional benefits by synergizing with existing Video Management Systems (VMSs) or any other protocol
deemed necessary for that specific implementation. Note that LiDAR and other motion sensors can be quite
versatile in their installations and can also be part of the hardware kit of Collaborative Robotics (cobots) and
patrolling UAVs.
Kickstarting Security Operations: The system will be able to pinpoint the location of any disturbance
and proceed to kickstart the security infrastructure, initiating existing perimeter defense security protocols
with LiDAR being the first vital link of the security chain. In the case of a human intruder, for example, the
unique ID label assigned to that particular person by the LiDAR system can activate surveillance cameras to
focus on and follow them along their path, assess the severity of the situation based on computer vision and
behavioral AI models, force physical access control restrictions along their way, regulate the use of smart
lightning, and initiate the activation of defense drones to monitor the intruders from above.
Case Studies: � Quanergy implements LiDAR security automation to critical infrastructure, power stations,
and oil & gas.
� Quanergy implements LiDAR security across critical national entry points in South Korea.
� Knightscope and Velodyne develop LiDAR-powered security robotics geared toward intruder detection and deterrence.
� Athena partners with Quanergy to provide LiDAR security to the Indian market in critical infrastructure, electric substations, manufacturing, and oil & gas.
https://quanergy.com/casestudy/full-automation-of-the-shandong-port-using-quanergys-lidar-solutions/

15DEMYSTIFYING LIDAR: IOT AND AUTOMOTIVE APPLICATIONS, INDUSTRIES, AND BUSINESS MODELSwww.abiresearch.com
� Quanergy Qortex 3D perception software is integrated with Genetec and Milestone VMSs.
� Genetec provides LiDAR security monitoring to OPTEX’s manufacturing facilities.
� Genetec’s LiDAR and Security Center operations are implemented at Manitoba Hydro in Canada.
DATA PRIVACY, INDOOR CROWD MONITORING, AND SAFETYIndoor and Outdoor Crowd Monitoring: Crowd monitoring and flow management are two crucial
LiDAR applications in many markets, including border control (especially in airports and land borders), stadia
and public events, retail, entertainment, and casinos. This concerns not only use cases aimed at optimizing
user/passenger experience or line management, but also security, public safety, and well-being applications.
Thus, another prominent application of LiDAR in the post COVID-19 era entails the use of the technology as
part of infectious control and social distancing protocols.
Adherence to Data Security and Privacy-Related Legislation: LiDAR sensors can be used both in indoor
and outdoor spaces for most standard protocols related to: social distancing, line management, people
counting, and crowd analytics (constancy, dynamics, volatility, etc.). This versatility can be invaluable for crowd
monitoring, complementing existing security and personal safety options for all indoor events. However,
companies are expected to conform to an ever-increasing list of data privacy options in order to protect
any PII captured with the use of traditional cameras. However, implementers will have a much easier task
tackling data privacy when implementing LiDAR solutions indoors. This is because no biometric information
is captured whatsoever; greatly expediting safety protocols without sacrificing speed or security, and greatly
decreasing operational expenses and dependence on data filtering, anonymization, storage, and deletion,
assisting companies with adhering to regulatory measures and legislation.
Case Studies: � Velodyne provides data protection and privacy for LiDAR technologies in security applications.
� Genetec employs LiDAR sensors, data protection, and security optimization to the Santa Cruz Beach Boardwalk.
BENEFITS AND UNIQUE SELLING PROPOSITIONS � Reduced False Alarms: Can accurately identify object size, velocity, and trajectory. Greatly resistant
to lightning, weather, and atmospheric effects that might render standard camera surveillance utterly blind and incapable of any intelligent analytics. This, in turn, reduces costly false alarms, making the system significantly more secure.
� TCO and ROI over Time: Fewer LiDAR sensors required compared to standard cameras for the same coverage area with a greater FOV and decreased maintenance costs and TCO over time; popularity forces LiDAR hardware to fall in price, with increased ROI based on future trajectory and use case versatility. The ROI is further enhanced by the reduction in false alarms, because fewer resources and/or “truck rolls” are required to verify the actual presence of intruders, which is especially costly in remote and hard to access locations.
� Anti-Spoof: In cybersecurity, a system is as strong as its weakest link. Like cameras, LiDAR sensors can be hacked either in close proximity or remotely in various use case scenarios, ranging from access control to industrial and automotive. First, compared to cameras, LiDAR is a lot more challenging to spoof and force a non-existent obstacle or cloak another object/person in close proximity. Secondly, attempting a remote hack will come in conflict with existing ML models, which, depending on their sophistication, can learn to detect, ignore, or at least acknowledge the presence of unusual artifacts.

16DEMYSTIFYING LIDAR: IOT AND AUTOMOTIVE APPLICATIONS, INDUSTRIES, AND BUSINESS MODELSwww.abiresearch.com
� 3D Visualization: Offers 3D images through point cloud versus 2D from traditional cameras.
� Real-Time Analytics: Offers real-time data visualization and analytics, does not require post-event resource drain for security forensics analysis as standard camera footage. Note that surveillance cameras can also support real-time analytics at edge processing, but with a much higher drain of computing power and Graphics Processing Unit (GPU) requirements compared to LiDAR.
� Efficiency and Reliability: Does not require the computing power or software/ML requirements of computer vision.
� Privacy Controls: Much easier for implementers to adhere to data protection legislation because no biometric technologies are required and no PII is gathered or stored whatsoever.
Table 6: LiDAR Capabilities Scoring for Security Use Cases(Source: ABI Research)
BUSINESS MODEL ANALYSISLiDAR, Traditional Cameras, and Closed-Circuit Television (CCTV): Traditional CCTV operations and
cameras make use of standard 2D models and are highly dependent on AI/ML algorithms and processing
power (as well as multiple device installations) to provide real-time, 3D visualizations. In turn, the reliability
of the analytics output is inherently tied to the complexity of said AI/ML algorithms in order to reliably
convert standard images into a more sophisticated visualization and object tracking application. Not to
mention, standard surveillance cameras are prone to lightning and weather effects that can bring any
intelligence gathering processes to a grinding halt.
On the other hand, LiDAR offers a few unique value propositions. It is highly resistant to environmental
conditions, allows for visualization versatility using 3D point cloud, can streamline monitoring capacity and
increase scalability with a lower TCO on hardware devices (as well as software and computing power), and
offers implementers customization and modular software/algorithm offerings, especially when optimized
with sensor fusion and as part of a greater security agenda.
USE CASES\FEATURES RELIABILITY & ROBUSTNESS RANGE FIELD OF VIEW
(FOV)3D CLASSIFICATION
ACCURACY REDUNDANCY PRIVACY PRESERVATION
Intruder detection and physical perimeter defense H H H M M H
Access control and security for authorized personnel H M M H M M
Physical security synergy and orchestration H M/H H H M M
Human recognition and object/vehicle classification M M/H M H L L
Outdoor surveillance and outdoor social distancing protocols H H H H L H
Indoor surveillance and indoor social distancing protocols L/M H H H L H
Border control and public safety L M H M L M

17DEMYSTIFYING LIDAR: IOT AND AUTOMOTIVE APPLICATIONS, INDUSTRIES, AND BUSINESS MODELSwww.abiresearch.com
Application-Specific Contingencies: There are two features related to LiDAR visualization that
implementers should keep in mind: 1) the inability to use biometrics features, such as face recognition;
and 2) detecting the use of protective masks and face coverings. For starters, while both features can be
applied through standard camera practices, it is imperative to note that the use of biometrics in non-critical
applications is often used as a post-event analytics tool, rather than in real time. This is because real-time
face recognition requires a much higher investment (e.g., database management, data access and security,
software, and ML tools).
Additionally, face recognition has little to no practical use during the actual intrusion instance, unless
the implementer is specifically attempting to identify blacklisted individuals. While LiDAR by itself lacks
the capacity to identify specific individuals, it can track down intruders with greater ease and, perhaps as
importantly, do so with a much lower over TCO over time. If needed, LiDAR security services can support a
sensor fusion approach with face recognition cameras to enable a state-of-the-art intrusion detection system,
but with a much higher TCO and data security and analytics requirements.
Further, the use of biometrics, cameras, and machine vision is not always the optimal choice because
certain application-specific contingencies must be in place related to sensor reliability, sensing capacity,
resistance to visual artifacts, and, most important of all, LiDAR’s lack of face recognition, which is rated
a lot higher when it comes to user privacy and data protection. LiDAR and biometrics need to be treated
as complementary technologies, rather than adversarial ones because they both synergize to provide
state-of-the-art security options.
SECURITY MARKET OPPORTUNITYThere is a tremendous amount of variability, fluctuation, and versatility in the overarching security
market and four key categories examined in this study pertain to intruder prevention and perimeter
defense, surveillance, and access control. The sub-market categories include: 1) border control, which
includes airports, sea ports (passenger and cargo), and land borders; 2) commercial buildings; 3)
commercial warehouses; and 4) critical infrastructure, which includes hyperscaler data centers, energy
power plants, water utilities, and electric substations. LiDAR sensing technologies present three
emerging opportunities for the applications under these markets: 1) sharpening the sensing capacity
and technological sophistication; 2) combatting mounting perimeter security concerns; and 3) addressing
the growing need for replacement of legacy equipment.

18DEMYSTIFYING LIDAR: IOT AND AUTOMOTIVE APPLICATIONS, INDUSTRIES, AND BUSINESS MODELSwww.abiresearch.com
Chart 4: LiDAR Sensors Installed Base in the Total Security Market World Markets: 2020 to 2030(Source: ABI Research)
By the end of 2021, the total installed base of LiDAR in the security market is expected to stand at
124,000 sensors. By 2030, LiDAR sensors installed base for the aforementioned studied markets is
expected to reach an impressive 3.4 million. The largest opportunity identified is critical infrastructure and
energy, which, in total, is expected to amass the lion’s share at approximately 2.6 million installed base or
74.8% of the total market for 2030. This is followed by commercial warehouses and buildings at 0.5 million
and 0.3 million sensors, respectively, and finally by border control at 53,000 sensors for the same year.
Critical infrastructure and energy is broken down to 1.88 million sensors in water utilities and electric
substations, 0.13 million sensors in data centers, and 0.59 million sensors in energy generation facilities
(which includes nuclear, hydroelectric, oil & gas, photovoltaic, and coal power plants). While high-tier facilities
like nuclear power plants are expected to hold the highest penetration rate of LiDAR technologies, it is the
sheer number of facilities like hydroelectric power plants that have the potential to really drive the market
forward when it comes to perimeter defense and intruder detection.
Chart 5: LiDAR Sensors Installed Base in the Energy Generation Market World Markets: 2020 to 030(Source: ABI Research)
0.0
0.5
1.0
1.5
2.0
2.5
3.0
2020 2021 2022 2023 2024 2025 2026 2027 2028 2029 2030
(Milli
ons)
Border Control Commercial Buildings Commercial Warehouses Critical Infrastructure
0.00
0.05
0.10
0.15
0.20
0.25
0.30
0.35
0.40
2020 2021 2022 2023 2024 2025 2026 2027 2028 2029 2030
(Milli
ons)
Coal Power PlantsHigh Capacity Hydroelectric Power Plants
Oil and Gas Rigs
High Capacity Photovoltaic Power Plants
Nuclear Power Plants

19DEMYSTIFYING LIDAR: IOT AND AUTOMOTIVE APPLICATIONS, INDUSTRIES, AND BUSINESS MODELSwww.abiresearch.com
The penetration rate is boosted by additional budget allocation toward physical perimeter defense
initiatives as implementers become more cognizant of increased security threats that can originate
on-premises. Additionally, LiDAR adoption rates will also satisfy certain key prerequisite items on the
cybersecurity agenda for many organizations, as well as address the mounting concern about sabotage and
espionage operations in critical infrastructure locations. Table 7 lists the total number of assets for the key
security categories in critical infrastructure, water and energy.
Table 7: Total Facilities - Critical Infrastructure, Water, and Energy World Markets: 2021(Source: ABI Research)
CRITICAL INFRASTRUCTURE (ACTUAL) 2021
Hyperscaler Data Centers (Actual) 627
Water Utilities and Electrical Substations (Actual) 133,320
Oil and Gas Rigs (Actual) 1,237
High-Capacity Hydroelectric Power Plants (Actual) 9,469
Coal Power Plants (Actual) 2,151
Nuclear Power Plants (Actual) 461
High-Capacity Photovoltaic Power Plants (Actual) 1,313
Total (Actual) 148,578
Other key categories include prisons, amounting to 20,187 actual facilities (2021).
LIDAR FOR INDUSTRIAL AUTOMATIONWhile LiDAR has accrued interest from its enablement of driverless passenger vehicles, the more
immediate market opportunity for sensor-driven automation rests in the industrial material handling
market. Well over a million industrial vehicles are sold to be used in factories, yards, and ports every year.
Hit by labor challengers and the need to improve productivity, end users are looking to major vendors
to automate forklifts, pallet stackers, towers, tuggers, and a whole range of vehicles. While such solutions
previously functioned through physical infrastructure like magnetic tape or externally placed fiducial markers,
onboard LiDAR and sensor fusion is quickly becoming the standard by which autonomous vehicles map out
the environment, localize themselves within it, and navigate.
With the growing adoption of 3D LiDAR, robotic systems can also perceive their environment with a far
higher degree of fidelity and technical redundancy than would be possible with just vision. This is opening up
a market for mobile robots outside of structured environments.

20DEMYSTIFYING LIDAR: IOT AND AUTOMOTIVE APPLICATIONS, INDUSTRIES, AND BUSINESS MODELSwww.abiresearch.com
OVERVIEW OF LIDAR USE CASES FOR INDUSTRIAL ROBOTICS LiDAR use cases for industrial robotics can be categorized according to various criteria:
� 2D LiDAR for safety and obstacle detection in mobile robotics
� 2D LiDAR for stationary robotics
� 3D LiDAR for unstructured environments
2D OBSTACLE DETECTION 2D LiDAR is already widespread in the mobile robotics space. This was mainstreamed through autonomous
vacuums in the consumer space, but has also taken off in the industrial material handling market. When
generating 2D maps in the setup phase, LiDAR scans allow a robot to map out to a high degree of precision.
They also are preferable to visual systems for detecting obstacles precisely at intermediate ranges without
any lighting condition constraints. Therefore, for structured environments, they provide the requisite level of
technical redundancy.
2D LiDAR, combined with the perception capabilities of vision and other integral sensors, is used for
Simultaneous Localization and Mapping (SLAM) in modern day Autonomous Mobile Robots (AMRs).
While cameras are important for developing perception and generating a data-rich understanding of the
environment, they suffer from motion blur, poor accuracy, difficulties due to environmental factors like dust
or light, and can be hamstrung by low processing speeds with expensive onboard computing architectures.
Therefore, the vast majority of mobile robots not relying on external infrastructure deploy 2D LiDAR.
LIDAR FOR STATIONARY ROBOTICSWhile LiDAR is generally associated with mobile robotics, it can also be deployed on stationary arms or
on workstations to ensure safety. For example, collaborative robotic arms can operate at varying speeds
depending on whether a person is in the immediate vicinity. Faster speeds enable faster throughput and
performance, while slower speeds enable a low profile and the ability to work with humans without the need
for expensive fencing.
3D LIDAR FOR UNSTRUCTURED ENVIRONMENTSWhile 2D LiDAR and vision-centered sensor fusion is important, it is still limited by the following:
� Environment: Generally, only operates with a high level of redundancy in structured indoor environments. Cannot be applied to outdoor or rugged environments. 3D LiDAR can generate high-detail mappings of the environment in light-deficient conditions and be combined with data from vision systems. This can enable use cases involving indoor/outdoor transitions, operations in rugged or challenging environments, and greater rerouting capability for heavy vehicles. This can be evidenced by autonomous stacker developer Seegrid. Previously defined as a purely vision-based navigation solution, it acquired a small developer named Box Robotics in 2020 for the explicit purpose of integrating 3D LiDAR into its upcoming solutions.
� Rerouting and Mobility: Some AMRs (generally much smaller systems) can use 2D LIDAR to dynamically reroute in the case of traffic and obstacles, such as Fetch or MiR. But larger systems like automated pallet stackers and forklifts need a much higher degree of accuracy to reroute, due to their heavy payload and reduced margin of error. 3D LiDAR-enabled mapping and obstacle detection are critical to path-planning for safety critical systems. This is evidenced by the growing use of 3D LiDAR by industry leaders, such as Vecna Robotics and Waypoint Robotics.

21DEMYSTIFYING LIDAR: IOT AND AUTOMOTIVE APPLICATIONS, INDUSTRIES, AND BUSINESS MODELSwww.abiresearch.com
MAPPING LIDAR While the modern robot will require some level of sensor fusion, modern LiDAR scores highly on key
criteria, especially when it comes to enabling SLAM. Below is a list of key SLAM criteria and a breakdown of the
performances of various sensor categories.
� Cost: Total retail price of a single sensor of that technology.
� Accuracy: Capacity for correctly resolving two points next to each other in space.
� Range: The distance from the sensor at which a feature can be detected.
� Penetration: Capacity for a sensor to detect features and objects that are not within direct line-of-sight. This could mean that the sensor picks up reflected signals from regions not directly in front of it, or that the sensor is capable of resolving objects behind layers of visually opaque objects (e.g., a wall or dense foliage).
LiDAR provides capabilities across various criteria, including the best accuracy available. This makes it the
critical sensor for providing technical redundancy to mobile robotic systems.
BUSINESS MODEL FOR 3D LIDAR IN INDUSTRIAL AUTOMATIONThere are a number of key industries where LiDAR will be a critical enabler to mobile automation:
� Industrial Environments: 3D LiDAR is critical for developing onboard capability for indoor/outdoor transitions and will enable greater rerouting capability for heavier systems.
� Ports: A key industrial category with limited automation. Bulk terminals deal with both liquid bulk (e.g., liquified natural gas) and dry bulk (e.g., coal). For grab buckets to effectively grasp the inventory, there needs to be intelligence on the parameters of the bulk and the likely safe area of operation. 3D LiDAR can provide a dense point cloud that maps out the safe area, improves the efficacy of crane-operated grab buckets, and reduces safety hazards. At the same time, 3D LiDAR is becoming a critical component for the automated forklifts that are used for material handling within the port’s operations.
� Mines: Robots are increasingly used for mapping out the internal routes of mines. For this, robots equipped with 3D LiDAR are deployed to give a highly accurate 3D digital map of the mine. This use case is also being applied to industrial sites like ports or chemical plants. 3D LiDAR is also being deployed on equipment to help improve worker safety by providing anti-collision warnings.
� Sidewalks: While robot taxis have some way to go before commercialization, the smaller robots tasked with delivering small parcels and groceries in pre-defined localities are becoming much more common. While many of the smaller systems use vision and Global Positioning System (GPS) only, this significantly limits their speed and payload. Given the inevitable problems of GPS for localization in dense urban and suburban environments, only 3D LiDAR provides the technical redundancy for these systems to scale up effectively. ABI Research projects that up to 1 million robot delivery vehicles could be deployed by 2030.
ROBOTICS MARKET OPPORTUNITY The scale of the mobile robot space is expanding greatly in the aftermath of COVID-19. This is due to:
� Consolidation and Commercialization of AMR Technology: Companies like ASTI Mobile Robotics, Fetch Robotics, and MiR are being acquired by larger ecosystem vendors like ABB, Zebra, and Teradyne. What is more, the proliferation and 2D LIDAR has made barriers to entry much lower.
� Need for Productivity Improvements and Labor Shortages: As companies look reshore elements of the supply chain to higher-wage jurisdictions, there is a need to mitigate labor shortages and increase productivity so that such investments make sense. This has led to a huge amount of funding for industrial automation solutions. In 2021, ABI Research expects the global industry to increase revenue by 44% to more than US$30 billion.

22DEMYSTIFYING LIDAR: IOT AND AUTOMOTIVE APPLICATIONS, INDUSTRIES, AND BUSINESS MODELSwww.abiresearch.com
Table 8 shows the number of significant industrial sites per category, indicating the scale of the opportunity
for industrial robotics deployments.
Table 8: Number of Sites per Industrial Category(Source: ABI Research)
INDUSTRIAL CATEGORIES NUMBER OF SITES (2021)
Cargo ports 152
Warehouses 145,000
Manufacturing plants (>100 employees) 500,000
Total 645,152
Chart 6 shows the enormous growth in the mobile robot installed base across all markets from 2020 to 2030.
The AMR market installed base will increase from 14000 in 2020 to 9.7 million in 2030. From 2020 to 2030,
US$454 billion will be spent on AMRs globally.
Chart 6: AMR Installed Base World Markets: 2020 to 2030(Source: ABI Research)
A great majority of this installed base will be using some form of LiDAR sensor. Beyond the total growth,
there is a large expansion in robots used in outdoor environments. Some are field environments like mines,
industrial plants, ports, and farmland. Here, robots need a high level of technical redundancy and assistive
perception. More than 1.2 million systems will be operating in this space by 2030. Another 1.2 million will be
operating in outdoor public environments like cities. In almost all these instances, 3D LiDAR will become a
default component of the overarching sensor modalities for robotic fleets. This growth in robotics portends
very well for developers of 2D and 3D LiDAR solutions. Based on ABI Research’s projections, the installed base
for LiDAR in all commercial and industrial robotics applications increase from 83,000 sensors in 2020 to 9.8
million in 2030 with the share of 3D LIDAR sensors reaching 47% by 2030.
0
2
4
6
8
10
12
2020 2021 2022 2023 2024 2025 2026 2027 2028 2029 2030
(Milli
ons)

23DEMYSTIFYING LIDAR: IOT AND AUTOMOTIVE APPLICATIONS, INDUSTRIES, AND BUSINESS MODELSwww.abiresearch.com
Chart 7: Total LiDAR Installed Base with 3D LiDAR Percentage World Markets: 2020 to 2030(Source: ABI Research)
LIDAR IN AUTOMOTIVE REDUNDANCY IN HIGHLY AUTONOMOUS VEHICLE APPLICATIONSIn the automotive market, LiDAR has been positioned as a sensor to support robust perception in highly
autonomous vehicle applications, particularly unsupervised autonomous driving applications that mandate
a greater level of redundancy in the perception stack. These applications have yet to materialize at scale in
the automotive market; however, almost every prototype or proof-of-concept for unsupervised autonomous
driving features a LiDAR sensor in the perception stack.
The value of LiDAR’s contribution to the autonomous vehicle perception stack can be best seen in how the
sensor modality’s characteristics contrast and complement the status quo of sensor fusion today—camera
and radar sensors.
LiDAR is an active ranging sensor, leveraging laser light illumination to determine distances by measuring
the return time or wavelength of the reflection. This provides a method of determining distances that
is orthogonal to the “structure-from-motion” techniques of cameras, and which continues to perform in
poor lighting and inclement weather scenarios when cameras tend to struggle. Most LiDAR sensors slated
for production in the next 3 to 5 years operate in the 100 Meter (m) to 200 m range, beyond the maximum
range of many of today’s Advanced Driver-Assistance Systems (ADAS) cameras.
Radar is also a ranging sensor like LiDAR. However, most automotive radar configurations deliver very
poor resolution, both in the horizontal (azimuth) and vertical (elevation) dimensions. This means that
while radar can detect the range and velocity of objects, it delivers no semantic insight into the road
situation. In contrast, LiDAR sensors can achieve very high levels of angular resolution, well below 0.1°,
allowing for obstacle identification and semantic segmentation.
10%
15%
20%
25%
30%
35%
40%
45%
50%
0
2
4
6
8
10
12
2020 2021 2022 2023 2024 2025 2026 2027 2028 2029 2030
(Milli
ons)
Total LiDAR Installed Base (2D + 3D) Share of 3D LiDAR

24DEMYSTIFYING LIDAR: IOT AND AUTOMOTIVE APPLICATIONS, INDUSTRIES, AND BUSINESS MODELSwww.abiresearch.com
Figure 4: LiDAR as a Tertiary Sensor Modality(Source: ABI Research)
Therefore, LiDAR is ideally positioned as the perfect “third opinion” to complement the incumbent
camera-radar sensor fusion in the future, and unsupervised autonomous applications that require
greater redundancy. This applies to obstacle detection, collision avoidance, and navigation applications
within autonomous vehicles, as well as to the mapping use case, whether that is in the form of LiDAR
sensors equipped for dedicated mapping vehicles or the crowdsourcing of LiDAR sensor data from
vehicles deployed in the field.
AUTOMOTIVE USE CASESTable 9: LiDAR Capabilities Scoring for Automotive Use Cases and Applications(Source: ABI Research)
AUTOMOTIVE LIDAR TECHNOLOGY EVOLUTION LiDAR sensors combine range detection with scanning in order to determine elevation and azimuth,
building a 3D understanding of the scene. In the early years of autonomous vehicle development, the
automotive industry used the same mechanical rotating mirror scanning technology that had been
successfully deployed in other applications, such as mapping and surveying. However, this scanning
CAMERA / RADAR / LiDAR SENSOR FUSIONResolution
Range
Velocity
Cost
Extreme Light
Poor Weather
RADAR CAMERA LiDAR
USE CASES\FEATURES RELIABILITY & ROBUSTNESS RANGE FIELD OF
VIEW3D CLASSIFICATION
ACCURACY REDUNDANCY PRIVACY PRESERVATION
Vehicle detection and ranging H H M H H N/A
Pedestrian detection and ranging M/H M/H M/H M/H H H
Road boundary detection H M M M/H H N/A
HD mapping H H H H H H
Semantic segmentation M M M M H H
Velocity determination M M M N/A M N/A
25DEMYSTIFYING LIDAR: IOT AND AUTOMOTIVE APPLICATIONS, INDUSTRIES, AND BUSINESS MODELSwww.abiresearch.com
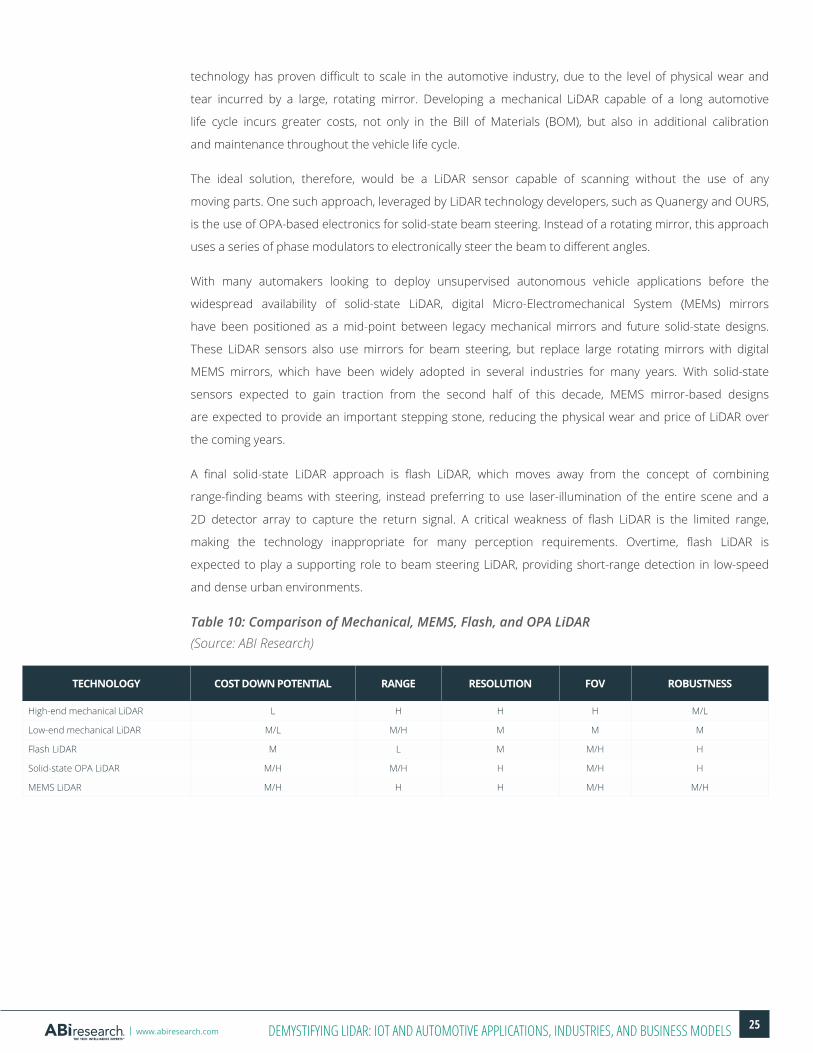
technology has proven difficult to scale in the automotive industry, due to the level of physical wear and
tear incurred by a large, rotating mirror. Developing a mechanical LiDAR capable of a long automotive
life cycle incurs greater costs, not only in the Bill of Materials (BOM), but also in additional calibration
and maintenance throughout the vehicle life cycle.
The ideal solution, therefore, would be a LiDAR sensor capable of scanning without the use of any
moving parts. One such approach, leveraged by LiDAR technology developers, such as Quanergy and OURS,
is the use of OPA-based electronics for solid-state beam steering. Instead of a rotating mirror, this approach
uses a series of phase modulators to electronically steer the beam to different angles.
With many automakers looking to deploy unsupervised autonomous vehicle applications before the
widespread availability of solid-state LiDAR, digital Micro-Electromechanical System (MEMs) mirrors
have been positioned as a mid-point between legacy mechanical mirrors and future solid-state designs.
These LiDAR sensors also use mirrors for beam steering, but replace large rotating mirrors with digital
MEMS mirrors, which have been widely adopted in several industries for many years. With solid-state
sensors expected to gain traction from the second half of this decade, MEMS mirror-based designs
are expected to provide an important stepping stone, reducing the physical wear and price of LiDAR over
the coming years.
A final solid-state LiDAR approach is flash LiDAR, which moves away from the concept of combining
range-finding beams with steering, instead preferring to use laser-illumination of the entire scene and a
2D detector array to capture the return signal. A critical weakness of flash LiDAR is the limited range,
making the technology inappropriate for many perception requirements. Overtime, flash LiDAR is
expected to play a supporting role to beam steering LiDAR, providing short-range detection in low-speed
and dense urban environments.
Table 10: Comparison of Mechanical, MEMS, Flash, and OPA LiDAR(Source: ABI Research)
TECHNOLOGY COST DOWN POTENTIAL RANGE RESOLUTION FOV ROBUSTNESS
High-end mechanical LiDAR L H H H M/L
Low-end mechanical LiDAR M/L M/H M M M
Flash LiDAR M L M M/H H
Solid-state OPA LiDAR M/H M/H H M/H H
MEMS LiDAR M/H H H M/H M/H
26DEMYSTIFYING LIDAR: IOT AND AUTOMOTIVE APPLICATIONS, INDUSTRIES, AND BUSINESS MODELSwww.abiresearch.com
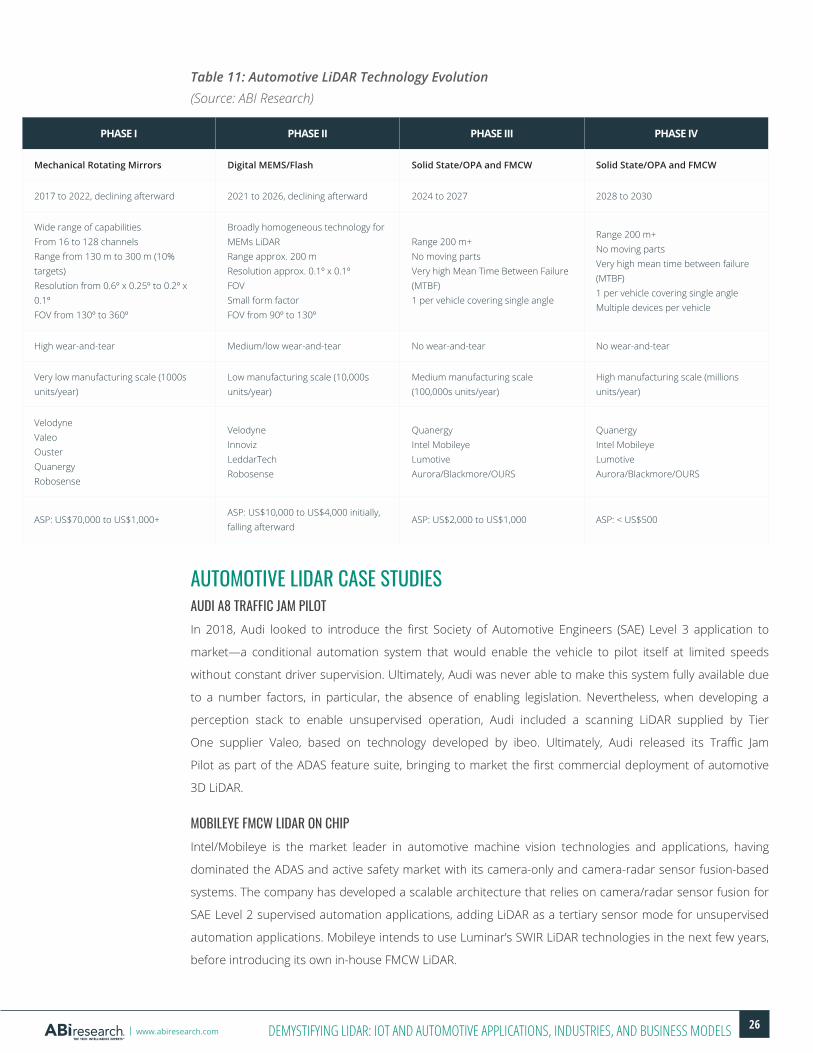
Table 11: Automotive LiDAR Technology Evolution(Source: ABI Research)
AUTOMOTIVE LIDAR CASE STUDIESAUDI A8 TRAFFIC JAM PILOTIn 2018, Audi looked to introduce the first Society of Automotive Engineers (SAE) Level 3 application to
market—a conditional automation system that would enable the vehicle to pilot itself at limited speeds
without constant driver supervision. Ultimately, Audi was never able to make this system fully available due
to a number factors, in particular, the absence of enabling legislation. Nevertheless, when developing a
perception stack to enable unsupervised operation, Audi included a scanning LiDAR supplied by Tier
One supplier Valeo, based on technology developed by ibeo. Ultimately, Audi released its Traffic Jam
Pilot as part of the ADAS feature suite, bringing to market the first commercial deployment of automotive
3D LiDAR.
MOBILEYE FMCW LIDAR ON CHIPIntel/Mobileye is the market leader in automotive machine vision technologies and applications, having
dominated the ADAS and active safety market with its camera-only and camera-radar sensor fusion-based
systems. The company has developed a scalable architecture that relies on camera/radar sensor fusion for
SAE Level 2 supervised automation applications, adding LiDAR as a tertiary sensor mode for unsupervised
automation applications. Mobileye intends to use Luminar’s SWIR LiDAR technologies in the next few years,
before introducing its own in-house FMCW LiDAR.
PHASE I PHASE II PHASE III PHASE IV
Mechanical Rotating Mirrors Digital MEMS/Flash Solid State/OPA and FMCW Solid State/OPA and FMCW
2017 to 2022, declining afterward 2021 to 2026, declining afterward 2024 to 2027 2028 to 2030
Wide range of capabilitiesFrom 16 to 128 channelsRange from 130 m to 300 m (10% targets)Resolution from 0.6º x 0.25º to 0.2º x 0.1ºFOV from 130º to 360º
Broadly homogeneous technology for MEMs LiDARRange approx. 200 mResolution approx. 0.1º x 0.1ºFOV Small form factorFOV from 90º to 130º
Range 200 m+No moving partsVery high Mean Time Between Failure (MTBF)1 per vehicle covering single angle
Range 200 m+No moving partsVery high mean time between failure (MTBF)1 per vehicle covering single angleMultiple devices per vehicle
High wear-and-tear Medium/low wear-and-tear No wear-and-tear No wear-and-tear
Very low manufacturing scale (1000s units/year)
Low manufacturing scale (10,000s units/year)
Medium manufacturing scale (100,000s units/year)
High manufacturing scale (millions units/year)
VelodyneValeoOusterQuanergyRobosense
VelodyneInnovizLeddarTechRobosense
QuanergyIntel MobileyeLumotiveAurora/Blackmore/OURS
QuanergyIntel MobileyeLumotiveAurora/Blackmore/OURS
ASP: US$70,000 to US$1,000+ASP: US$10,000 to US$4,000 initially, falling afterward
ASP: US$2,000 to US$1,000 ASP: < US$500

27DEMYSTIFYING LIDAR: IOT AND AUTOMOTIVE APPLICATIONS, INDUSTRIES, AND BUSINESS MODELSwww.abiresearch.com
INNOVIZ/BMWIn 2018, BMW announced that it would be sourcing a LiDAR from startup Innoviz to feature in the perception
stack of its autonomous vehicle, originally slated to be introduced to market in 2021, which has since been
delayed to 2023.
VOLVO/LUMINARIn May 2020, Volvo announced that its SPA 2 modular autonomous vehicle architecture would feature a
LiDAR sensor sourced from Luminar to enable its unsupervised Highway Autopilot application.
QUANERGY In July 2021, Quanergy, in collaboration with ZEV, demonstrated the first OPA-based solid-state sensor
at a 100 m range for 10% reflectivity of dark objects in full sunlight. It followed in October 21 by
demonstrating a multi-beam sensor operating at 130 m, in collaboration with the Robotics Department
of Santa Clara University’s Engineering School.
AUTOMOTIVE BUSINESS MODEL ANALYSISThe market potential for LiDAR is tied to the market opportunity for unsupervised autonomous driving,
which, in turn, has two parallel paths to market: robotaxis and autonomous passenger vehicles.
TRADITIONAL AUTOMOTIVE/PASSENGER VEHICLEThe automotive industry is defined by a highly concentrated ecosystem, featuring a limited number of
OEMs, typically with a global footprint, which, in turn, rely on a limited number of Tier One integrators,
and Tier Two component suppliers. The barriers of entry to the automotive market have historically proved
near-insurmountable, resulting in a largely static, or even a declining number of automotive brands for
consumers to choose from. While the electrification trend has allowed some new Electric Vehicle (EV)
brands to break into the mainstream in recent years, the overall cost pressures of meeting the challenges of
connected, automated, and electrified vehicles is driving consolidation among existing automotive brands.
Examples of this consolidation trend include the recent formation of Stellantis, a newly OEM formed by the
merger of PSA (Peugeot-Citroen) and FCA (Fiat-Chrysler).

28DEMYSTIFYING LIDAR: IOT AND AUTOMOTIVE APPLICATIONS, INDUSTRIES, AND BUSINESS MODELSwww.abiresearch.com
Chart 8: Automotive Sales Market Share by OEM 2019(Source: ABI Research)
In 2019, the top 10 OEMs accounted for 68% of the market as a whole. As a result, automotive OEMs
hold considerable monopsony power, with the ability of automakers to dictate prices to their suppliers
only expected to increase as the consolidation trend continues. This will have the effect of lowering the
margin that LiDAR suppliers can achieve in the automotive market. Furthermore, the software-defined
car trend is driving OEMs in the direction of hardware platformization, in which OEMs will operate a
minimal number of vehicle platforms, enabling differentiation between different models at the software
level. This means that each OEM will be unlikely to source LiDAR sensors from more than one or two
vendors at the most, further reducing the business scope for LiDAR technology developers in the
automotive space.
However, the automotive industry rarely accepts a single-point-of-failure in the supply chain by engaging
with a single technology supplier. Furthermore, OEMs in certain regions prefer to engage with local
sensor technology developers and suppliers, meaning that no single LiDAR supplier can expect to become
a monopolistic supplier of LiDAR sensors to the automotive market. As a result, ABI Research expects that
the dozens of LiDAR developers targeting the automotive industry today will eventually consolidate to a
handful of suppliers.
ROBOTAXISThe robotaxi opportunity is a new market that has yet to achieve any scale, but is being pushed forward by
both established automotive brands and new entrants to the personal mobility space. In the robotaxi market,
the driverless robotaxi serves as the enabling platform for a mobility service, in which the same vehicle will
serve multiple users over the course of a day. The ultimate ambition for robotaxi service operators will be
to provide as many trips as possible on as few robotaxis as possible. Therefore, while the density of LiDAR
sensors on robotaxis is expected to be higher (reflecting the high redundancy requirements), the volume of
robotaxis is expected to be much smaller than the typical automotive passenger vehicle sales volumes.
12%Volkswagen
11%Toyota
GM8%
8%Hyundai Group
6%HondaFord
6%5%
5%
Fiat Chrysler
Nissan
4%
3%
Peugeot Citroen
Daimler
32%Others

29DEMYSTIFYING LIDAR: IOT AND AUTOMOTIVE APPLICATIONS, INDUSTRIES, AND BUSINESS MODELSwww.abiresearch.com
AUTOMOTIVE MARKET OPPORTUNITYUnsupervised autonomous vehicles (SAE Level 3 – 5) are expected to begin gaining traction from 2025
onwards, with lower levels of automation expected to dominate through to the end of the decade.
Chart 9: Autonomous Vehicle Installed Base by SAE Level World Markets: 2020 to 2030(Source: ABI Research)
The market opportunity for LiDAR will remain subdued until after the earnest deployment of robotaxis and
Level 4 passenger models. In the meantime, small volumes of Time of Flight (ToF) Near Infrared (NIR) LiDAR
will provide redundancy to camera-radar sensor fusion in Level 3 deployments.
The share of LiDAR shipments using mechanical mirror scanning technology is expected to drop rapidly
following the introduction of digital MEMS mirror LiDAR. From 2025 onward, the introduction of solid-state
LiDAR will also reduce the market potential for mechanical LiDAR, before taking market share from digital
MEMS mirror LiDAR in the last years of the decade. From 2026, shipments of digital MEMS mirror LiDAR
systems will grow at a CAGR of 60%, while solid-state LiDAR shipments will outpace that, with a CAGR of
163% over the same period. By that point, the maturity of low-end mechanical LiDAR is expected to result
in a low Average Selling Price (ASP), making the technology attractive for SAE Level 3 applications in
cost-sensitive vehicle segments. Overall, however, mechanical LiDAR is expected to fall rapidly from over
70% of LiDAR shipments in 2024, to less than 6% by 2030. To put matters into perspective, Charts 10 and
11 show the evolution of the installed base of the various LiDAR types and the relative shares of shipments
of the various LiDAR technologies in automotive, respectively.
0
100
200
300
400
500
2020 2021 2022 2023 2024 2025 2026 2027 2028 2029 2030
(Milli
ons)
Level 2 Level 2+ Level 3 Level 4 Robotaxi

30DEMYSTIFYING LIDAR: IOT AND AUTOMOTIVE APPLICATIONS, INDUSTRIES, AND BUSINESS MODELSwww.abiresearch.com
Chart 10: Installed Base of Automotive LiDAR Sensors World Markets: 2020 to 2030(Source: ABI Research)
Chart 11: Relative Shares of Shipments of the Various LiDAR Technologies in Automotive World Markets: 2020 to 2030(Source: ABI Research)
SUMMARY AND CONCLUSIONSIt is now increasingly becoming clear that LiDAR offers features, benefits, and capabilities that are well
suited for a broader set of additional uses cases across multiple verticals. In particular, LiDAR’s accuracy,
long range, privacy preservation, redundancy, and robust operation in adverse conditions, makes it a
desirable and, in many cases, a must-have sensor to add to systems and solutions. High-profile
opportunities include traffic monitoring and management, people flow management at airports, and
other types of microcities, surveillance, intrusion detection, border control, and warehouse and supply
chain automation across the industrial, smart city, and security markets.
0%10%20%30%40%50%60%70%80%90%100%
0
1
2
3
4
5
6
7
8
2020 2021 2022 2023 2024 2025 2026 2027 2028 2029 2030
Share
of Li
DAR S
hipme
nts
Instal
led Ba
se (M
illion
s)
Mechanical MEMS and FLASH Solid State % Shipments Mechanical % Shipments MEMS, Flash and Solid State
0%
20%
40%
60%
80%
100%
2020 2021 2022 2023 2024 2025 2026 2027 2028 2029 2030
Mechanical MEMS/Flash Solid State

Published October 2021©2021 ABI Research
157 Columbus Ave, 4th FloorNew York, New York 10023 USA
Tel: +1 516-624-2500
www.abiresearch.com
www.abiresearch.com
About ABI Research
ABI Research is a global technology intelligence firm delivering actionable research and strategic guidance to technology leaders, innovators, and decision makers
around the world. Our research focuses on the transformative technologies that are dramatically reshaping industries, economies, and workforces today. ABI Research’s
global team of analysts publish groundbreaking studies often years ahead of other technology advisory firms, empowering our clients to stay ahead of their markets and
their competitors.
© 2021 ABI Research. Used by permission. ABI Research is an independent producer of market analysis and insight and this ABI Research product is the result of
objective research by ABI Research staff at the time of data collection. The opinions of ABI Research or its analysts on any subject are continually revised based on the most
current data available. The information contained herein has been obtained from sources believed to be reliable. ABI Research disclaims all warranties, express or implied,
with respect to this research, including any warranties of merchantability or fitness for a particular purpose.