Southern province demographic and population projections 2011 2035

Demographic Turning Points for the United States: Population Projections for 2020 to 2060 Population Estimates and Projections
By Jonathan Vespa, David M. Armstrong, and Lauren Medina
Current Population Reports
Issued March 2018
P25-1144
INTRODUCTION
The year 2030 marks a demographic turning point for the United States. Beginning that year, all baby boomers will be older than 65. This will expand the size of the older population so that one in every five Americans is projected to be retirement age (Fig-ure 1). Later that decade, by 2035, we project that older adults will outnumber children for the first time in U.S. history. The year 2030 marks another demographic first for the United States. Beginning that year, because of population aging, immigration is projected to overtake natural increase (the excess of births over deaths) as the primary driver of population growth for the country. As the population ages, the number of deaths is projected to rise sub-stantially, which will slow the coun-try’s natural growth. As a result, net international migration is projected to overtake natural increase, even as levels of migration are projected to remain relatively flat. These three demographic mile-stones are expected to make the 2030s a transforma-tive decade for the U.S. population.
Beyond 2030, the U.S. population is projected to grow slowly, to age considerably, and to become more racially and ethnically diverse. Despite slowing popula-tion growth, particularly after 2030, the U.S. population
is still expected to grow by 78 million people by 2060, crossing the 400-million threshold in 2058. This con-tinued growth sets the United States apart from other developed countries, whose populations are expected to barely increase or actually contract in coming decades. This report looks at these changes and sum-marizes results from the U.S. Census Bureau’s 2017 National Population Projections. It focuses on 2030 as a demographic turning point for the United States, but explores broader changes in the age, race, and ethnic composition of the population from 2020 to 2060.
Figure 1.Projections of the Older Adult Population: 2020 to 2060 By 2060, nearly one in four Americans is projected to be an older adult.
Source: U.S. Census Bureau, 2017 National Population Projections.
49.2
56.1
73.1
80.8
85.7
94.7
Millions of people 65 years and older Percent of population
15
17
21
22
22
232060
2050
2040
2030
2020
2016
2 U.S. Census Bureau
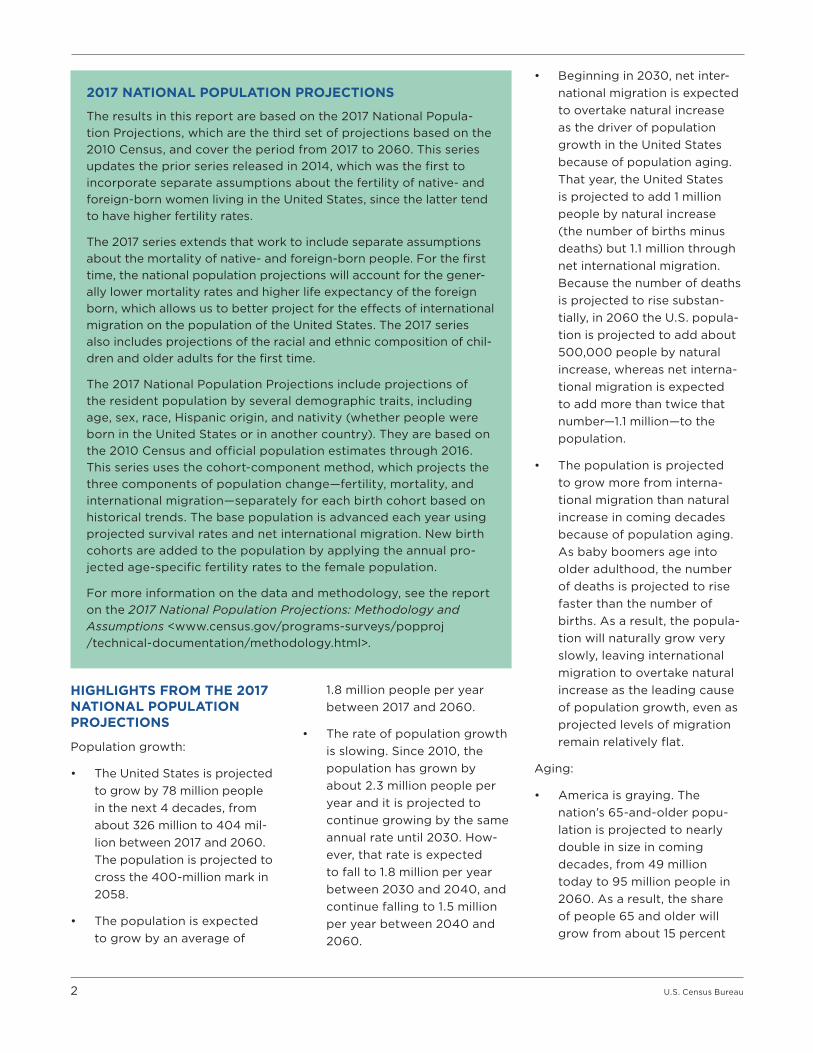
HIGHLIGHTS FROM THE 2017 NATIONAL POPULATION PROJECTIONS
Population growth:
• The United States is projected to grow by 78 million people in the next 4 decades, from about 326 million to 404 mil-lion between 2017 and 2060. The population is projected to cross the 400-million mark in 2058.
• The population is expected to grow by an average of
1.8 million people per year between 2017 and 2060.
• The rate of population growth is slowing. Since 2010, the population has grown by about 2.3 million people per year and it is projected to continue growing by the same annual rate until 2030. How-ever, that rate is expected to fall to 1.8 million per year between 2030 and 2040, and continue falling to 1.5 million per year between 2040 and 2060.
• Beginning in 2030, net inter-national migration is expected to overtake natural increase as the driver of population growth in the United States because of population aging. That year, the United States is projected to add 1 million people by natural increase (the number of births minus deaths) but 1.1 million through net international migration. Because the number of deaths is projected to rise substan-tially, in 2060 the U.S. popula-tion is projected to add about 500,000 people by natural increase, whereas net interna-tional migration is expected to add more than twice that number—1.1 million—to the population.
• The population is projected to grow more from interna-tional migration than natural increase in coming decades because of population aging. As baby boomers age into older adulthood, the number of deaths is projected to rise faster than the number of births. As a result, the popula-tion will naturally grow very slowly, leaving international migration to overtake natural increase as the leading cause of population growth, even as projected levels of migration remain relatively flat.
Aging:
• America is graying. The nation’s 65-and-older popu-lation is projected to nearly double in size in coming decades, from 49 million today to 95 million people in 2060. As a result, the share of people 65 and older will grow from about 15 percent
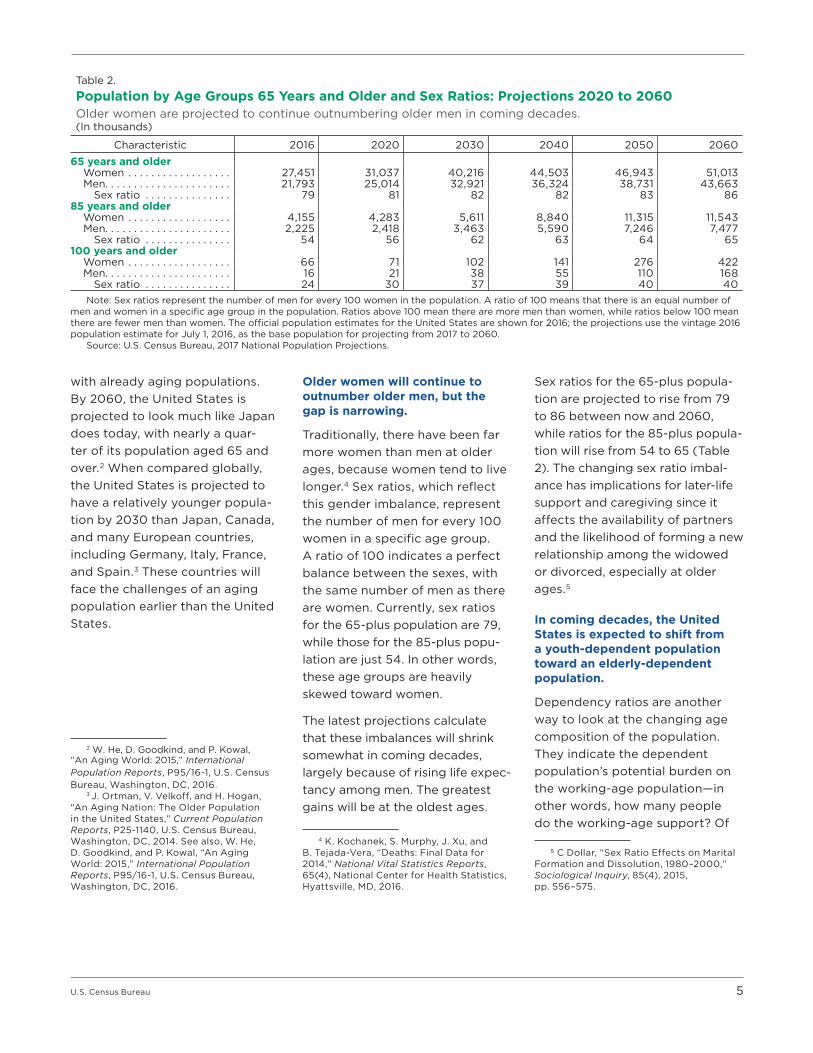
2017 NATIONAL POPULATION PROJECTIONS
The results in this report are based on the 2017 National Popula-tion Projections, which are the third set of projections based on the 2010 Census, and cover the period from 2017 to 2060. This series updates the prior series released in 2014, which was the first to incorporate separate assumptions about the fertility of native- and foreign-born women living in the United States, since the latter tend to have higher fertility rates.
The 2017 series extends that work to include separate assumptions about the mortality of native- and foreign-born people. For the first time, the national population projections will account for the gener-ally lower mortality rates and higher life expectancy of the foreign born, which allows us to better project for the effects of international migration on the population of the United States. The 2017 series also includes projections of the racial and ethnic composition of chil-dren and older adults for the first time.
The 2017 National Population Projections include projections of the resident population by several demographic traits, including age, sex, race, Hispanic origin, and nativity (whether people were born in the United States or in another country). They are based on the 2010 Census and official population estimates through 2016. This series uses the cohort-component method, which projects the three components of population change—fertility, mortality, and international migration—separately for each birth cohort based on historical trends. The base population is advanced each year using projected survival rates and net international migration. New birth cohorts are added to the population by applying the annual pro-jected age-specific fertility rates to the female population.
For more information on the data and methodology, see the report on the 2017 National Population Projections: Methodology and Assumptions <www.census.gov/programs-surveys/popproj /technical-documentation/methodology.html>.
U.S. Census Bureau 3
to 17 percent between 2017 and 2020. By 2060, older adults are projected to make up nearly one-quarter of the population.
• The number of people 85 years and older is expected to nearly double by 2035 (from 6.4 million to 11.8 million) and nearly triple by 2060 (to 19 million people).
Race and ethnicity:
• The non-Hispanic White population is projected to shrink over coming decades, from 199 million in 2020 to 179 million people in 2060—even as the U.S. population continues to grow. Their decline is driven by falling birth rates and rising number of deaths over time as the non-Hispanic White population ages. In comparison, the White population, regardless of Hispanic origin, is projected to grow from 253 million to 275 million over the same period.
• The population of people who are Two or More Races is projected to be the fastest-growing racial or ethnic group over the next several decades, followed by Asians and Hispanics. The causes of their growth are different, however. For Hispanics and people who are Two or More Races, high growth rates are largely the result of high rates of natural increase, given the relatively young age structure of these populations. For Asians, the driving force behind their growth is high net interna-tional migration.
HOW DO POPULATIONS GROW?
Components of Population Change
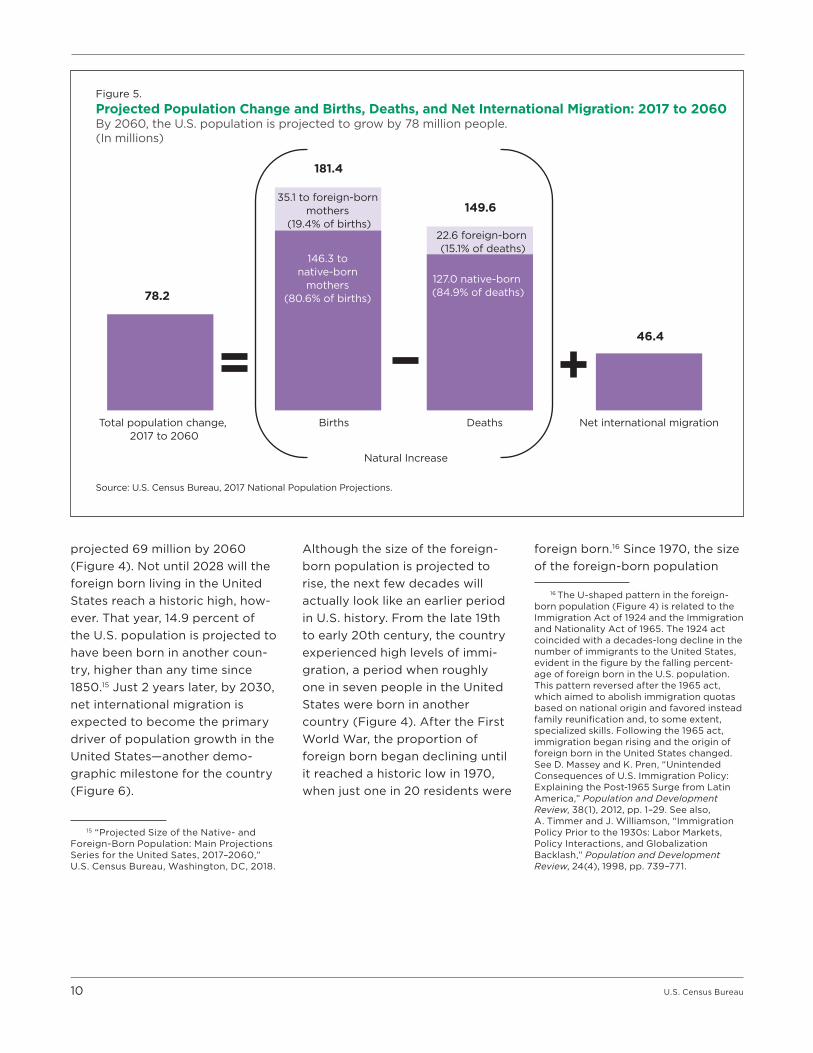
There are three demographic reasons why populations change: people are born, they die, and they move into or out of a coun-try.* Together, the number of births, deaths, and net international migrants make up the total population change over a period of time (Figure 5). Births add to the population while deaths take away from it. The combination of these two components is called natural increase (or sometimes natural decrease when deaths exceed births, which can cause a population to shrink). Migration, the third component, can either add to or subtract from a popula-tion depending if more people come into the country than leave it.
Between 2017 and 2060, the U.S. population is projected to grow by 78.2 million people. Where do these people come from? Over that period, we project a total of 181.4 million births, more than four times that of net international migration. However, these births are offset by a projected 149.6 million deaths, leaving a nat-ural increase of 31.8 million people. Adding this natural increase to the 46.4 million people from net international migration, we project a total growth of 78.2 million over the period from 2017 to 2060.
We project fertility and mortality rates separately for foreign-born residents, who tend to have higher fertility rates and lower mortal-ity rates than people born in the United States. Over the course of their life, foreign-born women have historically had slightly more children than native-born women (2.2 births compared with 1.9 births on average, respectively). Furthermore, birth rates are highest among foreign-born women who are not U.S. citizens (78 births per 1,000 women),** followed by those who are naturalized citizens (53 births per 1,000 women). Native women have lower birth rates in comparison (51 births per 1,000 women). Between 2017 and 2060, we project that 80.6 percent of all births will be to native mothers, while 19.4 percent of births will be to foreign-born mothers. Additionally, we project that 84.9 percent of all deaths in this period will be to native residents, while 15.1 percent of deaths will be to foreign-born residents. The foreign born typically have lower mortality rates and longer life expectancy than the native born, factors that affect the projected size and demographic com-position of the population.***
* Populations may change for other reasons besides demographic factors, through territorial growth and annexing lands, for example.
** L. Monte and R. Ellis, “Fertility of Women in the United States: June 2012,” Current Population Reports, P20-575, U.S. Census Bureau, Washington, DC, 2014.
*** I. Akresh and R. Frank, “Health Selection Among New Immigrants,” American Journal of Public Health, 98(11), 2008, pp. 2058–2064. See also, K. Markides and K. Eschbach, “Hispanic Paradox in Adult Mortality in the United States,” in R. Rogers and E. Crimmins, (eds), International Handbook of Adult Mortality, Springer, New York, 2011, pp. 227–240; and E. Arias, K. Eschbach, W. Schauman, E. Backlund, and P. Sorlie, “The Hispanic Mortality Advantage and Ethnic Misclassification on U.S. Death Certificates,” American Journal of Public Health, 100(S1), 2010, pp. S171–S177.

4 U.S. Census Bureau
The foreign born:
• The nation’s foreign-born pop-ulation is projected to rise from 44 million people today to 69 million in 2060, growing from about 14 percent to 17 percent of the population. The previous historic high was in 1890, when almost 15 percent of the popu-lation was foreign born.
• The native population is expected to add an aver-age of 1.3 million people per year, compared with 579,000 per year for the foreign-born population living in the United States.
Children:
• By 2020, fewer than one-half of children in the United States are projected to be non-Hispanic White (49.8 per-cent of the projected 73.9 mil-lion children under age 18). In comparison, about 72 percent of children are projected to be White, regardless of Hispanic origin.
• The share of children who are Two or More Races is projected to more than double in com-ing decades, from 5.3 percent today to 11.3 percent in 2060.1
• The racial and ethnic com-position of younger cohorts is expected to change more quickly than for older cohorts. In 2060, over one-third of children are expected to be non-Hispanic White com-pared with over one-half of older adults.
A GRAYING NATION
By 2030, one in five Americans will be 65 years and older.
America is graying. Today, some 49 million people are at least 65 years old, a number that will rise as America’s baby boomers age into older adulthood. The coun-try will reach that demographic milestone in 2030 when all boom-ers will be over the age of 65. That year, one in five Americans
1 For more information on race and ethnicity in the projections, see the text box “Foreseeing the Future? Assumptions About Population Projections.”
is projected to be an older adult (Figure 1). Baby boomers leave a significant imprint on the coun-try’s population. Between 2016 and 2060, the population under age 18 is projected to grow by only 6 million people, compared with a growth of 46 million for the population 65 years and over (Table 1). By 2035, the demo-graphic scales will tip further: older adults are expected to out-number children for the first time in U.S. history. The pattern should continue in coming decades so that by 2060 there will be 95 million older adults but 80 mil-lion children. The country will be grayer than ever before.
Aging boomers and rising life expectancy will increase the number of elderly as well. The population 85 years and older is expected to grow 200 percent by 2060, from 6 million to 19 million people (Table 1). The country will also add one-half million centenar-ians over the same period. These changes may be new for the United States, but the country will join many others around the world
Table 1.
Population by Age Group: Projections 2020 to 2060The population is projected to reach 404 million by 2060.(In millions)
CharacteristicPopulation Change from
2016 to 2060
2016 2020 2030 2040 2050 2060 Number Percent
Total population . . . . . . . 323.1 332.6 354.8 373.1 388.3 403.7 80.6 24.9
Under 18 years . . . . . . . . . . . . . . . 73.6 73.9 75.4 76.8 77.9 79.8 6.2 8.418 to 44 years . . . . . . . . . . . . . . . . 116.0 119.2 125.0 126.3 129.3 132.3 16.3 14.145 to 64 years . . . . . . . . . . . . . . . 84.3 83.4 81.3 89.1 95.4 97.0 12.8 15.165 years and over . . . . . . . . . . . . 49.2 56.1 73.1 80.8 85.7 94.7 45.5 92.3
85 years and over . . . . . . . . . . . . 6.4 6.7 9.1 14.4 18.6 19.0 12.6 197.8100 years and over . . . . . . . . . . . 0.1 0.1 0.1 0.2 0.4 0.6 0.5 618.3
Note: The official population estimates for the United States are shown for 2016; the projections use the vintage 2016 population estimate for July 1, 2016, as the base population for projecting from 2017 to 2060.
Source: U.S. Census Bureau, 2017 National Population Projections.
U.S. Census Bureau 5
with already aging populations. By 2060, the United States is projected to look much like Japan does today, with nearly a quar-ter of its population aged 65 and over.2 When compared globally, the United States is projected to have a relatively younger popula-tion by 2030 than Japan, Canada, and many European countries, including Germany, Italy, France, and Spain.3 These countries will face the challenges of an aging population earlier than the United States.
2 W. He, D. Goodkind, and P. Kowal, “An Aging World: 2015,” International Population Reports, P95/16-1, U.S. Census Bureau, Washington, DC, 2016.
3 J. Ortman, V. Velkoff, and H. Hogan, “An Aging Nation: The Older Population in the United States,” Current Population Reports, P25-1140, U.S. Census Bureau, Washington, DC, 2014. See also, W. He, D. Goodkind, and P. Kowal, “An Aging World: 2015,” International Population Reports, P95/16-1, U.S. Census Bureau, Washington, DC, 2016.
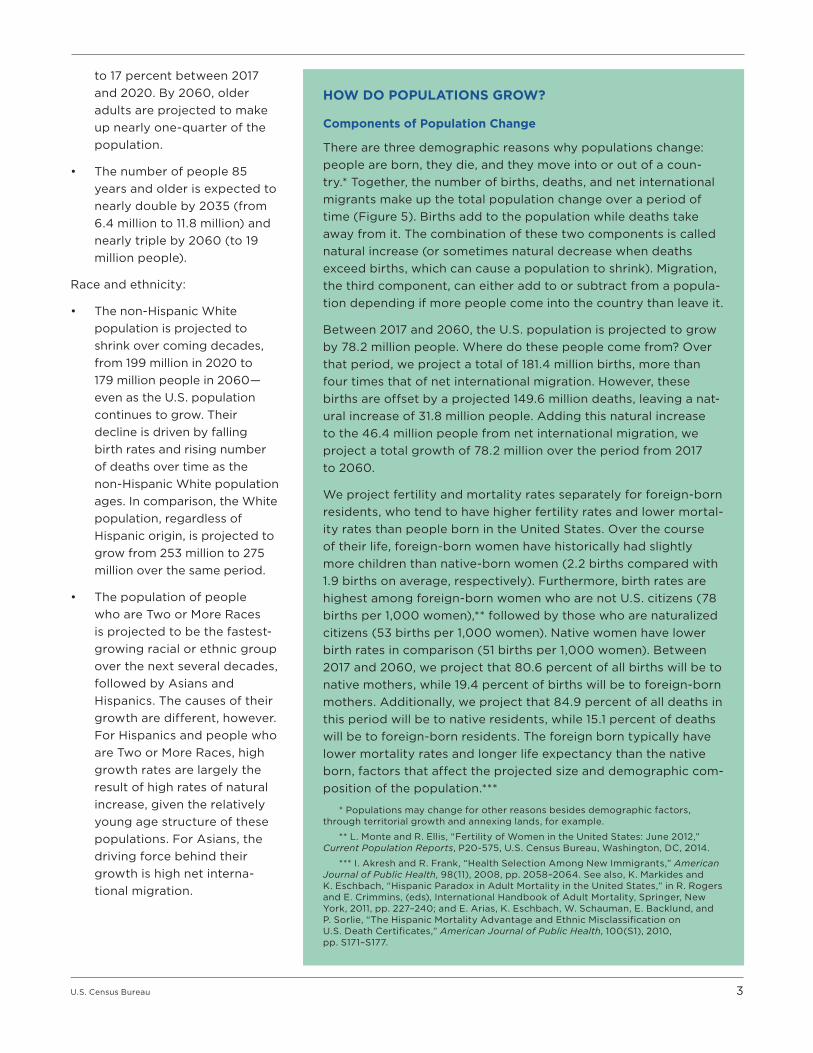
Older women will continue to outnumber older men, but the gap is narrowing.
Traditionally, there have been far more women than men at older ages, because women tend to live longer.4 Sex ratios, which reflect this gender imbalance, represent the number of men for every 100 women in a specific age group. A ratio of 100 indicates a perfect balance between the sexes, with the same number of men as there are women. Currently, sex ratios for the 65-plus population are 79, while those for the 85-plus popu-lation are just 54. In other words, these age groups are heavily skewed toward women.
The latest projections calculate that these imbalances will shrink somewhat in coming decades, largely because of rising life expec-tancy among men. The greatest gains will be at the oldest ages.
4 K. Kochanek, S. Murphy, J. Xu, and B. Tejada-Vera, “Deaths: Final Data for 2014,” National Vital Statistics Reports, 65(4), National Center for Health Statistics, Hyattsville, MD, 2016.
Sex ratios for the 65-plus popula-tion are projected to rise from 79 to 86 between now and 2060, while ratios for the 85-plus popula-tion will rise from 54 to 65 (Table 2). The changing sex ratio imbal-ance has implications for later-life support and caregiving since it affects the availability of partners and the likelihood of forming a new relationship among the widowed or divorced, especially at older ages.5
In coming decades, the United States is expected to shift from a youth-dependent population toward an elderly-dependent population.
Dependency ratios are another way to look at the changing age composition of the population. They indicate the dependent population’s potential burden on the working-age population—in other words, how many people do the working-age support? Of
5 C Dollar, “Sex Ratio Effects on Marital Formation and Dissolution, 1980–2000,” Sociological Inquiry, 85(4), 2015, pp. 556–575.
Table 2.
Population by Age Groups 65 Years and Older and Sex Ratios: Projections 2020 to 2060Older women are projected to continue outnumbering older men in coming decades.(In thousands)
Characteristic 2016 2020 2030 2040 2050 2060
65 years and older Women . . . . . . . . . . . . . . . . . . 27,451 31,037 40,216 44,503 46,943 51,013 Men. . . . . . . . . . . . . . . . . . . . . . 21,793 25,014 32,921 36,324 38,731 43,663 Sex ratio . . . . . . . . . . . . . . . 79 81 82 82 83 8685 years and older Women . . . . . . . . . . . . . . . . . . 4,155 4,283 5,611 8,840 11,315 11,543 Men. . . . . . . . . . . . . . . . . . . . . . 2,225 2,418 3,463 5,590 7,246 7,477 Sex ratio . . . . . . . . . . . . . . . 54 56 62 63 64 65100 years and older Women . . . . . . . . . . . . . . . . . . 66 71 102 141 276 422 Men. . . . . . . . . . . . . . . . . . . . . . 16 21 38 55 110 168 Sex ratio . . . . . . . . . . . . . . . 24 30 37 39 40 40
Note: Sex ratios represent the number of men for every 100 women in the population. A ratio of 100 means that there is an equal number of men and women in a specific age group in the population. Ratios above 100 mean there are more men than women, while ratios below 100 mean there are fewer men than women. The official population estimates for the United States are shown for 2016; the projections use the vintage 2016 population estimate for July 1, 2016, as the base population for projecting from 2017 to 2060.
Source: U.S. Census Bureau, 2017 National Population Projections.
6 U.S. Census Bureau
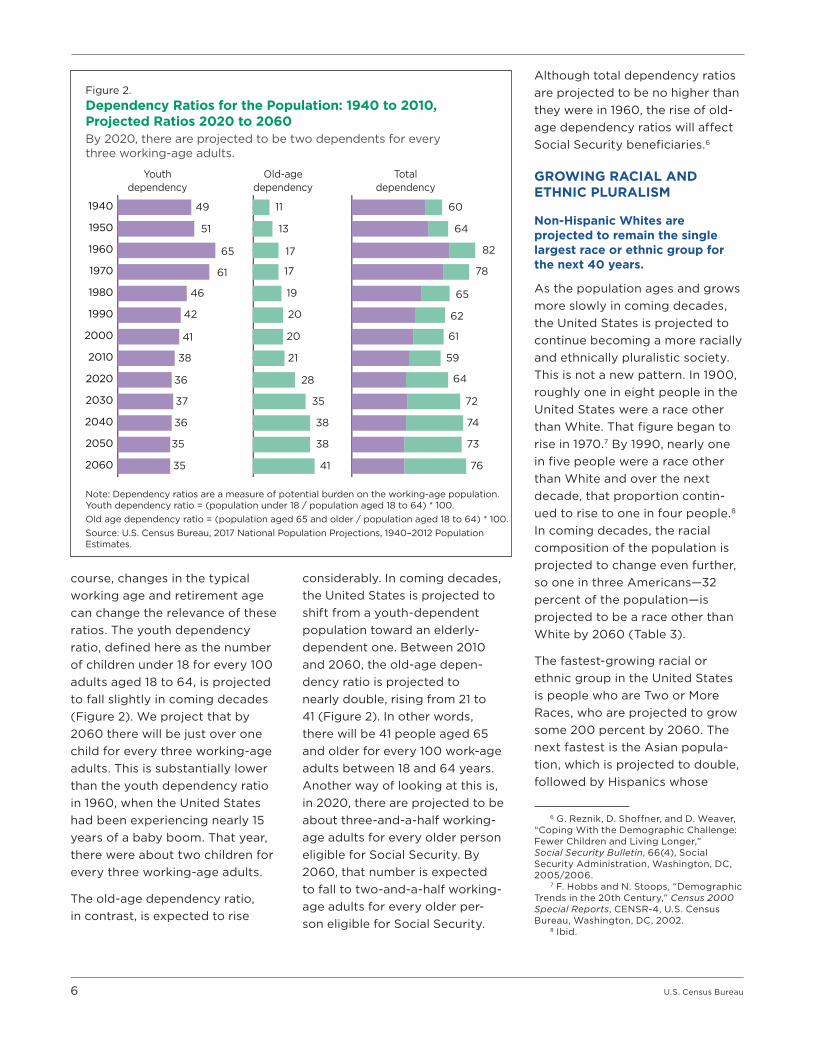
course, changes in the typical working age and retirement age can change the relevance of these ratios. The youth dependency ratio, defined here as the number of children under 18 for every 100 adults aged 18 to 64, is projected to fall slightly in coming decades (Figure 2). We project that by 2060 there will be just over one child for every three working-age adults. This is substantially lower than the youth dependency ratio in 1960, when the United States had been experiencing nearly 15 years of a baby boom. That year, there were about two children for every three working-age adults.
The old-age dependency ratio, in contrast, is expected to rise
considerably. In coming decades, the United States is projected to shift from a youth-dependent population toward an elderly-dependent one. Between 2010 and 2060, the old-age depen-dency ratio is projected to nearly double, rising from 21 to 41 (Figure 2). In other words, there will be 41 people aged 65 and older for every 100 work-age adults between 18 and 64 years. Another way of looking at this is, in 2020, there are projected to be about three-and-a-half working-age adults for every older person eligible for Social Security. By 2060, that number is expected to fall to two-and-a-half working-age adults for every older per-son eligible for Social Security.
Although total dependency ratios are projected to be no higher than they were in 1960, the rise of old-age dependency ratios will affect Social Security beneficiaries.6
GROWING RACIAL AND ETHNIC PLURALISM
Non-Hispanic Whites are projected to remain the single largest race or ethnic group for the next 40 years.
As the population ages and grows more slowly in coming decades, the United States is projected to continue becoming a more racially and ethnically pluralistic society. This is not a new pattern. In 1900, roughly one in eight people in the United States were a race other than White. That figure began to rise in 1970.7 By 1990, nearly one in five people were a race other than White and over the next decade, that proportion contin-ued to rise to one in four people.8
In coming decades, the racial composition of the population is projected to change even further, so one in three Americans—32 percent of the population—is projected to be a race other than White by 2060 (Table 3).
The fastest-growing racial or ethnic group in the United States is people who are Two or More Races, who are projected to grow some 200 percent by 2060. The next fastest is the Asian popula-tion, which is projected to double, followed by Hispanics whose
6 G. Reznik, D. Shoffner, and D. Weaver, “Coping With the Demographic Challenge: Fewer Children and Living Longer,” Social Security Bulletin, 66(4), Social Security Administration, Washington, DC, 2005/2006.
7 F. Hobbs and N. Stoops, “Demographic Trends in the 20th Century,” Census 2000 Special Reports, CENSR-4, U.S. Census Bureau, Washington, DC, 2002.
8 Ibid.
Figure 2.Dependency Ratios for the Population: 1940 to 2010,Projected Ratios 2020 to 2060By 2020, there are projected to be two dependents for every three working-age adults.
Youthdependency
Note: Dependency ratios are a measure of potential burden on the working-age population. Youth dependency ratio = (population under 18 / population aged 18 to 64) * 100. Old age dependency ratio = (population aged 65 and older / population aged 18 to 64) * 100.Source: U.S. Census Bureau, 2017 National Population Projections, 1940–2012 Population Estimates.
49
51
65
61
46
42
41
38
36
37
36
35
352060
2050
2040
2030
2020
2010
2000
1990
1980
1970
1960
1950
1940
Old-agedependency
11
13
17
17
19
20
20
21
28
35
38
38
41
Totaldependency
60
64
82
78
65
62
61
59
64
72
74
73
76

U.S. Census Bureau 7
population will nearly double within the next 4 decades.9 In contrast, the only group projected to shrink is the non-Hispanic White population. Between 2016 and 2060, the non-Hispanic White population is expected to contract by 19 million people, from 198 million to 179 million, even as the total U.S. population grows
9 For more information on race and ethnicity in the projections, see the text box “Foreseeing the Future: Assumptions About Population Projections.”
(Table 3). The decline is driven largely by falling birth rates and a rising number of deaths over time as the non-Hispanic White population ages. The crude birth rate for non-Hispanic Whites is projected to be nine per 1,000 people by 2030, compared with a crude death rate of 12 per 1,000 people.10 In other words, more
10 “Growth Rates and Birth, Death, and International Migration Rates: Main Projections Series for the United States, 2017–2060,” U.S. Census Bureau, Washington, DC, 2018.
non-Hispanic Whites are pro-jected to die than will be born. Nonetheless, non-Hispanic Whites are projected to remain the single largest race group throughout the next 40 years. Beginning in 2045, however, they are no longer projected to make up the majority of the U.S. population.
Table 3.
Population by Race and Ethnicity: Projections 2030 to 2060 The non-Hispanic White population is projected to shrink by 19 million people by 2060.(In thousands)
Characteristics
Population Change from 2016 to 20602016 2030 2060
Number Percent Number Percent Number Percent Number Percent
Total population . . . . . . . . . . . . . . . . . 323,128 100.0 354,840 100.0 403,697 100.0 80,569 24.9One race White . . . . . . . . . . . . . . . . . . . . . . . . . . . . . . . . 248,503 76.9 263,302 74.2 274,576 68.0 26,073 10.5 Non-Hispanic White . . . . . . . . . . . . . . . . . . 197,970 61.3 197,888 55.8 178,884 44.3 –19,086 –9.6 Black or African American . . . . . . . . . . . . . . 43,001 13.3 48,934 13.8 60,471 15.0 17,470 40.6 American Indian and Alaska Native . . . . . . 4,055 1.3 4,657 1.3 5,567 1.4 1,512 37.3 Asian . . . . . . . . . . . . . . . . . . . . . . . . . . . . . . . . . 18,319 5.7 24,382 6.9 36,778 9.1 18,459 100.8 Native Hawaiian and Other Pacific Islander . . . . . . . . . . . . . . . . . . . . . . . . . . . . . 771 0.2 912 0.3 1,124 0.3 353 45.8Two or More Races . . . . . . . . . . . . . . . . . . . . . . 8,480 2.6 12,652 3.6 25,181 6.2 16,701 196.9Hispanic . . . . . . . . . . . . . . . . . . . . . . . . . . . . . . . . 57,470 17.8 74,751 21.1 111,022 27.5 53,552 93.2
Native-born population . . . . . . . . . . . . . . . . 279,283 100.0 301,057 100.0 334,364 100.0 55,081 19.7One race White . . . . . . . . . . . . . . . . . . . . . . . . . . . . . . . . 222,942 79.8 232,488 77.2 236,517 70.7 13,575 6.1 Non-Hispanic White . . . . . . . . . . . . . . . . . . 189,896 68.0 188,066 62.5 165,685 49.6 –24,211 –12.7 Black or African American . . . . . . . . . . . . . . 38,345 13.7 42,939 14.3 50,977 15.2 12,632 32.9 American Indian and Alaska Native . . . . . . 3,465 1.2 4,030 1.3 4,958 1.5 1,493 43.1 Asian . . . . . . . . . . . . . . . . . . . . . . . . . . . . . . . . . 6,377 2.3 9,361 3.1 17,253 5.2 10,876 170.6 Native Hawaiian and Other Pacific Islander . . . . . . . . . . . . . . . . . . . . . . . . . . . . . 576 0.2 685 0.2 865 0.3 289 50.2Two or More Races . . . . . . . . . . . . . . . . . . . . . . 7,578 2.7 11,555 3.8 23,795 7.1 16,217 214.0Hispanic . . . . . . . . . . . . . . . . . . . . . . . . . . . . . . . . 37,819 13.5 51,410 17.1 83,777 25.1 45,958 121.5
Foreign-born population . . . . . . . . . . . . . . . 43,845 100.0 53,783 100.0 69,333 100.0 25,488 58.1One race White . . . . . . . . . . . . . . . . . . . . . . . . . . . . . . . . 25,560 58.3 30,815 57.3 38,059 54.9 12,499 48.9 Non-Hispanic White . . . . . . . . . . . . . . . . . . 8,073 18.4 9,823 18.3 13,198 19.0 5,125 63.5 Black or African American . . . . . . . . . . . . . . 4,656 10.6 5,996 11.1 9,494 13.7 4,838 103.9 American Indian and Alaska Native . . . . . . 590 1.3 627 1.2 609 0.9 19 3.2 Asian . . . . . . . . . . . . . . . . . . . . . . . . . . . . . . . . . 11,942 27.2 15,021 27.9 19,525 28.2 7,583 63.5 Native Hawaiian and Other Pacific Islander . . . . . . . . . . . . . . . . . . . . . . . . . . . . . 195 0.4 227 0.4 259 0.4 64 32.8Two or More Races . . . . . . . . . . . . . . . . . . . . . . 902 2.1 1,097 2.0 1,386 2.0 484 53.7Hispanic . . . . . . . . . . . . . . . . . . . . . . . . . . . . . . . . 19,652 44.8 23,341 43.4 27,246 39.3 7,594 38.6
Note: The official population estimates for the United States are shown for 2016; the projections use the vintage 2016 population estimate for July 1, 2016, as the base population for projecting from 2017 to 2060. Percentages will not add to 100 because Hispanics may be any race.
Source: U.S. Census Bureau, 2017 National Population Projections.
8 U.S. Census Bureau
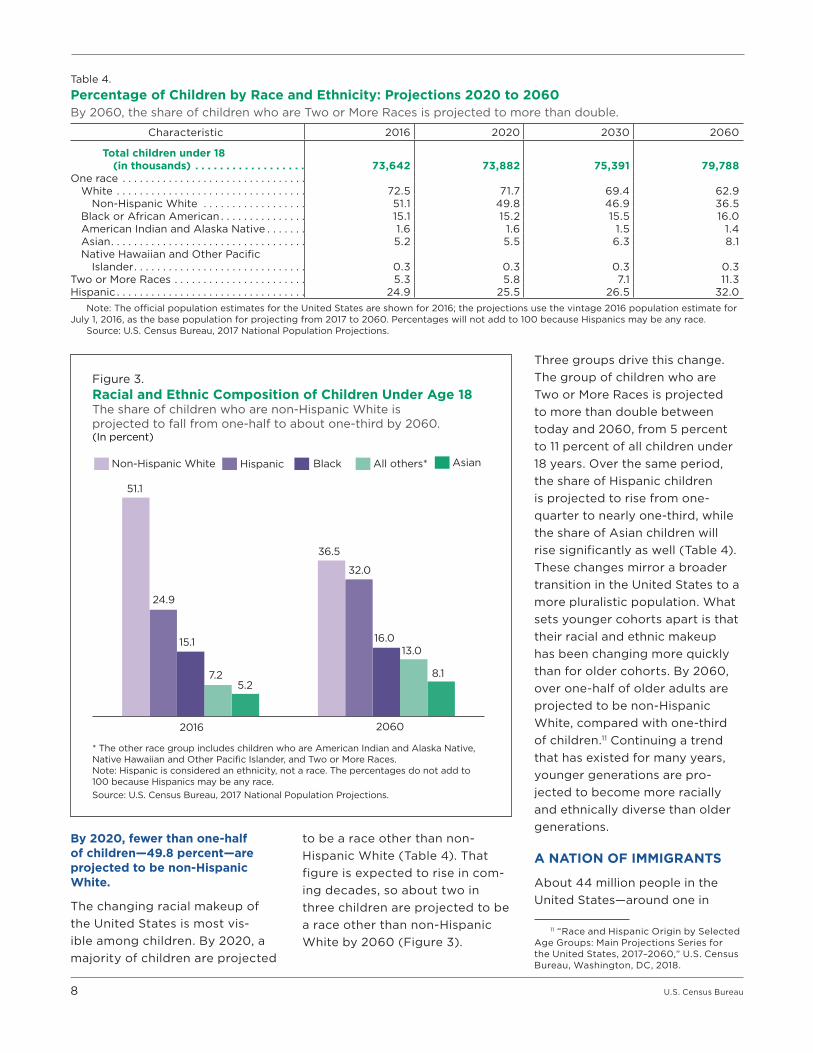
By 2020, fewer than one-half of children—49.8 percent—are projected to be non-Hispanic White.
The changing racial makeup of the United States is most vis-ible among children. By 2020, a majority of children are projected
to be a race other than non- Hispanic White (Table 4). That figure is expected to rise in com-ing decades, so about two in three children are projected to be a race other than non-Hispanic White by 2060 (Figure 3).
Three groups drive this change. The group of children who are Two or More Races is projected to more than double between today and 2060, from 5 percent to 11 percent of all children under 18 years. Over the same period, the share of Hispanic children is projected to rise from one-quarter to nearly one-third, while the share of Asian children will rise significantly as well (Table 4). These changes mirror a broader transition in the United States to a more pluralistic population. What sets younger cohorts apart is that their racial and ethnic makeup has been changing more quickly than for older cohorts. By 2060, over one-half of older adults are projected to be non-Hispanic White, compared with one-third of children.11 Continuing a trend that has existed for many years, younger generations are pro-jected to become more racially and ethnically diverse than older generations.
A NATION OF IMMIGRANTS
About 44 million people in the United States—around one in
11 “Race and Hispanic Origin by Selected Age Groups: Main Projections Series for the United States, 2017–2060,” U.S. Census Bureau, Washington, DC, 2018.
Table 4.
Percentage of Children by Race and Ethnicity: Projections 2020 to 2060By 2060, the share of children who are Two or More Races is projected to more than double.
Characteristic 2016 2020 2030 2060
Total children under 18 (in thousands) . . . . . . . . . . . . . . . . . . 73,642 73,882 75,391 79,788One race . . . . . . . . . . . . . . . . . . . . . . . . . . . . . . . . White . . . . . . . . . . . . . . . . . . . . . . . . . . . . . . . . . 72.5 71.7 69.4 62.9 Non-Hispanic White . . . . . . . . . . . . . . . . . . 51.1 49.8 46.9 36.5 Black or African American . . . . . . . . . . . . . . . 15.1 15.2 15.5 16.0 American Indian and Alaska Native . . . . . . . 1.6 1.6 1.5 1.4 Asian . . . . . . . . . . . . . . . . . . . . . . . . . . . . . . . . . . 5.2 5.5 6.3 8.1 Native Hawaiian and Other Pacific Islander . . . . . . . . . . . . . . . . . . . . . . . . . . . . . . 0.3 0.3 0.3 0.3Two or More Races . . . . . . . . . . . . . . . . . . . . . . . 5.3 5.8 7.1 11.3Hispanic . . . . . . . . . . . . . . . . . . . . . . . . . . . . . . . . . 24.9 25.5 26.5 32.0
Note: The official population estimates for the United States are shown for 2016; the projections use the vintage 2016 population estimate for July 1, 2016, as the base population for projecting from 2017 to 2060. Percentages will not add to 100 because Hispanics may be any race.
Source: U.S. Census Bureau, 2017 National Population Projections.
Figure 3.Racial and Ethnic Composition of Children Under Age 18The share of children who are non-Hispanic White is projected to fall from one-half to about one-third by 2060.(In percent)
* The other race group includes children who are American Indian and Alaska Native, Native Hawaiian and Other Pacific Islander, and Two or More Races.Note: Hispanic is considered an ethnicity, not a race. The percentages do not add to 100 because Hispanics may be any race.Source: U.S. Census Bureau, 2017 National Population Projections.
Non-Hispanic White
20602016
51.1
7.25.2
36.5
32.0
24.9
15.113.0
8.1
16.0
Hispanic All others*Black Asian
U.S. Census Bureau 9
eight—were born in another coun-try. However, most residents have immigration in their family history. Some 36 million Americans must look to their parents to find it, while 235 million—or about 75 percent of Americans—must look back to their grandparents’ gen-eration or earlier.12 Although it is easy to think of the foreign born as a single population, they are made up of people from different countries and backgrounds. Of the 44 million foreign born living in the United States today, just under one-half are Hispanic
12 E. Trevelyan, C. Gambino, T. Gryn, L. Larsen, Y. Acosta, E. Grieco, D. Harris, and N. Walters, “Characteristics of the U.S. Population by Generational Status: 2013,” Current Population Survey Reports, P23-214, U.S. Census Bureau, Washington, DC, 2016.
(Table 3), consistent with estimates from the American Community Survey which show that the majority of foreign born in the United States came from Latin America and the Caribbean.13 About one-quarter of today’s foreign born are Asian, and a little under one-fifth are non-Hispanic White (Table 3). These numbers reflect the cur-rent total or stock of foreign born living in the United States. The largest sending regions of migrants have been changing recently, however. Of those who
13 E. Grieco, Y. Acosta, G. de la Cruz, C. Gambino, T. Gryn, L. Larsen, E. Trevelyan, and N. Walters, “The Foreign-Born Population in the United States: 2010,” American Community Survey Reports, ACS-19, U.S. Census Bureau, Washington, DC, 2012.
arrived before 2000, most came from Latin American countries, followed by Asian countries. Since 2010, that trend has reversed with Asia replacing Latin America as the largest sending region of migrants to the United States.14
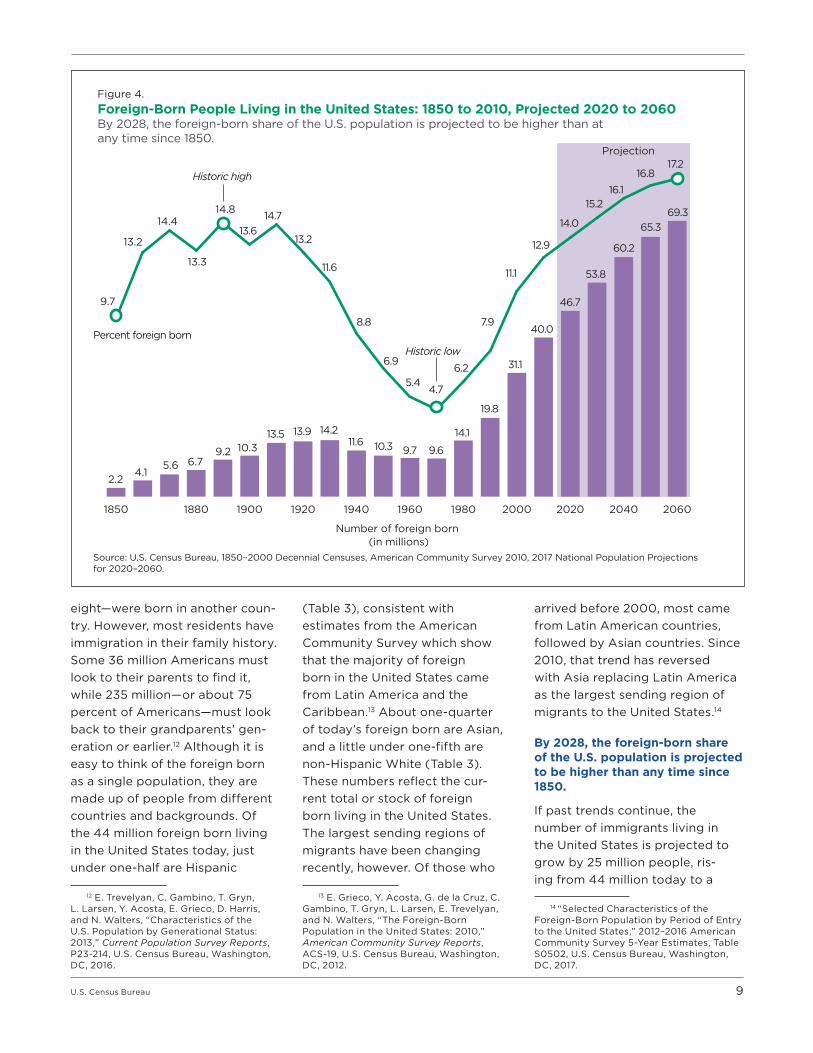
By 2028, the foreign-born share of the U.S. population is projected to be higher than any time since 1850.
If past trends continue, the number of immigrants living in the United States is projected to grow by 25 million people, ris-ing from 44 million today to a
14 “Selected Characteristics of the Foreign-Born Population by Period of Entry to the United States,” 2012–2016 American Community Survey 5-Year Estimates, Table S0502, U.S. Census Bureau, Washington, DC, 2017.
Figure 4.Foreign-Born People Living in the United States: 1850 to 2010, Projected 2020 to 2060By 2028, the foreign-born share of the U.S. population is projected to be higher than at any time since 1850.
Projection
Number of foreign born (in millions)
Source: U.S. Census Bureau, 1850–2000 Decennial Censuses, American Community Survey 2010, 2017 National Population Projections for 2020–2060.
20602040202020001980196019401920190018801850
14.814.4
13.3
13.2
9.7
2.24.1
5.6 6.79.2 10.3
13.5 13.9 14.211.6 10.3 9.7 9.6
14.1
19.8
31.1
40.0
46.7
53.8
60.2
65.369.3
17.216.8
16.115.2
14.0
12.9
11.1
7.9
6.2
4.75.4
6.9
8.8
11.6
13.2
14.713.6
Historic low
Historic high
Percent foreign born
10 U.S. Census Bureau
projected 69 million by 2060 (Figure 4). Not until 2028 will the foreign born living in the United States reach a historic high, how-ever. That year, 14.9 percent of the U.S. population is projected to have been born in another coun-try, higher than any time since 1850.15 Just 2 years later, by 2030, net international migration is expected to become the primary driver of population growth in the United States—another demo-graphic milestone for the country (Figure 6).
15 “Projected Size of the Native- and Foreign-Born Population: Main Projections Series for the United Sates, 2017–2060,” U.S. Census Bureau, Washington, DC, 2018.
Although the size of the foreign-born population is projected to rise, the next few decades will actually look like an earlier period in U.S. history. From the late 19th to early 20th century, the country experienced high levels of immi-gration, a period when roughly one in seven people in the United States were born in another country (Figure 4). After the First World War, the proportion of foreign born began declining until it reached a historic low in 1970, when just one in 20 residents were
foreign born.16 Since 1970, the size of the foreign-born population
16 The U-shaped pattern in the foreign-born population (Figure 4) is related to the Immigration Act of 1924 and the Immigration and Nationality Act of 1965. The 1924 act coincided with a decades-long decline in the number of immigrants to the United States, evident in the figure by the falling percent-age of foreign born in the U.S. population. This pattern reversed after the 1965 act, which aimed to abolish immigration quotas based on national origin and favored instead family reunification and, to some extent, specialized skills. Following the 1965 act, immigration began rising and the origin of foreign born in the United States changed. See D. Massey and K. Pren, “Unintended Consequences of U.S. Immigration Policy: Explaining the Post-1965 Surge from Latin America,” Population and Development Review, 38(1), 2012, pp. 1–29. See also, A. Timmer and J. Williamson, “Immigration Policy Prior to the 1930s: Labor Markets, Policy Interactions, and Globalization Backlash,” Population and Development Review, 24(4), 1998, pp. 739–771.
Figure 5.Projected Population Change and Births, Deaths, and Net International Migration: 2017 to 2060By 2060, the U.S. population is projected to grow by 78 million people.(In millions)
Net international migrationDeathsBirthsTotal population change, 2017 to 2060
Source: U.S. Census Bureau, 2017 National Population Projections.
181.4
149.6
Natural Increase
35.1 to foreign-born mothers
(19.4% of births)
146.3 to native-born
mothers (80.6% of births)
127.0 native-born (84.9% of deaths)
22.6 foreign-born (15.1% of deaths)
46.4
78.2
U.S. Census Bureau 11
has been rising and, if past trends continue, would total more than 69 million by 2060, or about one in six people living in the United States.
An increase in the foreign born would alter the age structure of the U.S. population, as well as its racial and ethnic composition (discussed earlier in the report). Today, about 78 percent of the foreign-born population is of working age, between 18 and 64 years, compared with just 59 percent of the native born. Both of these figures are projected to fall within the next decade, but the gap will remain almost as large (falling to 72 percent and 56 percent, respectively, by 2030). This gap is important because the foreign born are more likely to be in the labor force. What is more, young first genera-tion immigrants are more likely to have full-time jobs than their native peers (although that does not necessarily mean those jobs are better paying).17 Nonetheless, the native population is younger overall and, in coming decades, a higher percentage of the foreign born are projected to be 65 and
17 E. Trevelyan, C. Gambino, T. Gryn, L. Larsen, Y. Acosta, E. Grieco, D. Harris, and N. Walters, “Characteristics of the U.S. Population by Generational Status: 2013,” Current Population Survey Reports, P23-214, U.S. Census Bureau, Washington, DC, 2016. See also, “Foreign-Born Workers: Labor Force Characteristics—2016,” Bureau of Labor Statistics News Release, USDL-17-0618, Department of Labor, Washington, DC, 2016; and E. Grieco, Y. Acosta, G. de la Cruz, C. Gambino, T. Gryn, L. Larsen, E. Trevelyan, and N. Walters, “The Foreign-Born Population in the United States: 2010,” American Community Survey Reports, ACS-19, U.S. Census Bureau, Washington, DC, 2012; and “Selected Characteristics of the Native and Foreign-Born Populations,” 2016 American Community Survey 1-Year Estimates, Table S0501, U.S. Census Bureau, Washington, DC, 2016.
over.18 Thus a change in the size of the working-age population could have important consequences for the population overall.
Of course, these projections will hold true only if all other past trends continue and all assump-tions about births, deaths, and international migration hold true. Migration trends are especially sensitive to policy and economic circumstances in both the United
18 “Projected Native Population by Selected Ages: Main Projections Series for the United States, 2017–2060,” U.S. Census Bureau, Washington, DC, 2018. See also, “Projected Foreign-Born Population by Selected Ages: Main Projections Series for the United States, 2017–2060,” U.S. Census Bureau, Washington, DC, 2018.
States and migrants’ country of origin. The projections in this report are based on historical trends in international migration and do not attempt to account for future policy or economic cycles.
PROJECTED TRENDS IN POPULATION SIZE AND GROWTH
Growing, but more slowly.
Over the next four decades the U.S. population is projected to grow by 78 million people, from about 326 million today to 404 million people by 2060 (Figure 5). By 2058, the U.S. population is expected to cross the 400-million
2060
2050
2040
2030
2020
2017
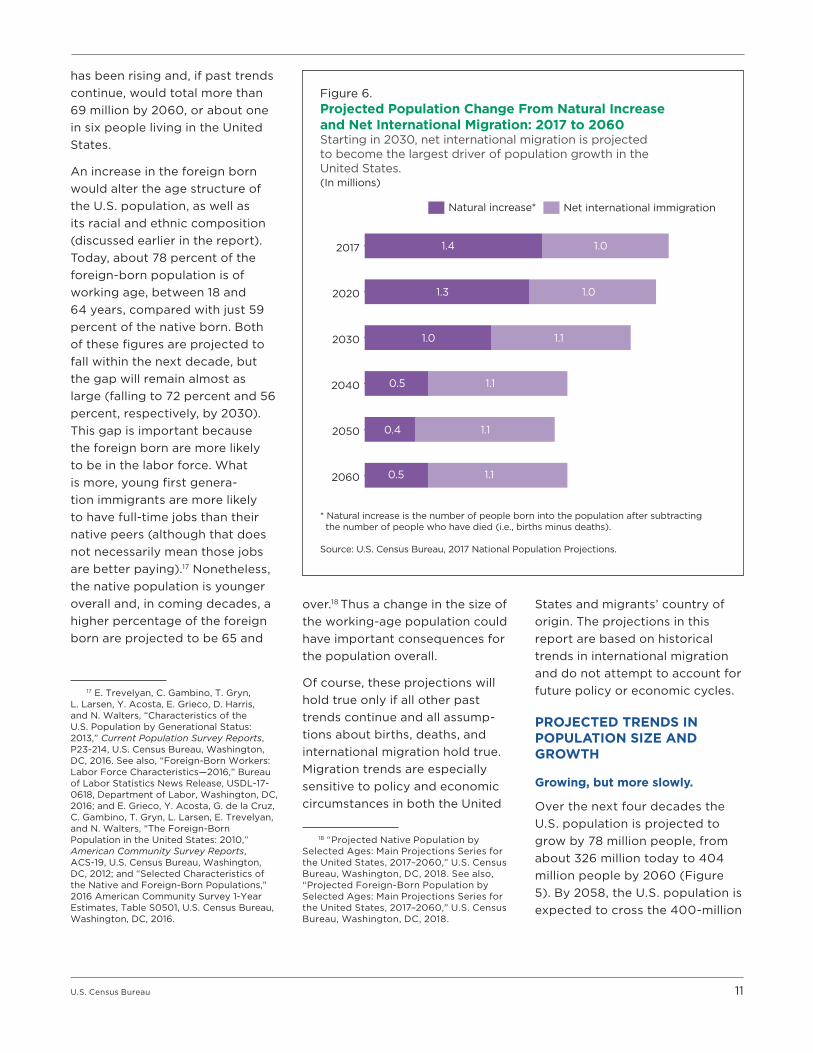
Figure 6.Projected Population Change From Natural Increase and Net International Migration: 2017 to 2060Starting in 2030, net international migration is projected to become the largest driver of population growth in the United States.
* Natural increase is the number of people born into the population after subtracting the number of people who have died (i.e., births minus deaths).
Source: U.S. Census Bureau, 2017 National Population Projections.
Natural increase*
(In millions)
1.4 1.0
1.3 1.0
1.0 1.1
0.5 1.1
0.4 1.1
0.5 1.1
Net international immigration

12 U.S. Census Bureau
threshold. Although the total pop-ulation is expected to gradually increase over time, the pace of growth is slowing. Since 2010, the population has grown by an aver-age of 2.3 million people per year and it is projected to continue growing by the same amount until 2030, when the population
is expected to reach about 355 million people (Table 1). However, that rate is projected to fall to an average of 1.8 million per year in the following decade, between 2030 and 2040. In addition, it is projected to continue falling to an annual rate of about 1.5 million
people between 2040 and 2060.19 The slowing growth in the U.S. population comes from the confluence of three factors: an aging population, falling fertil-ity rates (fewer people will be born), and lower rates of net international migration in coming decades.
A projected annual growth of 0.7 percent during the 2020s may seem small. Yet this change actu-ally sets the United States apart from other developed countries, some of which are experiencing little to no population growth. For example, Japan’s population is actually declining while those of Russia and other Eastern European countries are projected to contract within the decade.20 These coun-tries face a combination of lower fertility rates, older age structures, and lower international migration than the United States. The pro-jected 0.7 percent annual growth for the United States looks more robust in comparison.
Starting in 2030, net international migration is projected to become the largest driver of population growth.
The population is projected to continue growing over the next 40 years, but the force behind that growth is expected to change. Between 2017 and 2060, the population is projected to grow by 78 million people, more than half of which is expected to come from international migration. Yet the level of net international migration is projected to remain
19 In terms of annual percent change, these numbers correspond to popula-tion growth of about 0.7 percent per year until 2030, 0.5 percent per year between 2030 and 2040, and 0.4 percent per year between 2040 and 2060.
20 U.S. Census Bureau, 2017 International Data Base.
FORESEEING THE FUTURE? ASSUMPTIONS ABOUT POPULATION PROJECTIONS
Projections can only illustrate potential trajectories of popula-tion change. The projections in this report will hold true only if all assumptions about future fertility, mortality, and international migration hold true as well. Because these assumptions of demo-graphic change are based on historical trends in births, deaths, and international migration, the projections do not predict any poten-tial impact of future policy decisions or exceptional historic events, such as natural disasters. This report discusses what the population may look like in coming decades. Such statements are always con-ditional on the underlying assumptions about the components of population change. The projections are accurate insofar as future trends in fertility, mortality, and migration mirror historical trends in these components of population change.
Where this report discusses race, it generally refers to single race groups (i.e., people who reported being only White or only Asian). Two or More Races refers to people who reported at least two race groups (e.g., White and Asian), while the Hispanic popula-tion includes all Hispanics, regardless of their race. Projecting race and ethnicity is challenging. The number of births, deaths, and net international migrants affect the size of each race and ethnic group, but so do changes in self-identification and self-reporting. For example, there was considerable change in the race response of individuals who reported American Indian or Alaska Native between the 2000 Census and the 2010 Census. Moreover, the increase in the number of people who reported being both White and Black between the censuses was largely the result of people who reported both races in 2010, when they had previously reported only one race in 2000.* The projections do not account for social changes in self-identification or self-reporting of race and ethnicity.
* For more information, see H. Hogan, J. Ortman, and S. Colby, “Projecting Diversity: The Methods, Results, Assumptions, and Limitations of the U.S. Census Bureau’s Population Projections,” West Virginia Law Review, 117, 2015, pp. 1047–1079. See also, K. Humes and H. Hogan, “Do Current Race and Ethnicity Concepts Reflect a Changing America?” In R. Bangs and L. Davis (eds), Race and Social Problems, Springer, New York, 2015, pp. 15–38.
U.S. Census Bureau 13
relatively flat in coming decades (Figure 6), while rates of migration are projected to fall slightly. And, until 2030, natural increase will be the leading driver of population growth. Beginning in 2030, how-ever, the United States is projected to experience a significant demo-graphic transition: net international migration is expected to overtake natural increase as the primary driver of population growth (Figure 6). That trend is projected to continue so that in 2060, the U.S. population will grow by 1.6 million people, two-thirds of which is projected to come from net international migration (1.1 mil-lion) and one-third from natural increase (about 500,000).
Why is international migration projected to become the lead-ing cause of population growth in coming decades? The reason is population aging. The number of births is projected to rise only slightly in coming decades. But the number of deaths is projected to rise much faster, especially between 2020 and 2050, as baby boomers age into later life and the size of the older population expands. As the number of deaths climbs toward the number of births each year, the population will naturally grow very slowly. In 2020, for example, we are project-ing 4.1 million births and 2.8 million deaths (a natural increase of 1.3 million people). In 2060, we are projecting 4.4 million births but 3.9 million deaths—in other words, only a few hundred-thousand more births than in 2020, but 1.1 million more deaths.21 Even though
21 “Projected Births, Deaths, and NetInternational Migration: Main ProjectionsSeries for the United States, 2017–2060,”U.S. Census Bureau, Washington,DC, 2018.
levels of international migration are projected to remain relatively flat, this sharp rise in deaths is pro-jected to allow international migra-tion to overtake natural increase as the leading cause of population growth beginning in 2030.
SUMMARY
The year 2030 marks a demo-graphic turning point for the United States. Beginning that year all baby boomers will be older than 65 and, within the decade, older adults (65 years and older) are projected to outnumber chil-dren (under 18 years) for the first time in U.S. history. While the pop-ulation ages, the United States will experience another demographic milestone. By 2030, immigration is projected to become the primary driver of population growth: more people are projected to be added to the population through net international migration than from natural increase. The projected shift to net international immigra-tion as the primary driver of popu-lation growth is the result of falling fertility rates and the rising num-ber of deaths in an aging popula-tion, not because of a projected increase in international migration. The rapid aging of the population between 2020 and 2040 will have a substantial demographic impact on the country.
Despite slowing growth, the U.S. population is still projected to grow. This continued growth sets the United States apart from some of the other developed countries whose populations are expected to barely increase or contract over the next few decades. By the next census, 332.6 million people are projected to be living in the United States.
By 2058, the U.S. population is expected to cross the 400-million threshold, with a projected popu-lation of 400.5 million people. By that time the United States will be an older, more racially and ethnically pluralistic society. Non-Hispanic Whites are projected to remain the single largest race or ethnic group throughout the next 40 years. Beginning in 2045, they are no longer projected to make up the majority of the U.S. popu-lation. If the assumptions underly-ing these projections hold, then the U.S. population is projected to experience several demographic milestones by 2060, as the popu-lation grows slowly, ages consid-erably, and becomes more racially and ethnically pluralistic.
DATA SOURCES AND METHODOLOGY
The projections in this report are the third series of national popula-tion projections based on the 2010 Census. They project the total U.S. population as of July 1 for the years 2017 to 2060, using official population estimates for 2016 as the base population. When both population estimates and projec-tions are available, estimates are the preferred data. The universe is the resident population of the United States (50 states and the District of Columbia). The 2017 National Population Projections include projections of the resident population by several demo-graphic traits, including age, sex, race, Hispanic origin, and nativity.
The projections were produced using a cohort-component method beginning with an estimated base population for July 1, 2016. In this method, the components of population change are projected
14 U.S. Census Bureau
separately for each birth cohort (persons born in a given year) based on past trends. For each year from 2017 to 2060, the popu-lation is advanced 1 year of age using the projected age-specific survival rates and levels of net international migration for that year. A new birth cohort is added to the population by applying the projected age-specific fertil-ity rates to the female population. Births, adjusted for infant mortal-ity and net international migration, form the new population under 1 year of age. In its simplest form, the cohort component method is expressed as:
Pt =Pt-1+ Bt-1,t– Dt-1,t+ Mt-1,t
where:
Pt = population at time t,
Pt-1 = population at time t-1,
Bt-1,t = births in the interval from time t-1 to time t,
Dt-1,t = deaths in the interval from time t-1 to time t, and
Mt-1,t = net migration in the interval from time t-1 to time t.
Projections produced through the cohort-component method are driven by assumptions regard-ing each of the components of change. In order to project a population forward in this manner, separate projections of fertility, mortality, and net international migration are required to serve as inputs into the cohort-component model, as is an original base popu-lation to project forward.
Historical mortality trends were calculated using the National Center for Health Statistics’ data on deaths and the Census Bureau’s population estimates for 1989 to 2015. Fertility trends were calculated using the National Center for Health Statistics’ birth data and the Census Bureau’s estimates of the female popula-tion. The time series included data from 1990 to 2016. Trends in net international migration were pri-marily based on decennial census and American Community Survey estimates on foreign-born immi-gration for the period from 1980 to 2016.
For more information on the data and methodology, see the report on 2017 National Population Projections: Methodology and Assumptions <www.census.gov /programs-surveys/popproj /technical-documentation /methodology.html>.
DATA ACCURACY
The accuracy of the projections depend on the accuracy and valid-ity of several data sources. First, the projections are based on the 2010 Census, which may contain nonsampling error because of errors in enumeration, such as undercounting or overcounting different demographic groups. Nonsampling error may be a by-product of how a questionnaire is designed, how respondents inter-pret questions, how able or willing respondents are to provide correct answers, and how accurately the answers are coded and classified. Technical documentation for the 2010 Census is available at <www.census.gov/prod/cen2010 /doc/sf1.pdf>. Second, the projec-tions use administrative records
U.S. Census Bureau 15
from the National Center for Health Statistics on births and deaths. Reporting error on the birth or death certificates would affect the population projections because this data is used to calculate fertil-ity rates and mortality rates for the population. Third, the projections use the American Community Survey to assign nativity to the base population and calculate immigration and emigration rates of the foreign born. Statistics that come from surveys are subject to nonsampling error, noted above, as well as sampling error. The latter occurs because surveys measure the characteristics of a sample of people, instead of those of the entire population (as from a census). Sample-based estimates vary depending on the particular sample that is selected from the population, but all survey-based estimates attempt to approxi-mate the actual figures from the population. Measures of the size of sampling error reflect variation
in the estimates over all possible samples that could have been selected from the population using the same sampling, data collection, and processing methods. Technical documentation for the American Community Survey is available at <www.census.gov/programs -surveys/acs/methodology.html>.
Last, the projections did not attempt to predict future changes in policy or other factors, such as natural disasters or changing economic cycles, which might influence the population com-ponents and their magnitude of change. The projections are accu-rate only insofar as the assump-tions about fertility, mortality, and net international migration hold true, assumptions that are based on historical trends. If the future trends or levels in fertility, mor-tality, or international migration differ radically from the historical patterns, then the population pro-jections will be less accurate.
SUGGESTED CITATION
Vespa, Jonathan, David M. Armstrong, and Lauren Medina, “Demographic Turning Points for the United States: Population Projections for 2020 to 2060,” Current Population Reports, P25-1144, U.S. Census Bureau, Washington, DC, 2018.
CONTACTS
Jonathan Vespa <[email protected]> 301-763-7283
David M. Armstrong <[email protected]> 301-763-5671
Lauren Medina <[email protected]> 301-763-5062