DEMIRE Deutsche Mittelstand Real Estate AG Conference Call ... · November 17 2 Disclaimer This...
17
DEMIRE Deutsche Mittelstand Real Estate AG Conference Call – 9M Results 2017 30 November 2017
Transcript of DEMIRE Deutsche Mittelstand Real Estate AG Conference Call ... · November 17 2 Disclaimer This...

DEMIRE Deutsche Mittelstand Real Estate AG
Conference Call – 9M Results 2017
30 November 2017

November 17
2
Disclaimer
This document is for informational purposes only. This document is not intended to form the basis of any investment decision and should not be
considered as a recommendation by DEMIRE Deutsche Mittelstand Real Estate AG (the “Company”) or any other person in relation to the Company. This
document does not constitute an offer to sell, a solicitation of an offer of the sale or purchase of securities or an invitation to purchase or tender for the
Company. Securities of the Company shall not be offered or sold, in any jurisdiction in which such an offer, solicitation or sale would be unlawful.
Certain information in this document is based on management estimates. Such estimates have been made in good faith and represent the current beliefs
of management. Management believes that such estimates are founded on reasonable grounds. However, by their nature, estimates may not be correct or
complete. Accordingly, no representation or warranty (express or implied) is given that such estimates are correct or complete.
This document includes 'forward-looking statements'. Forward-looking statements are all statements which do not describe facts of the past but contain the
words "believe", "estimate", "expect", "anticipate", "assume", "plan", "intend", "could", and words of similar meaning. These forward-looking statements are
subject to inherent risks and uncertainties since they relate to future events and are based on current assumptions and estimates of the Company, which
might not occur at all or occur not as assumed. They therefore do not constitute a guarantee for the occurrence of future results or performances of the
Company. The actual financial position and the actual results of the Company as well as the overall economic development and the regulatory
environment may differ materially from the expectations which are assumed explicitly or implicitly in the forward-looking statements and do not comply to
them. Therefore, investors are warned to base their investment decisions with respect to the Company on the forward-looking statements mentioned in this
document.

November 17
3
Agenda
Highlights 9M Results 2017
Portfolio Update
Financials
Outlook 2017

November 17
4
Office Building, Frankfurter Str. 29-35, Eschborn
Highlights 9M Results 2017
Office Building, Frankfurter Str. 29-35, Eschborn

November 17
5
Financials
Portfolio
» Successful letting activities of c. 51.600 sqm, thereof new lettings (c. 49%), average
lease term of 5.3 years overall
» EPRA vacancy rate down by 170 bps to 9.9% excluding properties already sold
» Like-for-like rental growth of c. 2.6% in the 9M of 2017
» Rental income slightly decreased to € 55.9m (9M 2016: € 56.7m) due to
the sale of non-strategic real estate in the last 12 months
» Valuation result of € 26.3m in 9M 2017 due to improved portfolio KPI’s and strong real
estate fundamentals in the “Secondaries”
» Net-LTV decreased by 80 bps to 62.0% (31.12.2016: 62.8%)
» Reduction of avg. annual financing costs by 60 bps to 3.8% p.a. (31.12.2016:
4.4% p.a.), pro forma at 3.0% p.a., taking into account refinancing from issue and tap of
senior notes in July/September 2017
FFO &
EPRA NAV
» FFO I (after taxes, before minorities) reached € 9.2m (9M 2016: € 7.0m)
» EPRA NAV per share increased to € 4.72 (diluted) and to € 5.69 (undiluted)
Note: Performance of metrics derived from profit and loss statement measured on y-o-y basis, changes of balance sheet items measured since fiscal year end 2016
Highlights 9M 2017
First milestones reached in implementing DEMIRE 2.0 strategy
Liability
Management
» Tap of rated and unsecured senior notes with € 130m in September at an implied
yield of 2.6% following inaugural bond placement of € 270m in July 2017
» Proceeds from tap to be used for refinancing of expensive debt and for future acquisitions
Cost & Tax
optimisation
» EGM on 15th of November: full approval to conclusion of several profit transfer and
domination agreements, pre-condition for tax pooling, cross-border change of legal form
of selected subsidiaries well advanced

November 17
6
Office Building, Frankfurter Str. 29-35, Eschborn
Portfolio Update
Office Building, Frankfurter Str. 29-35, Eschborn

November 17
7
Portfolio Optimisation by Vacancy Reduction…
Leasing Performance 9M 2017
EPRA Vacancy (%)
12.8%11.6%
9.9%(1)
FY 15 FY 16 9M 17
Low Level of Upcoming Lease Maturities
Lease Expiry Schedule(2)
Comments
» EPRA vacancy rate down by 170 bps to 9.9%(1)
» Successful letting activities of c. 51.600 sqm, thereof
c. 25,300 sqm of new lettings and c. 26,300 sqm of
renewals
» New lease contracts with average WALT of 6.1 years
» Retention rate: 78% of rental contracts expiring in 9M
2017 have been renewed in 9M 2017
» Like-for-like rental growth of 2.6%
(1) As of 30th September 2017, excluding properties sold (signed but not closed); calculation as defined by EPRA BPR standards
(2) Over term of leases signed
…While Maintaining a Stable Lease Profile
WALT (years)
5.4 yrs 5.3 yrs4.8 yrs
FY 15 FY 16 9M 17
Further vacancy reduction…
2%
10%8% 8%
19%
7%8%
14%12%
2%
8%
2%

November 17
8
Attractive Yield and WALT Across Asset Classes
Development of Investment Properties
All Three Clusters Generate Attractive Rental Yields
Secondary Locations Gaining Momentum
….starting to drive revaluation of properties
No.
properties
GAV
(€m)
GRI p.a.
(€m) (1)
GRI p.a.
(€/m2/
p.m.) (1)
GRI
Yield
(%)
EPRA
Vacancy
(%) (2)
WALT
(Years)
Core+ 38 542 37.8 8.9 7.0% 2.7% 5.9
Value add 42 415 30.5 5.5 7.4% 18.1% 3.8
Redevelopment 10 62 4.0 9.5 6.5% 0.5% 2.7
Total (9M-17) 90 1,018 72.3 7.1 7.1% 9.9% 4.8
Total (FY 2016) 174 1,006 74.1 7.0 7.4% 11.6% 5.3
% / ppt change (84 units) 1.2% (2.4%) 1.4% (0.3ppt.) (1.7ppt.) (0.5yrs.)
No.
properties
GAV
(€m)
GRI p.a.
(€m) (1)
GRI p.a.
(€/m2/
p.m.) (1)
GRI
Yield
(%)
EPRA
Vacancy
(%) (2)
WALT
(Years)
Office 64 689 48.9 7.9 7.1% 7.7% 4.5
Retail 16 242 17.6 10.2 7.3% 8.6% 6.3
Logistics 1 58 3.8 2.1 6.6% 35.9% 1.5
Other 9 30 2.0 5.0 6.6% - 6.8
Total (H1-17) 90 1,018 72.3 7.1 7.1% 9.9% 4.8
Total (FY 2016) 174 1,006 74.1 7.0 7.4% 11.6% 5.3
% / ppt change (84 units) 1.2% (2.4%) 1.4% (0.3ppt.) (1.7ppt.) (0.5yrs.)
(1) Annualised contractual rent excluding service charges
(2) As of 30th September 2017, excluding properties sold (signed but not closed); calculation as defined by EPRA BPR standards
(3) Other effects include changes in/reclassification of assets held for sale and capitalization of investments
in € m
981.326,3 (7.6) 999.9
1,018.5
IFRSInvestmentproperties31 Dec 16
Revaluations Other effects IFRSInvestmentproperties30 Sep 17
incl. Assetsheld for sale
Comments
» # of real estate assets at 90 commercial properties vs. FY
2016 due to sale of non strategic assets, thereof 7 assets held
for sale
» Total valuation uplift of € 26.3m in the first 9M 2017, hence
average value per sqm raised by 2.1% to 1,037 €/sqm, still
way below replacement costs for German commercial real
estate
» GRI Yield of 7.1% for the total portfolio (FY 2016: 7.4%)
(3)

November 17
9
Office Building, Kuhberg 17-19 / Kieler Straße 1, Neumünster
Financials

November 17
10
8,17,0
9,2
FY 2016 9M 2016 9M 2017
76,4
56,7 55,9
FY 2016 9M 2016 9M 2017
Rental Income
€m
Selected P&L Positions
Comments
» Rental income slightly decreased to € 55.9m due to
the sale of non-strategic real estate in the last 12 months
» Financial result increased by 19%, mainly due to € -13.0m
one-time costs from refinancing activities, recurring
financial expenses already lowered compared to 9M 2016
» FFO I increased y-o-y due to lower average recurring
financing costs and lower tax burden
(1) After tax, before minorities
Funds from operations I(1)
€m
(43.2)
(35.4)
(42.1)
FY 2016 9M 2016 9M 2017
Financial result
€m
c. € 13.0m
one-time effects

November 17
11
4,4 4,43,8
3,0
FY 2016 9M 2016 9M 2017 9M 2017pro forma
senior notes
1.005,6
981,2
1.018,5
FY 2016 9M 2016 9M 2017
GAV
€m
Selected Balance Sheet Positions
Comments
» Growing asset base despite disposal of non-core assets
» Continued trajectory of de-leveraging and reducing
average annual financing costs
» Net-LTV decreased to 62.0% mainly due to positive effects
from revaluation gains by end of 9M 2017
Average annual financing costs
in %
62,8%
64,8%
62,0%
FY 2016 9M 2016 9M 2017
Net LTV
€m

November 17
12
Decreasing Average Cost of Debt and Improving FFO I
5,2%
4,4%
3,8%
3,0%
Q4 2015 Q4 2016 9M 2017 Post-refi
Contributing € 18m of annual free cash flow
Refinancing of € 400m to Further Lower Cost of Debt
» In July 2017, DEMIRE successfully placed its inaugural
unsecured, rated bond of € 270m with coupon of 2.875%
» Tap in September 2017 with € 130m at an issue price of 101.25
percent above par value (Yield to maturity 2.6%)
» Strong demand from institutional investors
» Bond/Corporate ratings from S&P and Moody’s with BB+/Ba2 and
BB/Ba2 (with stable outlook) for DEMIRE
» Net proceeds have been used for the early refinancing of existing
debt with average cost of debt of 4.9% and high amortization rate
of 3.4%
» Additional € 35m from tap to fund further acquisitions
Total Upside from Refinancings in July/September
(1) Post July 2017 bond issuance and bond tap in September 2017
(2) Due to reduced interest and amortization expense
(1)
Metric Effects
Annual cash flow / FFO » ca. €18.0m(2) cash flow p.a.
Unencumbered assets
» Increase from €3m (0.3% of GAV) to
ca. €400m (41% of GAV) post bond and
refinancing of A/B Notes
Tax efficiencies» Benefit from moving underlying propco
into tax pooling with DEMIRE AG
Financing structure pre/post Refinancing July/September
TrancheAmount (€m)
Margin/Coupon30/9/2017 PF Refinancing
Cash and Cash Equivalents (130.7) (59.7)
New Senior Unsecured Notes 262.5 392.5 2.875%
Corporate Bond 14/19 98.2 - 7.500%
Bank Loans 24.4 24.4 1.500% - 5.000%
A/B Notes 92.5(3) - 3.910% - 5.250%
Promissory Notes 141.8 141.8 4.000%
Total Fair Value REIT-AG Debt 130.0 130.0 2.380%
Convertible Bond 10.5 10.5 6.00%
Mandatory 2018 Notes 0.3 0.3 2.750%
Other 1.9 1.9
Net Total Financial Liabilities 631.3 641.7
(1)

November 17
13
Simplification of Group Structure
Another step towards higher Funds From Operations
Shareholder
DEMIRE Deutsche
Mittelstand Real Estate AG
» Simplification of Group Structure
» High tax loss carry-forwards at DEMIRE AG level
» EGM approval on 15th of November: 7-digit tax
savings through conclusion of several profit transfer
agreements expected
» Further reduction of administrative costs due to
cross-border change of legal form of foreign
subsidiaries as well as selected merger of
subsidiaries
Targets
DEMIRE Commercial
Real Estate ZWEI GmbH
DEMIRE Commercial
Real Estate DREI
GmbH
DEMIRE Condor
Properties
Management GmbH
Logisitkpark Leipzig
GmbH
Indirect
Subsidiaries
Indirect
Subsidiaries

November 17
14
Office Building, DEMIRE Headquarters, Robert-Bosch-Str. 11, Langen
Outlook 2017
November 17
15
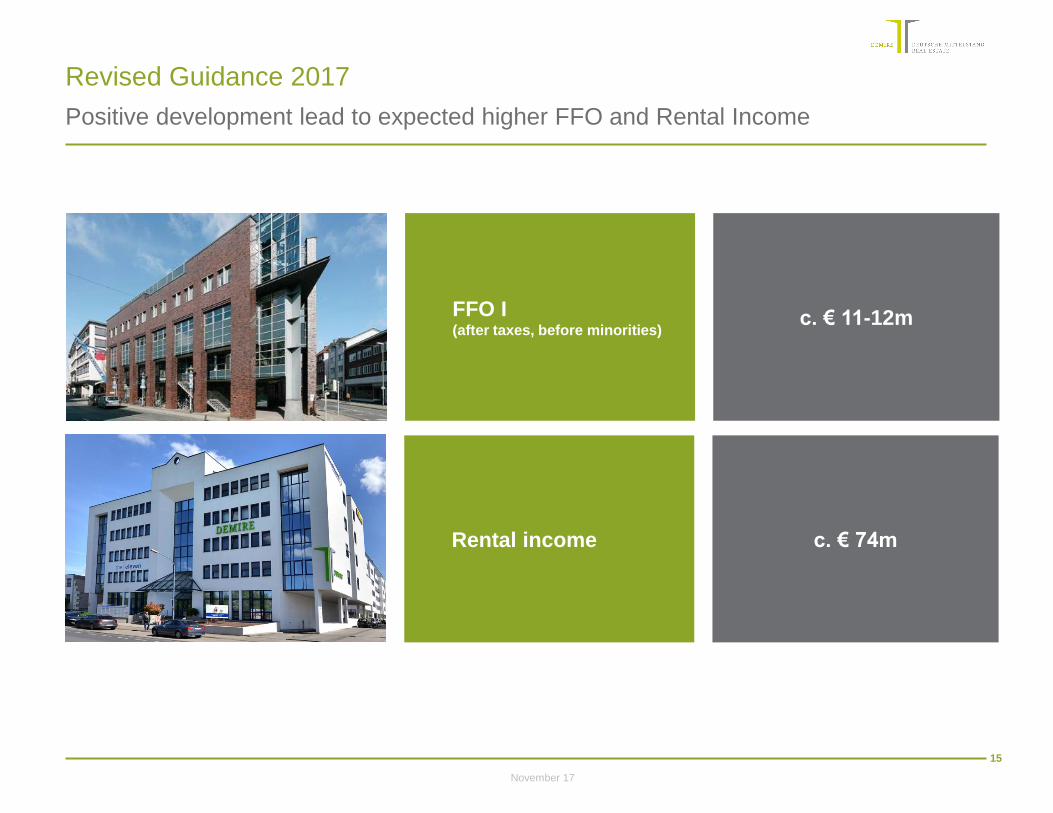
Rental income
FFO I (after taxes, before minorities)
c. € 74m
c. € 11-12m
Positive development lead to expected higher FFO and Rental Income
Revised Guidance 2017

November 17
16
€ 11-12m
FFO 2017E Financing Group simplification Internal Growth External Growth FFO 2018 - 2020
Multiple Internal and External Levers to Drive FFO
Strong FFO growth in 2018 from internal and external growth
12
3
Note: chart for illustrative purposes only; column heights do not correspond to any particular values
Measures 2018-2020…
» Avg. cost of debt
reduced from 4.4%
to 3.0% in 2017
» Unencumbered
assets of c. € 400m
» Reducing leverage
to 50%
» Aim for
investment grade
…to
Strengthen
Profitability
…
» Improving tax
efficiency
» Optimisation of
cost base
» Buy-out of
minority interests
» Embedded growth
in the portfolio
(vacancy reduction,
rent growth,
NRI margin
improvement)
…and
Pursue
Growth
Strategy
» Accretive
acquisitions
» Creation of
economies of
scale
4
Previous
guidance
€ 8-10m
New
guidance

November 17
17
Peer Schlinkmann
Email: [email protected]
Web: www.demire.ag/en/investor-relations
Peer Schlinkmann - Head of Investor Relations & Corporate Communications
Phone: + 49 (0) 61 03 372 49 44
Fax: + 49 (0) 61 03 372 49 11
Financial Calendar 2017
Date Event
November 2017 Roadshows London, Helsinki, Zürich, Vienna
28 November 2017Participation in Analyst Conference
German Equity Forum in Frankfurt
30 November 2017 Publication Nine-Month Report 2017
Contact Details/Financial Calendar 2017
Share information (as of 30 September 2017)
Symbol / Ticker DMRE
Share price (XETRA) € 3.70
Market Segment Prime Standard
ISIN DE000A0XFSF0
Market cap € 201m
Free Float(1) 48.57%
Shares outstanding 54,261,744
(1) As of September 2017
Shareholder structure (1)
Obotritia Capital KGAA
11.9%Wecken & Cie.
29.0%
Freefloat (Holdings <5
%) 48.5%
M1 Beteiligungs GmbH
5.6%
Sigrid Wecken
5.0%