DEGREE - DiVA portal
58
DEGREE THESIS Biomechanical engineer orientation human - tech 180 hp Occupant Detection System Frida Ohlson, Nadim Al-Mosawi Final thesis, 15 credits Halmstad 2015-06-17
Transcript of DEGREE - DiVA portal

DE
GR
EE
THESIS
Biomechanical engineer orientation human - tech 180 hp
Occupant Detection System
Frida Ohlson, Nadim Al-Mosawi
Final thesis, 15 credits
Halmstad 2015-06-17


I
Preface In this final thesis we have had the privilege to work with Autoliv Sweden AB,
which is one of the world leading companies in automotive safety.
We wish to express a big thanks to Alf Holgers, Lennart Simonsson, Nicolaas
Jansen, Benny Nilsson, Farnoush Heybaran and everyone else involved in this
project for all the support and good cooperation.
We would also like to thank Mats Lindqvist, our supervisor at Halmstad
University.
A final thanks to all concerned who was involved and supported us through this
project.
Frida Ohlson Nadim Al-Mosawi
[email protected] [email protected]
0735-314121 0729-388464
II
Abstract The purpose of the ODS (Occupant Detection System) project is to develop a car
safety camera system that is able to discriminate human occupants in order to
activate safety features depending on the human size. In order to discriminate the
size of an occupant anthropometric measurements need to be performed.
The aim of this study was to investigate the possibility of anthropometric
measurements of human height and weight with a Kinect for Windows v2 sensor
for discrimination of different occupants inside a vehicle.
The goal was to find valid anthropometric methods for determination of human
height and weight from landmarks on the upper body, then test if it is possible to
perform these methods with the Kinect for Windows v2 sensor.
The execution of this study was performed as a literature study with
anthropometric tests on ATD-dummies (anthropomorphic test device) and on
human test subjects. Measurements were performed first physically and then with
the Kinect v2 sensor to obtain data in form of distance of 8 regions of the body.
Three tests were performed, first on dummies, second was a pilot study and last
the measurement study.
The result revealed that it is hard to estimate human weight from body landmarks
due to lack of information, therefor no tests were performed in this area. For
height the result showed that the most valid methods were the measurements on
arm span and ulna, both on physical measurements and with the camera.
The conclusion is that it is possible estimating height from body landmarks but
the positioning of the camera needs to be change in order for the measurements to
be more accurate.
This study has contributed to a greater understanding of measurement technology,
automotive safety and anthropometric measurements.
Table of contents
1. Introduction ................................................................................................ 1 1.1 Problem definition ............................................................................................................................ 2 1.2 Aim of thesis ........................................................................................................................................ 2 1.3 Limitations ........................................................................................................................................... 2
2. Theoretical framework ................................................................................ 3 2.1 SWOT ...................................................................................................................................................... 3 2.2 Anthropometrics ............................................................................................................................... 3
2.2.1 Anatomical position ........................................................................................................................ 3 2.2.2 Frankfort horizontal plane .......................................................................................................... 3
2.5 Pilot study ............................................................................................................................................ 4 2.6 Airbag ..................................................................................................................................................... 4 2.7 SPSS Statistics 20 ............................................................................................................................... 4 2.8 MATLAB ................................................................................................................................................ 5 2.9 Measurement equipment ............................................................................................................... 5
2.9.1 Kinect for Windows v2 sensor..................................................................................................... 5 2.9.2 Kinect for Windows SDK 2.0 ........................................................................................................ 5 2.9.3 Crash test dummies ......................................................................................................................... 6 2.9.4 Calliper .................................................................................................................................................. 6 2.9.5 Measuring tape .................................................................................................................................. 7 2.9.6 Spirit level ............................................................................................................................................ 7
3. Implementation .......................................................................................... 8 3.1 SWOT ...................................................................................................................................................... 8 3.2 Follow-up meetings .......................................................................................................................... 8 3.3 Information research ....................................................................................................................... 8 3.4 Anthropometric measurements .................................................................................................. 8
3.4.1 Physical measurements ................................................................................................................. 9 3.4.2 Camera measurements ............................................................................................................... 10 3.4.3 Dummies ............................................................................................................................................ 10 3.4.4 Pilot study ......................................................................................................................................... 11 3.4.5 Measurement study ...................................................................................................................... 11
3.5 Camera analysis .............................................................................................................................. 11
4. Result ......................................................................................................... 13 4.1 Weight ................................................................................................................................................. 13 4.2 Height .................................................................................................................................................. 13
4.2.1 Dummy measurements ............................................................................................................... 14 4.2.2 Pilot study ......................................................................................................................................... 14 4.2.3 Measurement study ...................................................................................................................... 15 4.2.4 Camera analysis results .............................................................................................................. 15
5. Discussion .................................................................................................. 17 5.1 Discussion of results ..................................................................................................................... 17
5.1.1 Weight ................................................................................................................................................ 17 5.1.2 Height .................................................................................................................................................. 18
5.2 Discussion of implementations ................................................................................................ 21

5.3 Critical review.................................................................................................................................. 23 5.3.1 Ethical consideration ................................................................................................................... 23 5.3.2 Social aspects .................................................................................................................................. 23
5.4 Discussion and recommendation of further work ........................................................... 23 5.4.1 Sensors ................................................................................................................................................ 23 5.4.2 Camera placement ........................................................................................................................ 24
6. Area of responsibility ................................................................................. 25
7. Conclusion ................................................................................................. 26
8. References ................................................................................................. 27 8.1 Book references .............................................................................................................................. 27 8.2 Article references ........................................................................................................................... 27 8.3 Electronic references .................................................................................................................... 29
9. Appendices ................................................................................................ 32 9.1 SWOT ................................................................................................................................................... 32 9.2 External dimensions Hybrid III 5th female dummy ........................................................ 33 9.3 External dimensions Hybrid III 50th male dummy ......................................................... 34 9.4 External dimensions Hybrid III 95th male dummy ......................................................... 35 9.5 Measurement methods ................................................................................................................ 36 9.6 Arm span ............................................................................................................................................ 37 9.7 Skull frontal view ........................................................................................................................... 38 9.8 Skull lateral view ............................................................................................................................ 39 9.9 Ulna ...................................................................................................................................................... 40 9.10 Humerus .......................................................................................................................................... 41 9.11 Dummy measurement compilation ..................................................................................... 42 9.12 Pilot study compilation ............................................................................................................. 43 9.13 Measurement study compilation .......................................................................................... 44 9.14 Arm span – Camera analysis ................................................................................................... 46 9.15 Humerus – Camera analysis .................................................................................................... 47 9.16 Ulna – Camera analysis ............................................................................................................. 48 9.17 Head breadth – Camera analysis ........................................................................................... 49 9.18 Head length – Camera analysis .............................................................................................. 50 9.19 Head height – Camera analysis .............................................................................................. 51

1. Introduction
1
1. Introduction Autoliv is a world leading company in automotive safety. It is the largest supplier
with sales to all the leading car manufacturers in the world. The company develop
and do research in the field of car safety systems and operates within active and
passive safety.
This project was assigned by Autoliv and is at an early phase of the development.
Autoliv wants to see the potential of a camera based system that can discriminate
occupants inside the vehicle and how validate the camera data is correlating to
reality. By optimizing a safety camera system the restraint system can be adapted
depending on the occupant to increase occupant safety. For this study Autoliv
wants to investigate the potential of discriminate different body sizes of weight
and height, in a potential crash determent whether to activate i.e. the frontal airbag
and seat belt characteristics.
Current airbags are usually activated when a vehicle crashes in a speed greater
than 22.5 km/h, which can be classified as a low impact collision (Farmer, 2007).
According to Alf Holgers at Autoliv in Vårgårda, the seatbelt and airbags are
designed to protect 5% to 50% percentile adults in a collision speed up to 64
km/h. The forces required to protect an adult occupant of that stature is larger than
the requirement for protecting a child at a low-speed crash.
FARS, which stands for US Fatal Accident Report recommends that children
younger than thirteen should not be seated in from of an active airbag. A research
report by RACV have made a comparison between a small adult female, 5th
percentile and eleven and a half to twelve and a half year old children. The
comparison shows that the body dimensions are very similar, as shown in table 1
(Paine, 2013). This means that a 5th
percentile female adult with a similar body
dimension as a child under thirteen will get the same amount of protection while
seated at the front with an active airbag. So by developing a car safety system that
can detected the difference in body structure the restraint could be optimized.
Table 1.1. Body dimension comparison between 5th percentile female and 11.5-12.5 child (Paine,
2013).
To detect occupants inside the vehicle a camera was installed on the hood of the
car so it had a frontal vision inside of the cabin. By the chosen position of the
camera the vision is limited to the upper body of the occupants. By only having
the upper body visible, how can the total body length and weight be measured? To
see if this project is worth taking forward a study had to be done to determine if

1. Introduction
2
it’s possible finding upper body landmarks that can be linked to height and
weight.
1.1 Problem definition There is no car safety camera system in today’s market that can sense the size of
the passengers inside a vehicle. By applying a built in sensor system that can
discover living objects in the front and backseat, then knowing if the passengers
for example are a baby, child or an adult, the system should know if the front
airbag should be activated. One step on doing this is to find measurable areas on
the human body representing height and weight.
1. Is it possible finding landmarks representing height and/or weight for
humans?
2. Is it possible for the camera to discriminate the needed landmarks?
3. How does the positioning of the occupant influence the camera view?
4. Are there any factors complicating the accuracy of the data?
5. Is this method the best option for discriminating human height and/or
weight?
6. Are the dimensions of the dummies corresponding to reality?
1.2 Aim of thesis The aim of this thesis was to investigate the possibility of anthropometric
measurements of human height and weight with a Kinect for Windows v2 sensor
for discrimination of different occupants inside a vehicle.
The goal was to find valid anthropometric methods for determination of human
height and weight from landmarks on the upper body, then test if it is possible to
perform these methods with the Kinect for Windows v2 sensor.
1.3 Limitations - The testing will be limited to one car.
- A sensor camera built in the front hood of vehicle.
- The measurements are limited to following crash test dummies: HIII 5th
,
HIII 50th
and HIII 95th
.
- Anthropometric methods will be drawn from existing studies, the project
do not intent to make own studies to obtain anthropometric methods.
- The project focuses only on humans and ATD dummies (no animals or
other objects).
- Safety features focusing on frontal airbag only.
- Measurements are focused only on forward facing occupant and external
objects are not taken into consideration, such as occupant reading
newspaper, wearing sunglasses, wearing a blanket etc.
- Different age and genders will not be discriminated, the primary focus is
on height and weight.

2. Theoretical framework
3
2. Theoretical framework
2.1 SWOT In the beginning phase when a project is going to be chosen an evaluation is
needed to judge whether or not the project should be undertaken. SWOT stands
for Strengths, Weaknesses, Opportunities and Threats. This method is easy to use
when evaluating projects and is created by a quad chart where the four SWOT
items are listed in each quadrant. This weighs the strengths versus the weaknesses
and the opportunities versus the threats (Ullman, 2010).
2.2 Anthropometrics Populations of people around the world variable in shapes and sizes. In human
science, anthropometry deals with measurement of the human body, e.g. body
size, shape, strength, mobility and flexibility and working capacity (Pheasant &
Haslegrave 2006). The word “anthropometry” origin from the Greek words
Anthropos meaning human and metons meaning measurement. By collecting
measurement data and proportions of the human body, scientists have chart
standards of the human body in different populations (Hägg, Ericson & Odenrick,
2011).
2.2.1 Anatomical position
A reference position in terms of body movement (see figure 2.1), the person is
standing in an erect position with slightly separated feet, arms hanging down next
to the body with palms facing forward and thumbs pointing upwards, away from
the body (Kent, 2006).
Figure 2.1. Anatomically position (Martin, 2010).
2.2.2 Frankfort horizontal plane
This plane is formed by the horizontal line, which is parallel to the floor, between
lowest point of the orbit of the eye and the tragus of the ear, as seen in figure 2.2
(Brown, Whittemore & Knapp, 2000)

2. Theoretical framework
4
Figure 2.2..Fronkfort horizontal plane (Brown et al., 2000)
2.5 Pilot study This type of study can be used in two different ways. Either it is done as a small-
scale version or trial run in preparation for the full study, or as a pre-testing or a
try-out of a certain research instrument or practical problems in the procedure.
Conducting a pilot study could have several reasons such as designing a research
protocol, establishing whether the sampling frame and technique are effective,
identifying problems which might occur using proposed methods and collecting
preliminary data (Van Teijingen & Hundley, 2002).
2.6 Airbag When a car gets involved in a collision it is important to evenly slow down the
occupants as much as possible to prevent impact injuries. The airbag has the
purpose to slow down the occupant´s motion and works best combined with a
seatbelt. In a car collision the seatbelt is holding the occupant in a correct and
secure position while the airbags inflate in to a gas-filled cushion slowing the
occupant´s motion down (Nayak et al., 2013). In less than 50 milliseconds the
frontal airbag is inflated (see figure 2.3), most often by a pyrotechnic charge and
is controlled by the passive safety electronics unit, normally located in the middle
of the car (Autoliv, 2015). The airbag is a passive supplement devise called air
cushion restraint system (ACRS). In a modern car there are various airbags such
as driver, front passenger, side-impact and rollover airbags (Nayak et al., 2013).
Figure 2.3. This shows the deployment of a frontal airbag (Autoliv, 2015).
2.7 SPSS Statistics 20 IBM SPSS Statistics is a software program used for statistical analysis. It can take
data from almost any type of file and use them to generate tabulated reports,
charts and plots of distributions and trends, descriptive statistics, and complex
statistical analysis (IBM Corporation, 2011).
2. Theoretical framework
5
During this report the SPSS software helped facilitate the calculation of the
standard variation, median and mean value of the collected anthropometric data.
The commands were used during the pilot and the actual anthropometric
measurement study. The collected data was divided in different categories such as
gender, age, body length, arm span, ulna length, humerus length, head length,
head height, head breadth and head circumference.
2.8 MATLAB MATLAB stands for MATrix LABoratory and was developed by the Math Works
Inc. This software program is widely used among scientists and engineers and the
interactive program enable numerical computation, algorithm development and
data visualization for technical computing. Other areas can be symbolic
computation, modeling, data analysis and signal processing. MATLAB is known
by its optimized matrix and vector calculations, it is one of the most used
programs today (Dukkipati, 2010).
Data cursor is a tool used in MATLAB to read data directly from a graph by
displaying the values of points selected on plotted lines, surfaces and images.
During this project 3D images was analysed using the data cursor function to get
the data valued displayed in x, y, z coordinates of the selected point (Mathworks,
2015).
2.9 Measurement equipment
2.9.1 Kinect for Windows v2 sensor
The Kinect has two different built in sensors, one RGB (Red-Green-Blue) camera
that provides raw colour image frames, an infrared emitter and camera that
measure depth in millimetre resolutions. It also has a microphone for audio
recording but this function is not included in this study (Microsoft, 2015).
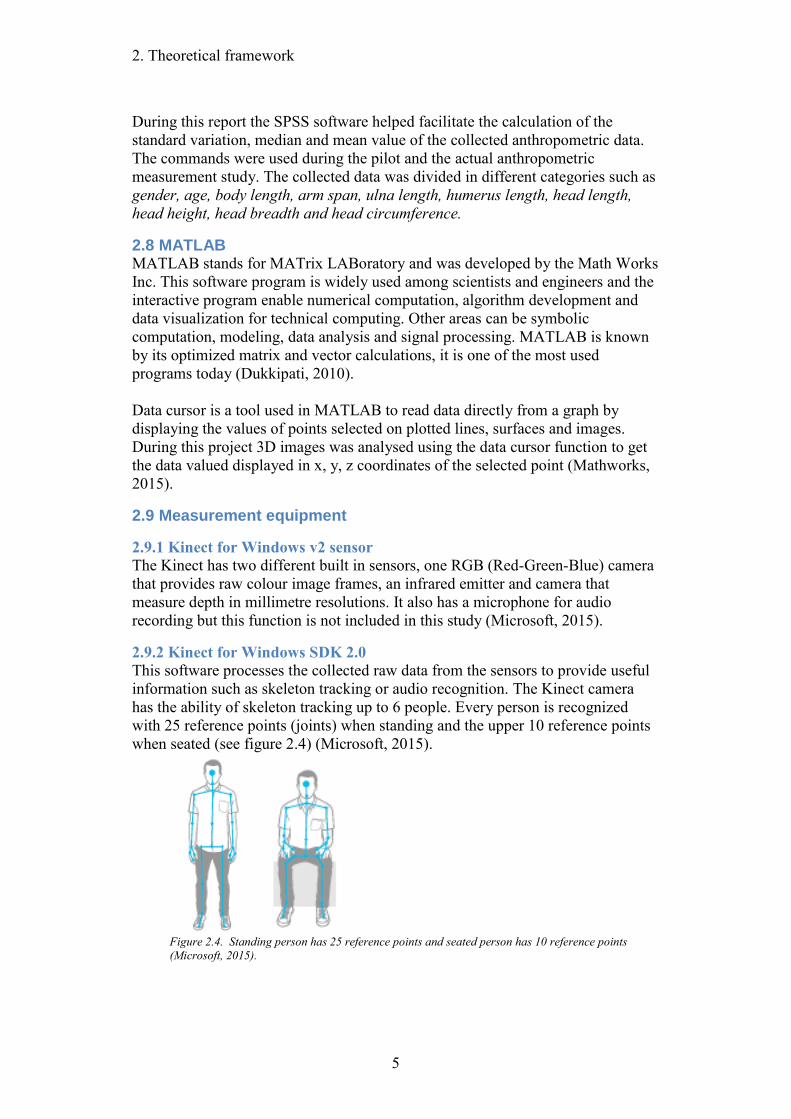
2.9.2 Kinect for Windows SDK 2.0
This software processes the collected raw data from the sensors to provide useful
information such as skeleton tracking or audio recognition. The Kinect camera
has the ability of skeleton tracking up to 6 people. Every person is recognized
with 25 reference points (joints) when standing and the upper 10 reference points
when seated (see figure 2.4) (Microsoft, 2015).
Figure 2.4. Standing person has 25 reference points and seated person has 10 reference points
(Microsoft, 2015).

2. Theoretical framework
6
Every sensor has its limitations and “sweet spots” (see figure 2.5). The vision is
limited to 0.5-4.5m (the depth sensor can see up to 8m but without the ability of
body detection) and has a sweet spot at 0.8m – 3.5m. The angle of vision of the
camera has a horizontal view of 70° and a vertical view of 60° (Microsoft, 2015).
Figure 2.5. Field of view with physical limits ands sweet spots and angle of view (Microsoft, 2015).
2.9.3 Crash test dummies
Since the very beginning of the automobile history accidents have occurred and
many people are either killed or seriously injured every year. In 2013 statistics
showed that 260 people were killed and 20519 people were injured in traffic
accidents in Sweden (Transportstyrelsen, 2015).
Instead of using real humans who can get injured or killed in crash tests, the crash
test dummy was developed. It is an anthropomorphic test device (ATD),
simulating human response to forces, accelerations, deflections, impacts and
moments during a vehicle crash. The dummies enable controlled and repeatable
measurements for human injury potential in vehicle crashes (Humanetics
Innovative Solutions, 2015).
In the laboratory testing three frontal impact dummies were used.
Hybrid III 5th
female dummy
Hybrid III 50th
male dummy
Hybrid III 95th
male dummy
2.9.4 Calliper
2.10.4.1 Vernier calliper An instrument of measuring the distance between two opposite sides of an object
(see figure 2.6), it can be either analogue or digital displayed. It consists of a fixed
scale and a moveable slide with jaws for internal and external measurements
(Nationalencyklopedin, 2015).
Figure 2.6. Vernier calliper (Craftmanspace, 2015).

2. Theoretical framework
7
2.9.4.2 Bow calliper Also called “outside calliper” and is used to measure the external size of an object
(see figure 2.7). To adjust the calliper, the legs open and close (Craftmanspace,
2015).
Figure 2.7. Bow calliper (Craftmanspace, 2015).
2.9.5 Measuring tape
A measuring tape is a length measurement for measuring distance, normally it has
the length of 0.5m up to 5m and in millimeter scale. In the construction industry
and land surveying measuring tapes are usually longer, up to a few hundred
meters (Nationalencyklopedin, 2015).
2.9.6 Spirit level
An instrument designed to indicate the horizontal level or an angle against the
horizontal plane (Nationalencyklopedin, 2015). This digital spirit level and angle
gauge can be reset in all positions and the measurement can be frozen in a wanted
position (see figure 2.8). It can read angles in the range of 0° to 180° and has a
precision of 0.3° (Neteberg, 2015).
Figure 2.8. Digital spirit level and angle gauge (Neteberg, 2015)

3. Implementation
8
3. Implementation
3.1 SWOT In the very beginning of the study a SWOT-analysis was made. This method was
used to evaluate the strengths, weaknesses, opportunities and threats of the project
(see appendix 1). The result of this analysis showed that both sides of good and
bad were quite equivalent to each other, i.e. there was no dominant side, which
made the prognoses of the outcome of the project hard to predict. Addition to this
the feeling of good support and resources made the good side with strengths and
opportunities weigh more than the bad side with threats and weaknesses.
3.2 Follow-up meetings Through the study follow-up meetings were held together with the larger project
group in the purpose to exchange ideas and get feedback in order to go further
with the study. This study sets the requirements of the larger project in the
development of the new camera safety system. Together with the larger project
group the aim of the study was determined as well as the requirements and the
limitations.
3.3 Information research An information research was done in order to find scientific articles and books
related to the project. Searches in various databases were done to collect validated
research that would back up the projects purpose, such as Pubmed, ScienceDirect
on the database from the library of Halmstad University. To avoid a large search
area of information, limitations was made to specific body parts on the upper
body. Focused body parts were head, chest, shoulder and arms. Keywords that
was used were; algorithm, airbag anthropometric, arm length, arm span, body,
body mass, chest, chest width, collisions, dimension, estimation, forces, joints,
landmarks, length, identification, head, height, human, measurement, upper body,
ratio, recognition, shoulder, shoulder width, standing length, stature, weight
The information research resulted in 13 different methods of calculating height
from areas of the human upper body, some methods on the same area. Those areas
were arm span, ulna length, humerus length, head breadth, head length, head
height and the circumference of the head. No methods were found regarding
weight from landmarks on the upper body, which made it impossible later to
perform any measurements in this field of area.
3.4 Anthropometric measurements Anthropometric measurements were performed physically and then with the
Kinect v2 camera on HIII-dummies (5th
female, 50th
male and 95th
male
percentile) and on adult test subjects, for physical dimensions on dummies, see
appendix 2, 3 and 4. The physically measurement were made in order to compare
the results to the found methods in the articles.

3. Implementation
9
The measuring methods were performed according to the methods in the articles
(see appendix 5), measurements were sampled three times and put in SPSS
Statistics 20 for statistical analyses. Measurements of height, arm span and
humerus were read to the nearest 1.0 mm, measurements of the head and ulna
were read to the nearest 0.1 mm. In order to perform all the found methods, the
parameter of age were needed therefor all test subjects were asked on their age.
3.4.1 Physical measurements
3.4.1.1 Arm span and height: The subjects were asked to stand barefoot and erect facing away from and against
a wall, feet, buttocks and back placed against the wall, hold their head erect in the
Frankfort horizontal plane. They were asked to hold arms straight out parallel to
the floor (see appendix 6) with the back of the hands against the wall with thumbs
pointed upwards. A line was drawn on the wall at the tip of each middle finger
and also at the highest point on the head, the subject was asked to step away from
the wall and the range of arm span was measured with a measuring tape between
the two lines from the finger tips, height was measured from the line from the
head to the floor.
3.4.1.2 Head measurements: The subjects were asked to sit down on a chair, sitting upright when
measurements were performed. Anatomical landmarks (see appendix 7 and 8)
were used as follow.
Maximum head breadth; was measured between the most lateral points of the
parietal bones with a bow calliper.
Maximum head length; was measured between the Glabella (most prominent
point on the forehead between the eyebrows, above the nasal root) and the
Opisthocranion point (the most posteriorly protruding point on the back of the
skull) with a bow calliper.
Maximum head height; was measured on the right side of the head with a Vernier
calliper between the external acoustic meatus (ear canal) and the highest point on
the vertex of the head. A spirit level was used to find the horizontal level on
vertex allowing more precise measurements with the calliper (this was not done in
the pilot study).
Circumference; was measured with a measuring tape horizontally around the head
over the Glabella and Opisthocranion.
3.4.1.3 Arm measurements: The subjects were asked to take place on a chair, sitting upright with the right
forearm resting on the table (elbow joint bent approximately 90º) with the palm
faced down.
The ulnar length; was measured between the proximal end of ulna (Olecranon
process) and the distal end (tip of the styloid process) with a Vernier calliper (see
appendix 9).
The humerus length; was measured from the vertical diameter of the humeral head
to the humeral lateral epicondyle with a measuring tape (see appendix 10).

3. Implementation
10
3.4.2 Camera measurements
For this study a camera that could measure depth/distances was needed to perform
measurements on the human body. In this first phase of the study a Microsoft
Kinect v2 camera was used. This camera was chosen because of the low purchase
cost and that it is easily manageable. For the later prototype another camera may
be used instead.
After the physical measurements were done, a recording on every subject was
made with the Kinect camera in order to remake the measurements on the
recorded images on the computer. The subjects were asked to stand in front of the
camera at an approximate distance of 2 meter (see figure 3.1) (1.5 meter in the
pilot study). This distance was used in order to record within the camera “sweet
spot”. The subjects were asked to stand erect, holding there arms straight out in
the anatomical position. In this position they turned their head to the right and left
side. Then they were asked to take a seat in a chair placed at approximately the
same distance, 2 meter (1.5 meter), and do the same procedure again holding their
arms straight out in the anatomical position and turn their head to the right and left
side.
Figure 3.1. Showing distance between test subject and camera and reference coordinates.
3.4.3 Dummies
First, in the facilities of Autoliv in Vårgårda, measurements were performed on
the three ATD-dummies, 5th
female, 50th
male and 95th
male. The existing
manuals couldn’t provide with all the necessary information on the external body
dimensions (see appendix 2, 3 and 4) that was needed to do the calculations of the
methods, therefore physical measurements was required. Ranges measured were
arm span, head length, head height, head breadth and head circumference, length
of the ulnar bone and length and length of the humerus bone (see appendix 11).
All the measurements except height were performed in the same execution as the
physical measurements on the human test subjects. Height was taken from
anthropometric charts by Högskolan i Skövde (2011) due to each percentile of the
dummies. The dummies were then recorded with the Kinect v2 camera when
seated and fastened in their stand, holding arms straight out in the anatomical
position. The dummies were recorded in a frontal and lateral position, placed
approximately 2m from the camera.

3. Implementation
11
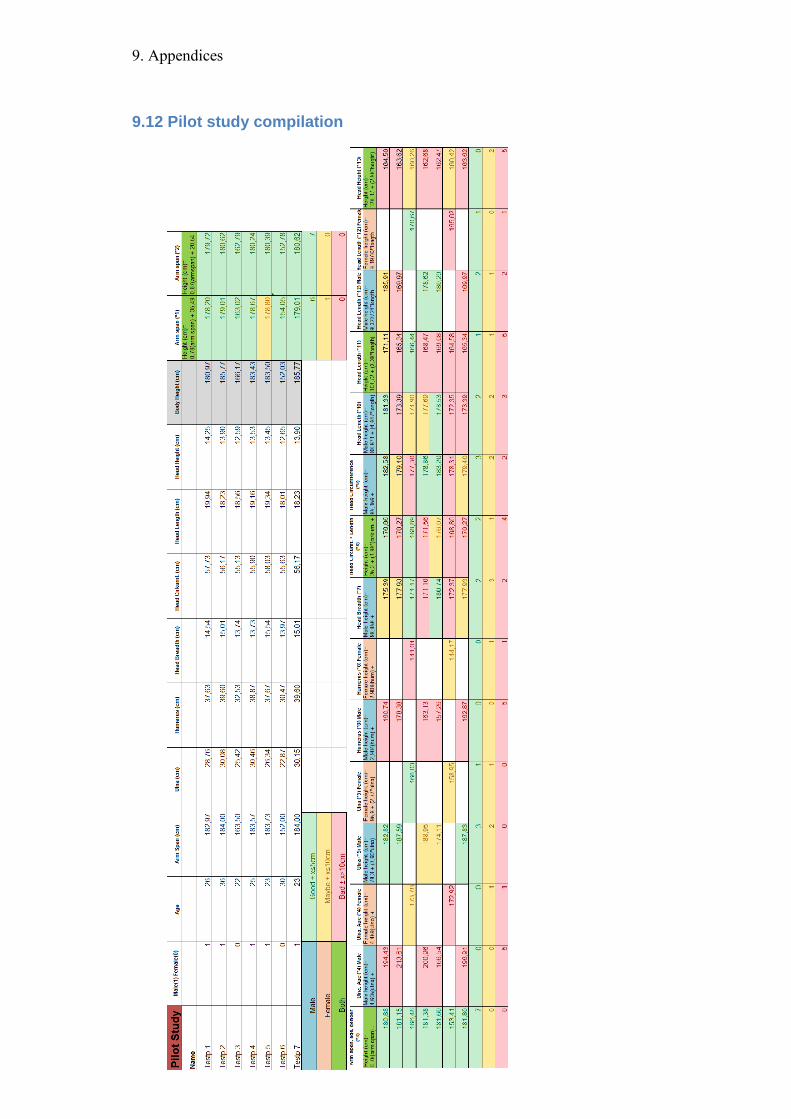
3.4.4 Pilot study
A pilot study was performed at Halmstad University with the purpose to
familiarise with the test equipment and to set a time reference needed when
performing the measurement study later. It was also interesting to see if the found
methods worked or if they were complete failure before the larger collection of
measurements were obtained. A random sample of 7 people, 2 female and 5 male
with age ranging from 22 to 36 years old were studied. Ranges measured were
stature, arm span, head length, head height, head breadth and head circumference,
length of the ulnar bone and length and length of the humerus bone (see appendix
12). The measurements from the camera were only done in order to set a time
reference for the bigger study and has not been analysed.
3.4.5 Measurement study
In the same way that the pilot study was performed, measurements of height, arm
span, ulnar length, humerus length, head length, -breadth, -height and
circumference were taken (See appendix 13). A random sample of 30 people, 15
male and 15 female, with age ranging from 20 to 58 years old were studied. All
measurements were performed in the facilities of Autoliv in Vårgårda. First the
test subjects were physically measured according to the method above for
physical measurements and then recorded by the Kinect v2 camera according to
the method of camera measurements.
3.5 Camera analysis For the camera analysis, 3D-images were taken from the video recordings of the
anthropometric measurements. The images were in a 16-bit 415x512 grey-scale
format and analysed in MATLAB with the measurement tool data cursor. The
images that were used were all in standing positions. Measurement data was done
for all 30 test subjects, arm span, humerus length, ulna length, head breadth, head
length and head height data were collected. The head circumference was excluded
due to limited camera visions of the back of the head.
By selecting two points on the 3D image x (width), y (height), z (depth)
coordinates was displayed (see figure 3.1), which later was entered and converted
to meter scale with Kinect2PixelToCam converter in Matlab. The distance was
calculated from a Pythagoras trigonometry equation using Excel (Nilsson, 2004).
Arm measurement data for humerus- and ulna length was collected only from the
right arm.
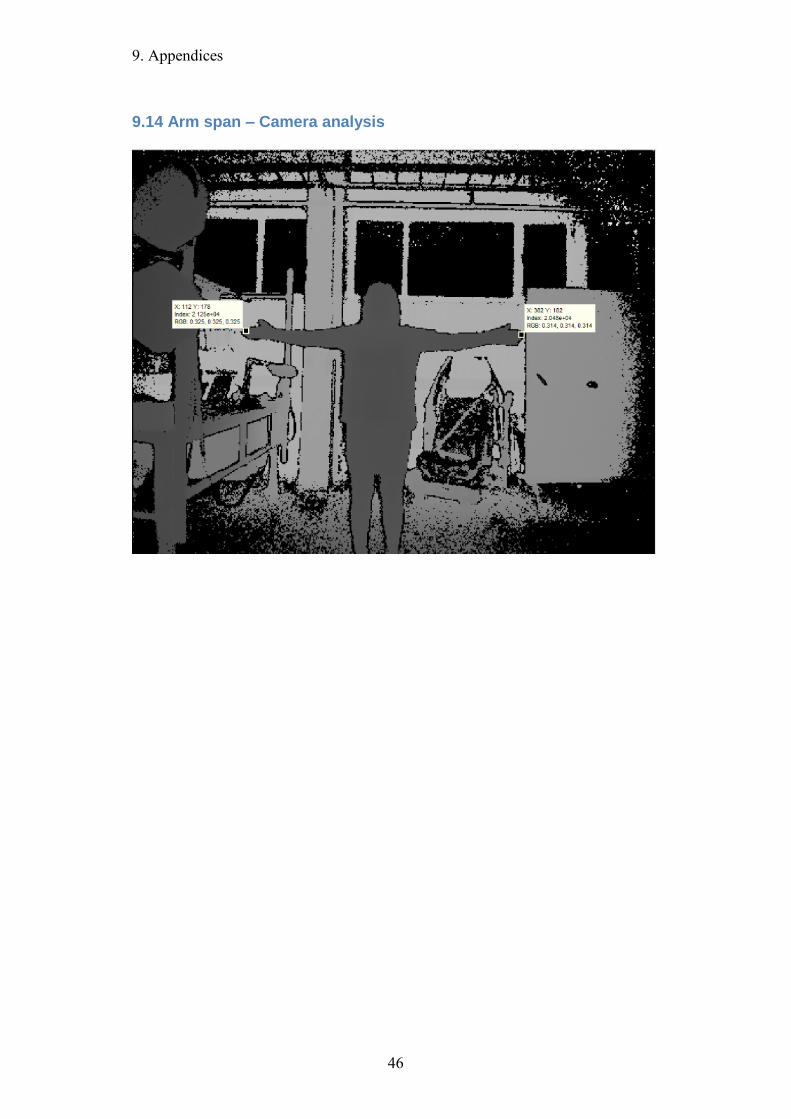
For arm span, the images were analysed when the test subjects had their arms
straight out parallel to the floor. Points were placed on the tip of the left middle
finger to the tip of the right middle finger (se appendix 14).
For humerus length the same image was used but the points were placed on the
vertical diameter of the humeral head to the humeral lateral epicondyle (see
appendix 15). The ulna length was also taken from the same image with the two
points now placed between the proximal end of ulna (Olecranon process) and the
distal end (tip of the styloid process) (see appendix 16). The head width was

3. Implementation
12
measured in images with the test subjects face forward and points were placed
between the most lateral points of the parietal bones (see appendix 17).
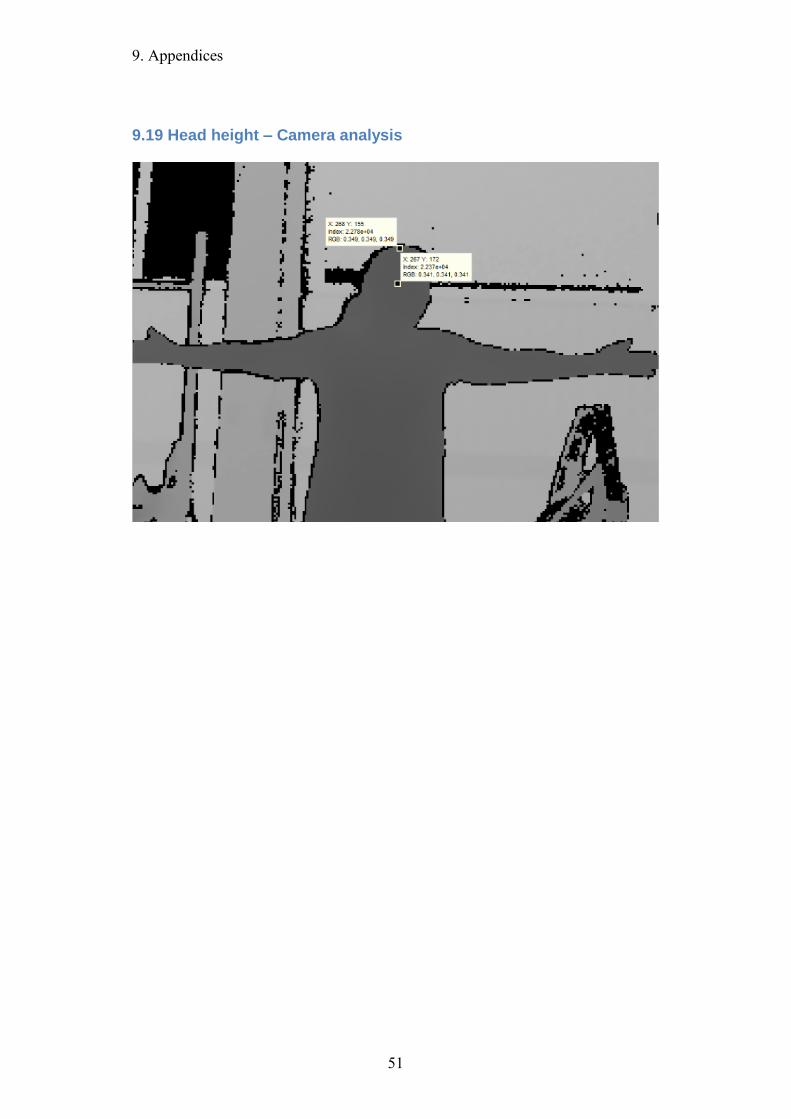
The head length and head height was measured with the same images, when the
test subjects had their head rotated to the left or right. Images were chosen
depending on which image that showed best contours. Points were placed
between the Glabella (most prominent point on the forehead between the
eyebrows, above the nasal root) and the Opisthocranion point (the most
posteriorly protruding point on the back of the skull) for the head length (see
appendix 18). For head height the points were between the external acoustic
meatus (ear canal) and the highest point on the vertex of the head (see appendix
19).

4. Result
13
4. Result The goal was to find valid anthropometric methods for determination of human
height and weight from landmarks on the upper body, then test if it is possible to
perform these methods with the Kinect for Windows v2 sensor. In the following
text, the results are shown in graphs.
4.1 Weight As a result of the information research, the human body weight was hard to
estimate from body landmarks due to lack of information. There are a very small
amount of studies in this field of area (see table 4.1), some earlier studies have
been made but only on the lower extremities or with a full body view, which were
not possible in this study. No reliable method was found for estimating weight
from upper body landmarks therefor no testing could be done in this area.
Three studies were found from the information research in other areas of the
body:
Robbins, G., Sciulli, P. W. & Blatt, S. (2010). Estimating body mass in
subadult human skeletons. American journal of physical anthropology,
143(1), pag. 146-150.
De Groote, I. & Humphrey, L. T. (2011). Body mass and stature
estimation based on the first metatarsal in humans. American journal of
physical anthropology, 144(4), pag. 625-632.
Wlls, J. C. K., Treleaven, P. & Cole, T. J. (2007). BMI compared with 3-
dimensional body shape: The UK National Sizing Survey. American
Journal of Clinical Nutrition, 85(2), pag. 419-425. Table 4.1. Results for weight from the information research.
4.2 Height The result of height was more satisfying and 13 different methods were found for
measuring height from upper body landmarks (see table 4.2).
Table 4.2. Results for weight from the information research.

4. Result
14
4.2.1 Dummy measurements
The results of the physical measurements from the dummies (see graph 4.3)
showed that methods of arm measurement had the best accuracy, results of head
measurements were not as convincing with equal or higher levels of bad accuracy.
Graph 4.3. Results from the dummy test.
4.2.2 Pilot study
From the pilot study (see graph 4.4), the results showed that methods with
measurements of arm span (*1, *2, *3) and ulna length (*5) provided with the
most accurate height while none of the methods from the head were predominant
of results within the range of ±5cm.
Head breadth (*7), head circumference (*9), head length (*10) and head length
(*12) had an almost equal level of good and bad results.
The least accurate methods were ulna length (*4), humerus length (*6), head
circumference + length (*8), head length (*11) and head height (*13). These
methods had a higher level of bad results than good.
Graph 4.4. Results from the pilot study.

4. Result
15
4.2.3 Measurement study
The results of the measurement study (see graph 4.5) showed similar results as the
pilot study but some methods differed in accuracy. For this measurement some
methods of the head also had predominant results within the range of ±5cm.
The most accurate methods of measurement were arm span (*1, *2, 3), ulna
length (5), further head breadth (*7), head circumference + length (*8) and head
length (*12 female) also had high levels of good accuracy.
Head circumference (*9), head length (*10) and head length (*11) had almost an
equal level of good and bad results.
Ulna length (*4), humerus length (*6), head length (*12 male) and head height
(*13) had the least accurate results with higher levels of bad results.
Graph 4.5. Result from the measurement study.
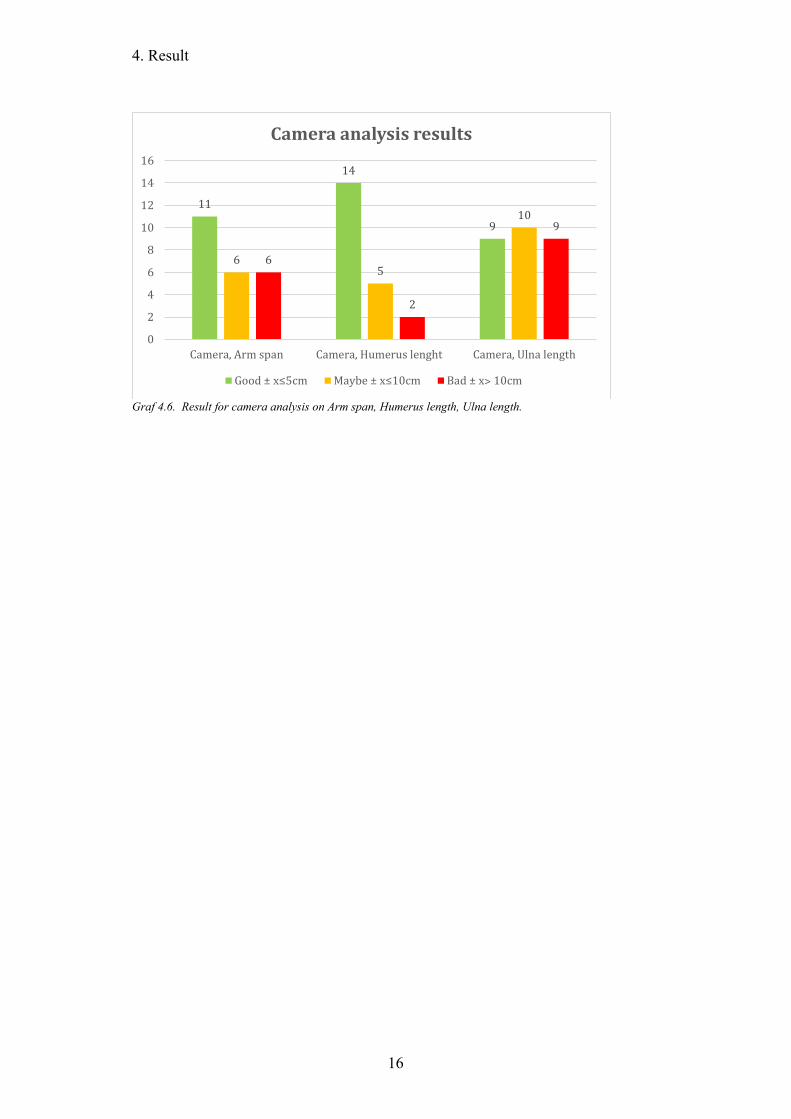
4.2.4 Camera analysis results
The result (see graph 4.6) shows how valid the camera captures the distance in
actual meter scale. The most accurate is clearly humerus length and arm span with
high level of good accuracy inside the ±5cm range.
Ulna length did not showed good results in the camera analysis and had very
inconsistent data, the distances are of equal level.
4. Result
16
Graf 4.6. Result for camera analysis on Arm span, Humerus length, Ulna length.
11
14
9
6 5
10
6
2
9
0
2
4
6
8
10
12
14
16
Camera, Arm span Camera, Humerus lenght Camera, Ulna length
Camera analysis results
Good ± x≤5cm Maybe ± x≤10cm Bad ± x˃ 10cm
5. Discussion
17
5. Discussion
5.1 Discussion of results In the following sections the results are discussed.
5.1.1 Weight
Due to lack of information, methods of calculating weight from upper body
landmarks weren’t found. There were no hits on the information research focusing
on estimating human body weight from the upper body. The area of measurement
appears to be too narrow and maybe on the wrong part of the body. Some studies
were found but focused on the lower part on the body or needed a full body vision
for analyzing.
In the field of forensic research some studies have been made to estimate body
mass from skeleton bones of human cadavers.
One study by Robins, Sciulli & Blatt (2010) provided a set of equations of
estimating body mass on young adults by measuring the femoral midshaft. This
article however only focused on skeleton measurements of children and young
adult in the ages 0 to 17 years old and these methods would be difficult to apply
on living humans. It also mentions the difficulties of estimating body mass
depending on the people’s activity level and diet. Nevertheless it can give a hint
of body mass under the right circumstances with a good camera view/angle and
that the occupant is of normal weight.
Another study by Groote & Huphrey (2011) studied the estimation of body mass
based on the first metatarsal bone in a human foot. They also said that the most
accurate way to estimate body mass and stature are using femur head diameter
and femur length. This method was performed on skeleton bones, not living
humans and would not be suited for body mass estimation on occupants. It would
also be difficult to use because all occupants would need to be barefoot in order to
do the measurements.
Other studies that have been made are in the area of body shapes and BMI-
correlation.
The study from Wells, Treleaven & Cole (2006) tried to find a relationship in a
person’s body shape and BMI (Body mass index) by using 3D-body scanning.
The study revealed that the relationship between BMI and body shape differed
between male and female sexes and that BMI was associated with chest and waist
in male and with hips and bust in female sexes.
Body shapes correlating to BMI (Body Mass Index) could be used to estimate the
body mass. The formula of calculating BMI contains both weight and height of a
person and could easily be calculated through this formula. The problem is that
even though a BMI was estimated there are possible errors with this method.
Occupants could have large clothing that appear to enlarge the occupants body
size, also a person’s body shape doesn’t have to indicate a certain weight due to
5. Discussion
18
body composition. A person with an athlete figure could have a larger BMI due to
a large amount of muscles (Neville et al., 2006).
The result of these articles shows that it is most likely hard to apply these methods
in this field of are with camera measurements, More cameras are needed in
positions covering a full body view in order to go further with methods in this
area. There would be more reliable to use the current weight sensor in the
occupant seat.
5.1.2 Height
In the information research the search results was narrow and only a limited
amount of articles were presented within the area of estimating height from
landmarks of the upper body. After reading several articles a pattern appeared
where the authors cited each other, this indicates and confirms a narrow search
area where more research are welcome in the future.
5.1.2.1 Physical measurements analysis Among the found articles, several were in the field of forensic investigations and
because of that the methods were designed for measurements on deceased people,
which made some methods harder to use. One example is the study by Menéndez
Garmendia et al. (2014) where measurements of the long bones were performed
on corpses. This method was one of the methods used in this study but since the
test subjects were alive the long bones couldn’t be measured in the same way as
the reference study. Therefor the measurement results may differ in accuracy
compared to the accuracy in the article. Another method also used in this study
was by Chiba & Terazawa (1998), this method was used to estimate stature from
the skulls of Japanese cadavers. Here also the results may differ in accuracy due
to the differences in size between a skull without the skin and flesh and a head of
a living person.
Most methods in this study were taken from article studies made on a specific
population, mainly from Asia and South America and many of them writes that
the developed methods may not work on other populations due to differences in
height and shapes. These measurements where performed on people with mostly
northern European origin and when looking at the result, that may be a correct
conclusion for the head measurements where no method stood out strong like
measurements on arm span and ulna. An hypothesis is that the dimensions of the
head varies more than the arms in different populations.
When analyzing the correlation between the measurements of dummies and
humans the results go hand in hand. Due to this a conclusion can be made that the
dimensions of the dummies corresponds to reality.
Looking at the results between the pilot- and the measurement study (see graph
5.1, 5.2 & 5.3) some similarities are visual even if there were less test subjects in
the pilot study. In every graph the lines follow each other reasonably which
indicates that the measurement methods have good reliability.

5. Discussion
19
Graph 5.1. Comparison of results with good accuracy between the pilot- and the measurement study.
The vertical axis represents the percentage of good measurements and the horizontal axis represents
the different methods.
Graph 5.2. Comparison of results with less accuracy between the pilot- and the measurement study.
The vertical axis represents the percentage of good measurements and the horizontal axis represents
the different methods.

5. Discussion
20
Graph 5.3. Comparison of results with bad accuracy between the pilot- and the measurement study.
The vertical axis represents the percentage of good measurements and the horizontal axis represents
the different methods.
5.1.2.2 Camera measurement analysis The comparison between the camera analysis and the actual physical
measurements (see graph 5.4, 5.5 and 5.6) shows that the values are quite valid
for arm span, humerus length and ulna length. The line charts shows positive
results with a difference index no more than 2 cm. The distance between the
camera and the test subjects was measured up to 2 m, and the camera analysis
conformed this depth in the 3D-images. However due to bad results in the
physical humerus length methods, these can be excluded. This means that arm
span and ulna length are methods worth taking forward. All the head
measurement cloud not be analysed with the camera because no y-coordinates
data could be converted in Matlab. Assistance from a software expert in the area
of field could not help.
Graph 5.4. Results from difference between camera humerus length and actual humerus length.
0,1
0,15
0,2
0,25
0,3
0,35
0,4
0,45
0,5
1 2 3 4 5 6 7 8 9 10 11 12 13 14 15 16 17 18 19 20 21
Camera results, Humerus length
Camera, Humerus lenght Actual Humerus lenght

5. Discussion
21
Graph 5.5. Results from difference between camera ulna length and actual ulna length.
Graph 5.6. Results from difference between camera arm span and actual arm span.
5.2 Discussion of implementations The methods used during this project were of great importance to meet the aim
and goals of the project. At the start of the project it took much time for the
participants to familiarise themselves with the needed equipment and get practice
and experience to apply and use the methods.
In the beginning of the project participants had to get familiar and do research to
know how the Kinect camera and SDK 2.0 software worked, so later knowing
how to use the video recordings of the body measurement and movement. Autoliv
provided the Kinect camera, which was preinstalled in the hood of the test car and
a computer for the SDK 2.0 software which was used in there on facilities.
0,1
0,15
0,2
0,25
0,3
0,35
0,4
1 2 3 4 5 6 7 8 9 10 11 12 13 14 15 16 17 18 19 20 21 22 23 24 25 26 27 28
Camera results, Ulna length
Camera, Ulna length Actual Ulna lenght
1,2
1,3
1,4
1,5
1,6
1,7
1,8
1,9
2
2,1
1 2 3 4 5 6 7 8 9 10 11 12 13 14 15 16 17 18 19 20 21 22 23 24
Camera results, Arm span
Camera, Arm span (m) Actual Arm span

5. Discussion
22
However, much time was spent finding personnel that could upgrade the
computer to Windows 8.0 because the SDK 2.0 did not work in later Windows
versions.
Some of the article studies are done on specific populations, manly Asians. This
could have a negative effect on the resulting measuring data do due different
populations have different anthropometric structures. It is proven that ethnic
differences may vary from each other either in overall size in both in structure or
weight and body dimensions. The most characteristic ethnic difference is height,
For example, previous studies have shown that the ratio of sitting height
(measured from the seat surface) for Japanese population is larger than for white
north Europeans or for blacks (Pheasant, 2006)
During the physical measurement studies methods were applied to resemble the
methods in the different articles. This was done to get a more accurate data that
later could be compared to see how consistent the article methods were. To get
more consistent data the same measuring instruments, which were used in the
article studies had to be applied in the projects studies. Some of the methods could
not be performed precisely as the article studies due to lack of similar instrument
and time pressure. The test subjects were employees at Autoliv with tight
schedules therefore the measurement study was remained within the timeframe of
fifteen minutes, adjustments and other methods had to be applied to achieve these
requirements.
For example, one study used a Leicester height measure portable stadiometer
(Madden, 2011) to measure height which gives a more accurate measurement, this
was compensated with recording the measured height three times to determine
test-retest reliability.
Arm span was measured according to the articles by positioning the test subject
back against the wall with their arms spread against the wall at shoulders level
parallel to the floor with palms facing forward (Brown, 2002). This method was
done similar but instead of spreading their arms against the wall a whiteboard was
used so the arm span could be marked and then measured with a measuring steal
tape. Height was measured in the same way, this method saved time when two
measurements could be taken at the same time.
Also many of the article methods used an anthropomter (Gauld, 2014) to measure
ulna length but in the project methods a Vernier calliper worked quite as well to
get a valid measurement.
For measuring head length and breadth a bow calliper was used. Due to shape
edges the measuring was difficult to get precise values for precaution of the test
subjects. After using the bow calliper to get head length and breadth a Vernier
calliper was used to measure the distance.

5. Discussion
23
The camera analysis phase could have been improved if the project participants
had more knowledge of the Matlab software and its functions, for example the
data cursor tool and the Kinect2PixelToCam converter. A source of error was that
the grey-scale 3D images did not give a very clear picture. Due to clothing, hair
and other accessories in the images body parts could appear larger than they
actually are. This made the placement of the two points with the data cursor tool
limited to measure at an approximate perceptiveness.
5.3 Critical review By doing the final thesis with a large company the project participants have
gained greater insights of the work as an engineer in real life. In this thesis
knowledge obtained during the Biomechanical engineer programme have ben
used. The emphases of the work have been in areas of ergonomics, measurement
technology, mathematics and human anatomy, which are a large part of this
education.
New areas of knowledge have also been encountered on executing a study and
doing a thorough pre-study in the development process, also by working in new
programs that hasn’t been used earlier in the education. A deeper understanding in
the information research process has been obtained for future studies.
In this study no consideration has been taken in to economic-, environmental- and
working environmental aspects.
5.3.1 Ethical consideration
Due to research involving human subjects there are always ethical issues that
needs to be taken in consideration. The project participants have there for chosen
not show faces of mention names of test subjects participating in the physical
measurement studies, this is to protect and respect their privacy.
5.3.2 Social aspects
Because of the work that Autoliv is doing and always put safety first in peoples
everyday living when driving a car social aspects are very important. When
working with development of safety features it always comes down to meet the
people’s needs. This study is based on the needs, i.e. of lower the insurance costs
as well as making the driving safer to the occupants in the vehicle depending on
occupant size.
5.4 Discussion and recommendation of further work
5.4.1 Sensors
The information research showed no finding studies that predicts estimated
weight through various upper body landmark. This means that other alternatives
should be taken in consideration. One method could be to have built in sensors
under the passenger seats, which already exists in many car systems today. That
would give a total weight of the occupants and by letting it co work with other
detection systems, can give more accurate data.

5. Discussion
24
5.4.2 Camera placement
The current positioning of the camera gives a full frontal view and after analysing
given images show that it will be difficult to get an approximate measurement
data for arm span, humerus length or ulna length. This means that another camera
position should be taken in consideration. A possible alterative can be to install
the camera above the rear-view mirror as seen in figure 5.7. This will give a lager
side view and make it easier to track the upper extremity. But this means that a
smaller camera must be used as the Kinect camera is too big, or maybe thinking
over the possibility of installing two cameras inside the vehicle.
Figure5.7. (Farmer, 2007).

6. Area of responsibility
25
6. Area of responsibility In this final thesis the work has been divided as equal as possible with some
individual parts for efficiency. In the written report all parts have been written
together and the project participants have supplemented each other in every
chapter.
The measurements were divided in to two responsibilities, Nadim performed all
the physical measurements and compiled the camera-recorded data, and Frida
performed the camera measurements, wrote down and compiled all the physical
measurement data.

7. Conclusion
26
7. Conclusion The project results show that it is possible to get an estimated height of
measurements from arm span and ulna length. The humerus length and all the
head measurements show very insufficient data, and estimated weight is not an
alternative because no found studies suggest that it is possible. The dimensions of
the dummies gives according to the results and in comparison to reality valid data,
which strengthens the methods, used during this project.
The camera analysis shows good and valid data from both arm span and humerus
length but unfortunately not for the ulna length. But due to bad test results in the
early physical measurements for humerus length, could this not be used. When the
occupants are seated inside the vehicle in a regular passenger position, the camera
had very limited vision to see arm span and ulna length as seen in figure 7.1.
However the data that was converted from the standing images gave valid
accuracy, which gives good potential if a move advanced camera was applied.
Figure7.1.
In conclusion, this option is not the best method to discriminate the human height
and weight inside a vehicle. To make the ODS project possible a different
positioning of the camera should be taken in consideration. It’s positioning at the
moment does not give the most optimum field of view to get the valid data needed
for collecting information of arm span and ulna length. In this thesis the project
group consider the aim of thesis fulfilled on height but not on weight because of
the lack of research results.

8. References
27
8. References
8.1 Book references
Dukkipati, R. V. (2010). MATLAB: An introduction with applications. [e-
book]. New Delhi:New age international. Available from: Ebrary,
Halmstad university library http://www.hh.se/bibliotek (downloaded 8
May 15).
Hägg, G. M., Ericson, M. & Odenrick, P. (2011). Fysisk belastning.
Bohgard, M., Karlsson, S., Lovén, E., Mikaelsson, L-Å., Mårtensson, L.,
Osvalder, A-L., Rose, L. & Ulfengren, P. (Red). Arbete och teknik på
människans villkor. 2:1 ed. Solna: Prevent.
Karlsson, S., Osvalder, A-L., Rose, L., Eklund, J. & Odenrick, P. (2008).
Utvecklingsprocesser. Bohgard, M., Karlsson, S., Lovén, E., Mikaelsson,
L-Å., Mårtensson, L., Osvalder, A-L., Rose, L. & Ulfengren, P. (Red).
Arbete och teknik på människans villkor. 1:1 ed. Solna: Prevent.
Kent, M. (2006). The Oxford dictionary of sports science & medicine. [e-
book]. 3 ed. Oxford: Oxford University Press. Available from:
http://www.oxfordreference.com/view/10.1093/acref/9780198568506.001.
0001/acref-9780198568506-e-371 (downloaded 10 May 2015).
Martin, E. A. (2010). Concise Medical Dictionary. [e-book]. 8 ed. Oxford
University Press. Available from:
http://www.oxfordreference.com/view/10.1093/acref/9780199557141.001.
0001/acref-9780199557141-e-11104 (download 10 May 2015).
Pheasant, S & Haslegrave, C. M. (2006). Bodyspace: anthropometry,
ergonomics and design of work. 3 ed. London: Taylor & Francis.
Roebuck, J.A. (1995). Anthropometric methods: designing to fit the human
body. Santa Monica: Human Factors and Ergonomics Society.
Ullman, D. G. (2010). The mechanical design process. 4 ed. Singapore:
MC.
8.2 Article references
Brown, J. K., Whittemore, K. T. & Knapp, T. R. (2000). Is arm span an
accurate measure of height in young and middle-age adults?. Clinical
Nursing Research, 9(1), pag. 84-94.
Brown, K.J., Feng, J.Y., Knapp, R.T. (2002). Is self-reported height or arm
span a more accurate alternative measure of height?, Clinical Nursing

8. References
28
Research 11(4), page. 417-432.
Chiba, m., Terazawa, K. (1998). Estimation of stature from somatometry
of skull. Forensic Science International 97(2), pag. 87-92.
De Groote, I. & Humphrey, L. T. (2011). Body mass and stature
estimation based on the first metatarsal in humans. American journal of
physical anthropology, 144(4), pag. 625-632.
Farmer, M. E., Jain, A. K. (2007). Smart Automotive Airbags: Occupant
Classification and Tracking. IEEE Transactions on vehicular technology,
56(1), pag. 60-80.
Gauld, L. M., Kappers, J., Carlin, J. B & Robertson, C. F. (2004). Height
prediction from ulna length. Developmental Medicine and Child
Neurology, 46(7), pag. 475-480.
Ilayperuma, I. (2010). On the prediction of personal stature from cranial
dimensions. International journal of morphology 28(4), pag. 1135-1140.
Krishan, K. (2008). Estimation of stature from cephalo-facial
anthropometry in nort Indian population. Forensic science international
181(1), pag. 51.e1-52.e6.
Madden, A.M., Tsikoura, T., Stott, S.J. (2011). The estimation of body
height from ulna lenght in healthy adults from different ethnic groups.
Journal of human nutririon and dietetics. 25, 121-128.
Nayak, R., Padhye, R., Sinnappoo, K., Arnold, L. & Behera, B. K. (2013).
Airbags. Textile progress, 45(4), pag. 209-301.
Neville, A. M., Stewart, A. D., Olds, T. & Holder, R. (2006). Relationship
between adiposity and body size reveals limitations of BMI. American
journal of physical anthropology, pag. 151-156.
Patil, K.R., Mody, R.N. (2005). Determination of sex by discriminant
function analysis and stature by regression analysis: alateral cephalometric
study. Forensic science international 147(2), pag. 175-180.
Robbins, G., Sciulli, P. W. & Blatt, S. (2010). Estimating body mass in
subadult human skeletons. American journal of physical anthropology,
143(1), pag. 146-150.
Wells, J. C. K., Treleaven, P. & Cole, T. J. (2007). BMI compared with 3-
dimensional body shape: The UK National Sizing Survey. American

8. References
29
Journal of Clinical Nutrition, 85(2), pag. 419-425.
Van Teijingen, E. Hundley, V. (2002). The importance of pilot studies.
Nursing standard, 16 (40), pag. 33-36.
8.3 Electronic references
Autoliv. (2015). Airbags – Woven protective shields [Online].
Available from:
http://www.autoliv.com/ProductsAndInnovations/PassiveSafetySystems/P
ages/Airbags/default.aspx (downloaded 7 May 2015).
Cox, W. A. (2010). Anthropologic landmarks of the skull measurements
and indices [Online].
Available from:
https://forensicmd.files.wordpress.com/2010/05/anthropologic-landmarks-
skull.pdf (downloaded 11 May 2015).
Craftmanspace. (2015). Calipers – measuring tools [Online].
Available from:
http://www.craftsmanspace.com/knowledge/calipers-measuring-tools.html
(downloaded 8 May 2015).
Humanetics. (2015). Crash test dummies [Online].
Available from:
http://www.humaneticsatd.com/crash-test-dummies (downloaded 18 Mars
2015).
Humanetics. (2015). Hybrid III 5th Female Dummy - 880105-000-H
[Online].
Available from:
http://www.humaneticsatd.com/crash-test-dummies/frontal-impact/hybrid-
iii-5th (downloaded 18 Mars 2015).
Humanetics. (2015). Hybrid III 50th Male Dummy [Online].
Available from:
http://www.humaneticsatd.com/crash-test-dummies/frontal-impact/hybrid-
iii-50th (downloaded 18 Mars 2015).
Humanetics. (2015). Hybrid III 95th Large Male Dummy [Online].
Available from:
http://www.humaneticsatd.com/crash-test-dummies/frontal-impact/hybrid-
iii-95th (downloaded 18 Mars 2015).
Högskolan i Skövde. (2011). Antropometriräknare [Online].
Available from:

8. References
30
http://antropometri.se/calc.php (downloaded 12 May 2015).
IBM Corporation. (2011). IBM SPSS Statistics 20 Core System User´s
Guide [Fact Sheet].
Available from:
http://www.csun.edu/sites/default/files/statistics20-core-system-guide-
32bit.pdf (downloaded 6 May 2015).
Microsoft. (2015). Human interface guidelines [Data sheet].
Available from:
http://www.microsoft.com/en-us/kinectforwindows/develop/downloads-
docs.aspx (downloaded 6 May 2015).
Nationalencyklopedin. (2015). Måttband [Online].
Available from:
http://www.ne.se/uppslagsverk/encyklopedi/lång/måttband (downloaded 8
May 2015).
Nationalencyklopedin. (2015). Skjutmått [Online].
Available from:
http://www.ne.se/uppslagsverk/encyklopedi/lång/skjutmått (downloaded 8
May 2015).
Nationalencyklopedin. (2015). Vattenpass [Online].
Available from:
http://www.ne.se/uppslagsverk/encyklopedi/lång/vattenpass (downloaded
8 May 2015).
Neteberg. (2015). Digital spirit leveland angle gaugelimit [Online].
Available from:
http://www.neteberg.eu/en/digital-spirit-level-and-angle-gauge-limit-
1.html (downloaded 8 May 2015).
Nilsson, B. (2004). Något om Vektorer och Mathmatica. HH/IDE/BN
[Online]. Available from:
http://dixon.hh.se/bertil/Kurser/Common/AppliedMath/Notes/vectorNotes.
pdf (downloaded 18 May 2015).
Paine, D., Paine, M., Brown, J., Bilston, L., Royal Automobile Club of
Victoria (RACV) Ltd (2013). Child Restraints and Airbags. [Data sheet].
Availble from:
https://www.racv.com.au/wps/wcm/connect/3b4e3bac-fb19-4b6b-8975-
5bb35247261f/RACV-child-restraints-and-airbags-
report.pdf?MOD=AJPERES&CACHEID=3b4e3bac-fb19-4b6b-8975-
5bb35247261f (downloaded 11 May 2015).

8. References
31
The Mathworks. (2015). Display Data Values Interactively. [Online]
Available from:
http://se.mathworks.com/help/matlab/creating_plots/data-cursor-
displaying-data-values-interactively.html (downloaded 19 May 15).
Transportstyrelsen. (2015). Nationell statistic [Online].
Available from:
http://www.transportstyrelsen.se/sv/vagtrafik/statistik-och-
register/Vag/Olycksstatistik/Polisrapporterad-statistik/Nationell-statistik/
(downloaded 2 April 2015).

9. Appendices
32
9. Appendices
9.1 SWOT In the very beginning of the study a SWOT-analysis was made. This method was
used to evaluate the strengths, weaknesses, opportunities and threats of the project
Strengths
• Knowledge in anatomy/ergonomics
• Private laboratory with equipment
• Supervisor from both the school and
the company
• All the expertise and recourses within
the company
• Many studies within the area of
anthropometry
• Financial support from the company
Weaknesses
• Risk of not finishing the project
in time
• Necessary information available?
• The equipment may not work as
supposed
• No knowledge in
programming/Matlab
Opportunities
• Employment after the degree
• Increased knowledge in measurement
technologies
• Increased knowledge in automotive
safety
• Establish new contacts
Threats
• Big company – resources take
time
• Small part of a larger pre-study,
difficult to frame the smaller
project
• Many uncertainties within the
larger project group
• Enough support from the larger
project group?
• Too high/low requirement?
• How is biomechanics applied in
to the project?

9. Appendices
33
9.2 External dimensions Hybrid III 5th female dummy
9. Appendices
34
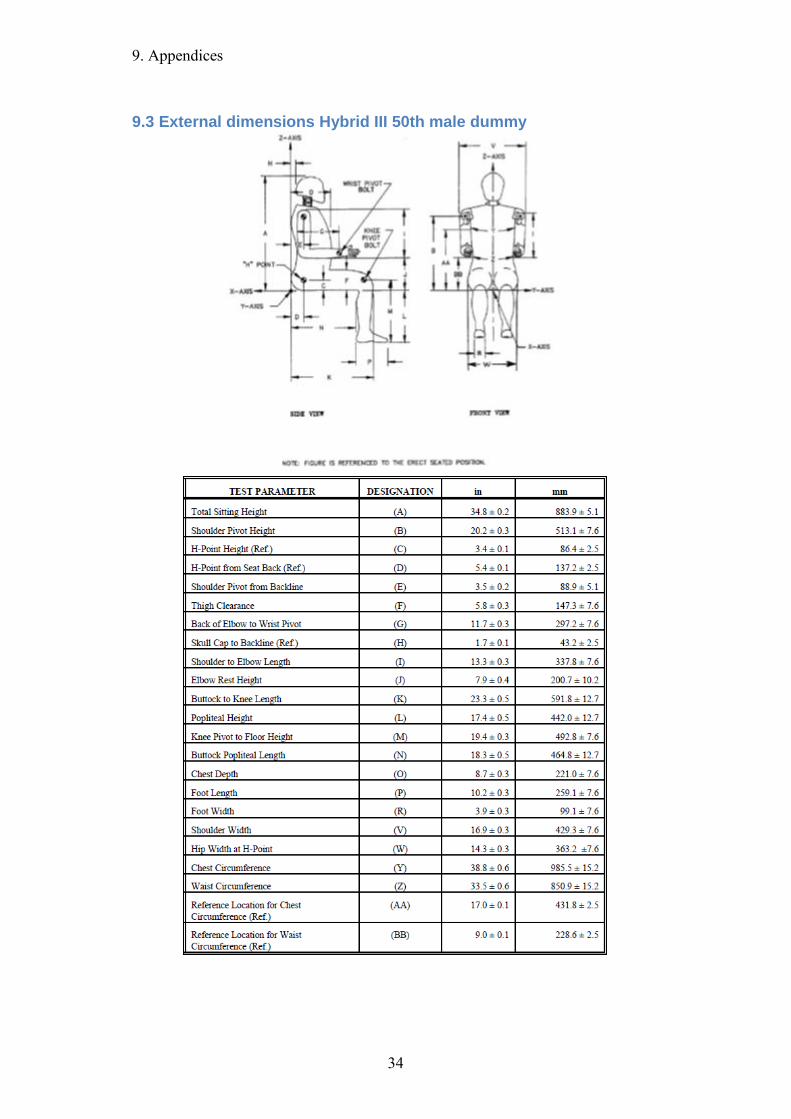
9.3 External dimensions Hybrid III 50th male dummy

9. Appendices
35
9.4 External dimensions Hybrid III 95th male dummy

9. Appendices
36
9.5 Measurement methods

9. Appendices
37
9.6 Arm span
Arm span (Brown et al., 2000)

9. Appendices
38
9.7 Skull frontal view
Skull frontal view (Cox, 2010).

9. Appendices
39
9.8 Skull lateral view
Skull lateral view (Cox, 2010)

9. Appendices
40
9.9 Ulna
Measurements on ulna (Gauld et al., 2004).

9. Appendices
41
9.10 Humerus

9. Appendices
42
9.11 Dummy measurement compilation
9. Appendices
43
9.12 Pilot study compilation

9. Appendices
44
9.13 Measurement study compilation

9. Appendices
45
9. Appendices
46
9.14 Arm span – Camera analysis

9. Appendices
47
9.15 Humerus – Camera analysis

9. Appendices
48
9.16 Ulna – Camera analysis

9. Appendices
49
9.17 Head breadth – Camera analysis

9. Appendices
50
9.18 Head length – Camera analysis
9. Appendices
51
9.19 Head height – Camera analysis

PO Box 823, SE-301 18 HalmstadPhone: +35 46 16 71 00E-mail: [email protected]
Frida and Nadim has studied togetherat Halmstad University in theprogramme Biomechanical engineerorientation human - tech.