Decisional Tools for Enabling Successful Manufacture and ...
310
1 Decisional Tools for Enabling Successful Manufacture and Commercialisation of Cell Therapy Products Thesis submitted to University College London for the degree of Doctor of Engineering (EngD) in Biochemical Engineering By Tania D. Pereira Chilima, BEng (Hons), MRes The Advanced Centre for Biochemical Engineering Department of Biochemical Engineering UCL Torrington Place London WC1E 7JE September 2018
Transcript of Decisional Tools for Enabling Successful Manufacture and ...

1
Decisional Tools for Enabling Successful Manufacture
and Commercialisation of Cell Therapy Products
Thesis submitted to University College London for the degree of
Doctor of Engineering (EngD) in Biochemical Engineering
By
Tania D. Pereira Chilima, BEng (Hons), MRes
The Advanced Centre for Biochemical Engineering
Department of Biochemical Engineering
UCL
Torrington Place
London
WC1E 7JE
September 2018

2
I, Tania Doroteia Pereira Chilima confirm that the work presented in this thesis is my
own. Where information has been derived from other sources, I confirm that this has been
indicated in the thesis

3
To my loving mother,
for being my inspiration

4
Abstract
Cell therapy products offer the potential for treatment and possibly cure of a number of
indications, such as cancer, diabetes and heart disease. However, a number of economic,
regulatory, logistical and technical challenges need to be addressed so as to achieve
successful commercialisation of cell therapy products. With more cell therapy products
reaching commercial stage, there is an increased interest in developing and evaluating
novel manufacturing strategies to enhance cost-effectiveness while accommodating the
unique features of cell therapy products. This thesis aims to develop and apply advanced
decisional tools so as to provide an integrated approach that offers valuable insights to
some of the dominant challenges faced by cell therapy developers.
The decisional tools developed in this thesis comprise the following models tailored to
cell therapy products: a technology-specific detailed factorial method for fixed capital
investment (FCI) estimation, a process economics model for computing cost of goods
(COG), brute force optimization, a multi-attribute decision making model, a robustness
analysis model and a risk-adjusted net present value model. A key novel contribution is
the detailed factorial methodology for estimating FCI and footprint for bespoke cell
therapy facilities that accounts for technology-specific factors for key manufacturing
platforms as well as the implications of single-use technologies and open versus closed
operations. This is used to derive benchmark values for short-cut Lang factors for typical
cell therapy facilities according to the technologies and commercialisation scenario
selected.
A set of industrially-relevant case studies is presented for topical cell therapies, namely
mesenchymal stem cell (MSC) therapies and chimeric antigen receptor (CAR) T-cell
therapies. The case studies explored different aspects of the manufacturing strategy of
5
cell therapy products such as optimal technology selection, process robustness,
performance targets for successful commercialisation, fixed capital investment
requirement, the cost benefits of allogeneic cell therapy products with respect to
autologous cell therapy products and the effect of decentralised multi-site manufacture of
autologous products. In particular, the MSC case study provides a more holistic approach
to evaluating different technologies that considers both financial and operational features.
The CAR T-cell case study provides the first in-depth economic analysis and set of
insights at both the technology level and an enterprise’s facility configuration level. The
work in the thesis illustrates how the decisional tools developed can facilitate the design
of cost-effective manufacturing strategies for cell therapy products.

6
Impact Statement
Decisional tools have been successfully employed in providing some useful insights to
the critical questions facing biopharmaceutical companies when bringing new products
to market. This thesis extended the creation and use of decisional tools to tackle some of
the challenges faced by cell therapy companies, by addressing topics related to technology
selection, reimbursement constrains and facility configuration. The insights gained from
the tools can help cell therapy developers make the right decisions in multiple aspects of
the manufacturing strategy early on within process development. Doing so will allow
companies to save time and money though allocating their development efforts and
capital investment to the most profitable solutions. Moreover, identifying the optimal
manufacturing strategy will also decrease the manufacturing cost of goods, which will
increase the commercial feasibility of novel cell therapy products and help relieve the
economic strain that has been put onto our healthcare system.
The potential of the work described in this thesis has been recognised by several industry
experts that were involved in sponsoring the research. Matthieu Egloff (ex-Pall Life
Sciences; currently Co-founder and Marketing Architect at OUAT Life Science, Brussels,
Belgium) stated that “The commercial scale manufacture of cell therapy products at
affordable costs is clearly linked to our ability to identify, develop and implement smart
engineering and process solutions early on within the process development. Tania's
works clearly illustrates how computer-aided methods can be used to identify the possible
bottlenecks within the manufacturing strategy of cell therapy products as well as ways to
tackle these challenges such as to achieve appropriate strategies for sustainable
manufacture of cell therapy products”. This was reinforced by a statement by Fabien
Moncaubeig (ex-Pall Life Sciences; currently Co-founder and Consultant at BIP-partners,

7
Cugnaux, France) “It is a real challenge for start-ups or academics developing cell
therapy products to balance their economical and time constraints with their medical and
clinical expectations. Having cost models, case studies and predictive tools publicly
available is a real asset to make critical decisions regarding the process development
and long term manufacturing strategies as early as possible. This will help avoiding the
recent challenges faced by the latest approved therapies where reimbursement has been
denied by authorities (e.g. Alofisel, Takeda)”. Moreover, the potential of decisional tools
in enabling better decision-making in cell therapy manufacture was also recognised by
Clive Glover (Global Marketing Manager, Pall Corporation, NY, USA) though the
following statement “As cell and gene therapies become commercialized, understanding
the most efficient ways to manufacture these products will be extremely important.
Tania’s thesis provides important insights into how both allogeneic as well as autologous
therapies can be effectively manufactured while keeping efficiency and cost in mind as
well as revealing areas that require additional technology development. This type of
research can help cell therapy developers save time and money as it allows them to
evaluate different aspects of the manufacturing strategy early on within the process
development through the use of computer-based methods.”

8
Acknowledgements
Firstly, I would like to express my special gratitude to Prof. Suzy Farid for giving me the
opportunity of working in this project and for supporting me throughout my EngD
program. I would also like to give a big thank you to the members of my sponsor company
that were heavily involved in this project - Matthieu Egloff, Thierry Bovy, Fabien
Moncaubeig and Clive Glover for providing me with feedback and resources that really
enriched my EngD experience.
Moreover, I would also like to thank the Biochemical Engineering Department at the
University College London for providing me with the knowledge and resources to
undertake this doctorate program. Furthermore, I would like to gratefully acknowledge
the financial support from Engineering and Physical Sciences Research Council (EPSRC)
and PALL Life Sciences.
I also would like to express my eternal gratitude to my mother Sebastiana Pereira, for
singlehandedly supporting me throughout my life and transferring to me the values and
principles that made me that adult that I am today. I would also like to thank my siblings
Dalia and Carlos Pereira Chilima for being the best friends I could ever ask for. I would
like to thank my loving fiancé Christopher Lagelée for always supporting me and
encouraging me to peruse my dreams. I would also like to thank my two companions
(cats) Mathilda and Marcella Pereira-Lagelée for standing by me through the long
working days and nights.

9
Contents
Abstract ........................................................................................................................................ 4
Impact Statement ........................................................................................................................ 6
Acknowledgements ..................................................................................................................... 8
Contents ....................................................................................................................................... 9
List of Tables ............................................................................................................................. 13
List of Figures ............................................................................................................................ 15
Abbreviations ............................................................................................................................ 21
Chapter 1: Scope and Background.......................................................................................... 23
1.1 Introduction ..................................................................................................................... 23
1.2 Cell therapy overview ..................................................................................................... 24
1.2.1 Characteristics of cells used in cell therapy ........................................................... 25
1.2.2 Development pathway for cell therapies ................................................................ 28
1.2.3 Cell therapy market ................................................................................................. 32
1.2.4 Clinical trials landscape of cell therapies ............................................................... 38
1.3 MSC-based and CAR T-cell therapy products ............................................................ 42
1.3.1 MSC-based cell therapy products – characteristics, market and clinical trials . 42
1.3.2 CAR T-cell therapy products – characteristics, market and clinical trials ........ 46
1.4 Manufacturing process ................................................................................................... 53
1.4.1 Pre-cell culture steps ................................................................................................ 54
1.4.2 Cell culture ............................................................................................................... 57
1.4.3 Post-cell culture steps............................................................................................... 63
1.5 Technologies for cell therapy manufacture .................................................................. 64
1.5.1 Pre-cell culture technologies ................................................................................... 64
1.5.2 Cell culture technologies ................................................................................... 65
1.5.3 Post-cell culture technologies .................................................................................. 72
1.5.4 Integrated technologies ............................................................................................ 75
1.6 Challenges to commercialisation and future trends for CAR T-cell and MSC-based
cell therapy products ............................................................................................................ 75
1.6.1 Clinical performance ............................................................................................... 75
1.6.2 Adverse effects .......................................................................................................... 77
1.6.3 Manufacturing process and supply chain .............................................................. 78
1.6.4 COG and reimbursement ........................................................................................ 82
1.7 Cell therapy facilities ...................................................................................................... 82
1.7.1 Introduction to single-use technologies .................................................................. 82

10
1.7.2 Pros and cons of single-use facilities ....................................................................... 83
1.7.3 Single-use facilities in cell therapy .......................................................................... 85
1.7.4 Estimating costs in single-use facilities ................................................................... 90
1.7.5 Implementation of automation in cell therapy facilities ....................................... 94
1.7.6 Decentralised manufacture ..................................................................................... 96
1.8 Decisional tools ................................................................................................................ 98
1.8.1 Introduction to decisional tools & decisional tools in bioprocessing ................... 98
1.8.2 Decisional tools in cell therapies ............................................................................. 99
1.8.3 Computational methods ........................................................................................ 101
1.9 Aims and organisation of thesis ................................................................................... 105
Chapter 2: Materials and Methods ....................................................................................... 108
2.1 Introduction ................................................................................................................... 108
2.2 Tool architecture ........................................................................................................... 108
2.3 Technology-specific detailed factorial method for fixed capital investment estimation
.............................................................................................................................................. 111
2.3.1 Method overview .................................................................................................... 111
2.3.2 Model overview ...................................................................................................... 112
2.4 Process economics model .............................................................................................. 122
2.4.1 Mass balance & equipment sizing ........................................................................ 123
2.4.2 COG ........................................................................................................................ 136
2.5 Brute force optimization ............................................................................................... 141
2.6 Multi-attribute decision-making .................................................................................. 143
2.7 Monte Carlo simulation model .................................................................................... 144
2.8 Net present value model ............................................................................................... 145
2.9 Data collection ............................................................................................................... 149
2.10 Conclusions .................................................................................................................. 150
Chapter 3: A novel Method for Estimating Facility Footprint and FCI............................ 151
3.1 Introduction ................................................................................................................... 151
3.2 Case study setup ............................................................................................................ 151
3.2.1 Validation of the detailed factorial methodology for estimating FCI and
footprint for bespoke cell therapy facilities .................................................................. 152
3.2.2 Capital investment and facility footprint for cell therapy facilities ................... 152
3.2.3 Estimating project-specific cost factor ................................................................. 153
3.2.4 Process overview .................................................................................................... 153
3.2.5 Key assumptions ..................................................................................................... 154
3.3 Results and discussion .................................................................................................. 158
3.3.1 Validating the fixed capital investment model .................................................... 158

11
3.3.2 Trends in facility footprint and capital investment for different manufacturing
platforms .......................................................................................................................... 160
3.3.3 Relationship between capital investment and facility footprint......................... 165
3.3.4 Key factors influencing the fixed capital investment and footprint of cell therapy
facilities ............................................................................................................................ 167
3.3.5 Evaluating costs and area factors ......................................................................... 170
3.3.6 Selecting a project specific cost factor .................................................................. 174
3.4 Conclusion ..................................................................................................................... 176
Chapter 4: Impact of Allogeneic Stem Cell Manufacturing Decisions on Cost of Goods,
Process Robustness and Reimbursement .............................................................................. 178
4.1 Introduction ................................................................................................................... 178
4.2 Case study setup ............................................................................................................ 179
4.2.1 Process overview .................................................................................................... 184
4.2.2 Key assumptions ..................................................................................................... 185
4.3 Results and discussion .................................................................................................. 188
4.3.1 Process economics analysis .................................................................................... 188
4.3.2 Operational characteristics of manufacturing platforms for mesenchymal stem
cell culture ........................................................................................................................ 194
4.3.3 Performance targets for successful commercialisation analysis ........................ 201
4.4 Conclusion ..................................................................................................................... 210
Chapter 5: Addressing the Challenges to Successful Commercialization of CAR T-cell
Therapies: Technology, Costs, Reimbursement and Supply Chain ................................... 212
5.1 Introduction ................................................................................................................... 212
5.2 Case study setup ............................................................................................................ 213
5.2.2 Key assumptions for autologous and allogeneic CAR T-cell process flowsheets
.......................................................................................................................................... 217
5.2.3 Key assumptions for different platforms for autologous CAR T-cell
manufacture ..................................................................................................................... 221
5.2.4 Key assumptions for commercial feasibility scenario of autologous CAR T-cell
products under current reimbursement constraints ................................................... 226
5.2.5 Key assumptions for multi-site manufacture scenario for patient-specific cell
therapy products ............................................................................................................. 226
5.2.6 Key assumptions for allogeneic versus autologous CAR T-cell therapy products
scenario ............................................................................................................................ 233
5.3 Results and discussion .................................................................................................. 234
5.3.1 Identifying and understanding current COG of autologous CAR T-cell therapy
products ........................................................................................................................... 234
5.3.2 Operational features of manufacturing platforms for autologous CAR T-cell
manufacture ..................................................................................................................... 240
5.3.3 Assessing the commercial feasibility of autologous CAR T-cell products ........ 244

12
5.3.4 Assessing the risk, reward and investment of different strategies for multi-site
manufacture of CAR T-cells .......................................................................................... 246
5.3.5 Assessing the cost-benefit of allogeneic versus autologous CAR T-cell
manufacture ..................................................................................................................... 249
5.4 Conclusions .................................................................................................................... 254
Chapter 6: Conclusions and Future Work ........................................................................... 256
6.1 Introduction ................................................................................................................... 256
6.2 A technology-specific detailed factorial method for estimating facility footprint and
FCI with benchmark cost and area factors for cell therapy facilities ............................ 256
6.2.1 Key contributions ................................................................................................... 256
6.2.2 Future work ............................................................................................................ 257
6.3 Impact of allogeneic stem cell manufacturing decisions on cost of goods, process
robustness and reimbursement .......................................................................................... 258
6.3.1 Key contributions ................................................................................................... 258
6.3.2 Future work ............................................................................................................ 259
6.4 Addressing the challenges to the successful commercialization of CAR T-cell
products ............................................................................................................................... 260
6.4.1 Key contributions ................................................................................................... 260
6.4.2 Future work ............................................................................................................ 262
Chapter 7: Process Validation in Cell Therapy ................................................................... 264
7.1 Introduction ................................................................................................................... 264
7.2 Validation challenges in cell therapy ........................................................................... 267
References ................................................................................................................................ 270
Appendix .................................................................................................................................. 308
Papers by the Author .............................................................................................................. 310

13
List of Tables
Table 1.1 Comparison between autologous and allogeneic cell therapy manufacture... 26
Table 1.2 Cell therapy products on the Market. Allo = Allogeneic, Auto = Autologous
......................................................................................................................................... 34
Table 1.3 Proliferation rate of CAR T-cells ................................................................... 59
Table 1.4 Examples of microcarriers available in the market ....................................... 70
Table 1.5 Example of downstream process technologies available in the market ......... 74
Table 1.6 Examples of current cell therapy facilities ..................................................... 87
Table 1.7 Cleanroom costs ($ per ft2) ............................................................................. 90
Table 1.8 Capital investment and footprint comparison between single-use and stainless
steel systems .................................................................................................................... 92
Table 2.1 Summary of the methods used to compute COG ......................................... 137
Table 3.1 Key characteristics of the manufacturing platforms studied in the FCI and
facility footprint case study ........................................................................................... 155
Table 3.2 Key case study assumptions for FCI and facility footprint evaluation ........ 156
Table 3.3 Ratio between the footprint of the different sections within a facility and the
footprint of the product manufacture area ..................................................................... 157
Table 3.4 List of equipment required per QC lab and their unit costs ......................... 158
Table 3.5 Cost factor breakdown for different hypothetical cell therapy facilities
producing 5,000 doses per year ..................................................................................... 172
Table 4.1 Key assumptions for MSC process economics case study .......................... 180
Table 4.2 Manufacturing platform-specific assumptions for the MSC case study ...... 182
Table 4.3 Assumptions for multi-attribute decision-making and stochastic cost analysis
....................................................................................................................................... 187
Table 4.4 Statistical data on COG/million cells and multi-attribute decision making
analysis for the competing technologies for low and high demand scenarios .............. 201
Table 5.1 Summary of the equations used to compute the different cost categories
included in the COG...................................................................................................... 215
14
Table 5.2 General assumptions used for computing the direct costs of CAR T-cell
products ......................................................................................................................... 220
Table 5.3 Manufacturing platform-specific assumptions for the CAR T-cell case study
....................................................................................................................................... 224
Table 5.4 General assumptions used to compute the indirect costs of CAR T-cell products
....................................................................................................................................... 225
Table 5.5 Key characteristics of the centralised and different multi-site facility
configurations ................................................................................................................ 229
Table 5.6 General NPV assumptions for facility configuration case study ................. 231
15
List of Figures
Figure 1.1 Development pathway of cell therapy products. Duration, stages, outcome
and investment. Adapted from Deans (2014) and Thomas et al (2015)……………….30
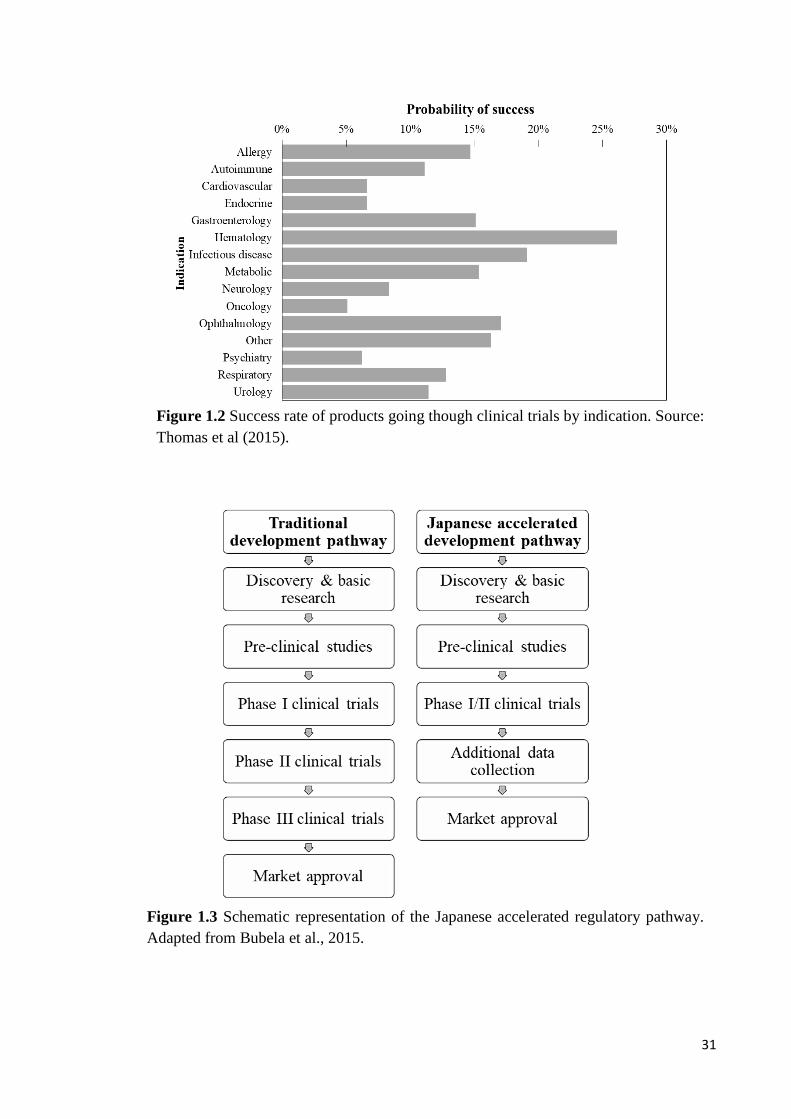
Figure 1.2 Success rate of products going though clinical trials by indication. Source:
Thomas et al (2015)…………………………………………………………………….31
Figure 1.3 Schematic representation of the Japanese accelerated regulatory pathway.
Adapted from Bubela et al., 2015……………………………………………………….31
Figure 1.4 Clinical trials by year. Adapted from Li et al (2014)………………………39
Figure 1.5 Clinical trials by indication comparison. Endocrine, Metabolic & Genetic
includes diabetes and renal diseases. Gastrointestinal includes Crohn’s disease and
ulcerative colitis. Inflammation, Immunology & non-malignant hematologic includes:
aplastic anaemia, systemic lupus, lupus Erythematosus, GVHD and non-malignant
haematological diseases. Musculoskeletal excludes rheumatology indications, includes
muscular dystrophy, ontogenesis imperfecta, bone and cartilage injuries and degenerative
disk disease. Neurological includes: spinal chord injury, brain injury, Parkinson's disease,
multiple sclerosis, Alzheimer’s and ALS. Rheumatology includes: Rheumatoid arthritis
and osteoarthritis. Sources: Alliance for regenerative medicine (2014), Heathman et al
(2015), Li et al (2014) and Martin et al (2009)…………………………………………..40
Figure 1.6 a) Clinical trials by cell type comparison b) clinical trials by phase c) clinical
trials by donor type. Sources: :Alliance for regenerative medicine (2014), Culme-
Seymour et al (2012), Heathman et al (2014), Li et al (2014) and Martin et al
(2009)………..………………………………………………………………………….41
Figure 1.7 MSC-based clinical trials by indication. Endocrine, Metabolic & Genetic
includes diabetes and renal diseases. Gastrointestinal includes Crohn’s disease and
ulcerative colitis. Inflammation, Immunology & non-malignant hematologic includes:
aplastic anaemia, systemic lupus, lupus Erythematosus, GVHD and non-malignant
haematological diseases. Musculoskeletal excludes rheumatology indications, includes
muscular dystrophy, ontogenesis imperfecta, bone and cartilage injuries and degenerative
disk disease. Neurological includes: spinal cord injury, brain injury, Parkinson's disease,
multiple sclerosis, Alzheimer’s and ALS. Rheumatology includes: Rheumatoid arthritis
and osteoarthritis. Sources: Chen et al (2016), Heathman et al (2015), Squillaro et al
(2016), Trounson et al (2015), Ullah et al (2015) and Wei et al (2013)………………..44
Figure 1.8 a) MSC-based clinical trials by year b) MSC-based clinical trials by phase c)
MSC-based clinical trials by cell source. Sources: Chen et al (2016), Heathman et al
(2015), Squillaro et al (2016) and Trounson et al (2015)……………………………….45
Figure 1.9 a) CAR T-cell-based clinical trials by year b) CAR T-cell-based clinical trials
by indication. Source: ClinicalTrials.gov……………………………………………….50

16
Figure 1.10 CAR T-cell based clinical trials by sponsor. Source:
ClinicalTrials.gov……………………………………………………………………....51
Figure 1.11 a) CAR T-cell-based clinical trials by donor source b) CART-cell-based
clinical trials by gene delivery method. c) CAR T-cell based clinical trials by phase.
Source: ClinicalTrials.gov……………………………………………………………..52
Figure 1.12 Schematic representation of manufacturing processes for MSC-based cell
therapies and CAR T-cell therapies…………………………………………………….53
Figure 1.13 Example of current facility costs breakdown. Sources: D. J. Brennan &
Golonka, 2002; Coulson & Richardson, 2005; Eibl R., 2010; Novais et al., 2001;
Pavlotsky, 2004; Peters & Timmerhaus, 1991; Petrides et al., 2015; Sinclair & Monge,
2005. SS = stainless steel, SU = single use……………………………………………..91
Figure 1.14 Key decisions, uncertainties, constraints and metrics when bringing a novel
cell therapy product to market. Adapted from Farid (2012)…………………………..103
Figure 2.1 Schematic representation of the integrated bioprocess economics tool. This
tool encompasses a database, a fixed capital investment model, a process economics
model coupled with brute force optimization, a multi-attribute decision making tool, a
Monte-Carlo model and a net present value model…………………………………….110
Figure 2.2 Schematic representation of the method used to calculate facility footprint and
facility costs. A cost factor is multiplied by the total process equipment purchase costs to
provide the fixed capital investment. The total process equipment purchase costs are
divided by an area factor to calculate the facility footprint……………………………112
Figure 2.3 Schematic representation the detailed factorial method used to compute a) FCI
and b) facility footprin………………………………………………………………...113
Figure 2.4 Schematic representation of brute force optimization. Brute force optimization
searches through all configurations (X) of the different types of cell culture vessel (i) and
checks whether the minimum utilization (Y) selected by the user is met…………….142
Figure 3.1 Comparison between results attained using the FCI model and those provided
by eXmoor Pharma Concepts for a) facility footprint and b) FCI…………………….159
Figure 3.2 a) Facility footprint b) FCI with increasing annual demand for different
manufacturing platforms. The unit operations included in the allogenic platforms were
inoculation, cell culture and wash and volume reduction while the unit operations
included in the autologous platforms were cell wash, cell activation, viral transduction,
cell culture and wash and volume reduction. For allogenic processes a harvest density of
45,000 cells/m2 for all platforms and surface area/L for microcarier-based platforms of
5,540cm2/L were assumed . For autologous processes a maximum cell density for cell
culture was 7 × 10⁶ cells/ml was assumed. The abbreviations indicate the name of the
different manufacturing platforms: MLF = multilayer flask; MPB = multi-plate
bioreactor; HFB = hollow fibre bioreactor; STR = stirred tank bioreactor; MLF (open) =
multilayer flask with open steps; SSB = static suspension bag; INT = integrated USP/DSP
platform; RMB = rocking motion bioreactor………………………………………..…164

17
Figure 3.3 a) Relationship between FCI and facility footprint across multiple
manufacturing platforms. b) Relationship between FCI per m2 of facility and facility
footprint across multiple manufacturing platforms. The unit operations included in the
allogenic platforms were inoculation, cell culture and wash and volume reduction while
the unit operations included in the autologous platforms were cell wash, cell activation,
viral transduction, cell culture and wash and volume reduction. For allogenic processes a
harvest density of 45,000 cells/cm2 for all platforms and surface area/L for microcarier-
based platforms of 5,540 cm2/L were assumed . For autologous processes a maximum
cell density for cell culture was 7 × 10⁶ cells/ml was assumed. The abbreviations indicate
the name of the different manufacturing platforms: MLF = multilayer flask; MPB = multi-
plate bioreactor; HFB = hollow fibre bioreactor; STR = stirred tank bioreactor; MLF
(open) = multilayer flask with open steps; SSB = static suspension bag; INT = integrated
USP/DSP platform; RMB = rocking motion bioreactor……………………………….166
Figure 3.4 General facility layout used in this analysis to determine the relative footprint
of the different areas within a cell therapy facility. Yellow regions = Grade C area
classification; Green regions = Grade D area classification; white regions = Grade U area
classifications…………………………………………………………………………169
Figure 3.5 Contribution of the different factors towards the FCI for a dose size of 100M
cells and annual demands of 500 and 10,000 doses per year. The abbreviations indicate
the name of the different manufacturing platforms: MLF = multilayer flask; MPB = multi-
plate bioreactor; HFB = hollow fibre bioreactor; STR = stirred tank bioreactor; MLF
(open) = multilayer flask with open steps; SSB = static suspension bag; INT = integrated
USP/DSP platform; RMB = rocking motion bioreactor…………………………….....170
Figure 3.6 Trends in area factor and cost factor across multiple manufacturing platforms
and commercialisation scenarios for a products with dose size of 100M cells. The unit
operations included in the allogenic platforms were inoculation, cell culture and wash and
volume reduction while the unit operations included in the autologous platforms were cell
wash, cell activation, viral transduction, cell culture and wash and volume reduction. For
allogenic processes a harvest density of 45,000 cells/m2 for all platforms and surface
area/l for microcarier-based platforms of 5,540 were assumed . For autologous processes
a maximum cell density for cell culture was 7 × 10⁶ cells/ml was assumed. The
abbreviations indicate the name of the different manufacturing platforms: MLF =
multilayer flask; MPB = multi-plate bioreactor; HFB = hollow fibre bioreactor; STR =
stirred tank bioreactor; MLF (open) = multilayer flask with open steps; SSB = static
suspension bag; INT = integrated USP/DSP platform; RMB = rocking motion bioreactor
b) Method for evaluating facility footprint and FCI……………………………………173
Figure 3.7 Change in cost factor with initial condition of the facility site, manufacturing
platform and geographic location of the facility. The manufacturing platforms with high
costs/m2are the hollow fibre bioreactor and the integrated USP/DSP. The manufacturing
platforms with medium costs/m2 are the multilayer flasks, multi-plate bioreactor, static
suspension bags and rocking motion bioreactor and the manufacturing platform with low
costs/m2 are the stirred tank bioreactor and multilayer flasks with open steps…………176

18
Figure 4.1 a) COG per million cells across multiple demands and scales. The optimal
manufacturing platform in each batch size-demand scenario is represented by a black bar
b) Impact of different cost categories on COG with increasing demand and batch size.
Where MLF= Multilayer flasks, MPB =Multi-plate bioreactors, HFB =hollow fibre
bioreactors and STR=single use bioreactors with microcarriers……………………….190
Figure 4.2 Critical recovery efficiency for which single use bioreactors with
microcarriers are more cost-effective than planar technologies across multiple scales and
demands, for non-porous microcarriers with a surface area per litre of 11,080cm2 and
critical surface area per litre for which single use bioreactors with microcarriers are more
cost effective than planar platforms across multiple scales and demands for a recovery
efficiency of 75%. Min and max number of batches per year = 10 and 100
respectively……………………………………………………………………………193
Figure 4.3 Labour utilization per day for cell culture, wash and formulation throughout
the first 50 days of the year, for a single product facility manufacturing 100 batches of 50
B cells and across multiple manufacturing platforms. The number of FTEs required for
each manufacturing platform is represented on the top right corner of each figure. Where
MLF= Multilayer flasks, MPB =Multi-plate bioreactors, HFB =hollow fibre bioreactors
and STR=single use bioreactors with microcarriers………………………………….196
Figure 4.4 a) Sensitivity plots showing the economic attribute versus the operational
attribute across different commercialisation scenarios. The y-axis represents the
aggregate score between both attributes, where the optimal technology has the highest
score. The x-axis, represents the weight of the economic attribute with respect to the
operational attribute, where towards the left-hand-side the operational attribute is more
important, at the centre, where the weight of the economic attribute is 0.5, both attributes
have the same importance and on the right-hand-side the economic attribute has the
highest importance. b) COG per million cells distribution across two different
commercialisation scenarios. Where MLF= Multilayer flasks, MPB =Multi-plate
bioreactors, HFB =hollow fibre bioreactors and STR=single use bioreactors with
microcarriers…………………………………………………………………………..199
Figure 4.5 a) Minimum selling price across multiple dose size and demands for which
COG is 40% and 15% of sales when the minimum COG/dose across the different
manufacturing platforms is applied. The dashed line represents the current reimbursement
from the NICE. b) Minimum selling price distribution for which COG is 15% of sales.
For an annual demand of 10,000 patients per year and for indications with different dose
sizes and reimbursement strategies. The dashed line on each graph represents the typical
reimbursement applied to these indications. Where MLF= Multilayer flasks, MPB
=Multi-plate bioreactors, HFB =hollow fibre bioreactors and STR=single use bioreactors
with microcarriers……………………………………………………………………..203
Figure 4.6 Sensitivity analysis showing the impact of varying both process parameters
and cost parameters by ±25% with the exception of the batch success rate (varied by±5%
since the base case is 95%). This figure shows the effect of process and economic
parameters on the COG and throughput of an MSC product with dose size of 1 B cells
and a demand of 10,000 cells per patient……………………………………………...206
19
Figure 4.7 Measurement of the impact of different parameters on the ability of reaching
COG as 15% sales for a selling price of $40,000 per dose, an annual demand of 10,000
doses and a dose size of 1 billion cells. The shaded are represents scenarios where COG
as 15% sales is reached. A = discount on media costs, B= cell doubling time and C= DSP
yield…………………………………………………………………………………...208
Figure 4.8 Measurement of the impact of different parameters on the ability of reaching
100,000 doses per year of 1 billion cells. A = Cell doubling time. B =Batch success rate;
C= DSP yield………………………………………………………………………….209
Figure 5.1 Schematic representation of the CAR T-cell therapy supply chain activities
captured in this case study. These include leaukapheresis, inbound transportation,
manufacturing process (core process & release testing) and outbound transportation. The
y-axis in the bar chart represents the different steps within the manufacturing process and
the x-axis represents the manufacturing platforms considered in this case study where
MLF = multilayer flasks, SSB = static suspension bags, GPV = gas permeable vessel,
HFB = hollow fibre bioreactor, INT = integrated USP/DSP platform and RMB = rocking
motion bioreactor. The colour of the bar in each process step-manufacturing platform
combination represents the technology used, which is listed in the bottom
legend………………………………………………………………………………….216
Figure 5.2 Schematic representation of the differences between the autologous and
allogeneic processes modelled in this chapter…………………………………………221
Figure 5.3 COG/dose for CAR T-cell products manufactured using different
manufacturing platforms across different commercialisation scenarios for lentivirus-
based processes and γ-retrovirus-based processes. MLF = multilayer flasks. SSB = static
suspension bags¸ GPV = gas permeable vessel, HFB = hollow fibre bioreactor, INT =
integrated USP/DSP platform and RMB = rocking motion bioreactor………………...235
Figure 5.4 COG breakdown at medium and high doses across different manufacturing
platforms for an annual demand of 10,000 doses per year. a) COG breakdown by activity,
b) COG breakdown by process step and c) COG breakdown by cost category (for the
manufacturing process only). MLF = multilayer flasks, SSB = static suspension bags¸
GPV = gas permeable vessel, HFB = hollow fibre bioreactor, INT = integrated USP/DSP
platform and RMB = rocking motion bioreactor. Medium dose = 50M cells, high dose =
500M cells……………………………………………………………………………..238
Figure 5.5 a) Facility footprint across different manufacturing platforms and viral vectors
with increasing annual demand and a dose size of 50M cells. b) Breakdown of personnel
requirement with increasing annual demand. The numbers in the embedded table
correspond to working volume of the cell culture vessels in ml used during cell culture
for dose sizes of 50M and 500M cells. The number on top of each bar represents the ratio
between the number of process operators and the total personnel number within a facility.
MLF = multilayer flasks, SSB = static suspension bags¸ GPV = gas permeable vessel,
HFB = hollow fibre bioreactor, INT = integrated USP/DSP platform and RMB = rocking
motion bioreactor……………………………………………………………….……..242

20
Figure 5.6 Minimum selling price for which COG is 15% (grey bar) and 40% (black bar)
sales across different manufacturing platforms and viral vectors. The dashed lines
represent the reimbursement for current autologous CAR T-cell products in the market –
Kymriah (red) and Yescarta (yellow). The commercialisation scenario selected is of an
annual demand of 10,000 patients and dose sizes of 50M and 500M cells. MLF =
multilayer flasks, SSB = static suspension bags¸ GPV = gas permeable vessel, HFB =
hollow fibre bioreactor, INT = integrated USP/DSP platform and RMB = rocking motion
bioreactor……………………………………………………………………………...244
Figure 5.7 NPV (x-axis) versus FCI (y-axis) versus minimum selling price for which
NPV=0 (bubble size) across different facility configurations, QC strategies and number
of manufacturing sites. The green bubbles represent multi-site manufacture scenarios
where the number of sites is 5 and the green bubbles represent multi-site manufacture
scenarios where the number of sites is 50. The commercialisation scenario here presented
is of an autologous CAR T-cell therapy product with an annual demand of 10,000 patients
per year and a dose size of 50M cells…………………………………………………..247
Figure 5.8 Breakdown of the net present costs included in the NPV analysis across
different facility configurations, QC strategies and number of manufacturing sites. The
commercialisation scenario here presented is of an autologous CAR T-cell therapy
product with an annual demand of 10,000 patients per year and a dose size of 50M
cells…………………………………………………………………………...……….249
Figure 5.9 Number of doses produced per batch and number of batches required per year
in order to fulfil an annual demand of 10,000 patients across different DSP strategies for
allogeneic CAR T-cell products with different dose sizes. Allo = allogeneic, 1_DSP = 1
magnetic purification unit/batch, 3_DSP = 3 magnetic purification units/batch and 6_DSP
= 6 magnetic purification units/batch………………………………………………….250
Figure 5.10 COG breakdown across two different annual demands dose sizes. Auto =
autologous, Allo = allogeneic, _DSP = 1 magnetic purification unit/batch, 3_DSP = 3
magnetic purification units/batch, 6_DSP = 6 magnetic purification units/batch and
Resized = cell culture process resized accroding to DSP limitations…………………252
Figure 5.11 Relative cost-effectiveness of allogeneic CAR T-cell products with respect
to autologous CAR T-cell products across multiple dose size and annual demand
scenarios. Auto = autologous, Allo = allogeneic, Non- Resized = cell culture process not
resized accroding to DSP limitations and Resized = cell culture process resized according
to DSP limitations……………………………………………………………………..253
Figure 7.1 Schematic representation of a QbD process. Adapted from Lipsitz et al.
(2016)………………………………………………………………………………….266

21
Abbreviations
ACT Adoptive cell therapy
ALL Acute lymphoblastic leukaemia
ALLO Allogeneic
AUTO Autologous
CAR Chimeric antigen receptor
CARG Compounded annual rate of growth
cGMP Current good manufacturing practice
CIP Cleaning in place
CLL Chronic lymphocytic leukaemia
CMO Contract manufacturing organisation
CNC Control and non-classified
COG Cost of goods
CRS Cytokine release syndrome
CTAT Clean room assessment technique
DMSO Dimethyl sulfoxide
EMEA European medicines agency
FACS Florescence activated cell sorting
FCI Fixed capital investment
FDA Food and drugs agency
GvHD Graft versus host disease
HSC Hematopoietic stem cells
HVAC Heating, ventilation and air conditioning systems
LCC Life cycle costs
mAb Monoclonal antibody
MCB Master cell bank

22
MIV Murine leukaemia virus
MOI Multiplicity of infection
NPC Net present costs
NPV Net present value
PBMC Peripheral blood mononuclear cells
pMHC Peptide histocompatibility complex
QA Quality assurance
QC Quality control
QP Qualified person
R&D Research and development
RNA Ribonucleic acid
TAAs Tumour associates antigen
TALEN Transcription activator-like effector nuclease
TCM Central memory T-cells
TCR T-cell receptor
TFF Tangential flow filtration
TILs Tumour infiltrating lymphocytes
TN Naïve T-cells
SCID Severe combined imogenicity
SIP Sterilization in place
SOP Standard operating procedures
SS Stainless steel
SU Single use
UBC Umbilical cord-blood
WHO World Health Organization

23
Chapter 1: Scope and Background
1.1 Introduction
Traditional healthcare has relied on the use of pharmaceuticals, biopharmaceuticals and
medical devices for patient care (Mason et al. 2011). Such treatments are considered
efficient, however, they have failed to efficaciously treat a number of indications
including chronic diseases (Mason et al. 2011). The national annual costs of chronic and
long term diseases including dementia, cancer and diabetes amount to £18.7 million, and
it is expected to rise significantly in the next years (Department of health 2010). As
chronic diseases have a higher incidence among the older population, the demographic
shift seen in the recent years puts an unprecedented economic strain on our healthcare
system (Department of health 2010; Naughton et al. 2006; Connolly et al. 2011; Prasad
et al. 2012; Dunnell 2007).
Cell therapies have been proposed as a novel approach for treatment and possibly cure of
number of chronic indications; however, these powerful therapeutics present significant
challenges inherent of the complexity of these products. These challenges include high
cost of goods (COG), high process variability and complex logistics (Heathman et al.
2015; Lapinskas 2010; Lopez et al. 2010; Christodoulou et al. 2013; Ratcliffe et al. 2011;
Levine et al. 2017; Mount et al. 2015a; Sharpe & Mount 2015b). Decisional tools have
been utilized to provide valuable insights to some of the dominant challenges faced by
cell therapy manufactures (Jenkins et al. 2016; Simaria et al. 2014a; Hassan et al. 2016;
Hassan et al. 2015). This introductory chapter provides an insight on the therapeutic
potential of cell therapies, their manufacturing process as well as the challenges
associated with these products, with focus on mesenchymal (MSC) and chimeric antigen

24
receptor T-cell (CAR T-cell) based products. This chapter also describes the potential of
decisional tools to solve some of the challenges associated with cell therapy manufacture.
The first section of this chapter (Section 1.2) provides an introduction to cell therapy
products, their mode of action, the types of cells used in cell therapy applications and the
differences between patient specific (Autologous) and universal donor (Allogeneic) cell
therapy manufacture. Section 1.2 also highlights the market opportunity for cell therapy
products as well as the current products in the market, the key trends in cell based clinical
trials and the development pathway for cell therapy products . Section 1.3 focuses on
MSC and CAR T-cell based cell therapy products and provides an overview of their
characteristics, market potential and clinical trial landscape. This section is
complemented by Sections 1.4 and Section1.5, where the manufacturing process and
current technologies for the manufacture of these cell therapy products are described.
Section 1.6 discusses some of the key challenges faced by cell therapy manufacturers
considering clinical performance issues, manufacturing process and supply chain
bottlenecks and costs and reimbursement challenges. Section 1.7 describes the unique
features of cell therapy facilities. This section also discusses the trade-offs of future
trends for cell therapy facilities including the implementation of automation and the
adoption of a decentralised approach to cell therapy manufacture. The previous use of
decisional tools to address challenges related to cell therapy manufacture is discussed in
Section 1.9. The final section (Section 1.10) describes the aims and organisation of this
thesis.
1.2 Cell therapy overview
Cell therapies belong to the field of regenerative medicine (Wei et al. 2013a), and are
defined as the administration of cells to improve the health condition of the recipient
(Anon 2012). The first use of this type of treatment was in the form of bone marrow
transplants, with the first successful allogeneic bone marrow transplant taking place in

25
the early 70s (Appelbaum 2007). Years later, these therapies now provide possible
solutions to multiple currently unmet clinical needs (Heathman et al. 2015; Ratcliffe et
al. 2011).
There are three key mechanisms in which cell therapy products can act: (1) replacement
of damaged cells or tissues (e.g. the use of stromal cells for organ repair) (Alliance for
Regenerative Medicine 2013; Bussolati 2011). (2) stimulation of self-healing by the body
(e.g. modify the patients inflammatory response to maximise and accelerate regeneration)
(Ennis et al. 2013; Alliance for Regenerative Medicine 2013), and (3) delivery of
molecular or genetic agents (e.g. the delivery of RNA sequences which inhibits the
formation of the huntingtin) (Olson et al. 2012; Alliance for Regenerative Medicine
2013).
1.2.1 Characteristics of cells used in cell therapy
Different types of cells have been used for cell therapy applications, including
hematopoietic stem cells (HSCs/HPCs), fibroblasts, MSCs, placenta cells, chondrocytes,
liver cells, endothelial cells, induced pluripotent cells and lymphocytes (Martin et al.
2009; Li et al. 2014a; Heathman et al. 2015). The source of these cells maybe autologous,
allogeneic and xenogeneic. This thesis will focus on the two former cell sources. The key
differences between them are summarised on Table 1.1.
1.2.1.1 Autologous or patient-specific
In allogeneic cell therapy, the patient and the donor are the same person, which reduces
the chances of immune response by the body (Mason & Dunnill 2009; Forbes &
Rosenthal 2014; Jansen of Lorkeers et al. 2014; Smith 2012a; Malik 2012). Additional
advantages of the use of this type of cell source is the relatively less extensive cell line
development process as possible abnormalities in the cell bank will only affect one patient
(Mason & Dunnill 2009). Disadvantages of autologous cell therapy manufacture include

26
the requirement for a of scale-out manufacturing approach which does not benefit from
economies of scale and hence, increases the COG (Malik 2012; Mason & Dunnill 2009).
Since the starting material for each lot is attained from a different donor, there is also a
higher chance for process variability (Mason & Dunnill 2009; Brandenberger et al. 2011).
Furthermore, process scheduling maybe relatively more challenging due possible delays
in patient sample arrival.
Table 1.1 Comparison between autologous and allogeneic cell therapy manufacture
1.2.1.2 Allogenic or universal
In allogeneic cell therapy manufacture the cells from a single donor are used to produce
a master cell bank (MCB) and create an “of-the-shelf” product for multiple patients
(Malik 2012; Brandenberger et al. 2011; Whittle 2017). The main concern surrounding
the use of this type of therapies is the possibility of immunogenic response by the
recipients body (Whittle 2017; Mason & Dunnill 2009; Smith 2012a). This issue can be
addressed using immune suppression (Smith 2012a). Additional drawbacks of allogeneic
Parameter Autologous Allogeneic
Manufacture - High lot-to-lot
variability
- Donor is the patient
- Lower batch failure
costs
- Low lot-to-lot
variability
- Single donor for
multiple patients
- Higher batch failure
costs
Process planning - Complex logistics
- Unsuitable for
emergency situations
- Complex process
scheduling
- Simpler logistics
- “Off-the-shelf” product
suitable for emergency
situations
- Fixed process schedule
Regulation and Product &
Process characterisation
- Simpler cell bank
characterisation
- Reduces the risk of
graft-versus-host
disease
- Complex cell bank
characterisation
- May require extensive
immunotherapy to avoid
graft-versus-host
disease
COG & Reimbursement - Minimal economies of
scale and higher COG
- Requires QC testing for
each patient
- COG decreases with the
scale of production
- Does not require QC
testing for each patient

27
cell processing is that one MCB is unlikely to last for the whole business life cycle of the
product (Bravery n.d.). Therefore, comparability studies are required whenever a new cell
bank is introduced. This process can cost up to $1M USD including agency fees and
comparability testing and last up to 1 year (Bravery n.d.).
Furthermore, more extensive cell bank testing maybe required in allogeneic processing
(Mason & Dunnill 2009). The costs associated with the additional testing required are
however spread over a higher number of doses (Malik 2012). In allogeneic cell therapies
the commercial scale manufacture approach adopted is scale-up, which benefits from
economies of scale (Malik 2012; Mason & Dunnill 2009; Whittle 2017). The main
challenge in scaling-up is maintaining the product characteristics and low manufacturing
costs (Brandenberger et al. 2011).
For some indications, both allogeneic and autologous treatments may be applied (de
Windt et al. 2013; Hosing et al. 2003; Majhail et al. 2015; de la Portilla et al. 2016; Jansen
of Lorkeers et al. 2014); in which case the type of indication will dictate which approach
will be more appropriate. For example, if the doctors are under time constraints due to
the fact that the patient requires an emergency treatment (e.g. stroke), then perhaps a
allogeneic treatment would be more advantageous (Malik 2012; Mason & Dunnill 2009).
Another example where allogeneic therapies may be preferred to autologous therapies are
cases where insufficient starting material is available for collection from the patient due
to old age or disease (Malik 2012; Jansen of Lorkeers et al. 2014; Zhang et al. 2015).
Despite the technical challenges associated with the commercial scale manufacture of
autologous cell therapy products these have been prevalent in the cell therapy market and
clinical trials (Brandenberger et al. 2011; Li et al. 2014a; Culme-Seymour et al. 2012).

28
1.2.2 Development pathway for cell therapies
The development process of cell therapy products resembles the development process of
traditional biopharmaceuticals products and includes product discovery & basic research
followed by pre-clinical trials and clinical trials (Deans 2014; Paul et al. 2010). The total
development process can last between 10-15 years. The costs associated with developing
a novel cell therapy product are higher than for biopharmaceutical products and range
between $100’s millions to $1 billion (Deans 2014; Hassan et al. 2016; Nie 2015), with
only about 30% of the successful products recovering the initial investment made during
the process development (Deans 2014).
Persisting through the time consuming and unpredictable product development process
may pose some challenges as companies may struggle to raise enough capital (Dodson &
Levine 2015a). Examples of the time taken to bring a product to market include Osiris
therapeutics, which released the products Osteocel® (2005) and Prochymal® (2012) 13
and 20 years respectively after the company was founded in 1992 (Dodson & Levine
2015a). Strategies to raise adequate funds to withstand the process development all the
way through market approval include partnerships and funding from venture capitalists
(Deans 2014; Dodson & Levine 2015a). Additional methods to raise capital include the
development of a second line of products with lower regulatory requirements (Dodson &
Levine 2015a). Figure 1.1 shows a schematic representation of the typical process
development pathway for biologics.
Parallel activities that take place during the development pathway of cell therapy products
include clinical trials, assay development and product characterisation. The degree of
clinical testing required may vary according to the target indication. For example, an
MSC-based therapies for cardiovascular indications require more rigorous clinical trials
than therapies targeting rare diseases (Mount et al. 2015b). Moreover the MSC-based

29
therapy will have to demonstrate superior performance with respect to current treatments
(Mount et al. 2015b).
Furthermore, the type of cells used will have an effect on the follow-up times. For
example, an allogeneic MSC-based clinical trial may only require a 12month follow-up
time due to their short half-life (Mount et al. 2015a), while trials using genetically
modified cells may require follow-up times from 5 years (EMEA) (European Medicines
Agency 2009b) to 15 years (FDA) (Food and drugs agency 2015). On average, only 10%
of biopharmaceuticals which enter the clinical trial pathway receive successful market
approval and the majority of these products are monoclonal antibodies (Thomas et al.
2015; Deans 2014; Hassan et al. 2016; Nie 2015). The rate of market approval varies with
the indication being targeted (Figure 1.2).
When the first cell therapy products were developed, it was a challenge for regulatory
agencies to regulate these novel products, hence the regulatory procedures applied to cell
therapy products were ones established for other types of therapeutics (Dodson & Levine
2015b). However, the use of regulation protocols of traditional biologics and small
molecules in cell therapy is inadequate as cell therapies have very particular features
(Mount et al. 2015b).
The identity of traditional products (small-molecules and proteins) is defined by the
composition of the molecules (Lipsitz et al. 2016). In cell therapy the identity of the cells
is given by the cell phenotype. The cells phenotype is complex and defined by the surface
markers present on the cells (Lipsitz et al. 2016).

30
Figure 1.1 Development pathway of cell therapy products. Duration, stages, outcome and investment. Adapted from Deans (2014)
and Thomas et al (2015).
31
Figure 1.3 Schematic representation of the Japanese accelerated regulatory pathway.
Adapted from Bubela et al., 2015.
Figure 1.2 Success rate of products going though clinical trials by indication. Source:
Thomas et al (2015).

32
The regulatory framework for cell therapy products in Europe and USA is now divided
into minimally and significantly manipulated therapies. Efforts for novel regulation
methods have also been made in multiple geographic locations such as Japan, Canada,
Singapore and USA (Hara et al. 2014; Sherman et al. 2013; Eichler et al. 2012). Figure
1.3 shows the difference between the typical process development pathway of a novel
biopharmaceutical product and the accelerated development pathway in Japan.
1.2.3 Cell therapy market
Traditional healthcare is composed of pharmaceuticals, biopharmaceuticals and medical
devices (Mason et al. 2011). Although these are considered efficient treatments, there are
still indications with no current efficacious treatment such as chronic diseases (Mason et
al. 2011). The number of patients with chronic or long-term diseases in the UK is around
15.4 million. This amounts for 70% of the NHS spending (£ 18.7 billion) and it is
expected to increase to £26.4 billion by 2020 (Department of health 2010). Chronic
diseases are associated with age and include cancer, dementia, Parkinson’s, diabetes
cardiovascular disease (CVD) etc. (Department of health 2010; Naughton et al. 2006;
Connolly et al. 2011; Prasad et al. 2012). This poses an issue due the change in
demographics caused by the fact that the population now has longer life expectancies
(Department of health 2010; Dunnell 2007; Office for National Statistics 2014). Cell
therapies where proposed as treatment of a number of chronic indications (Alliance for
Regenerative Medicine 2013).
The cell therapy market was estimated at $12 billion USD in 2016 and is estimated to
grow at a CARG rate of 31.1% to $61 billion USD by 2022 (Prnewswire 2016). The first
product to be approved was Apigraft® (Organogenesis, OH, USA) in 1998. This product
had been used to treat 500,000 patients by the end of 2011 and 140,000 patients in 2012
(Alliance for Regenerative Medicine 2013). Since then, a number of cell therapy products
targeting multiple indications have been commercialised in different countries. These

33
products include ChondroCelect® (TiGenix Leuven, Belgium), Prochymal® (Osiris,
MD, USA) and Cartistem® (Medipost, Weymouth, UK). The key information regarding
these therapies is summarised on Table 1.2.
The selling prices for the commercialised therapies seen in the market vary significantly,
and may reach the 100’s of thousands of dollars per treatment (GlobeNewswire 2016a).
These numbers are highly dependent on the indication being targeted. Some of these
therapies may replace the need for transplants which can costs as much as $600,000 USD
(Touchot & Flume 2015), or target indications such as spinal cord injury for which current
treatments are priced between $500,000 USD to $3million USD/ patient (Williams 2015).
Historically, a very high percentage of COG on selling price values were expected for
autologous products due to a combination of high manufacturing COG and limitations in
reimbursement stipulated by the healthcare providers (Smith 2012a). Smith (2012)
indicates that the COG as % of sales were 40%-50% for Provenge® and Carticel®, which
have selling process of $93,000 USD and $15,000 USD respectively (Fierce Biotech n.d.;
http://www.access.wa.gov), implying that the COG/dose of these therapies were
approximately $46,500 USD and $7,200 USD respectively.

34
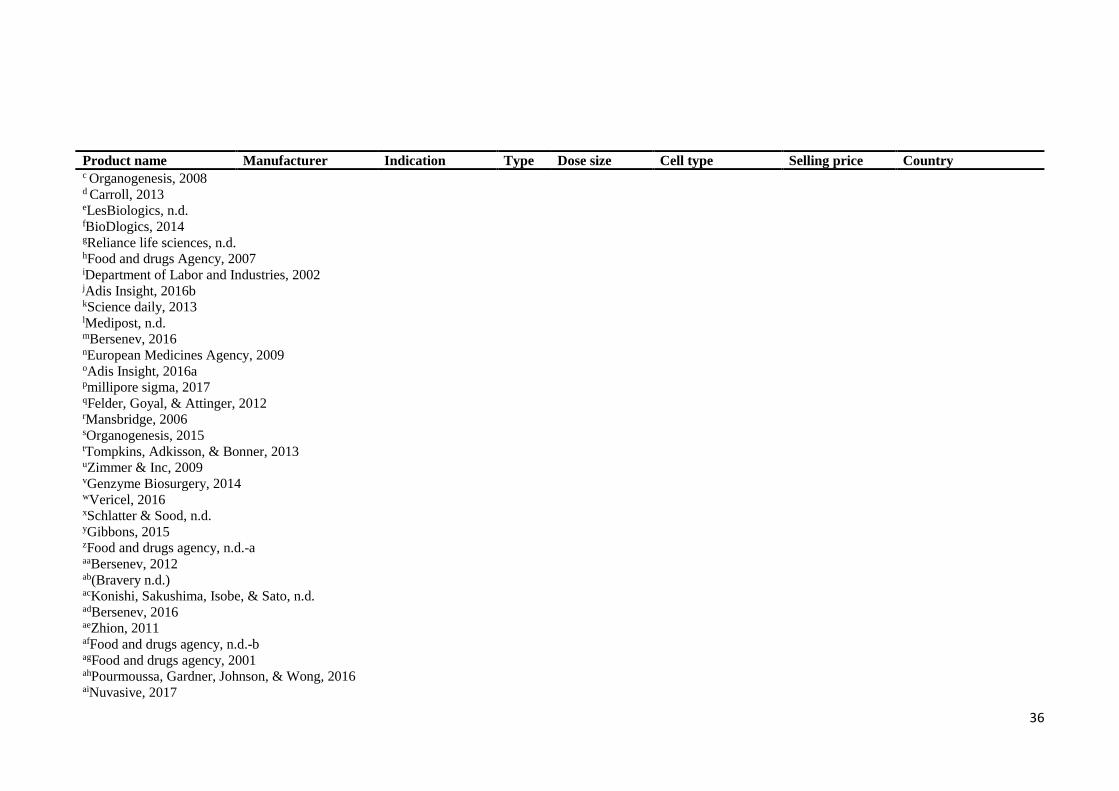
Table 1.2 Cell therapy products on the Market. Allo = Allogeneic, Auto = Autologous
Product name Manufacturer Indication Type Dose size Cell type Selling price Country
Allostem® Allosource Bone repaira Alloa 6.63K cells/mla Adipose MSCa $540 -$3,500
(1ml-10ml )a
US
Apligraft® Organogenesis Chronic woundsb Allob 44cm2c Keratinocytes &
Neonatal
Fibroblastsb
$21.22/cm2d US/Saudi Arabia
BioDfactor® BioDlogics Tissue repaire Allof 0.25ml –
1.25mlf
Placenta cellsf - US
BioDfence® BioDlogics Tissue repaire Allof 3cm2 – 12cm2f Placenta cellsf - US
CardioRel® Reliance Life
Sciences
Myocardial
infractiong
Autog - MSCsg - India
Carticel® Genzyme Cartilage repairh Autoh 0.6-3.3M
cells/cm2h
Chrondocytesh $13,300 -15,000i US/EU
Cartistem® Medipost Osteoarthritisj Allok 2.5M cells/cm2l UC Mesenchymal
cellsl
$20,000 -
$40,000m
South Korea
Chrondocelect® TiGenix Cartilage repairn Auton 0.4 ml/vial Cartilage cellsn $24,000m EU (withdrawn )
(100 B cells/
ml)n
Cupistem® Anterogen Rectal fistulao Autop - Adiposeo - South Korea
Dermagraft® Organogenisis Chronic woundsq Allor 37.5cm2s Fetal Fibroblastsq $1,406s US/ Canada
DeNovo NT® Zimmer Cartilage repairt Allot 2.5cm2/packetu Juvenile
chondrocytest
$1,440/ packett North America
Epicel® Genzyme Burns treatmentv Autov 50cm2/gauzew Keratinocytesw $6,000 - $10,000
per 1% of total
body surface
areax
US/EU
Grafix® Osiris Therapeutics Chronic woundsy Alloy - Placental cellsy - US
Gintuit® Organogenesis Mucogingival
conditionsz
Alloz 177cm2 cellular
sheet with
4Mcellsz
Keratinocytesz - US

35
Product name Manufacturer Indication Type Dose size Cell type Selling price Country
Heartcelligram-AMI® Pharmicell Post-acute
myocardial
infractionaa
Autoaa - BM MSCaa $19,000ab South Korea
Heartsheet® Terumo Corporation Heart failureac Autoac 5 sheetsac Skeletal myoblastsac $120,000ad Japan
LaViv® (azficel) Fibrocell Wrinklesae Autoae 3 treatment
session
Fibroblastsae $3,000 - $3,500ae US
0.1 ml/linear
cmae
MACI® Genzyme Cartilage repairaf Autoaf 0.5 – 1M
cells/cm2 of
cellular sheetaf
Chondrocytesaf - EU (suspended)
US
Orcel® Ortec International Burnsag Alloag - Keratinocytes,
fibroblastsag
$27.8/cm2ah US
Osteoplus® Nuvasive Bone repairai Alloai 50K cells/mlaj MSCsaj $460 - $5,400 (1-
15 ml)a
US
Prochymal® Osiris GvHDak Alloal 2M cells/kgak BM-MSCsal $20,000/dosead Canada & New
Zealand
Provenge® Dendreon Prostate canceram Autoam 50M cells/
vialam
CD54+ cellsam $31,000/ infusion
(3 infusions)an
US
Recell® Avita Medical Skin loss, scaring
and
depigmentation
after burn injuryao
Autoao 1
pack/320cm2ao
Skin cellsao £950 + VAT/
packao
EU, UK, Canada,
Australia
ReliNethra® Reliance Life
Sciences
Sight lossap Autoap 4cm2/graftap Epithelia cellsap - India
TEMCEL® Mesoblast GvHDaq Alloaq 1.2 – 1.7B
cellsaq
MSCaq $7,079/ 72M
cellsaq
Japan
Transcyte® Organogenisis Temporary would
healingar
Alloar - Fibroblastsar $11.75/cm2as US
Trinity/Trinity evolution ®
Orthofix Bone repairat Alloat >1K cells/mla MSCat $540-$5,455 for (1-15 ml)a
US
a Skovrlj et al., 2014 b Food and drugs agency, 1998
36
Product name Manufacturer Indication Type Dose size Cell type Selling price Country c Organogenesis, 2008 d Carroll, 2013
eLesBiologics, n.d. fBioDlogics, 2014 gReliance life sciences, n.d. hFood and drugs Agency, 2007 iDepartment of Labor and Industries, 2002 jAdis Insight, 2016b kScience daily, 2013 lMedipost, n.d. mBersenev, 2016 nEuropean Medicines Agency, 2009 oAdis Insight, 2016a pmillipore sigma, 2017 qFelder, Goyal, & Attinger, 2012 rMansbridge, 2006 sOrganogenesis, 2015 tTompkins, Adkisson, & Bonner, 2013 uZimmer & Inc, 2009 vGenzyme Biosurgery, 2014 wVericel, 2016 xSchlatter & Sood, n.d. yGibbons, 2015 zFood and drugs agency, n.d.-a aaBersenev, 2012 ab(Bravery n.d.) acKonishi, Sakushima, Isobe, & Sato, n.d. adBersenev, 2016 aeZhion, 2011 afFood and drugs agency, n.d.-b agFood and drugs agency, 2001 ahPourmoussa, Gardner, Johnson, & Wong, 2016 aiNuvasive, 2017
37
Product name Manufacturer Indication Type Dose size Cell type Selling price Country ajAcesurgical, n.d. akOsiris, n.d. alWaltz, 2013 amFood and drugs agency, n.d. anFierceBiotech, 2010 aoThe National Institute for Health and Care Excellence, 2014 apreliance life sciences, n.d. aqGlobeNewswire, 2016 arBello, Falabella, & Eaglstein, 2001 asStone, 2013 atOrthofix, n.d.

38
1.2.4 Clinical trials landscape of cell therapies
Different articles have been published regarding the trends in cell therapy clinical trials
(Martin et al. 2009; Li et al. 2014b; Heathman et al. 2015; Culme-Seymour et al. 2012).
Among these articles is the article written by Li et al (2014a), where the author described
a search using the term “stem cell” in the clinicalTrials.gov database and in the WHO’s
international clinical trials registry, in order to identify the clinical trials for cell therapy
registered before the 1st of January 2013. This article revealed a total of 4,749 clinical
trials. The study also shown that cell based clinical trials have increased over the years
(Figure 1.4), and that North America is the continent with the highest number of clinical
trials (57%), follow by Europe (25%), Asia (16%).
In the same year, a comprehensive report was produced by the Alliance for Regenerative
Medicine, unveiling key trends in the cell therapy industry in the year 2014 including a
snapshot into the cell therapy clinical trials landscape (Alliance for Regenerative
medicine 2014). Martin et al (2009) has also presented key trends in clinical trials, in this
report, the author describes the findings form a survey concluded in 2009, which included
over 700 biotechnology companies, where 138 of these were developing cell therapy
products. The aim of the study was to assess the state of the private sector in cell therapy.
Culme-Seymour et al (2012) reports key trends in cell therapy clinical trials over a decade
(from 2000 till 2010), by typing the term “cell therapy” in search function of the
clinicalTrials.gov database. This revealed a total of 2,724 cell therapy trials. A more
recent status update on cell therapy clinical trials is the work published on Heathman et
al (2015), where the authors collect data from all clinical trials registered in
clinicalTrials.gov until the 1 January 2014 by typing the word “cell” in the search
function. This revealed at total of 29,467 clinical trials, 1,342 of which were active cell
therapy trials.
39
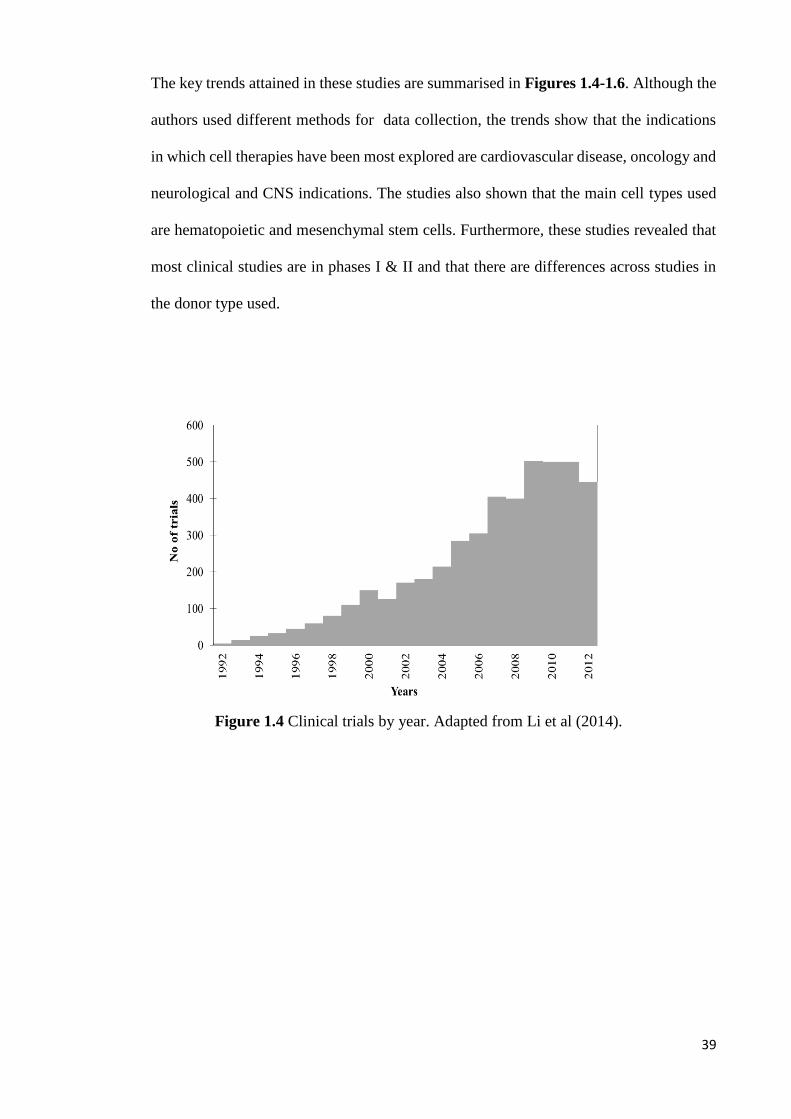
The key trends attained in these studies are summarised in Figures 1.4-1.6. Although the
authors used different methods for data collection, the trends show that the indications
in which cell therapies have been most explored are cardiovascular disease, oncology and
neurological and CNS indications. The studies also shown that the main cell types used
are hematopoietic and mesenchymal stem cells. Furthermore, these studies revealed that
most clinical studies are in phases I & II and that there are differences across studies in
the donor type used.
Figure 1.4 Clinical trials by year. Adapted from Li et al (2014).

40
Figure 1.5 Clinical trials by indication comparison. Endocrine, Metabolic & Genetic includes diabetes and renal diseases. Gastrointestinal
includes Crohn’s disease and ulcerative colitis. Inflammation, Immunology & non-malignant hematologic includes: aplastic anaemia, systemic
lupus, lupus Erythematosus, GVHD and non-malignant haematological diseases. Musculoskeletal excludes rheumatology indications, includes
muscular dystrophy, ontogenesis imperfecta, bone and cartilage injuries and degenerative disk disease. Neurological includes: spinal chord
injury, brain injury, Parkinson's disease, multiple sclerosis, Alzheimer’s and ALS. Rheumatology includes: Rheumatoid arthritis and
osteoarthritis. Sources: Alliance for regenerative medicine (2014), Heathman et al (2015), Li et al (2014) and Martin et al (2009).
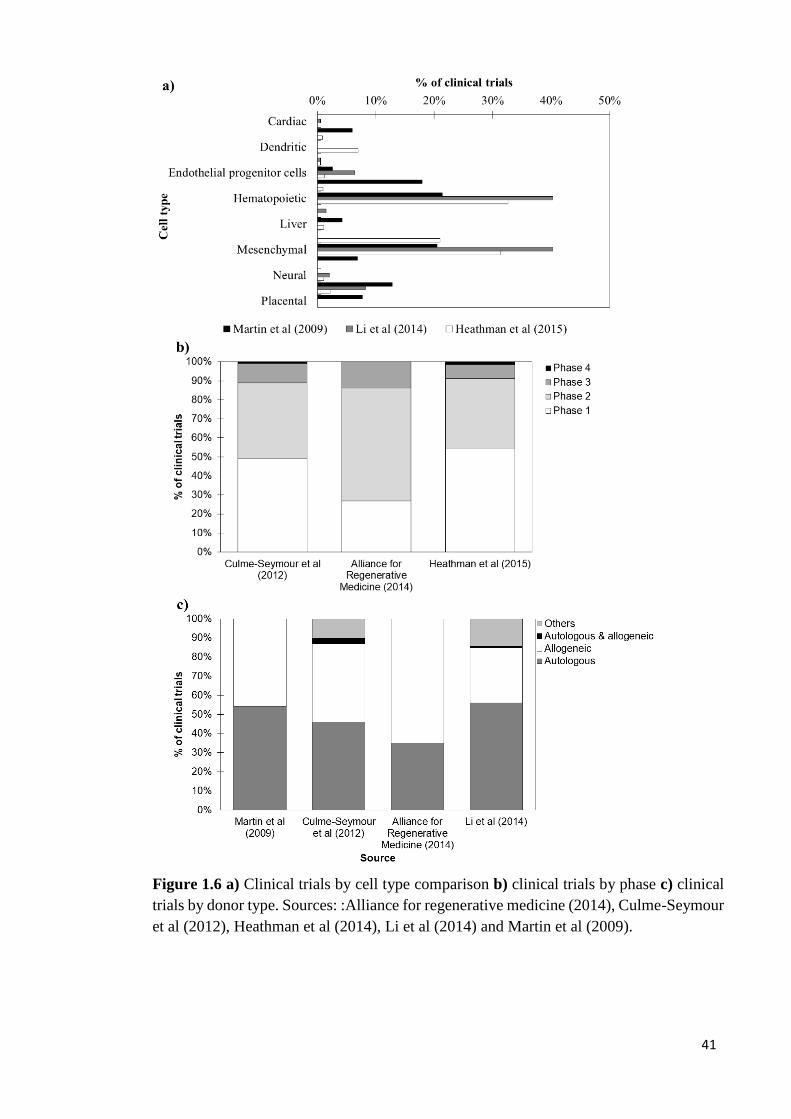
41
Figure 1.6 a) Clinical trials by cell type comparison b) clinical trials by phase c) clinical
trials by donor type. Sources: :Alliance for regenerative medicine (2014), Culme-Seymour
et al (2012), Heathman et al (2014), Li et al (2014) and Martin et al (2009).
42
1.3 MSC-based and CAR T-cell therapy products
1.3.1 MSC-based cell therapy products – characteristics, market and clinical trials
MSCs also referred to as mesenchymal stromal cells were first identified by Friedenstein
at colleagues (Mamidi et al. 2012). These are post-natal cells which are capable of self-
renewal and differentiation (Mendicino et al. 2014; Uccelli et al. 2008; Bianco 2014;
Raynaud et al. 2012). MSCs can be retrieved from multiple sources such as: the bone
marrow, adipose tissue, amniotic fluid, dental tissues, peripheral blood, placenta etc.
(Raynaud et al. 2012; Pittenger et al. 1999; Williams & Hare 2011; Wagner et al. 2005;
in `t Anker et al. 2003; Huang et al. 2009; Ab Kadir et al. 2012). Differences in in vitro
performance across different sources have been reported. For example umbilical cord-
blood derived MSCs (UCB-MSCs) present superior proliferation rate (Jin et al. 2013;
Wang et al. 2009). Moreover, neonatal MSCs (fetal, amniotic fluid, placental etc.) present
higher potency than adult MSCs (Wang et al. 2009).
The global market for MSCs is foreseen to reach $7.5B by 2022 with the United States
having the largest market share (34.3%) and Asia being the continent with the highest
projected CAGR (14.1%) (Global industry analysts 2016). MSCs have multiple
characteristics, which make them suitable for the treatment of different indications.
Benefits to the use of these cells include the fact that they have a small half-life (Trounson
& McDonald 2015), low immugenicity and low chances of tumour formation (Wei et al.
2013a; Le Blanc 2003).
Additional examples of the benefit of MSCs include their immunomodulatory capacity
as MSCs aid the suppression of activated T-cell proliferation as well as the suppression
of the release of cytokines by these T-cells. This makes MSCs suitable for the treatment
of graft vs host disease (GvHD), rheumatoid arthritis and Alzheimer’s among other

43
indications (Glenn & Whartenby 2014; Reinders et al. 2013; Bernardo et al. 2013;
Bartholomew et al. 2002; Sheng et al. 2008; Di Nicola et al. 2002; González et al. 2009).
Another important feature of MSCs is its capacity of differentiating into different cell
types such as cardiomyocytes, neurons and insulin producing cells. Therefore, MSCs are
suitable for the treatment of cardiovascular diseases, spinal cord injury, Parkinson’s and
diabetes (Noort et al. 2010; Ramkisoensing et al. 2011; Hare et al. 2009; Naghdi et al.
2009; Wang et al. 2010; Kan et al. 2007). Moreover, MSCs have also a paracrine
properties allowing them to secrete multiple molecules such as cytokines, chemokines
and growth factors (Squillaro et al. 2016; Trounson & McDonald 2015). Furthermore,
MSCs contain homing properties, which means that they are able to reach the location of
the injury. The ability of MSCs to do so is however dependent on multiple parameters
such as point of care delivery method, cell culture conditions, number of passages during
in vitro cell culture, cell age etc. (Ullah et al. 2015; Squillaro et al. 2016; Trounson &
McDonald 2015). Figure 1.7 summaries some of the target indications in MSC-based
clinical trials.
Multiple articles have been published on the trends of mesenchymal cell-based clinical
trials (Chen 2016; Heathman et al. 2015; Wei et al. 2013b; Trounson & McDonald 2015;
Ullah et al. 2015; Squillaro et al. 2016). These different sources have reported different
numbers of registered mesenchymal stem cell-based clinical trials varying between 334
and 578 (Chen 2016; Heathman et al. 2015; Wei et al. 2013b; Trounson & McDonald
2015; Ullah et al. 2015; Squillaro et al. 2016).

44
Figure 1.7 MSC-based clinical trials by indication. Endocrine, Metabolic & Genetic includes diabetes and renal diseases.
Gastrointestinal includes Crohn’s disease and ulcerative colitis. Inflammation, Immunology & non-malignant hematologic includes:
aplastic anaemia, systemic lupus, lupus Erythematosus, GVHD and non-malignant haematological diseases. Musculoskeletal excludes
rheumatology indications, includes muscular dystrophy, ontogenesis imperfecta, bone and cartilage injuries and degenerative disk
disease. Neurological includes: spinal cord injury, brain injury, Parkinson's disease, multiple sclerosis, Alzheimer’s and ALS.
Rheumatology includes: Rheumatoid arthritis and osteoarthritis. Sources: Chen et al (2016), Heathman et al (2015), Squillaro et al
(2016), Trounson et al (2015), Ullah et al (2015) and Wei et al (2013).

45
Figure 1.8 a) MSC-based clinical trials by year b) MSC-based clinical trials by phase c)
MSC-based clinical trials by cell source. Sources: Chen et al (2016), Heathman et al
(2015), Squillaro et al (2016) and Trounson et al (2015).

46
MSC clinical trials have shown encouraging results. For example, a Phase I study using
bone marrow MSCs in combination with peripheral blood MSCs and pallet-rich plasma
for the treatment of distal tibial fractures have shown that the use of MSCs results in a
50% reduction in time for fracture union with no complications (Liebergall et al. 2013).
Another example of the successful therapeutic application of MSCs is seen in Le Blanc
et al (2008) where the authors describe the use of bone marrow MSCs in patients with
acute GvHD following an allogeneic HSC transplant during a Phase I clinical trial. The
results show that the mortality rate 1 year post infusion transplantation decreased from
72% to 37% in patients that received the MSC-based treatment. This study also revealed
that there were no side effects during or instantly after the transplantation.
1.3.2 CAR T-cell therapy products – characteristics, market and clinical trials
Adoptive cell transfer ( ACT) immunotherapies have shown great potential during
clinical trials for the treatment of oncology indications (Reuters 2015; Tumaini et al.
2013; Valton et al. 2015; Hillerdal et al. 2014; Sumen et al. 2015; Cartellieri et al. 2014;
Chmielewski et al. 2013; Rosenberg & Restifo 2015). Such results create hope for long
term or total remission of cancer patients (Maus et al., 2014).
Mature T-cells can be divided into two subgroups: memory T-cells and naïve T-cells. In
case of infection, naïve T-cells are able to react to new antigens (Verhoeyen et al. 2003).
Once these meet peptide-major histocompatibility complex (pMHC), which their T-cell
receptor (TCR) shows affinity for, naïve T-cells start to divide and become effector cells.
These cells then die after the infection has passed (Berard & Tough 2002). The fraction
of differentiated effector cells which remain in the bloodstream are called memory T-cells
(Berard & Tough 2002). T-cell-based ACT therapies can be separated into three main
categories: Tumour infiltrating lymphocytes (TILs), T-cell receptors (TCRs) and
chimeric antigen receptors T-cell (CAR T) (Rosenberg & Restifo 2015). The relative

47
percentage of clinical trials across the different categories can be estimated at 19%, 25%
and 56% for TILs, TCRs and CAR T-cells respectively (PR Newswire 2016).
TILs are attained from metastatic legions in tumours (Sharpe & Mount 2015a; Stroncek
et al. 2015) via biopsy (Chmielewski et al. 2013; Dillman et al. 2004). These cells have
shown success in treating melanoma (Ascierto et al. 2015; Marr et al. 2012; Chmielewski
et al. 2013; Richard Morgan et al. 2006), with long lasting response rates of 50%-70%
(Tran et al. 2008). However, attaining and expanding these cells for a variety of different
tumours is challenging (Marr et al. 2012; Chmielewski et al. 2013; Hillerdal et al. 2014).
In order to overcome this sourcing limitation, TCRs and CAR T-cell therapies can be
used (Chmielewski et al. 2013; Sharpe & Mount 2015a). These cells are attained from the
peripheral blood and genetically engineered to recognise specific tumour associated
antigens (TAAs) (Chmielewski et al. 2013; Marr et al. 2012; Hillerdal et al. 2014;
Stroncek et al. 2015).
TCRs are an intracellular section of a T-cell receptor which recognizes specific pMHC in
TAAs (Chmielewski et al. 2013). These have shown promising results in oncology
clinical trials (Ascierto et al. 2015; R Morgan et al. 2006). However, a limited number of
pMHCs have been identified to date, which restrains the range of indications in which
TCRs can be applied as a therapy (Chmielewski et al. 2013). Moreover, the use of this
technique carriers the potential for serious auto-immunity, due to the development of
unexpected specificities (Chmielewski et al. 2013).
A CAR is an extracellular fragment of an antibody recognition domain (Milone et al.
2009; Chmielewski et al. 2013). CAR T-cells were first created in the Weizmann Institute
of Science, Israel in the late 80’s (Brower 2015; Rosenberg & Restifo 2015). Using CAR
T-cells has the advantage of having a non-pMHC dependent recognition (Rosenberg &

48
Restifo 2015; Chmielewski et al. 2013; Sumen et al. 2015; Maus et al. 2014; Kalos et al.
2011; Poirot et al. 2015) , which enables a higher number of indications to be targeted.
The global expenditure in cancer treatments reached $100B dollars in 2014 (Leonard
2015), putting cancer at the top of the healthcare priorities (Liechtenstein et al. 2013). As
such, the US Food and Drug Admiration (FDA) has endorsed the use CAR T-cell
therapies which target indications with no current efficacious treatment, by awarding
them the status of “breakthrough treatment“, which facilitates the market launch of such
therapies (Brower 2015). An example of this is the CAR T-cell therapy targeted at
lymphoblastic leukaemia and relapsed and refractory aggressive B Cell non-Hodgkin
lymphoma developed by Juno therapeutics (Seattle, WA, US). This therapy has received
the orphan drug status in 2014 (Brower 2015). Another example of the priority given to
CAR T-cell therapy products by regulatory agencies is the “breakthrough status” received
by Novartis (Basel, Switzerland) in 2014 for a CAR T-cell therapy product targeting
acute lymphoblastic leukaemia (Novartis 2015; Carroll 2014).
The CAR T-cell therapy market is now estimated at $10B USD (Ledford 2014). This
value is foreseen to grow to $30B USD by 2030 (PR Newswire 2016). There are only
two CAR T-cell products currently available in the market with selling prices ranging
between $373,000 (Yescarta®, Gilead, Foster city, CA, USA) and $475,000 (Kymria®,
Novartis, Basel, Switzerland) (Ramsey 2017; Sagonowsky 2017a). In America alone, the
annual demand for these products is foreseen to be 10,000 patients that have not
responded to traditional treatments (Reuters 2015; Porter et al. 2009).
The current COG per dose estimated for CAR T-cell therapies range between $45,000
USD and $150,000 USD (Reuters 2015), and, once successful process optimization is
achieved these costs are foreseen to drop to $25,000 USD - $35,000 USD (Walker &
Johnson 2016b). Speculative selling prices for future products range from $150,000 USD

49
to values as high as $500,00 USD (Reuters 2015; Ledford 2014; Ward & Crow 2015;
Voigt et al. 2016; Walker & Johnson 2016a). These selling prices would result in COG
as % sales of 5%-23% and 9% -99.9% for optimized and non-optimized processes
respectively. Moreover, if CAR T-cell therapies are to be curative treatments then selling
prices as high as $500,000 USD may be acceptable, as costs of current treatment regimens
for patients with multiple myeloma are around $318,000 USD to $1,190,120 USD for
43.4 months (~4 years) of treatment (Niphadkar et al. 2016)). The commercial feasibility
of current selling prices applied to CAR T-cell therapies was confirmed by a recent report
by the National Institute for Health and Care Excellence (NICE) that has revealed that an
acceptable reimbursement for these class of products would be around £356,100 per
patient in remission (Crabb & Stevens 2016).
The key indications being explored in CAR T-cell therapy clinical trials are
haematological malignancies (Figure 1.9) (Sharpe & Mount 2015a; Kalos et al. 2011).
Blood malignancies have a high incidence rate, with around 87,000 new cases of
leukaemia and non-Hodgkin’s lymphoma being reported yearly in the US (Porter et al.
2009), 4,000 of which are of acute lymphoblastic leukaemia (ALL) with 67% of these
patients being children and adolescents (Pui & Evans 2006). CAR T-cell therapies may
be used as an efficacious treatment for ALL as clinical trials have shown response rates
as high as 80% (Sumen et al. 2015).
Dose sizes explored during the clinical trials vary between 1×10⁶ cells/ dose and 1×10¹¹
cells/ dose (clinicaltrials.gov n.d.; Rosenberg et al. 1994; Lamers et al. 2006; Porter et al.
2009; Morgan et al. 2010b). The side effects reported in CAR T-cell clinical trials range
from fever and diarrhoea (Parkhurst et al. 2011) to lethal cases of cardiactic toxicity,
respiratory distress and neurologic toxicity (Morgan et al. 2010b; Morgan et al. 2013;
Cameron et al. 2013; Linette et al. 2013).

50
A search on the ClinicalTrials.gov registry using the term “CAR T-cells” in January 2016,
has revealed a total of 119 clinical trials. The results show that the number of clinical
trials using CART-cells has increased over the years as shown in Figure 1.9 a. Moreover,
the results also revealed that the key sponsors for clinical trials using CAR T-cells are
Abramson cancer centre (University of Pennsylvania), the Bayor College of Medicine
and the National Cancer Institute. Furthermore, the results show that the majority of
clinical trials are autologous, on the initial stages of the clinical trial pathway and that
there is an even distribution in the use of γ-retrovirus and lentivirus vector for gene
editing. These trends are summarized in Figures 1.9-1.11.
Figure 1.9 a) CAR T-cell-based clinical trials by year b) CAR T-cell-based clinical trials
by indication. Source: ClinicalTrials.gov.

51
Figure 1.10 CAR T-cell based clinical trials by sponsor. Source: ClinicalTrials.gov.

52
Figure 1.11 a) CAR T-cell-based clinical trials by donor source b) CART-cell-based
clinical trials by gene delivery method. c) CAR T-cell based clinical trials by phase.
Source: ClinicalTrials.gov.

53
1.4 Manufacturing process
The manufacturing process of allogeneic MSCs starts with the acquisition of the cells
from donor tissue and it is followed by a cell culture step and a wash and concentration
step. The manufacturing process of CAR T-cells is more complex and starts with attaining
the donor’s peripheral blood mononuclear cells (PBMC). T-cells are then enriched,
activated, genetically modified, cultured, washed and formulated. Figure 1.12
summarises the key steps used in both processes.
Figure 1.12 Schematic representation of manufacturing processes for MSC-based cell
therapies and CAR T-cell therapies.
54
1.4.1 Pre-cell culture steps
In MSC-based cell therapies, MSCs are first isolated from the initial cell source, (e.g.
adipose tissue, bone marrow etc.). Techniques used for bone marrow isolation include
enzymatic and mechanic methods (Lindroos et al. 2009). In CAR T-cell therapy the
manufacturing process often starts with attaining the patients PBMCs (A Kaiser et al.
2015; Poirot et al. 2015). This is typically done via leukapheresis (Singh et al. 2013a;
Gašová et al. 2005; A Kaiser et al. 2015; Stroncek et al. 2015; B Levine 2015; Rees 2014).
A relatively low risk procedure, during which typically 2 to 3 blood volumes from the
patients is collected (Gašová et al. 2005; Bruce Levine 2015).
In CAR T-cell manufacturing processes PBMCs may be enriched for T-cells (T-cell
isolation) prior to activation (A Kaiser et al. 2015; Poirot et al. 2015; Kalos et al. 2011),
or activated without enrichment (Poirot et al. 2015). T-cell enrichment can be carried out
through different methods including size exclusion methods (e.g. Filtration) (Danova et
al. 2011) and density gradient methods (e.g. Ficoll) (Danova et al. 2011; Lamers et al.
2002; Zhou et al. 2003; Hillerdal et al. 2014). Additional techniques for T-cell enrichment
include immune magnetic methods ( antibody-specific bead-based separation) (Ascierto
et al. 2015; Stroncek et al. 2015; Danova et al. 2011).
In both allogeneic CAR T-cell and allogeneic MSC-based processes, a cell bank may be
built in order to produce and store an extensive uniform archive of readily available
starting material. During this process, the isolated cells are cultured in order to achieve
satisfactory numbers (Harel Adrian 2013). These cells are then characterized and
cryopreserved (Harel Adrian 2013).
During the manufacturing process of CAR T-cell therapy products, T-cell activation starts
with the engagement of a TCR and an antigen usually bound to a major histocompatibility
complex (MHC) (Lever et al. 2014; Green et al. 2000). Once the T-cells are activated
they start dividing, differentiating and destroying target cells (Lever et al. 2014). T-cell

55
activation often takes place in the presence of anti-CD3 and Anti-CD28 antibodies,
(Trickett & Kwan 2003; Tumaini et al. 2013; Dropulic & June 2006; Zhou et al. 2003;
Schoenborn et al. 2007; Kalos et al. 2011; Melchiori et al. 2014; Ascierto et al. 2015;
Cartellieri et al. 2014; A Kaiser et al. 2015; B Levine 2015; Rees 2014; Walker & Johnson
2016b). Anti-CD3 are able to stimulate T-cell proliferation through the TCR (Li &
Kurlander 2010; Thompson et al. 1989). However, in the absence of a co-stimulatory
molecule, the cells are short lived. Co-stimulatory molecules promote cell proliferation
without early cell apoptosis (Li & Kurlander 2010). The most widely used co-stimulation
factor is the CD28 receptor (Green et al. 2000; Li & Kurlander 2010; Thompson et al.
1989). Anti-CD3 and CD28 stimulators can be used in three different configurations
including antibody coated beads (Tumaini et al. 2013; A Kaiser et al. 2015; Zhou et al.
2003; Melchiori et al. 2014; Cartellieri et al. 2014; B Levine 2015; Rees 2014; Li &
Kurlander 2010), cell culture vessel coating (Schoenborn et al. 2007; Zhong et al. 2010)
and nanomatrix (B Levine 2015).
T-cell activation also requires interleukin 2 (il-2) (Lamers et al. 2002; Schoenborn et al.
2007; Zhou et al. 2003; Ascierto et al. 2015). Interleukin 2 is essential in the
differentiation of T-cells into effector cells after T-cell activation using antigens (Boyman
& Sprent 2012). This compound was first approved by the FDA during the 90’s as a
stimulator of effector cells for treatment for metastatic renal cancer (Dillman et al. 2004).
Gene editing is a critical step of the CAR T-cell manufacturing process (Verhoeyen et al.
2003). This step can be carried out using viral or non-viral methods (A Kaiser et al. 2015;
Dai et al. 2016; Voigt et al. 2016). The challenges in achieving satisfactory T-cell genetic
modification in the absence of viral vectors are higher (Zhao et al. 2006; Qasim &
Thrasher 2014; Malek n.d.). These methods include DNA transfection (Jena et al. 2010;
A Kaiser et al. 2015; Brentjens 2012; Qasim & Thrasher 2014; Malek n.d.) and
transposons (Malek n.d.; Brentjens 2012; Dai et al. 2016; Qasim & Thrasher 2014; Voigt

56
et al. 2016; B Levine 2015), such as the sleeping beauty (Voigt et al. 2016; Qasim &
Thrasher 2014; B Levine 2015).
Typical viral vectors used for gene editing are the γ-retrovirus (Tumaini et al. 2013;
Cartellieri et al. 2014; A Kaiser et al. 2015; Brentjens 2012; Morgan et al. 2010a; Ascierto
et al. 2015; Malek n.d.; Walker & Johnson 2016b) and the lentivirus (Cartellieri et al.
2014; A Kaiser et al. 2015; Brentjens 2012; Valton et al. 2015; Hillerdal et al. 2014; Kalos
et al. 2011; Linette et al. 2013; Milone et al. 2009; Rees 2014). One of the key differences
between the two is the fact that the γ-retrovirus cannot infect non-dividing cells (Cooray
et al. 2012; L Naldini et al. 1996), as they require deconstruction of the nucleus of the
target cell for integration of the cDNA into the chromosome (Liechtenstein et al. 2013).
Lentiviral vectors on the other hand are capable of transducing non-dividing cells
(Liechtenstein et al. 2013; Dufait et al. 2012; Cribbs et al. 2013; Dai et al. 2016).
Moreover, lentiviral vectors are potentially safer than γ-retroviral vectors (Liechtenstein
et al. 2013; Kalos et al. 2011) as γ-retrovirus have a higher risk of insertional mutagenesis
(Kalos et al. 2011; B Levine 2015). An example where the safety of γ-retrovirus was
questioned is the clinical trial for X-linked severe combined imogenicity (SCID) using
murine leukaemia virus (MlV), where several patients developed leukaemia (Dufait et al.
2012; Qasim & Thrasher 2014). Furthermore, lentiviral vectors have also higher
efficiency in transducing T-cells (Kalos et al. 2011; Zhou et al. 2003).
The viral quantities added into the process are measured in multicity of infection (MOI).
Different studies have employed different MOI values ranging from between 0.2-18
(Valton et al. 2015; Zhou et al. 2003; Milone et al. 2009; Barry et al. 2000). Barry et al.
(2000) describes the transduction efficiency of up to 93% across T-cell lines with MOI
values varying between 0.5 and 2 when using lentiviral vectors.
One of the key disadvantages related to the use of lentiviral vectors relates to the difficulty
of achieving stable packaging cell lines for viral production (Cooray et al. 2012; Qasim

57
& Thrasher 2014). Stable packaging cell lines are available with γ-retroviral vectors,
facilitating large scale production of these vectors (Qasim & Thrasher 2014). Another key
difference between the use of γ-retrovirus and lentivirus is that processes employing γ-
retrovirus for gene editing require the use of retronectin for co-localization of T-cells and
the viral vector (Tumaini et al. 2013; Dodo et al. 2014; Rees 2014; Cooray et al. 2012;
Ascierto et al. 2015). This reagent is typically added to the cell culture vessel at a
concentration of 4-20 ug/cm2 (Takara n.d.; Lamers et al. 2002).
A comparison between the use of lentiviral vector and the use of non-viral vector genetic
modification methods such as transposons has revealed stable gene transfer using
transposons with lower efficiency than with lentiviral vector (Field et al. 2013). Although
lower transduction efficiencies have been reported with transposons, these have been used
in clinical trials (Singh et al. 2013a). Moreover, transposons are seen as more cost-
effective method for gene editing than viral vectors (Field et al. 2013; Singh et al. 2013a;
Dai et al. 2016).
A second genetic modification step is used in allogeneic CAR T-cell processes. This step
is used to genetically modify the transduced CAR T-cells in order to minimize the risk of
GvHD and suppress the CD52 gene so that cells can survive even when drugs such as
lemtuzumab (anti-CD52) have been used. GvHD is minimized by targeting the constant
region of alpha chain of the T-cell receptor (TRAC). This second genetic modification
step is currently carried out using transcription activator-like effector nuclease (TALEN)
via electrophoration (Qasim et al. 2017).
1.4.2 Cell culture
MSCs require surface adherence for cell culture and have limited proliferation in vitro
(Szczypka et al. 2014; Heathman et al. 2015). In large-scale manufacture of MSCs,
multiple expansion stages are required, where the cells are collected from one reactor and
diluted into multiple reactors. This process is called passage. During cell passage, the cell

58
culture media is removed from the cell containing cell culture vessel, the cells are then
washed using PBS and detached from the surface of the cell culture vessel via enzymatic
digestion (Hussain et al. 2013). During enzymatic digestion, trypsin is added to re-
suspend the cells at volume: area ratio of approximately 1ml:25cm2 and the cells are
incubated at around 37°C for 2-10 minutes (Borowski et al. 2008). The enzymatic
reaction is then quenched using cell culture media and the resulting solution is distributed
through a number of cell culture vessels prefilled with media (Borowski et al. 2008).
MSCs grow to cell densities of 25,00-30,00 cells/cm2(Rowley et al. 2012; Szczypka et al.
2014), with proliferation rates varying between 47 hours to over 80 hours depending on
the cell source. The proliferation rate of MSCs decreases with increasing number of
passages (Peng et al. 2008; Lu et al. 2006).
Given the limited in vivo proliferation of T-cells (Kalos et al. 2011; Sun et al. 2015), in
vitro T-cell expansion is also required. This is done in suspension. CAR T-cell culture
can last between 5 and 12 days and its carried out in the presence of il-2 (Tumaini et al.
2013; Valton et al. 2015; Linette et al. 2013; Porter et al. 2009; Kalos et al. 2011;
Melchiori et al. 2014; Sumen et al. 2015; Granzin et al. 2015; B Levine 2015; Rees 2014;
Dai et al. 2016; Walker & Johnson 2016b; Apel et al. 2013; Rosenberg & Restifo 2015).
During the cell culture of CAR T-cells, the cells are often maintained at an optimal
concentration of 2 × 10⁶ - 1 × 10⁷ (Ascierto et al. 2015; Hollyman et al. 2009b; GE
healthcare n.d.; Cameron et al. 2013; Cartellieri et al. 2014; Singh et al. 2013b). This
optimal concentration is considerably higher in perfusion cell culture as new cell culture
media is constantly added to the bioreactor such as to replenish glucose and IL-2 levels
and reduce lactate and ammonia levels in cell culture (Janas et al. 2015). Multiple sources
have reported different proliferation rates for CAR T-cell therapies, these values are
summarised in Table 1.3.

59
Table 1.3 Proliferation rate of CAR T-cells
Source Fold increase No of
days
Activation method Expansion method Expansion mode Calculated Cell
doubling time
Bajgain et al (2014) 100 12 - Gas permeable vessel Static 43
Butler et al (2012) max ~3,000 28 CD3/CD28 dynabeads
(Invitrogen)
- - 164
Butler et al (2012) Min ~200 28 CD3/CD28 dynabeads
(Invitrogen)
- - 239
Carswell & Papoutsakis
(2000)
5 8 - Non- sparged STR STR 68
Carswell & Papoutsakis
(2000)
3 8 - Sparged STR STR 96
Carswell & Papoutsakis
(2000(
7 8 - T-flask Static 56
Curran et al (2015)
(Max)
~70 21 CD3/CD28 dynabeads
(Invitrogen)
- - 168
Curran et al (2015)
(Min)
~25 21 CD3/CD28 dynabeads
(Invitrogen)
- - 217
Dang et al (2007) Max ~20 24 CD3/CD28 dynabeads
(Invitrogen or Xcyte)
Culture flasks Static 363
Dang et al (2007) (Min) ~10 24 CD3/CD28 dynabeads
(Invitrogen or Xcyte)
Culture flasks Static 363
Garland et al (1999) ~6.4 10 Allogeneic stimulator
cells
TTC bags Static 93
Garland et al (1999)
(Max)
250 14 CD3/CD28 (Dynal
biotech)
- - 59
Garland et al (1999)
(Min)
~4 10 Allogeneic stimulator
cells
Micro-well plates Static 120

60
Source Fold increase No of
days
Activation method Expansion method Expansion mode Calculated Cell
doubling time
Garland at al (1999) ~3.6 10 Allogeneic stimulator
cells
Culture flasks Static 120
Garlie et al (1999) (Min) 4 14 CD3/CD28 (Dynal
biotech)
- - 212
GE healthcare ( n.d.)
(1L)
~ 38 11 CD3/CD28 dynabeads
(Invitrogen)
VueLife bags & rocking
motion bioreactor
Static & perfusion 56
GE healthcare (n.d.)
(5L)
~24 11 CD3/CD28 dynabeads
(Invitrogen)
VueLife bags & rocking
motion bioreactor
Static & perfusion 63
Hoffmann et al (2004)
(Min)
2,200 26 CD3/CD28 (Dynal
biotech)
Micro-well plates Static 147
Hoffmann et al (2004) 56,900 23 CD3/CD28 (Dynal
biotech)
Micro-well plates Static 80
Hollyman et al (2009)
(Max)
668 17 CD3/CD28 dynabeads
(Invitrogen or Xcyte)
Orgien suspension bags
& Rocking motion
bioreactor
Static & perfusion
74
Hollyman et al (2009)
(Min)
100 17 CD3/CD28 dynabeads
(Invitrogen or Xcyte)
Orgien suspension bags
& Rocking motion
bioreactor
Static & perfusion
104
Jackson et al (2004)
(Max)
100 10 NY-ESO-11 – 13/ h NY-
ESO-1155 – 167
Micro-well plates Static 36
Jackson et al (2004)
(Min)
40 10 NY-ESO-11 – 13/ h NY-
ESO-1155 – 167
Micro-well plates Static 45
Janas et al (2015) 400 14 CD3/CD28 expander
beads (Life technologies)
Culture flasks &
Rocking motion
bioreactor
Perfusion 39
Janas et al (2015) 160 14 CD3/CD28 expander
beads (Life technologies)
Culture flasks &
Rocking motion
bioreactor
Static 46
Kalamasz et al (1997)
(Control)
~70 10 CD3/CD28 beads (Xcyte
dynabeads)
Micro-well plates
Static
39
Kowolik et al (2005)
(Max)
40 14 - Micro-well plates Static 88

61
Source Fold increase No of
days
Activation method Expansion method Expansion mode Calculated Cell
doubling time
Kowolik et al (2005)
(Min)
1 14 - Micro-well plates Static -
Lambert et al (2017)
(Max)
~16 19 CD3/CD28 PDMS beads Micro-well plates Static 228
Lambert et al (2017)
(Min)
~6 19 CD3/CD28 PDMS beads Micro-well plates Static 288
Levine et al (1998) 7.9 17 CD3/CD28 (Dynal
biotech)
Gas permeable bags
(Nexcell therapeutics)
Static 257
Levine et al (1998) 9 17 CD3/CD28 (Dynal
biotech)
Culture flasks Static 204
Mock et al (2016) 16.2 8 TransAct (soluble
colloidal reagent with
anti-CD3/CD28
antibodies)
Integrated USP/DSP
platform
Static 48
Parker et al (2000)
(Max)
3,050,000 56 CD3 in solution Micro-well plate
Static
353
Parker et al (2000) (Min) 119 25 CD3 in solution Micro-well plate
Static
214
Rasmussen et al (2010)
(Max)
335 10 CD3/CD28 dynabeads
(Invitrogen)
Micro-well plates &
culture flasks
Static 29
Rasmussen et al (2010)
(Min)
230 10 CD3/CD28 dynabeads
(Invitrogen)
Micro-well plates &
culture flasks
Static 31
Smith et al (2015) (Max) 300 ~14 CD3/CD28 CTS
dynabeads (Life
technologies)
Micro-well plates
Static
57
Smith et al (2015) (Min) 120 ~14 CD3/CD28 CTS
dynabeads (Life
technologies)
Micro-well plates
Static
68
Startz et al (2016) (Max) 578 13 CD3/CD28 T-cell
activator (Life
technologies)
Hollow fibre bioreactor Perfusion 34

62
Source Fold increase No of
days
Activation method Expansion method Expansion mode Calculated Cell
doubling time
Startz et al (2016) (Min) 73.5 12 CD3/CD28 T-cell
activator (Life
technologies)
Hollow fibre bioreactor Perfusion 46
Thompson et al (1989) ~35,000 38 CD3/CD28 (Dynal
biotech)
Micro-well plates &
culture flasks
Static 228
Tran et al (2007) (Max) 1,700 14 Single chain CD3 Vue life Static
suspension bag or culture
flasks
Rocking motion
bioreactor
Static & Perfusion 44
Tran et al (2007) (Min) 247 14 Single chain CD3 Vue life Static
suspension bag or culture
flasks
Rocking motion
bioreactor
Static & Perfusion 59
Trickett & Kwan (2003)
(Max)
~1,800 14 CD3/CD28 dynabeads
(Dynal biotech)
Culture flasks Static 44
Trickett & Kwan (2003)
(Min)
~10,000 14 CD3/CD28 dynabeads
(Dynal biotech)
Culture flasks Static 35
* Doubling time were calculated under the assumption that the cells grow exponentially

63
1.4.3 Post-cell culture steps
MSCs can differentiate into multiple type of cells including adipose, chondrocytes and
osteocytes (Lu et al. 2006; Peng et al. 2008; Hass et al. 2011). Cell differentiation is
achieved through specific pathways using chemical stimulations in the cell culture
(Brandenberger et al. 2011). These stimuli can be soluble (dissolved in the media) or
insoluble (from the adhesion matrix) (Brandenberger et al. 2011).
Washing and concentrating cells is required to remove unwanted process excipients such
as residual serum and trypsin, as well as to reduce the volume of the product in order to
achieve the desired final formulation cell concentration. As the cells are the product, this
process must have low shear such as to maintain cell viability (Raviv & Karnieli 2014).
When designing a wash and concentration step for cell therapy products (including both
CAR T-cell and MSC-based therapies), regulatory stipulations must be taken into
account, for example the serum content of the final cell suspension must not exceed the
1ppm (Pattasseril et al. 2013). Moreover, since the product cannot be sterilised and is
often administrated intravenously, it is important to achieve an acceptably high impurity
removal level of at least 85% and cell viabilities of at least 90% during the short
downstream process (DSP) (Pattasseril et al. 2013).
A final purification step is used in allogeneic CAR T-cell therapy and is carried out using
magnetic selection (Qasim et al. 2017). This step is required to furthere reduce the risk of
GvHD (Qasim et al. 2017).
Cryopreservation is used to extend the shelf-life of the products. To do so, freezing media
containing 10% dimethyl sulfoxide (DMSO) is typically used (Coopman & Medcalf
2008; Borowski et al. 2008) and cells as frozen using a controlled rate freezer (Thirumala
et al. 2009).
64
1.5 Technologies for cell therapy manufacture
1.5.1 Pre-cell culture technologies
In CAR T-cell therapy, technologies used to remove bulk red blood cells and platelet
contaminants include: LOVO® (Frensenius Kabi, Bad Homburg vor der Höhe,
Germany), COBE® 2991 (Terumo BCT, Lakewood, CO, USA) and the Cell Saver 5+®
(Heamonetics, MA, USA) (Wang & Rivière 2016; Bruce Levine 2015). LOVO® uses a
spinning membrane filtration technology to purify cells (Wegener 2014). This technology
can handle between 0.1L and 7.4L (Fresenius Kabi n.d.) at a flowrate of 1.7 L/h (200ml
in 7min) (Fresenius Kabi n.d.) and achieve 92.3% recovery of white blood cells (Wegener
et al. 2013). The COBE 2991® centrifuge, has been used in cell processing for over 30
years (Rontis medical n.d.). This centrifuge has the ability to purify mononuclear cells
with 89% recovery (Dragani et al. 1990) in a 0.55L chamber (Levine 2011a) and operates
at a flowrate of 4L/h (Pattasseril et al. 2013). The Cell saver 5+® is a autologous blood
recovery system used in surgical procedures where blood loss occurs (Haemonetics n.d.).
This technology is available in different bow sizes (70ml-225ml ) and can process 800ml
per minute (Haemonetics n.d.). Moreover, the Cell saver 5+® can recover up to 94% of
red blood cells (Serrick & Scholz 2005).
For T-lymphocyte enrichment and monocyte reduction in CAR T-cell therapy processes
technologies such as the Sepax® (Biosafe, GE healthcare, Buckinghamshire UK)
Elutra® (Terumo, Lakewood, CO, USA) can be used (Wang & Rivière 2016; Powell et
al. 2009; Bruce Levine 2015; Levine 2011a). Sepax II®, employs centrifugation to wash
volumes between 50 and 880ml, in approximately 40min, with approximately 94% CD4+
cell recovery (Biosafe n.d.; Food and drugs agency 2011). Elutra® is a counter flow
separation system which can separate an entire apheresis sample in 1 to 2 hours (Levine
2011b). This technology has a chamber volume of 40L and the flowrate is 150ml per
minute (CaridianBCT 2008). For enrichment of specific T-cell populations such as CD4+,

65
CD8+ and CD25+, magnetic separation with instruments such as CliniMACS Plus®
(Miltenyi Biotec) are often employed (Bruce Levine 2015; Wang & Rivière 2016;
Willasch et al. 2010; Semple et al. 1993). This technology allows for purity and yield of
95% and above to be achieved (Willasch et al. 2010; Semple et al. 1993).
1.5.2 Cell culture technologies
1.5.2.1 Planar cell culture vessels
T-flasks & multilayer vessels
T-flasks are available in different configurations, from 25cm2 to 1,720cm2 (Corning(R)
n.d.). Both T-cells and MSC cells can be cultured using T-flaks (Stroncek et al. 2015;
Ascierto et al. 2015; Granzin et al. 2015; Rowley et al. 2012). These flasks are often used
in lab-scale manufacture and require open steps making the process susceptible to
microbial contamination (Ascierto et al. 2015). For larger scales multilayer flaks are
available (Lambrechts et al. 2016). These cell culture flasks are used in 26.1% of MSC-
based clinical trials (Lambrechts et al. 2016).
Multilayer flasks are available in a 10-layer configuration and can be scaled-up to up to
40 layers in compliance with good manufacturing practice (GMP) guidelines (Rowley
et al. 2012). Moreover, these flasks can provide can provide up-to 25,280cm2 for cell
growth (ThermoFisher scientific n.d.). Similarly to T-flasks, multilayer flasks can also
be used in MSC and CAR T-cell processes. Scaling-up using these multilayer flasks is
achieved by increasing the number of layers and vessels (Rowley et al. 2012).
Alternatives to ease scaling-up using multilayer vessels include the incorporation of
robotics for cell culture vessel manipulation (Rowley et al. 2012).
Multi-plate bioreactors
Multi-plate bioreactors account for 1.4% of MSC-based cell therapy trials (Lambrechts
et al. 2016), and offer a closed environment for cell expansion (Pereira Chilima et al.
2016; Michiels & Egloff 2013). These bioreactors are typically used for the expansion of

66
adherent cells such as MSCs. Multi-plate bioreactors simulate a similar
microenvironment as traditional open processes while providing an integrated process
control (Pereira Chilima et al. 2016; Michiels & Egloff 2013; Simaria et al. 2014b).
Moreover, these bioreactors are also available in multiple configurations, which each
plate providing 620cm2 for adherent cell growth, and, the number of plates per bioreactor
varying between 10 and 200 (Szczypka et al. 2014; Castillo 2014; Michiels & Egloff
2013).
Gas permeable vessels (G-Rex ®)
An example of a gas permeable vessel is the G-Rex ® series (WilsonWolf, Minnesota,
US). These flasks can be used for T-cell expansion (A Kaiser et al. 2015; Sun et al. 2015;
Somerville & Dudley 2012; Jin et al. 2012; Ascierto et al. 2015; Andrew Kaiser et al.
2015). Gas permeable vessels are available in open and closed configurations, with sizes
varying from 2cm2 to 500cm2 and cell growth capacity of 20B to 20B cells (Wilson
Wolf n.d.). Key advantages using gas permeable vessels include the enhanced oxygen
supply to the cells through the use of a gas permeable membrane and linear scale-up
(Bajgain et al. 2014; Wilson Wolf n.d.). This enhanced oxygen supply allows cells to
grow to a higher cell density (1x10⁷ cells/ml) (Ascierto et al. 2015). Which results in
lower costs with respect to T-flasks (Jin et al. 2012). Moreover, gas permeable vessels
have also shown similar and even superior performance than rocking motion bioreactor
(B Levine 2015).
1.5.2.2 3-D cell culture vessels
Static suspension bags
T-cells can be cultured in suspension bags (Lamers et al. 2002; Somerville & Dudley
2012). These gas permeable bags are available in multiple configurations with volumes
as high as 3L and hence are capable of supporting T-cell applications with high cell

67
numbers (Saint-Gobain 2016). Disadvantages of the use of static suspension bags include
the fact that this technology is labour intensive (B Levine 2015; Somerville & Dudley
2012) and scale-up using suspension bags may not be linear (Somerville & Dudley 2012).
Typical cell concentrations achieved in suspension bags range between 2×10⁶ and 6×10⁶
cells/ml (Ascierto et al. 2015).
Hollow fibre bioreactor
Hollow fibre bioreactors can be used for CAR T-cell culture and have been employed in
11.6% of MSC-based clinical trials (Startz et al. 2016; Dillman et al. 2004; Ascierto et al.
2015; Lambert et al. 2017). Hollow fibre technology has been applied in a number of
applications such as tangential flow filtration (TFF) and perfusion cell cultures (Whitford
& Cadwell 2009) and provide a functionally closed system for cell growth. Moreover,
hollow fibre bioreactors can perform automated tasks such as seeding, harvest and media
exchange. Furthermore, these bioreactors provide up to 21,000cm2 for adherent cell
growth (Startz et al. 2016). Hollow fibre bioreactors contain two circulation loops:
interpapillary and extracapillary loops (Hanley et al. 2014). Media and reagents can be
fed into the bioreactor through both loops and cells can only be fed via interpapillary loop
(Hanley et al. 2014). A recycling loop is connected to the to the extracapillary loop where
fresh or re-oxygenated media can circulate back to the cells (Whitford & Cadwell 2009;
Hanley et al. 2014).
Packed bed reactors
Packed bed bioreactors where originally used in manufacturing antibodies and proteins,
since the extracellular product can be continuously harvested through media recycling
(Rowley et al. 2012). These bioreactors are now employed in 8.7% of MSC-based clinical
trials (Lambrechts et al. 2016). The size of packed bed bioreactors may vary between
10ml to 40L (Rowley et al. 2012). The carriers used in packed bed bioreactors may come
in different configurations such as pours and non-pours glass beads, woven disks and

68
glass fibres (Meuwly et al. 2007; Park & Stephanopoulos 1993; Wang et al. 1992) and
typically allow for a total surface are for cell growth of 8,000 cm2/L (Karnieli 2015).
Furthermore, the use of this bioreactor is also believed to reduce cost of goods due to the
high surface area to volume ratio (Raviv & Karnieli 2014). One of the challenges
associated with the use of this technology is the maintenance of axial and radial
homogeneous nutrient distribution (Rowley et al. 2012). This affects the homogeneity of
the cell density profile across the bed (Rowley et al. 2012). A possible strategy to address
this problem is the introduction of impellers to agitate the media for a more homogeneous
profile (Rowley et al. 2012). Furthermore, cell recovery from the carriers is also
challenging (Rowley et al. 2012; Raviv & Karnieli 2014). Pluristem (Haifa, Israel) has
addressed this issue by employing controlled agitation and movement to aid enzymatic
dissociation of cells from the carriers (Raviv & Karnieli 2014).
Rocking motion bioreactor
Rocking motion bioreactor has been used in other biopharma processes and can be
operated in both batch and perfusion mode (Sadeghi et al. 2011; Somerville & Dudley
2012). These bioreactors employ rocking motion to enhance mixing (B Levine 2015).
Rocking motion bioreactors can be employed for both suspension and adherent cells
expansion (A Kaiser et al. 2015; Kalos et al. 2011; Sadeghi et al. 2011; Melchiori et al.
2014; Somerville & Dudley 2012; Ascierto et al. 2015; Porter et al. 2009; Timmins et al.
2012; Szczypka et al. 2014). The use of rocking motion bioreactors in adherent cell
culture is frequently coupled with microcarriers (Timmins et al. 2012; Szczypka et al.
2014). Rocking motion bioreactors currently available in the market for cell therapy
applications include the Xuri® (GE healthcare, Buckinghamshire, England) and the
XRS® (Pall corporation, NY, US). Combined these can offer configurations ranging from
2L to 50 L (GE Healthcare 2014; Pall Corporation n.d.).
Stirred tank bioreactor

69
Stainless steel stirred tank bioreactors have been employed in the biopharmaceutical
industry in volumes of up to 10,000’s of litres (Szczypka et al. 2014). In adherent cell
therapy expansion, stirred tank bioreactors are single-use and are often used with
microcarriers (Julaey et al. 2016; Mizukami et al. 2016; Lawson et al. 2017; Petry et al.
2016; Jossen et al. 2014; Dufey et al. 2017; Rafiq 2013; Tsai & Ma 2016). These
bioreactors, account for 52.2% of MSC-based clinical trials (Lambrechts et al. 2016).
Stirred tank bioreactors with microcarriers have been proposed a solution for expansion
of adherent stem cells for indications with very large annual demands due to their higher
capacity (Simaria et al. 2014b). Besides the increased surface area for cell culture, an
additional benefit of using stirred tank bioreactors is that they give a greater control over
the cell culture environment, including monitoring and control of process parameters
(Petry et al. 2016). Stirred tank bioreactors available in the market include the CelliGen
BLU® (Eppendorf, Hanburg, Germany) CellReady® (Millipore, Billerica, MA USA),
PadReactor® (Pall corporation, NY, US ) and BIOSTAT STR® (Sartorious Stedim,
Aubagne, France). Together these bioreactors have volumes ranging from 1L to 2,000L
(Brindley et al. 2014). One of the challenges to the use of this bioreactor is achieving
optimal hydrodynamic shear which is controlled by the impellers in the bioreactor
(Panchalingam et al. 2015). If this shear is too low then cell aggregates may formed; if is
too high however, damage to the cells or unwanted differentiation may occur
(Panchalingam et al. 2015).

70
Table 1.4 Examples of microcarriers available in the market
Name Manufacturer Type Surface Interaction type Surface
area (cm2/g)
Working
concentration (g/l)
Average
cm2/L
Cultispher-S Sigma-Aldrich Porous Gelatinb Porcine Gelatinj 7,500j 1-3a, d, g, l 15,000
Cytophore 1 Pharmacia Macroporous Cross-linked cotton
cellulosee
Diethylaminoethyl e, j 11,000e 2 e, j 22,000
Cytophore 2 Pharmacia Macroporous 11,000e 2e, j 22,000
Cultispher-G Sigma-Aldrich Porous Gelatinb, e Gelatine, j 40,000e 1-8.5d, e, h 180,000
Cytodex 3 GE Healthcare Microporous Dextran, Gelatinb, j Denatured collagene, j, k 2,700e,j 0.5-5c,e, g, k, l 6075
Cytodex 1 GE Healthcare Porous Dextran, positively
chargedb, j
Diethylaminoethyle, j 4,400e, f, k 1.2-5e, f, h, k 13,860
DE53 Whatman Non-Porous Cellulosee Diethylaminoethyle 6,800e 4e 27,200
DE52 Whatman Non-Porous Cellulosee Diethylaminoethyle 6,800e 4e 27,200
QA52 Whatman Non-Porous Cellulosee Quaternary Ammoniume 6,800e 4e 27,200
CM52 Whatman Non-Porous Cellulosee Carboxymethyle 6,800e 4e 27,200
Typopearl Tosho Biosciences Non-Porous Hydroxylated
Methacrylatee
Tresyl ligand derivatized
with Protamine sulfatee
42,00e 1e 4,200
TSKge1 Tosho Biosciences Non-Porous Hydroxylated
Methacrylatee
Tresyl ligand derivatized
with Protamine sulfatee
9,000e 0.2e 1,800
Hillex II Pall Solohil Non-Porous Dextran, surface coatedb, j Modified
Polystyrene,
modified with
cationic trimethylammoniumj
515i 10-50i, j 15,450
aMelero-Martin et al. 2006 bMartin, Eldardiri, Lawrence-Watt, & Sharpe, 2011 cFernandes et al., 2009

71
dPercell Biolytica, n.d. eChen, Chen, Choo, Reuveny, & Oh, 2011 fSchop, Janssen, Borgart, de Bruijn, & van Dijkhuizen-Radersma, 2008 gSart, Schneider, & Agathos, 2010 hNg, Berry, & Butler, 1996 iPall Life sciences, 2015 jIkonomou, Drugmand, Bastin, Schneider, & Agathos, 2002 kFrauenschuh et al., 2007 lFernandes et al., 2007
72
Microcarriers
There are different microcarrier configurations currently in the market (Table 1.4). The
selection of the right microcarrier is crucial as the use of different microcarriers will
results in different growth rates and pluripotency profiles (Chen et al. 2011a) (Table 1.4).
The different types of microcarriers available in the market can be made of polystyrene
such as HyQsphere® by HyClone (GE healthcare, Buckinghamshire, England) and
Hillex® by SoloHill Engineering (Pall corporation, NY, US). Others are made of cross-
linked dextran such as Cytodex® by GE Healthcare. Cytodex® has a macroporous
configuration whilst others are spherical and smooth or even rod-shaped (Rowley et al.
2012). One of the drawbacks of using microcarriers is the possible creation of fine
particles during cell harvest, which must then be removed after expansion (Rowley et al.
2012). A possible solution to address issues with microcarrier removal is the use of
biodegradable or thermosensitive microcarriers where the cells do not need to be detached
from the carriers (Yang et al. 2010).
1.5.3 Post-cell culture technologies
1.5.3.1 Filtration techniques
There are two types of filtration: dead-end filtration (NFF) and tangential flow filtration
(TFF). These techniques are considered to be relatively fast, simple, scalable and cost-
effective (Pattasseril et al. 2013; Diogo et al. 2012). During a filtration run the separation
is not only is done according to the particle size but also according to the adsorption of
the particles to the membrane (Pattasseril et al. 2013; Diogo et al. 2012).
TFF is widely used in the protein industry and its able to treat 1,000s of litres. During a
TFF run the transmembrane pressure (TMP) which is the driving flow for fluid motion,
pushes the fluid parallel to the membrane in a flat sheet or cartilage (Kahn et al. 2001).
TFF systems have been adapted to the manufacture of cell therapy products (CT-TFF) by

73
companies such as GE healthcare and Pall life sciences. Examples of changes made to
the traditional TFF systems include the implementation of features such as non-invasive
flow sensors and single-use pressure sensors (Pattasseril et al. 2013; Raviv & Karnieli
2014). Both TFF and centrifugation can be used in sequence for harvesting volumes
between 20L and 100L (Rowley et al. 2012). However, these require a high degree of
optimisation and validation when microcarriers are used for cell culture (Rowley et al.
2012).
1.5.3.2 Fluidized bed centrifugation
The only large scale single-use fluidised bed centrifuge currently available in the market
is the kSep® (kSep systems, Morrisville, NC, USA). The kSep centrifuge is fully
automated and has the capacity of processing up to 1B cells per run (Raviv & Karnieli
2014), with yields of 80% and higher and cell viabilities higher than 90% (Pattasseril et
al. 2013). The major drawback of these technologies is that cells are discharged in
extremely large densities which decreases the efficiency of the washing steps by reducing
the yield by 10%-30% (Pattasseril et al. 2013). Moreover multiple washing steps maybe
required which would result in a longer processing time and higher processing costs
(Pattasseril et al. 2013).

74
Table 1.5 Example of downstream process technologies available in the market
1.5.3.3 Additional methods for cell purification
Additional methods for cell purification include cell culture-based separation, differential
trypsinization, fluorescence activated cell sorting (FACS), immunomagnetic selection
and affinity chromatography. In cell culture-based separation, cells are separated
according to their ability to adhere to the plastic cell culture vessel. This method can be
used for the separation of MSC cells from haematopoetic stem cells which do not often
adhere to the surface of the cell culture vessel, and therefore can be removed during a
buffer exchange step (Lennon & Caplan 2006). Differential trypsinization can be used to
remove high cell numbers as different cells detach from the adherent surface at different
incubation times (Diogo et al. 2012).
FACS is widely used in cell isolation. This method employs size exclusion and light
scattering of cells to achieve separation (Aubert et al. 2003). Immunogenic selection was
previously mentioned as a method for T-cell and CAR+ T-cell enrichment. This method
uses magnetic interaction where monoclonal antibodies are bound to beads. These beads
Name Vendor Capacity Principle Function (s)
CT-TFF® Lonza 1.25-750L/ha Filtration Concentration
Washa
TFF® GE
Healthcare
25- 1250L/ha Filtration Concentration
Washa
Ksep® kSep Systems 114-720 L/ha Centrifugation Concentration
harvest and
washa
Harvestainer® Thermo
Scientific
200L/bagb Size exclusion Microcarrier-
supernatant
separationb
LOVO® Frensenius Kabi 1.4 L/hc Spinning
membrane
filtration
Cell wash and
concentrationc
COBE® Terumo BCT 4L/ha Centrifuge Cell wash and
concentrationa
Sepax® Biosafe SA 0.88Ld Centrifugation Cell wash and
concentrationd
aPattasseril et al. 2013 bThermoscientific, 2017
cFresenius Kabi, n.d. dBiosafe, n.d.

75
are then mixed with the cell suspension and are put through a column (Diogo et al. 2012).
A magnetic field is applied to the cells and the cells with a particular phenotype stay in
the column (Diogo et al. 2012). The magnetic field is then removed and the cells can elute
out of the column (Diogo et al. 2012).
Affinity chromatography is a powerful and is widely used as a separation technique. This
technique has the potential of separating different cell types. The potential issues
associated with affinity chromatography include high shear stress and low throughput
(Diogo et al. 2012).
1.5.4 Integrated technologies
Over the past few years, fully integrated technologies have become available for the
manufacture of cell therapy products. These technologies include the Prodigy® (Miltenyi
Biotec, Bergisch Gladbach, Germany) and the Octane Cocoon® (Octane Biotech,
Ontairo, Canada). The Prodigy® is an automated integrated platform which encompasses
a cell culture and centrifugation chamber with a capacity of 400ml (Apel et al. 2013).
This integrated platform is able to carry out multiple manufacturing steps such as: PBMC
enrichment, cell activation, cell culture, cell wash and formulation (Apel et al. 2013).
Little information is currently available regarding the Octane Cocoon technology. This
technology can be used for customised cell culture and tissue engineering (Octane n.d.).
One of the key differences between the Prodigy® and the Octane Cocoon® is that the
latter can also be used for cell culture on a scaffold (Octane n.d.).
1.6 Challenges to commercialisation and future trends for CAR T-cell and MSC-
based cell therapy products
1.6.1 Clinical performance
Demonstrating good clinical performance is crucial for the market acceptance of cell
therapy products (Webster 2016). In contrast with traditional drugs, cell therapy clinical
trials are carried out in patients as opposed to healthy volunteers, due to the possible risks
76
associated with these therapeutics (Mount et al. 2015a). Hence selecting the correct
patients may reduce the risks of adverse effects and enhance clinical performance (Mount
et al. 2015a). Moreover, the patients treatment history is also likely to affect the
performance of the treatment, as the pre-conditioning regime has shown to have an effect
on the success of cell therapy products (Han et al. 2013). Furthermore, the delivery mode
of the cell therapy will have a high influence on the performance of the cell therapy
product as well as in potential advert effects (Bang et al. 2016; Wei et al. 2013a).
In MSC-based therapies the type of cells used affects the potency and proliferation of
cells (Jin et al. 2013; Wang et al. 2009). CAR T-cells are distributed across the body after
infusion, and exhibit persistence for long-term identification and destruction of cells
which express the target tumour antigen (Sentman 2013). Factors influencing the
persistence of the CAR T-cell products include the constitution of the product itself
(Barrett et al. 2015). For example, historically, T-cell therapy products were composed
of differentiated cytotoxic T-cells (CD8+ T cells ); although these cells have high toxicity
against tumours, they lacked proliferative capacity in vivo, and hence, post-infusion
resistance was generally low (Barrett et al. 2015). Current attempts to overcome this
limitations, include the use of T-helper cells (CD4+ cells) to supply growth factors for
higher resistance of CD8+ cells in vivo (Barrett et al. 2015).
Significant challenges have been reported when using CAR T-cell therapies in solid
tumours (Guo et al. 2016; Walker & Johnson 2016a; Han et al. 2013; Gilham et al. 2012)
including understanding the mechanisms of T-cell trafficking required in order to supply
enough CAR T-cells to the tumour site (Gilham et al. 2012; Walker & Johnson 2016a;
Newick et al. 2017; Guo et al. 2016; Webster 2016; Han et al. 2013). In solid tumours, T-
cell trafficking is critical and is dependent on the relationship between the adhesion to
receptors in the tumour endothelium, the CAR T-cell, the chemokines produced by the

77
tumour and the chemokine receptor on the CAR T-cell (Newick et al. 2017). Furthermore,
the microenvironment in solid tumours is often immunosuppressive, which caused the
first generation CAR T-cell products to be short-lived, resulting in less significant
improvements in patients in solid tumour clinical trials versus blood cancers clinical trials
using CAR T-cell products (Newick et al. 2017; Walker & Johnson 2016a; Guo et al.
2016; Webster 2016; Gilham et al. 2012).
In order to overcome the persistence, safety and effectiveness hurdles of CAR T-cell
therapies, companies such as Juno Therapeutics (Seattle, WA, USA) and Cellectis (Paris,
France ) have been developing second and third-generation CARs, (Han et al. 2013;
Webster 2016). Some of these novel CARs include solid tumours co-stimulatory
molecules such as CD28, 4-1BB, and OX40 (Morgan et al. 2010b; Beatty et al. 2014;
Ahmed et al. 2015). Studies using second-generation CAR T-cells products have
indicated that these treatments can be efficacious and safe against solid tumours (Beatty
et al. 2014; Maus et al. 2013; Katz et al. 2015). Additional features of new generation
CARs include the incorporation of safety mechanisms (kill switch) in order to damp the
adverse effects of CAR T-cell products (Webster 2016).
1.6.2 Adverse effects
As previously mentioned, MSCs have low immunogenicity and are short-lived once
transplanted into the patient (Wei et al. 2013a; Le Blanc 2003; Trounson & McDonald
2015). However, adverse effects have been reported with these type of therapies, as they
are involved in tumour modulation. These side effects include enhancement of tumour
growth and metastasis when MSC are administered to oncology patients (Wong 2011).
In CAR T-cell therapy, severe adverse effects have also been reported. The most notable
side effect of the use of CAR T-cells is cytokine release syndrome (CRS), which are
typically more severe in treatments with high dose, due to the high number of CAR T-

78
cells and their high proliferation rate (Barrett et al. 2015; Sentman 2013; Guo et al. 2016).
These reactions are independent from the specificity of the antigen of the CAR T-cells
used, however, the likelihood of a patient developing CRS is dependent on the target
indication (e.g. ALL shows higher risk of CRS than CLL) (Barrett et al. 2015; Sentman
2013). The severity of these CRS reactions can vary from fever to respiratory failure
(Barrett et al. 2015). Moreover, if a high risk of developing CRS after CAR T-cell
infusion persists, the use of CAR T-cell therapies may only be employed in extreme cases
where patients have failed to respond to all other therapies, decreasing the target market
for these therapies (Webster 2016). Furthermore, additional side effects of the use of CAR
T-cells include neurologic toxicities and “on target” toxicities (toxicities which are
related to the antigen specificity of the CAR T-cells) (Barrett et al. 2015; Morgan et al.
2010b).
1.6.3 Manufacturing process and supply chain
Cell therapy products are complex, very sensitive to environmental changes and require
multiple expensive biological agents, and as such their manufacturing process presents
multiple challenges (Ratcliffe et al. 2011). The current cell therapy manufacturing
processes are highly manual, which makes them highly variable and susceptible to
operator error (Lopez et al. 2010). The chances for operator error are bound to increase
with increasing batch size, as more manipulations are required. Furthermore, other
sources of variability are present in cell therapy manufacturing such as the cell source,
age and health of the donor, the heterogeneity of the cell bank and reagents used (e.g.
serum) (Heathman et al. 2015; Lapinskas 2010; Lopez et al. 2010; Christodoulou et al.
2013). Variation is particularly present during the differentiation process of MSC cells as
this process requires the cells to go through multiple stages including a number of media
exchange steps used to add different process components (Brandenberger et al. 2011).

79
Additional hurdles surrounding the manufacture of MSCs are related to the scalability of
current technologies (Chereau 2011; Heathman et al. 2015). Since MSCs are anchorage-
dependent, if planar technologies are employed (e.g. cell factories and T-flasks), the
number of cell culture vessels required in parallel per batch would rapidly increase and
become unmanageable at very large cellular demands (Simaria et al. 2014b). This would
result in a high facility footprint and consequently high capital investment. The severity
of this scalability issue depends on the indication being targeted (Prieels et al. 2012). For
low dose indications (~1×10⁷ cells) such as low back pain (Pang et al. 2014;
GlobeNewswire 2016b) cell culture flasks may suffice; these multi-layer vessels have
the adequate capacity to produce cell numbers as high as 400B cells per batch (Rowley
et al. 2012). These vessels however, employ open processing, which demand for
expensive cleanrooms (Fitzpatrick 2008), increasing the initial investment required.
For treatments such as GvHD or heart disease with higher dose sizes (108-109cells per
patient) (Hare et al. 2009; Introna et al. 2014; Lazarus et al. 2005; Lin & Hogan 2011;
Bell Potter 2011; ClinicalTrials.gov 2016) however, larger cell culture vessels would be
required. Moreover, increasing the annual demand (and hence the batch size) reduces the
number of candidate technologies for both cell culture and DSP applications (Hassan et
al. 2015; Simaria et al. 2014b). High annual demands require the use of stirred tank
bioreactors with microcarriers, which will allow for batch sizes of trillion of cells to be
achieved (Rowley et al. 2012; Simaria et al. 2014b), while maintaining optimal and
controlled physiochemical conditions and environment for cell growth (Wendt et al.
2009). The use of microcarriers in suspension carries its own hurdles, as the cells must
be separated from the microcarries after the expansion step. Moreover, the fact that cell
separation is carried out using enzymatic intervention, puts an additional strain on the
downstream process, as enzymatic treatment must be quenched rapidly to avoid damage
to the cells (Lapinskas 2010; Raviv & Karnieli 2014). The time between cell detachment
80
and final formulation typically varies from less than 1 hour to up to 4 hours (Lapinskas
2010; Raviv & Karnieli 2014; Hassan et al. 2015).
The production of autologous CAR T-cell products requires complex logistics, hence
successful coordination between the collection centre, the manufacturing site and the
administration centre is vital (Levine et al. 2017; Sharpe & Mount 2015b; Mount et al.
2015b). Moreover, the complexity of CAR T-cell products makes it so these products will
only be available in specific clinics (Flinn et al. 2016), as variability at point of care is
likely to occur due to differences in thawing technique across physicians (Davie 2013;
Trainor et al. 2014; Flinn et al. 2016).
Manufacturing challenges related to autologous CAR T-cell manufacture include
significant batch-to-batch variability attributed to the fact that each batch uses cells from
a different patient (Levine et al. 2017; Sharpe & Mount 2015b; Webster 2016). This
makes standardization, scheduling and quality control of CAR T-cell processes
challenging (Webster 2016). Hence, CAR T-cell therapies would highly benefit from the
development of optimized protocols for product manufacture from sample collection to
final formulation (Sharpe & Mount 2015b).
To date, CAR T-cell therapy have only been used for in a smaller number of patients
hence, the logistics and manufacturing challenges will become more apparent as the
process is scaled-out in order to meet higher clinical demands (Levine et al. 2017).
Moreover, as the number of CAR T-cells candidate therapies increases, so does the
demand for viral vector stocks. Hence, higher performance in viral vector transduction
must be achieved and processes for viral vector manufacture must be optimized in order
to increase the cost-effectiveness of products that require viral vectors for gene editing
(Sharpe & Mount 2015b; B Levine 2015).
In order to overcome some of the key challenges characteristic of autologous products,
companies such as Cellectis are investing in allogeneic CAR T-cell therapies as these

81
could potentially be readily available to the patients (Webster 2016). These novel CAR
T-cell therapy products will allow for cell bank formation and the use of a scale-up
approach to product manufacture, which may result in lower manufacturing COG (Mount
et al. 2015b).
Different cell therapy products have different formulations and therefore require different
storage and transportation arrangements. An example of this is the final form of
ChrondoCelect® versus Provenge® and Prochymal®. ChrondoCelect® is stored at room
temperature whilst Provenge® requires cold storage and must be transported in a sealed
container under 18 hours, making the transportation process significantly more
challenging (Coopman & Medcalf 2008; Harvard Medical School 2010). Prochymal® on
the other hand is a cryopreserved product stored at -135°C which allows for a shelf-life
of up to 2 years (Kebriaei et al. 2009).
Using methods to extend product shelf-life has significant benefits in autologous
processes as cells can be preserved prior to cell culture. This allows for the cell collection
to be carried out in multiple occasions, in cases where the patient is incapable of supplying
sufficient cells at once (Coopman & Medcalf 2008). This was the case of 25% of patients
which were treated with Provenge® (Coopman & Medcalf 2008). Cryopreservation often
relies on the use of DMSO. The use of DMSO has shown to negatively affect the cells at
positive temperatures depending on length of exposure and concentration (Coopman &
Medcalf 2008). This can be manifested in loss of cell viability, which has been shown to
drop by as much as 30% post cryopreservation (Ostrowska et al. 2009). Furthermore, the
use of controlled rate freezers for cryopreservation also poses challenges in maintaining
temperature uniformity in multiple vials at commercial scale manufacture (Thirumala et
al. 2013). Alternative methods for short-term cell preservation include hypothermic
storage. This method allows for cell preservation whilst keeping them in positive
temperatures (Coopman & Medcalf 2008).

82
1.6.4 COG and reimbursement
At present, there is a general trend in which companies do not heavily invest in the
translational process before clinical success is seen, in order to minimise risks (Mount et
al. 2015b). Investing in process optimisation requires significant funds and may delay the
time to market (Coopman & Medcalf 2008). However, if the manufacturing issues related
to technology scalability, supply chain, product stability, robustness etc. are not
considered early in the process development the selling price of the cell therapy product
may exceed the pricing threshold set by the payers (Mount et al. 2015b). For example,
Dendreon used a manual and non-closed process for the manufacture of the autologous
product Provenge®. This product required a facility footprint as high as 16,723m2
(Dodson & Levine 2015b). The high COG associated with this manufacturing process
cause the selling price to reach $93,000USD (Dodson & Levine 2015b). Moreover,
estimating the annual sales in the cell therapy industry is challenging. For example, in
2009 only 2% of the projected market for cell therapy products was captured in the USA
(Mason et al. 2011). Another example of this challenge in estimating market penetration
is the significantly lower sales seen for the Provenge®, where the company foreseen sales
as high as $400M USD but only $68.6M USD in sales were achieved (Timmerman 2011).
In addition to challenges in market forecast, securing adequate reimbursement for cell
therapy products is also difficult due to the fact cell therapy products will likely be more
expensive than traditional drugs (Dodson & Levine 2015b).
1.7 Cell therapy facilities
1.7.1 Introduction to single-use technologies
Single-use technologies (SUTs) were first introduced in the market 1970’s in the form of
filters and capsules (Kinsella & Dewan 2015; Lopes 2015). Ever since, SUTs have
increasingly been employed at different stages of product development (Guldager 2010;
Pharma IQ 2013; Sandstrom n.d.; Levine et al. 2012; Tiene 2016; Geipel-Kern 2009).

83
The SUTs now available in the market include storage and mixing bags, bioreactors,
downstream processing solutions etc. (Barak & Bader 2008; Flaherty & Perrone 2012;
Jacquemart et al. 2016; Kinsella & Dewan 2015; Pollock et al. 2013; Rayner 2010;
Sargent 2013; Lopes 2015; Shukla & Gottschalk 2013; Tiene 2016). The SUT market
was estimated at $1.7B USD in 2014 (Chapman & Krishnan 2010) and foreseen to grow
beyond 100’s of billions of dollars by 2019 (Pharma IQ 2013; Langer & Rader 2014) as
biotech companies as large as Shire, now utilize SU bioreactors for commercial scale
product manufacture (Levine et al. 2012). Furthermore the highest sales seen in the SUTs
market are for technologies used for product manufacture during R&D (Langer & Rader
2014). In commercial scale manufacture DSP SUTs are more popular than upstream
process (USP) SUTs (Langer & Rader 2014).
1.7.2 Pros and cons of single-use facilities
Multiple benefits of switching to single-use manufacture have been reported (Rogge et
al. 2015; Novais et al. 2001; Barak & Bader 2008; Guldager 2010; Levine et al. 2012;
Stock R. 2011; Rayner 2010; Haigney 2016; Eibl & Eibl 2010; Geipel-Kern 2009;
Sargent 2013; Tiene 2016; Whitford 2010; Flaherty & Perrone 2012; Shukla &
Gottschalk 2013; Lopes 2015; biopharm services Limited 2014; Sandstrom 2009; Langer
& Rader 2014). These benefits include the removal of the cleaning in place (CIP) and
sterilization in place (SIP) operations, which also ease the cleaning and sterilizing
validation processes (Rogge et al. 2015; Barak & Bader 2008; Levine et al. 2012; Rayner
2010; Haigney 2016; Tiene 2016; Flaherty & Perrone 2012). Reducing CIP and SIP
operations was revealed to be the main reason that drove companies to implement SUTs
in a survey carried out by the Bio-Process Systems Alliance (Geipel-Kern 2009). Doing
so also reduces the changeover time between batches and products, which eases multi-
product manufacture (Rogge et al. 2015; Barak & Bader 2008; Haigney 2016; Flaherty
& Perrone 2012; Lopes 2015). The change-over process can take over two weeks, hence

84
reducing this duration of this process would benefit the productivity of the facility (Levine
et al. 2012). Furthermore removal of CIP and SIP cycles decreases the water usage and
water waste, decreasing the liquid waste disposal costs (Rogge et al. 2015; Barak & Bader
2008; Haigney 2016; Geipel-Kern 2009; Flaherty & Perrone 2012; Cox et al. 2008).
Additional benefits to SUTs include the reduced risk for contamination, increasing the
batch successful rate (Rogge et al. 2015; Barak & Bader 2008; Haigney 2016; Geipel-
Kern 2009; Tiene 2016; Flaherty & Perrone 2012; Lopes 2015; Guldager 2009). Single-
use technologies also ease the creation of closed systems which increases the flexibility
of facilities, as equipment modules can easily be moved in and out of processing rooms
(Stock R. 2011; Levine et al. 2012; Sargent 2013; Geipel-Kern 2009; Flaherty & Perrone
2012; Lopes 2015; Guldager 2009; Rogge et al. 2015). Moreover closed SUTs ease the
decentralisation of product manufacture and capacity expansion (Whitford 2010). The
use of movable modules can also decrease the overall project time due to the reduction
in installation and procurement time as well as ease qualification and commissioning,
and hence speedup commercialisation (Rogge et al. 2015; Levine et al. 2012; Sargent
2013; Lopes 2015; Barak & Bader 2008).
Multiple sources have reported lower capital investments achieved when using SUTs
(Barak & Bader 2008; Rogge et al. 2015; Levine et al. 2012; Guldager 2010; Sargent
2013; Tiene 2016; Geipel-Kern 2009; Whitford 2010; Lopes 2015; Eibl & Eibl 2010;
Novais et al. 2001; Guldager 2009). This is due to the reduced requirement for piping and
support facilities (media and buffer pep, steam facilities etc.), as well as installation costs
and commissioning costs (Barak & Bader 2008; Rogge et al. 2015; Levine et al. 2012;
Guldager 2010; Sargent 2013; Tiene 2016; Geipel-Kern 2009; Whitford 2010; Lopes
2015; Eibl & Eibl 2010; Novais et al. 2001; Guldager 2009). Furthermore, SU facilities
are likely to operate at smaller scales than traditional biopharma stainless steel (SS)
facilities (Rogge et al. 2015), which will result in lower equipment costs (Sargent 2013)

85
and smaller facility footprints (Guldager 2010; Rayner 2010; Flaherty & Perrone 2012;
Cox et al. 2008; Lopes 2015).
Disadvantages of single-use facilities include the poor standardization of SU products,
higher solid waste, scale and configuration restrictions, lower performance and source
availability (Shukla & Gottschalk 2013; Rogge et al. 2015; Levine et al. 2012; Langer &
Rader 2014; Flaherty & Perrone 2012). Furthermore leachables and extractables are a
hurdle with SUTs (Flaherty & Perrone 2012; Levine et al. 2012; Langer & Rader 2014).
When considering operational costs, sources show conflicting conclusions on the overall
cost savings associated with the use of SUTs. Arguments for higher operating costs with
SUTs include the higher consumables costs and costs associated with the disposal of
consumables (Levine et al. 2012; Barak & Bader 2008; Eibl & Eibl 2010; Novais et al.
2001). Arguments for lower operating costs include cost savings in quality control
operations as well a labour, water and cleaning reagents (Geipel-Kern 2009; Cox et al.
2008; Novais et al. 2001; Eibl & Eibl 2010; Haigney 2016).
1.7.3 Single-use facilities in cell therapy
Cell therapy facilities will likely be considerably different from traditional biotech
facilities as the uniqueness of cell therapy processes requires specific facility layouts
(Bozenhardt 2017). For example cell therapy products are usually manufactured using
SUTs, hence CIP & SIP operations are reduced and therefore the requirement for process
utilities is lower (Bozenhardt & Bozenhardt 2017). Table 1.6 shows examples of cost and
footprint of current cell therapy facilities.
Cell processing must be carried out in facilities operating under current Good
Manufacturing Practice (cGMP) and under stringent quality control (QC) and quality
assurance (QA) procedures. Such procedures should monitor and control all product-
related activities within the facility including sample arrival, product manufacture and

86
storage (Giancola et al. 2012). Quality assurance under cGMP requires a team with
diverse expertise in order to manage different aspects of the manufacturing process such
as resource requirement, standard operating procedures (SOPs), equipment monitoring,
product storage and tracking (Giancola et al. 2012). Furthermore, such facilities must
include segregated areas such as support laboratory areas, storage warehouse, product
support areas etc. (Giancola et al. 2012).
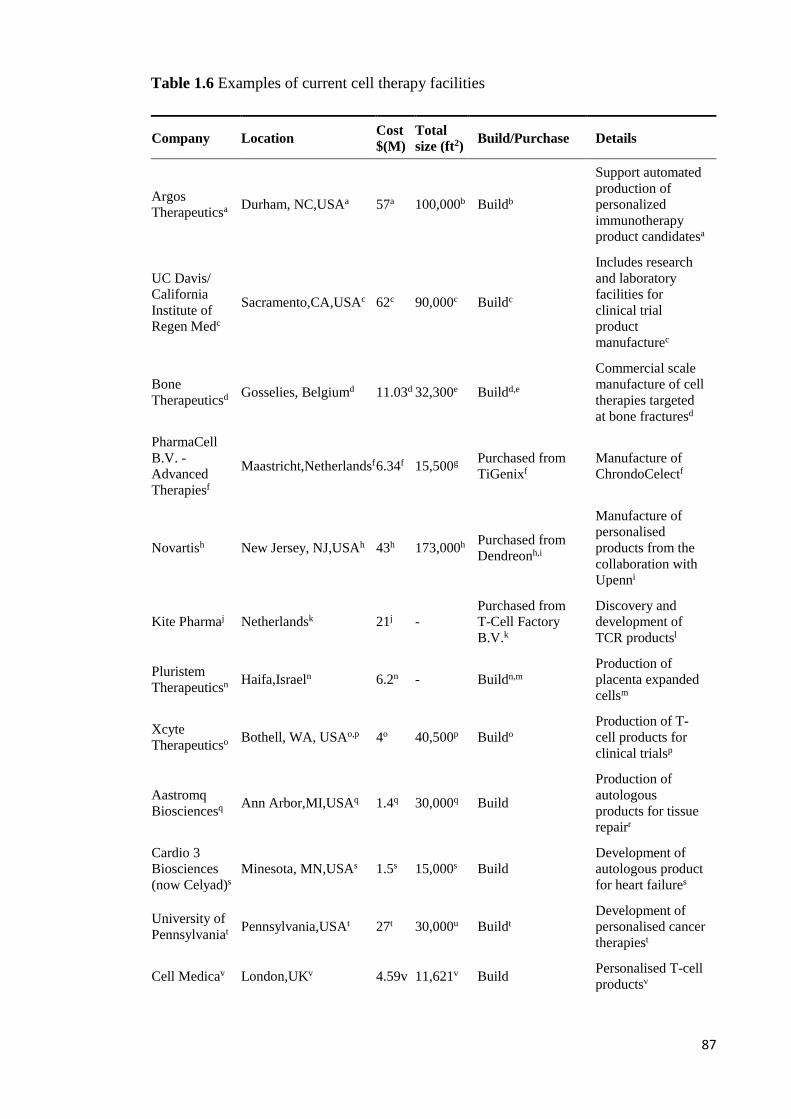
87
Table 1.6 Examples of current cell therapy facilities
Company Location Cost
$(M)
Total
size (ft2) Build/Purchase Details
Argos
Therapeuticsa Durham, NC,USAa 57a 100,000b Buildb
Support automated
production of
personalized
immunotherapy
product candidatesa
UC Davis/
California
Institute of
Regen Medc
Sacramento,CA,USAc 62c 90,000c Buildc
Includes research
and laboratory
facilities for
clinical trial
product
manufacturec
Bone
Therapeuticsd Gosselies, Belgiumd 11.03d 32,300e Buildd,e
Commercial scale
manufacture of cell
therapies targeted
at bone fracturesd
PharmaCell
B.V. -
Advanced
Therapiesf
Maastricht,Netherlandsf 6.34f 15,500g Purchased from
TiGenixf
Manufacture of
ChrondoCelectf
Novartish New Jersey, NJ,USAh 43h 173,000h Purchased from
Dendreonh,i
Manufacture of
personalised
products from the
collaboration with
Upenni
Kite Pharmaj Netherlandsk 21j -
Purchased from
T-Cell Factory
B.V.k
Discovery and
development of
TCR productsl
Pluristem
Therapeuticsn Haifa,Israeln 6.2n - Buildn,m
Production of
placenta expanded
cellsm
Xcyte
Therapeuticso Bothell, WA, USAo,p 4o 40,500p Buildo
Production of T-
cell products for
clinical trialsp
Aastromq
Biosciencesq Ann Arbor,MI,USAq 1.4q 30,000q Build
Production of
autologous
products for tissue
repairr
Cardio 3
Biosciences
(now Celyad)s
Minesota, MN,USAs 1.5s 15,000s Build
Development of
autologous product
for heart failures
University of
Pennsylvaniat Pennsylvania,USAt 27t 30,000u Buildt
Development of
personalised cancer
therapiest
Cell Medicav London,UKv 4.59v 11,621v Build Personalised T-cell
productsv

88
As the final product cannot be sterilized, a risked-based approach is employed in
maintaining product quality. The purpose of this is to avoid contamination of the product
(Dietz et al. 2007). Contamination can occur due to the materials used (raw materials and
consumables), environmental changes and other products (cross-contamination) among
other reasons (Giancola et al. 2012). Effective sterilization of all materials which come in
contact with the product is required as well as the use of ascetic techniques (Giancola et
al. 2012; Dietz et al. 2007). For the successful implementation of ascetic techniques, these
must be considered not only during operation of cGMP facilities but also during facility
design and construction (Dietz et al. 2007). Aseptic techniques require the control of the
facility environment (Giancola et al. 2012) (e.g. pressure, temperature and humidity etc.),
as failure to do so may influence contamination by microorganisms and jeopardise the
Masthercelx Brussels, Belgiumx 5.84w 6,456x Buildx Contract
manufacturer
Dendreony Atlantay 80z 200,000z Buildz
Autologous
dendritic cells
manufacturez
aDeBruyn 2016 bArgos therapeutics 2014 cRobertson 2010 dBone therapeutics 2013 eFlandersbio 2015 fGlobeNewswire 2014 gBrennan 2015 hStaton & Palmer 2012 iNew Jersey business 2012 jHollandBio n.d. kInvestHolland 2015 lGarde 2015 mDirks 2011 nStreetInsider 2012 oPrinceton 2004 pBerenson 2003 qKavanaugh 2007 rGlobeNewswire 2010 sAreadevelopment 2015 tPenn Medicine News 2016 uTradeline 2016 vCell Medica 2014 xMaSTherCell n.d. wPersonal contact with Eric Matthieu (COO, Masthercel ) yBzjournals 2009 zCarroll 2009
89
maintenance of low particle counts in the air (Giancola et al. 2012; Dietz et al. 2007). In
order to maintain low particle count in the air, special cleaning schedules and air filters
and regular maintenance are implemented which are part of the heating, ventilation and
air conditioning systems (HVAC) (Dietz et al. 2007).
Different degrees of environmental control strategies are applied to different area
classifications and have different building and running costs (Chester 2008; Barak &
Bader 2008). For example, a Grade B (ISO 7) cleanroom may require 50 air changes per
hour, whereas a grade D clean room (ISO 9) only requires 12 (Barak & Bader 2008).
Table 1.7 shows how the facility costs/ft2 varies with area classification.
Furthermore, process flow and appropriate isolation is also important to be considered in
order to avoid possible cross-contamination (Giancola et al. 2012; Dietz et al. 2007). To
do so separation of materials and staff, appropriate gowning as well as unidirectional flow
of both staff and materials is required (Giancola et al. 2012; Dietz et al. 2007). Moreover,
additional segregation can be achieved through the use of airlocks, these are used in order
to avoid air turbulence and maintain pressure across cleanrooms area classifications
(Dietz et al. 2007).

90
Table 1.7 Cleanroom costs ($ per ft2)
1.7.4 Estimating costs in single-use facilities
The use of SUTs will have a significant effect on the layout of a given facility, as
parameters such as facility footprint of the facility, the HVAC and utilities requirements,
workflows, storage space, automation design and height of the room will be affected by
the implementation of these technologies (Levine et al. 2012; Barak & Bader 2008; Rogge
et al. 2015; Guldager 2009). Traditionally, fixed capital investment (FCI) for
pharmaceutical facilities was calculated using the “Lang factor method”. When using this
method, a ratio between the equipment costs (including utility costs) and all the other
costs included in the total FCI was evaluated based on historical projects (Lang 1948).
These costs included: equipment, piping, instrumentation, electrical work, building,
utilities, site development and auxiliary buildings (Coulson & Richardson 2005).
Additional factors were also applied in order to account for design and engineering,
contractors fees as well as contingency (Lang 1948). The total multiplier was then
calculated to be 3.10 for solids facilities, 3.63 for solid-fluid facilities and 4.74 for fluid
facilities (Lang 1948). In biopharmaceutical protein facilities, higher “Lang factors” of 6-
Barnoon
Barak
(2008)
Chester
(2008)
Gering &
Campesi
(2013)
Gering &
Campesi
(2013)
Petrides et al
(2015)
eXmoor
Pharma
Concepts
(2018)*
Mechanical rooms
(utilities) 41-82
Office space 210 68-82 124
Laboratory 360 136-273 440
Class 100,000 420 273-341 440
Class 10,000 465 500 530-662 540-634 341-473 529
Class 1000 525 700 692-795 704-810 607-818 721
Class 100 900 877 -1,000 894-1,100 818-1,091
* Personal communication (Andrew Besso, eXmoor Pharma Concepts, Bristol, UK

91
8 were typically applied for FCI estimation (Novais et al. 2001). To date, this calculation
method has yet to be adapted to cell therapy facilities.
Over the years, multiple publications have emerged on FCI estimates for chemical and
biochemical facilities using different methods for capital investment calculation (Coulson
& Richardson 2005; Peters & Timmerhaus 1991; Pavlotsky 2004; Novais et al. 2001;
Brennan & Golonka 2002; Petrides et al. 2015; Sinclair & Monge 2005). Figure 1.13
summarises the normalised FCI breakdown of these different methods.
All FCI estimates are however subjective to variability. For example, the location of the
facility will have a great impact in the costs estimates (Barak & Bader 2008; Peters &
Timmerhaus 1991; Seider et al. 2003; Flaherty & Perrone 2012). Hence, companies may
apply a geographic location factor in order to account for these differences (Peters &
Timmerhaus 1991; Seider et al. 2003). These factors vary between 0.85 and 1.25 (Seider
et al. 2003). The location with the lowest geographic factor is India followed by Mexico
and the Southwest of the US, whilst the places with the highest factors are the US west
coast, western Europe and the Midwest (US) and Japan (Seider et al. 2003).
Figure 1.13 Example of current facility costs breakdown. Sources: D. J. Brennan &
Golonka, 2002; Coulson & Richardson, 2005; Eibl R., 2010; Novais et al., 2001;
Pavlotsky, 2004; Peters & Timmerhaus, 1991; Petrides et al., 2015; Sinclair & Monge,
2005. SS = stainless steel, SU = single use.
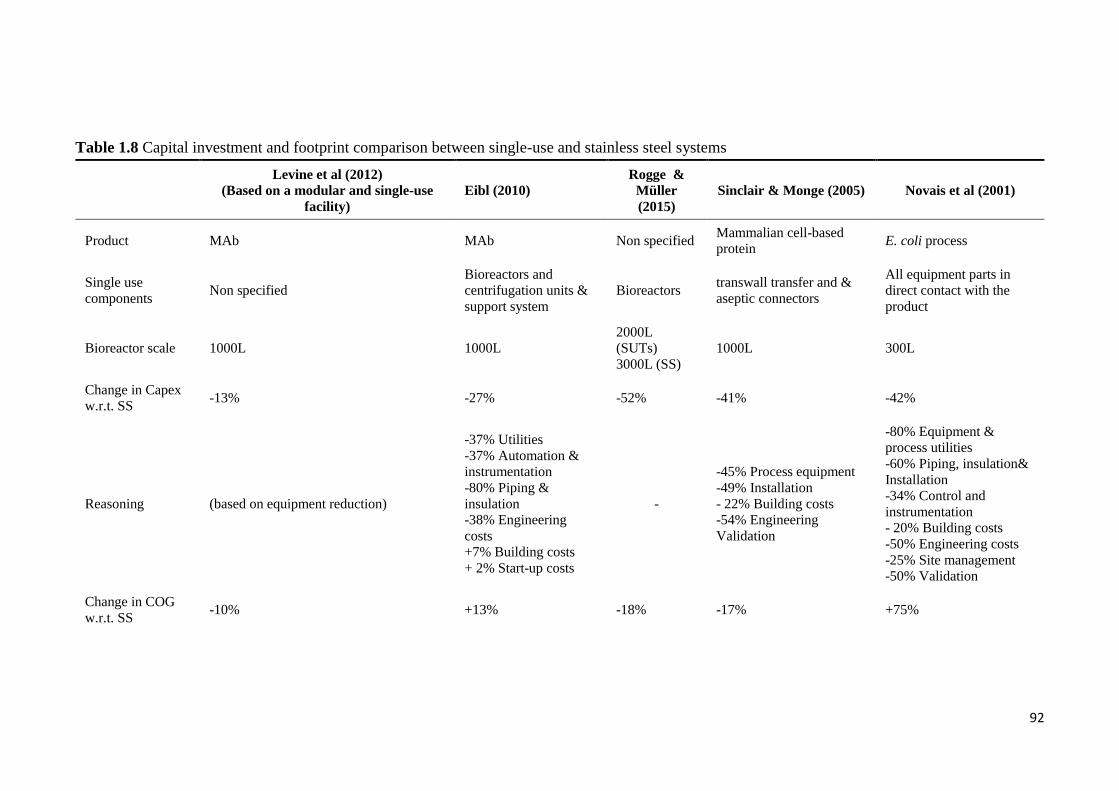
92
Table 1.8 Capital investment and footprint comparison between single-use and stainless steel systems
Levine et al (2012)
(Based on a modular and single-use
facility)
Eibl (2010)
Rogge &
Müller
(2015)
Sinclair & Monge (2005) Novais et al (2001)
Product MAb MAb Non specified Mammalian cell-based
protein E. coli process
Single use
components Non specified
Bioreactors and
centrifugation units &
support system
Bioreactors transwall transfer and &
aseptic connectors
All equipment parts in
direct contact with the
product
Bioreactor scale 1000L 1000L
2000L
(SUTs)
3000L (SS)
1000L 300L
Change in Capex
w.r.t. SS -13% -27% -52% -41% -42%
Reasoning (based on equipment reduction)
-37% Utilities
-37% Automation &
instrumentation
-80% Piping &
insulation
-38% Engineering
costs
+7% Building costs
+ 2% Start-up costs
-
-45% Process equipment
-49% Installation
- 22% Building costs
-54% Engineering
Validation
-80% Equipment &
process utilities
-60% Piping, insulation&
Installation
-34% Control and
instrumentation
- 20% Building costs
-50% Engineering costs
-25% Site management
-50% Validation
Change in COG
w.r.t. SS -10% +13% -18% -17% +75%

93
Levine et al (2012)
(Based on a modular and single-use
facility)
Eibl (2010)
Rogge &
Müller
(2015)
Sinclair & Monge (2005) Novais et al (2001)
Reasoning -30% Labour costs
-20% Material costs
+5% Labour
+51% Consumables
+60 Waste disposable
-63% labour
-88%
materials
+28%
consumables
-23% Labour
-9% Materials
-50% Waste treatment
+80% Consumables
-50% Utilities
+1549% Materials
Change in facility
footprint w.r.t. SS
-11% (based on footprint reductions of
different facility areas) +7% -22% (assumed as
function of shell costs) Reduced
Reasoning
-40% in C grade area
-37% in D grade area
Lower pipe footprint
Increase in CNC area
+16%Buffer holding
+ 390% Cold rooms
+50% Corridors
- 8% Support areas
- - -
94
Publications comparing the capital investment of SU facilities versus SS facilities include
Novais et al. (2001), Sinclair & Monge (2005) and Eibl (2010). The results attained in
these comparisons as well as the rationale behind them are summarized in Table 1.8. In
Novais et al. (2001), they based their calculations on an E. coli based product with the
same annual demand in both SU and SS scenarios. Moreover, in this publication number
of assumptions were made in order to investigate how the different components of the
FCI would change with the use of SUTs.
Sinclair & Monge (2005) uses a conceptual disposable facility design where SS auxiliary
equipment was replaced by SUTs. The “Lang factor” method was used to calculate the
different components of the FCI by adapting this factor to more recent projects. Eibl
(2010) describes a case study based on a monoclonal antibody (mAb) process with 1,000L
scale for both SU and SS facilities. The costs calculations were carried out using an
internal database.
1.7.5 Implementation of automation in cell therapy facilities
Automation allows for the removal of multiple labour intensive steps (Hampson 2015;
Harris et al. 2016). The implementation of automated systems is expected to ease multi-
site manufacture, and potentially ease process validation (Harris et al. 2016). A recent
survey has revealed that 80% of companies developing cell therapy products employ
manual operations during pre-clinical studies (Hanrahan 2016). This number is reduced
to 50% for companies which are currently in the early stages of the clinical trials
(Hanrahan 2016). Furthermore, the same survey revealed that 80% of cell therapy
companies plan to move towards automated solutions during commercial manufacture
(Hanrahan 2016). Automated platforms currently available in the market include the
CompacT SelecT® (TAP Biosystems Grantham Cl, Royston, UK) and the Prodigy®. For
bespoke automated solutions companies can opt for specific platforms such as the ones
provided by Invetec (Australia) (Mount et al. 2015a).

95
Automation can be employed in multiple stages of the manufacturing process including
cell culture and downstream processing (Andon 2017). It allows for high quality products
to be manufacture faster, more robustly and reproducibly, by reducing chances of operator
related error (Harris et al. 2016; Hümmer et al. 2016; Invetech n.d.; Andon 2017;
Hampson n.d.; Trainor et al. 2014). Operator variability can occur during multiple stages
of product manufacture and testing. For example, in cell counting the tests results rely
heavily on the opinion of the operator, as the operator must physically count the cells
stained with trypan blue (Harris et al. 2016). Therefore, by implementing automation in
analytical testing these tests can be carried out continuously and reliably (Harris et al.
2016). Moreover, automation allows for the use of closed systems which shield the
product from contaminants from personnel and environment (Harris et al. 2016; Hampson
n.d.). This reduces the need of building cleanrooms with high ISO qualification, which
may reduce capital investment and project timelines (Hampson n.d.).
Issues related with process scalability can also be addressed with automation especially
in patient specific products where the manufacturing model is scale-out (Andon 2017;
Invetech n.d.). When using a scale-out model, automation enables higher throughput to
be achieved (Harris et al. 2016). Furthermore automation can increase the process
efficiency and possibly reduce costs and facility footprint (Harris et al. 2016; Hümmer et
al. 2016; Andon 2017; Invetech n.d.; Nelsen 2017; Hampson n.d.; Trainor et al. 2014).
The cost-benefit of automated manufacture was highlighted in the survey described in
Hanrahan (2016), where the author reports costs reductions between 40% and 90% with
automated technologies. The costs benefits of automation were also captured in Invetech
n.d., where replacing manual processing with automation in the manufacturing process
of a patient specific therapy, resulted in annual savings of $105M USD. Additional areas
that could economically benefit from the implementation of automation include data
collection and record keeping (Hampson n.d.; Trainor et al. 2014; Andon 2017).

96
Challenges to the implementation of automation in cell therapy processes include
availability of automated platforms, as current automated solutions are limited and single-
sourced (Harris et al. 2016; Hampson 2015), which increases risk of interrupted supply.
Moreover cell therapy processes and products are complex and vary significantly, and in
some cases are personalised, which brings an additional challenge to developing
automated technologies to accommodate such variability (Harris et al. 2016).
Furthermore development costs of automated platforms are high (Harris et al. 2016;
Hampson 2015; Nelsen 2017). Alternatively, companies may opt to implement
automation later within the process development or even during commercialisation.
When doing so, it is important to consider potential regulatory implications as
comparability will have to be demonstrated (Harris et al. 2016; Hampson 2015; Hampson
n.d.).
1.7.6 Decentralised manufacture
In centralised manufacture the market is supplied by a single GMP facility and all major
manufacturing processes are carried out within the facility (Davie 2013; Bersenev 2016b).
This approach has been applied in traditional pharma and biopharma industry by
companies such as Novartis (Basel, Switzerland) and Kite pharma (Santa Monica, CA,
USA) (Bersenev 2016b; Rafiq 2016). One of the key benefits of centralised product
manufacture are the economies of scale, mainly due to the fact that overhead costs are
distributed across a higher number of doses (Medcalf 2016; Rafiq 2016). However, in
autologous cell therapy bioprocessing, these economies of scale are minimal, as the
manufacturing model applied to these therapies is scale-out as opposed to scale-up, and
hence the benefit of centralised manufacture are lower (Walker & Johnson 2016b; Rafiq
2016).
Key disadvantages related to centralised manufacture include the fact that centralisation
limits market access as the same facility will have to be compliant with multiple
97
regulatory bodies (Medcalf 2016). Shipping the product through long distances between
the administration site and the manufacturing site may also pose some challenges as the
product must be maintained at formulation temperature (4 °C if fresh and -15 °C to – 25
°C if cryopreserved) (Rafiq 2016). Moreover, cold chain transportation is expensive
adding to the high COG of cell therapy products (Rafiq 2016). Furthermore delays and
even product loss may occur when shipping products across long distances (Trainor et al.
2014; Medcalf 2016).
Market uncertainties seen in the cell therapy industry require cell therapy facilities to be
flexible in order to avoid low facility utilization (if the market demand is overestimated)
or failure to meet market demand (if the market demand is underestimated) (Trainor et al.
2014; Medcalf 2016). This flexibility is challenging to achieve with centralised facilities
(Trainor et al. 2014; Medcalf 2016).
Decentralised manufacture is a possible solution to some of the challenges associated
with centralised manufacture. In decentralised manufacture, the product manufacture is
spread over multiple manufacturing sites which are closer to the administration site and
hence the patient itself (Rafiq 2016)(Davie 2013)(Davie 2013). Although this business
model has been successfully adopted by other healthcare industries such as blood and
bone marrow (Davie 2013), when considering a decentralised manufacture, the question
arises of what is the optimal number of manufacturing sites (Walker & Johnson 2016b).
Decentralising the manufacture of cell therapy products will solve some of the issues
mentioned above by easing product manufacture in response to market demand as well
as ease tracking and labelling of samples and products (Medcalf 2016; Coopman &
Medcalf 2008; Rafiq 2016). Moreover, decentralised manufacture allows for
uninterrupted market supply in case of facility shutdown due to unforeseen events such
as a fire, staff strike or natural disaster (Medcalf 2016; Rafiq 2016).

98
Challenges associated with the implementation of multi-site manufacture include higher
FCI and technology transfer costs as well as regulatory hurdles, as regulators will require
proof that the product meets the requirements across sites through bridging studies
(Trainor et al. 2014; Coopman & Medcalf 2008; Davie 2013; Rafiq 2016; Hourd et al.
2014). Moreover it is important to identify the party responsible for product release; in
centralised manufacture, it would be the inventor company (Coopman & Medcalf 2008).
In multi-site manufacture however the complexity in establishing accountability increases
(Coopman & Medcalf 2008; Medcalf 2016).
As previously mentioned, traditional cell therapy processes are labour intensive and
therefore prone to variability (Trainor et al. 2014). The use of fully automated platforms
at the point of care has been explored as a possible solution to some of the issues
characteristic of centralised manufacture. This automated decentralised manufacturing
model would allow for all process steps to be carried out in a single “GMP-in-a-box”
equipment unit which includes environmental controls and therefore dismisses the need
for expensive cleanroom space (Trainor et al. 2014; Bersenev 2016b; Porwollik 2016;
Hourd et al. 2014). Moreover, the use of closed and automated systems may ease some
of the regulatory issues related to multi-site manufacture (Trainor et al. 2014).
The Prodigy® system has been proposed as one of such “GMP-in-a-box” platforms
(Medcalf 2016; Bersenev 2016b). However this technology is not yet suitable for end-to-
end manufacture and testing of cell therapy products as it does not perform automated
product testing (Medcalf 2016; Bersenev 2016b).
1.8 Decisional tools
1.8.1 Introduction to decisional tools & decisional tools in bioprocessing
1.8.1.1 Decisional tools overview
Decisional tools or decision support tools are tools that provide guidance during decision-
making through guidelines, analysis or procedures (Sullivan 2002). This guidance can be

99
in a form of a software or in the written format (Sullivan 2002). Such tools have been
previously employed in multiple sectors including environmental policy making,
medicine, and finance (Tsang et al. 2004; Donnan et al. 2009; Elghali et al. 2008).
Decisional tools are different than computer models, as computer models provide
solutions as technical variables such as time, flowrate etc., while decisional tools give
solutions as decision variables such as risk (Sullivan 2002). For example, if the optimal
batch size for a cell therapy product is to be evaluated, the COG can be evaluated using a
computer model. However this information alone is not enough to decide on the optimal
batch size, knowledge on risk of batch failure, process variations etc. can be added to the
COG to form a more complete analysis. This type of analysis can be achieved through
the use of decisional tools.
1.8.1.1 Decisional tools in bioprocess
There are numerous publications on the subject of decisional tools in bioprocessing. The
UCL Biochemical Engineering department has made notorious contributions to the
biopharmaceutical industry by developing and using decisional tools to address critical
questions in the sector. These questions were addressed by introducing risk-based
methods to evaluate optimal manufacturing strategies for biopharmaceutical products,
considering multiple parameters such as time, COG, robustness and net present value
(NPV) (Lim et al. 2006; Pollock et al. 2013; Yang et al. 2014). Additional case studies
carried out by the same group include using advanced tools to debottleneck processes in
order to avoid product waste by anticipating facility sizing issues (Lim et al. 2006).
1.8.2 Decisional tools in cell therapies
As seen throughout this chapter there are multiple parameters to be considered when
bringing a novel cell therapy product to market. Figure 1.14 shows an example of
constraints and uncertainties related to the development and commercialisation of cell
therapy products.

100
A limited number of publications are now available in the topic of decisional tools in cell
therapy. Simaria et al (2014) evaluated the optimal technology to be employed in
different commercialisation scenarios for the production of MSCs. This was done by
coupling an optimization algorithm and a bioprocess economics model. The results
clearly shown the limits of current technologies for MSC expansion and the R&D
development required for these to fulfil future market demands. The authors also identify
the cost drivers affecting the different technologies for adherent cell culture, as well as
some of the critical characteristics which make microcarrier-based cell expansion more
cost-effective than planar options. This study was extended in Hassan et al (2015) in order
to model the whole manufacturing process of allogeneic MSC products, and capture the
economic benefit of different downstream process technologies for wash and
concentration of MSCs. This study has revealed that the downstream process may account
for 20% - 80% of the COG/dose depending on the technology and the commercialisation
scenario selected.
The economic impact of process changes at different stages of the development pathway
was explored in Hassan et al (2016). This study has shown that the benefit of changing
technologies at different stages of the process development and commercialisation is
dependent on the metrics being considered (e.g. NPV and COG). The study revealed that
from a total costs point of view, it is optimal to change technologies earlier in the process
development in order to avoid additional costs that comparability studies may incur.
However, from an NPV point of view, it is optimal to make changes post market approval
in order to avoid prolonging the time-to-market.
Jenkins et al (2016) explores the costs and operational benefits of using fully automated
platforms for the manufacture of autologous iPSCs. This study has indicated that the
relative cost-effectiveness of automated systems highly depended on the number of doses

101
manufactured per year. Moreover, this study indicated that automated processes for the
manufacture of iPSC cells are more robust than manual processes.
1.8.3 Computational methods
1.8.3.1 Bioprocess economics model
Bioprocess economics models have been employed in multiple studies in order to
evaluate the cost-benefit of different strategies for product manufacture for both
traditional biopharmaceutics and cell therapies. Bioprocess economics models are
capable of simulating whole manufacturing processes and address questions such as:
benefit of perfusion vs fed-batch cell culture and the cost-benefits of single-use stainless
steel technologies (Pollock et al. 2013; Novais et al. 2001). Common metrics used in
order to estimate the cost-benefit of different manufacturing strategies include COG, NPV
and FCI (Wen et al. 2015; Pollard et al. 2016).
COG is the most widely used metric and includes all the costs related to manufacturing
the product including direct and indirect costs (Wen et al. 2015; Pollard et al. 2016). In
cell therapy COG have been used in order to determine the optimal technologies to be
employed in the manufacture of allogeneic adherent cells (Simaria et al. 2014a; Hassan
et al. 2015). FCI is the initial capital investment, which a company must spend in order
to build and open a facility for product manufacture. This metric is yet to be utilized
explicitly in cell therapy publications, however this metric has been employed in
bioprocess in order to estimate the benefits of single-use technologies (Novais et al.
2001). NPV is a metric which considers costs and capital investment as well as risks and
future cash flows (Wen et al. 2015). In cell therapy this metric has been employed in
determining the economic impact of modifying the process at different stages of the
process development and commercialisation (Hassan et al. 2016).

102
Publications on process economics models applied to cell therapy product include Malik
(2012), where the author describes a cost comparison between autologous and allogeneic
MSC-products. In this publication a number of simple assumptions were made to
compute the COG, for example, the production costs (expansion and recovery) for both
the autologous and allogeneic processes where the same. In real life, however, these costs
would differ as economies of scale can be achieved in allogeneic cell therapy
manufacture. Despite these assumptions, the cost per dose of autologous products were
considerably higher than for the allogeneic products. This was due to the fact that cell
therapy products must be tested after tissue acquisition and before product release. Since
each batch requires a different donor in autologous processing, these products become
immediately more expensive due to the higher testing costs per dose. This analysis
although simplistic illustrates that one of the biggest bottlenecks of autologous cell
therapy production is the additional testing costs. It however does not capture additional
hurdles associated with autologous manufacture such as higher facility footprint, higher
FCI etc.
Abou-El-Enein et al. (2013) describes a model for COG estimation, performance analysis
and GMP facility optimisation by using a clean room assessment technique (CTAT) in
an existing facility. The model recognises the core processes within the facility, and
attributes to them a value, which represents the fixed manufacturing costs. The model
then identifies the supporting processes within the facility, which represent the direct
costs. The results shown that the costs comparison between the costs predicted by the
model and the actual costs of the facility did not differ considerably.
Dutton & Fox (2006) have compared the manufacturing costs of manual, automated and
glovebox isolated process for two different scales using a life cycle costs analysis (LCC).
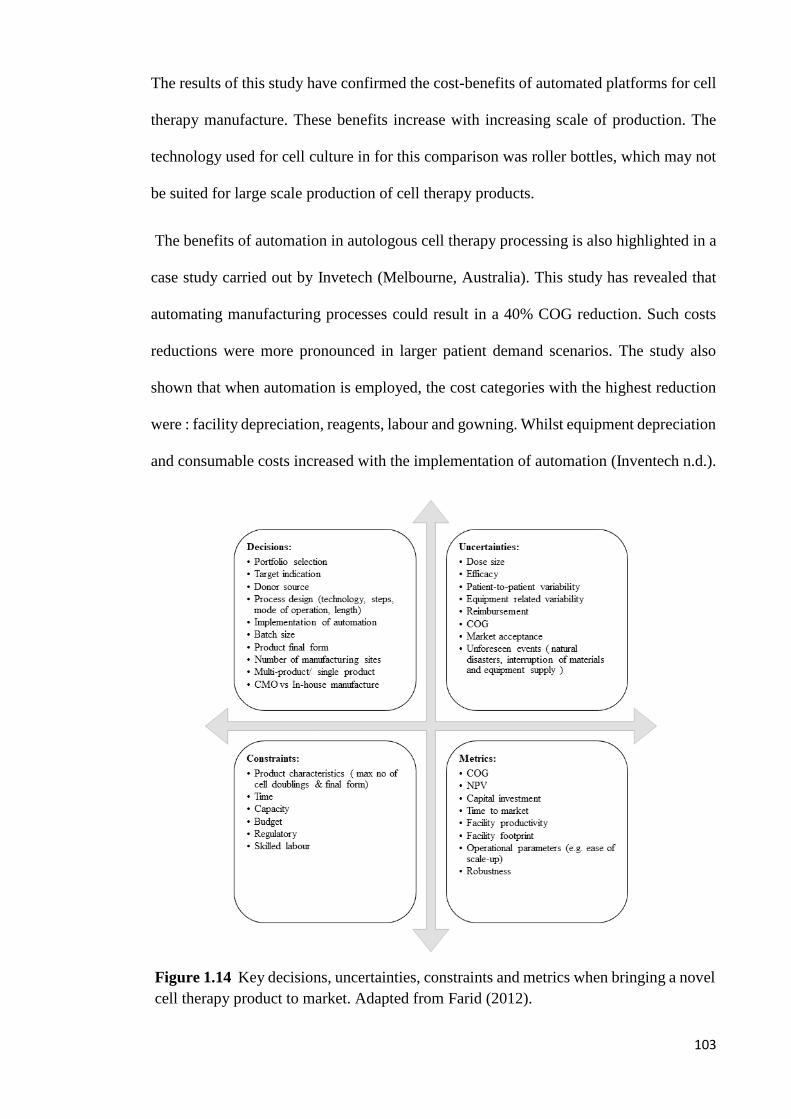
103
The results of this study have confirmed the cost-benefits of automated platforms for cell
therapy manufacture. These benefits increase with increasing scale of production. The
technology used for cell culture in for this comparison was roller bottles, which may not
be suited for large scale production of cell therapy products.
The benefits of automation in autologous cell therapy processing is also highlighted in a
case study carried out by Invetech (Melbourne, Australia). This study has revealed that
automating manufacturing processes could result in a 40% COG reduction. Such costs
reductions were more pronounced in larger patient demand scenarios. The study also
shown that when automation is employed, the cost categories with the highest reduction
were : facility depreciation, reagents, labour and gowning. Whilst equipment depreciation
and consumable costs increased with the implementation of automation (Inventech n.d.).
Figure 1.14 Key decisions, uncertainties, constraints and metrics when bringing a novel
cell therapy product to market. Adapted from Farid (2012).

104
Karnieli (2015) evaluated the material costs reduction and facility footprint requirement
when moving from a 2D disposable system to a non-disposable packed bed system for
adherent cell manufacture. This article has revealed that serum is a significant contributor
towards COG. Furthermore, this study has shown that when switching to multi-use
packed bed systems, cost, personnel requirement and facility footprint reductions are
achieved.
1.8.3.2 Brute force search
Brute-force search tools are a useful tool for process optimization. When using brute force
to select the optimal solution to for a case study, the computer model will screen through
all possible combinations, verify if they meet the criteria established by the user (e.g.
maximum number of cell culture vessels per batch), and then select the optimal solution
according to the desired parameter(s) (e.g. minimum COG) (Sui 2007). In cell therapy,
this method has been used in order to rapidly screen through combinations of technology
candidates and mode of operations and (manual vs automated), with the aim of selecting
the optimal solution for the expansion and differentiation of iPSCs under different
commercialisation scenarios (Jenkins et al. 2016).
1.8.3.3 Monte-Carlo simulation
Monte-Carlo simulations mimic complex processes and providing solutions in terms of a
probability distribution of desired parameters (e.g. COG) which are dependent on
multiple random distributions of intendent parameters (e.g. cell harvest density, process
yield etc.) (Fang & Boas 2009; Harrison 2010). This approach was also employed in
Jenkins et al (2016) in order to evaluate the robustness of automated versus manual
platforms.
105
1.8.3.4 Multi attribute decision-making
Multi-attribute decision making is a method used to enable decisions to be made
considering multiple tangible and intangible variables (e.g. COG and ease of operation)
(Farid 2012; Pollock et al. 2013; Rao 2007). This method, has been employed in
bioprocess case studies in order to evaluate the benefit of SUTs versus SSTs as well as
the benefit of fed-batch vs perfusion cell cultures (Farid 2012; Pollock et al. 2013). The
parameters considered in these analyses were: COG, FCI, construction time, project
throughput criterion, online fermentation control, operational flexibility, ease of
validation cleaning, leachable validation, ease of scale-up, reliance on suppliers, water
and consumables environmental rating, batch to batch variability, ease of control and ease
of development (Farid 2012; Pollock et al. 2013).
1.9 Aims and organisation of thesis
The previous sections of this chapter have underlined several features of cell therapy
products including their therapeutic potential, market value, current products available in
the market, manufacturing process and technology availability for cell therapy
manufacture as well as challenges facing cell therapy developers with emphasis on MSC-
based and CAR T-cell-based products. This chapter has also described the previous use
of decisional tools in providing key insights to some of these challenges. Articles
describing the use of decisional tools to address challenges related to MSC manufacture
have focused on assessing the cost-benefit of different upstream and downstream
technologies for MSC manufacture over several years as well as the effect of switching
between technologies at different stages of the process development pathway. These
studies have not yet captured the less tangible operational aspects of technologies for
MSC manufacture (e.g. robustness, resource requirement, ease of validation, ease of
operation, ease of development).

106
Moreover, there are currently no published studies on the use of decisional tools to help
design and optimize manufacturing strategies for autologous CAR T-cell therapies.
Furthermore, all studies using decisional tools to address questions in the cell therapy
sector have employed methods for computing capital investment characteristic traditional
biopharmaceutical facilities. As previously explained, cell therapy facilities will likely
differ from traditional biopharmaceutical facilities, hence these methods for capital
investment estimation may not be suited for cell therapy facilities.
This thesis aims at illustrating the role of decisional tools in enabling successful
commercialisation of cell therapy products by providing insights to some of the critical
questions facing cell therapy developers with the example of MSC-based and CAR T-cell
therapies.
Chapter 2 describes the advanced integrated bioprocess economics tool used to generate
the results seen in Chapter 3 to Chapter 5. This tool incorporates a fixed capital
investment model, a bioprocess economics model coupled with brute-force optimization,
a robustness model, a multi-attribute decision making model and a net present value
model.
Chapter 3 describes the use of the fixed capital investment model described in Chapter
2 to provide a detailed factorial methodology for estimating FCI and footprint for bespoke
cell therapy facilities that accounts for technology-specific factors such as cleanroom
classifications and facility layout. Chapter 4 uses the advanced decisional tool described
in Chapter 2 to provide a novel integrated approach to evaluate the cost and operational
benefit of technologies for MSC manufacture across different scenarios and identifies
performance targets that must be met in order to enhance the commercial feasibility of
cell therapy products. Chapter 5 describes the first in-depth economic study on CAR T-
cell therapy products with insights at both technology level and an enterprise’s facility

107
configuration level. Chapter 6 summarises the key conclusions and contributions from
the case studies described in Chapter 3 to Chapter 5 and discusses possible avenues to
extend these case studies and Chapter 7 highlights the process for validating cell therapy
products as well as some of the key challenges associated with this process.

108
Chapter 2: Materials and Methods
2.1 Introduction
As described in Chapter 1, companies developing cell therapy products face multiple
questions and challenges. Such questions include the selection of the optimal
manufacturing strategy for these unique products considering economic and operational
features of different manufacturing platforms, autologous versus allogeneic product
manufacture and the benefits of multi-site product manufacture. This chapter describes
the integrated decisional tool developed to tackle such questions whilst capturing the
technical, economic and risk specificities of cell therapy manufacture. The application of
the tool to industrially-relevant case studies is described in Chapters 3-5.
The remainder of this chapter is structured as follows. Section 2.2 describes the overall
architecture of the advanced decisional tool. Sections 2.3-2.7 provide a more detailed
description of each of the components in the decisional tool. The final section (Section
2.8) describes the methods used for the collection of the data used in the results chapters.
2.2 Tool architecture
The advanced decisional tool was developed to comprise the following components: a
database, a fixed capital investment (FCI) model, a process economics model, brute force
optimization, a multi-attribute decision making (MADM) model, a robustness analysis
model and a risk-adjusted cash flow model. The tool architecture is summarised in
Figure 2.1.
The information from the database provides the relevant assumptions used during the
different case studies. The FCI model described in Section 2.3 is used to compute the
facility footprint and FCI of cell therapy facilities across multiple commercialisation
scenarios, considering parameters such as technology selection, facility location and

109
cleanroom classification. Both FCI and facility footprint are used by the bioprocess
economics model and by the risk-adjusted cash flow model to evaluate the cost of goods
(COG) per dose (Section 2.4) and risk-adjusted net present value (rNPV) (Section 2.7)
respectively.
The bioprocess economics model described in Section 2.4 uses a series of advanced
equations to carry out mass balance and equipment sizing in order to evaluate resource
requirement and COG for different manufacturing strategies across multiple
commercialisation scenarios. This model is coupled with brute force optimization, which
is used to evaluate rapidly the suitability of different manufacturing strategies for the
selected commercialisation scenarios.
Section 2.5 describes a multi-attribute decision making model that was used to evaluate
manufacturing platforms by considering both operational and economic attributes. The
robustness of different manufacturing strategies was captured using the Monte Carlo
model described in Section 2.6. In order to evaluate the economic benefit of different
commercialisation strategies over the lifecycle of a cell therapy product, a net present
value model was developed; this is described in Section 2.7.

110
Figure 2.1 Schematic representation of the integrated bioprocess economics tool. This tool encompasses a database, a fixed capital
investment model, a process economics model coupled with brute force optimization, a multi-attribute decision making tool, a Monte-
Carlo model and a net present value model.

111
2.3 Technology-specific detailed factorial method for fixed capital investment
estimation
2.3.1 Method overview
Since cell therapy products cannot be sterilised at the end of the manufacturing process
(Dietz et al. 2007), they will likely employ single-use technologies and hence the facilities
will differ from traditional stainless steel facilities (Bozenhardt 2017). Furthermore, the
cost of different cell culture technologies (e.g. multilayer vessels such as Cell Factories®
(Nunc, Roskilde, Denmark/Thermofischer, Waltham, MA, USA) versus integrated kits
such as Prodigy® (Miltenyi Biotec, Gladbach, Germany)) can vary widely in the cell
therapy sector; hence, the use of a common “Lang factor” for all cell therapy facilities
can be inappropriate. Therefore, traditional methods for FCI estimation may not apply to
cell therapy facilities. This section describes a novel detailed factorial methodology for
estimating FCI and footprint for bespoke cell therapy facilities that accounts for
technology-specific factors for key cell culture technologies as well as the implications
of single-use technologies, open versus closed operations and the commercialisation
scenario selected. This was used to derive benchmark values for short-cut cost and area
factors for typical cell therapy facilities according to the technologies selected. This
method was used to compute FCI and facility running costs in Chapter 3 and Chapter
5.
The short-cut method for facility footprint and FCI estimation outlined in this section
resembles the “Lang factor” (Lang 1948) method described in Section 1.7. When using
the “Lang factor” method, a number was derived using historical data which when
multiplied by the total equipment purchase costs (TEPC), provides the total capital
investment required. This number varied between 3.10 and 4.74 for chemical facilities
depending on the type of product manufactured within the facility (Lang 1948). In the

112
method described in this chapter, a single number which provides a ratio between the
main process equipment costs (e.g. skids, incubators and biosafety cabinets), and the total
costs is also estimated. However, this ratio varies according to the technologies used for
cell therapy manufacture, the location of the facility, the commercialisation scenario, the
type of project and cleanroom classification. The same parameters were also considered
to provide a ratio between the reciprocal facility footprint and main process equipment
costs in order to enable the user to estimate the footprint of a cell therapy facility using
only the costs of the main process equipment. This novel short-cut method is summarised
in Figure 2.2.
2.3.2 Model overview
Section 2.2.1 described a novel method for evaluating facility costs and facility footprint
for cell therapy facilities. In order for this method to be adopted, cost factors and area
factors for multiple hypothetical facilities had to be derived. This was done using a fixed
capital investment model summarised in Figure 2.3.
Figure 2.2 Schematic representation of the short-cut method used to calculate facility
footprint and facility costs. A cost factor is multiplied by the total process equipment
purchase costs to provide the fixed capital investment. The total process equipment
purchase costs are divided by an area factor to calculate the facility footprint.
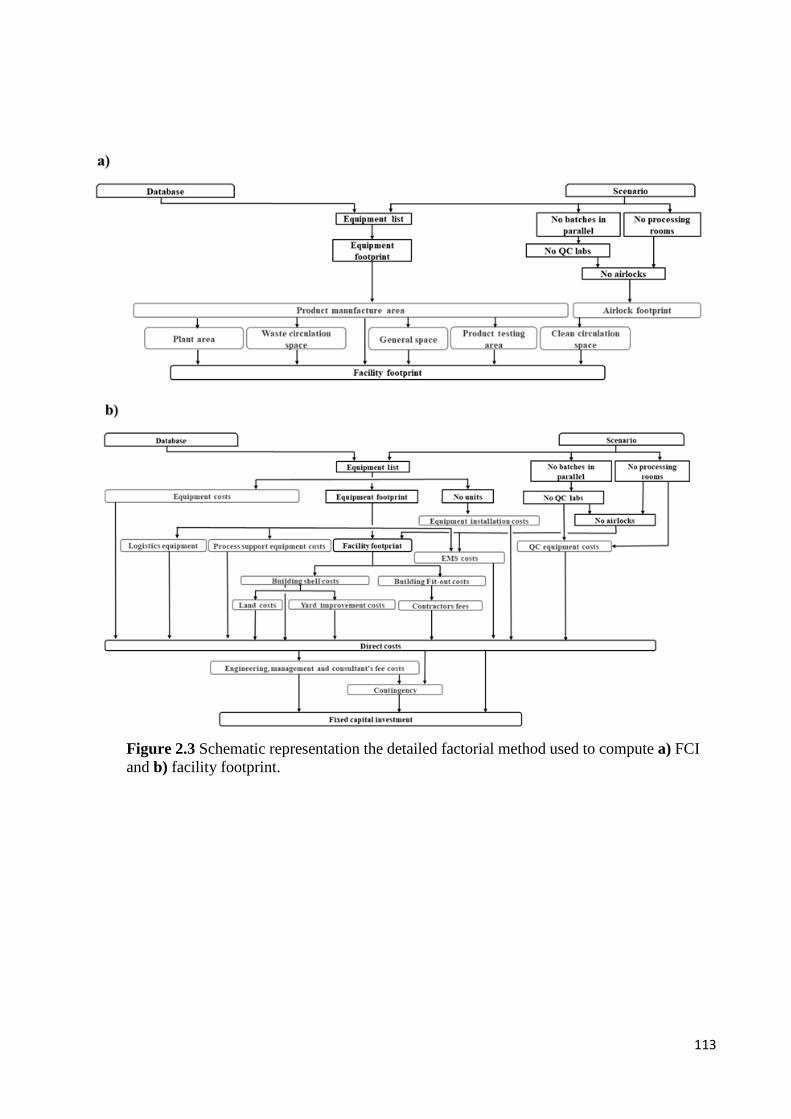
113
Figure 2.3 Schematic representation the detailed factorial method used to compute a) FCI
and b) facility footprint.

114
2.3.2.1 Area factor
The area factor (Fa) is calculated by dividing the total process equipment costs (Cpe) by
the total facility footprint (ab). The total process equipment costs are given by the sum of
the number of units of each type of equipment required multiplied by the cost per
equipment unit.
𝐶𝑝𝑒 = ∑ 𝐶𝑝𝑒𝑖 × 𝑁𝑝𝑒𝑖
𝑖=𝑛
𝑖=1
(2.1)
where 𝐶𝑝𝑒𝑖 = cost per unit of process equipment i
𝑁𝑝𝑒𝑖 = no of units of process equipment i required
The facility footprint is given by the sum of the footprint of the different sections within
the facility. Six main sections were identified, as these are likely to have different
cleanroom classifications. These sections were: product manufacture am, clean circulation
space ac, product testing at, waste circulation space aw, general space ag and plant space
ap. The product manufacture area, am, corresponds to the main processing area where all
product manufacture operations take place including inoculation, cell culture,
downstream processing and formulation and fill. These operations are carried out in
cleanrooms which have the highest ISO qualification within the facility. The clean
circulation space ac corresponds to the airlocks and corridors that separate the product
manufacture area and the general area within the facility as well as janitor rooms required
for clean areas. The product testing area, at, includes the space required for QC labs,
microbiology labs, polymerase chain reaction (PCR) rooms, janitor rooms for laboratories
as well as the corridors and personnel and material airlocks. The waste circulation area
includes waste disposal rooms, corridors and personnel changing rooms. The general
space within the facility comprises the logistics rooms, meeting rooms, offices, cold
rooms, general corridors, loading docks, WC, staircases, facility receptions and janitor
rooms for general areas. The plant area is where the utilities reside ( including the HVAC

115
systems); this area is smaller in SU facilities than in stainless steel (SS) facilities as CIP
and SIP activities are reduced (Barak & Bader 2008; Rogge et al. 2015; Levine et al.
2012; Guldager 2010; Sargent 2013; Tiene 2016; Geipel-Kern 2009; Whitford 2010;
Lopes 2015; Eibl & Eibl 2010; Novais et al. 2001; Guldager 2009). Moreover, this model
assumes that no media and buffer preparation is carried out within the facility, such that
the materials are pre-formulated before arriving to the manufacturing site further reducing
the plant area and increasing the storage space required.
The product manufacture area is calculated using the footprint of the main process
equipment, ape, and the ratio between the footprint of the main process equipment and the
product manufacture area; this ratio is retrieved from a database:
The total footprint of the main process equipment is calculated in a similar manner as the
total costs of the main process equipment, by the sum of the number of units of each type
equipment required multiplied by the footprint per unit of equipment.
𝑎𝑝𝑒 = ∑ 𝑎𝑝𝑒𝑖 × 𝑁𝑝𝑒𝑖
𝑖=𝑛
𝑖=1
(2.3)
where 𝑎𝑝𝑒𝑖 = footprint per unit of process equipment i
𝑁𝑒𝑖 = no of units of process equipment i required
All other sections within the facility ax (apart from personnel and materials airlocks) are
calculated as a function of the product manufacture area and a ratio between the product
𝑎𝑚 = 𝑎𝑝𝑒 × 𝑟𝑚/𝑒 (2.2)
where 𝑎𝑃𝑒 = total footprint occupied by process equipment
𝑟𝑚/𝑒 = ratio between product manufacture area and
total footprint of the process equipment

116
manufacture area and the footprint of that particular section. The personnel and materials
airlocks were assumed to have a fixed footprint. As one personnel and materials airlock
were attributed for each processing room and laboratory, the number of airlocks becomes
a function of the number of processing rooms and labs within the facility.
𝑎𝑥 = (𝑎𝑚 × 𝑟𝑥/𝑚 ) (2.4)
where 𝑎𝑥 = footprint of manufacturing section x (e.g.
clean circulation space, product testing area,
waste circulation space, general area and plat
area)
𝑎𝑚 = product manufacture area
𝑟𝑥/𝑚 = ratio between footprint of section x and
footprint of product manufacture area
The area factor is then calculated as follows:
𝐹𝑎 =𝐶𝑝𝑒
∑ 𝑎𝑚, 𝑎𝑐, 𝑎𝑡, 𝑎𝑤, 𝑎𝑔, 𝑎𝑝, (𝑁𝑝𝑟 + 𝑁𝑙𝑎𝑏) × (𝑎𝑃𝐴𝐿 + 𝑎𝑀𝐴𝐿)
(2.5)
where 𝑁𝑝𝑟 = no of processing rooms
𝑁𝑙𝑎𝑏 = no of labs
𝑎𝑃𝐴𝐿 = footprint per personnel airlock
𝑎𝑀𝐴𝐿 = footprint per material airlock
2.3.2.2 Cost factor
The cost factor is calculated by dividing the sum of all the costs included in the FCI by
the main process equipment costs Cpe. FCI can be divided into direct FCI (i.e. fixed plat
costs) and non-direct FCI. The different costs included in the direct FCI calculation were
the main process equipment costs Cpe, process support equipment costs Cse, QC

117
equipment costs CQC, logistics equipment costs Cle, environment monitoring systems
(EMS) CEMS, main process equipment installation costs Cie, building shell costs Cbs,
building fit-out cots Cbf, contractor fees Cc, land costs Cl and yard improvement costs
Cy. Non-direct cost categories included in the FCI calculation were project design,
engineering management and consultant fees Ceng and contingency costs Ccon.
The process support equipment costs Cse include the costs of benchtop centrifuges,
pumps, weighting equipment, trolleys, wracks, shelves etc. These costs are calculated by
multiplying the product manufacture area am by the process support equipment costs per
m2 of product manufacturing area cse.
𝐶𝑠𝑒 = 𝑎𝑚 × 𝑐𝑠𝑒 (2.6)
where 𝑐𝑠𝑒 = process support equipment costs per m2 of
product manufacture area
A similar method was employed in evaluating the equipment logistics costs, Cle, where
the total footprint of the product manufacture area am is multiplied by the costs of logistics
equipment per m2 of product manufacture area, cle. The logistics equipment include
fridges, freezers and roller racking.
𝐶𝑙𝑒 = 𝑎𝑚 × 𝑐𝑙𝑒 (2.7)
where 𝑐𝑙𝑒 = logistics equipment costs per m2 of product
manufacture area
QC equipment include filter integrity testers, incubators, fluorescence-activated cell
sorting (FACS) systems, PCR systems, high liquid performance chromatography systems
(HPLC) among other technologies. The QC equipment costs are not dependent on the

118
facility footprint or on other equipment costs. The QC equipment costs are calculated
under the assumption that each QC lab would include one unit of each different type of
equipment necessary for QC testing. The equipment costs per QC lab are then added
together and multiplied by the number of QC labs within the facility. This is given by the
number of batches being manufactured in parallel divided by the maximum number of
batches which a QC lab can process in parallel.
𝐶𝑄𝐶 = (𝑐𝑄𝐶 × 𝑁𝑏𝑎𝑡𝑐ℎ)
𝑁𝑏𝑎𝑡𝑐ℎ𝑀𝐴𝑋
(2.8)
where 𝑐𝑄𝐶 = QC equipment costs per lab
𝑁𝑏𝑎𝑡𝑐ℎ = no of batches in parallel
𝑁𝑏𝑎𝑡𝑐ℎ𝑀𝐴𝑋 = maximum no of batches in parallel per QC lab
The EMS costs are calculated by adding the costs of the central monitoring unit and the
costs of the monitoring probes in the product manufacture area and airlocks. The model
assumes that the measurements taken for environment monitoring within a given facility
were pressure, humidity, temperature and number of air particles. The minimum number
of probes required to monitor the number of particles per unit volume of air is calculated
as the square root of the product manufacture area and airlock area rounded up to the
nearest whole number. This measurement is only necessary in B grade rooms. The
minimum number of probes per room and airlocks for all other measurements is one.
𝐶𝐸𝑀𝑆 = 𝑐𝐶𝑈 + (𝑁𝑟𝑜 × 3 × 3)
+ (√𝑎𝑚 + ((𝑎𝑃𝐴𝐿 + 𝑎𝑃𝐴𝐿) × 𝑁𝑟𝑜)2
)
(2.9)
where 𝑐𝐶𝑈 = central monitoring unit costs

119
𝑁𝑟𝑜 = no of processing rooms
𝑎𝑚 = product manufacture area
𝑎𝑃𝐴𝐿 = footprint per personnel airlock
𝑎𝑀𝐴𝐿 = footprint per material airlock
In the above equation, when calculating the number of probes, the number of product
manufacture rooms, Nro, is multiplied by 3 to account for the number of personnel and
materials airlocks leading into these rooms. This number is multiplied again by 3 to
account for the fact that three different probes are required per manufacturing room and
airlocks for measures of humidity, temperature and pressure.
The process equipment installation costs Cie are calculated by multiplying the number of
process equipment units by the installation costs per unit cie.
𝐶𝑖𝑒 = 𝑁𝑒 × 𝑐𝑖𝑒 (2.10)
where 𝑁𝑒 = no of equipment units
𝑐𝑖𝑒 = installation costs per equipment unit
The building shell costs Cbs are given by the sum of the footprint of all the sections within
the facility previously highlighted multiplied by the shell costs per m2:
𝐶𝑏𝑠 = 𝑎𝑏 × 𝑐𝑏𝑠 (2.11)
where 𝑎𝑏 = total building footprint
𝑐𝑏𝑠 = shell costs per m2
120
The building fit-out costs Cbf include the majority of the building-related costs; these
include partitions, floors, ceilings, air conditioning, duct work, electrical distribution,
lighting, controls and monitoring, pipework and insulation etc. Given that different
sections within a cell therapy facility may have different ISO classifications, the building
fit-out costs is given by the sum of the fit out costs of the individual sections within a
facility.
𝐶𝑏𝑓 = ∑ 𝑐𝑏𝑓𝑥
𝑥=𝑛
𝑥=1
× 𝑎𝑥 (2.12)
where 𝑐𝑏𝑓𝑥 = fit-out costs per m2 for facility section x
𝑎𝑥 = footprint of facility section x
The contractor fees Cc are calculated as a percentage of the facility fit out costs:
𝐶𝑐 = 𝐶𝑏𝑓 × 𝑟𝐶𝑐/𝐶𝑏𝑓 (2.13)
where 𝐶𝑏𝑓 = facility fit-out costs
𝑟𝐶𝑐/𝐶𝑏𝑓 = ratio between contractor fees and facility fit-
out costs
Both land costs Cl and yard improvement costs Cy were calculated as a function of the
building shell costs
𝐶𝑙 = 𝐶𝑏𝑠 × 𝑟𝐶𝑙/𝐶𝑏𝑠 (2.14)
where 𝐶𝑏𝑠 = building shell costs

121
𝑟𝐶𝑙/𝐶𝑏𝑠 = ratio between land costs and building shell
costs
𝐶𝑦 = 𝐶𝑏𝑠 × 𝑟𝐶𝑦/𝐶𝑏𝑠 (2.15)
where 𝐶𝑏𝑠 = building shell costs
𝑟𝐶𝑦/𝐶𝑏𝑠 = ratio between yard improvement costs and
building shell costs
The project direct costs is a sum of all the costs parameters described until this point (the
main process equipment costs, process support equipment costs, QC equipment costs,
logistics equipment costs, EMS costs, main process equipment installation cost, building
shell costs, building fit out costs, contractors fees, land costs and yard improvement
costs). Design, engineering management and consultant fees Ceng are calculated as a
function of the total direct costs.
𝐶𝑒𝑛𝑔 = (∑ 𝐶𝑝𝑒 , 𝐶𝑠𝑒 , 𝐶𝑙𝑒 , 𝐶𝑄𝐶 , 𝐶𝐸𝑀𝑆 , 𝐶𝑖𝑒 , 𝐶𝑏𝑠, 𝐶𝑐, 𝐶𝑙, 𝐶𝑦) × 𝑟𝐶𝑒𝑛𝑔/𝐶𝑑 (2.16)
where 𝑟𝑒𝑛𝑔/𝐶𝑑 = ratio between design, engineering
management and consultant fees costs and
direct costs
The contingency costs are costs attributed to potentially unforeseen events which may
increase the fixed capital investment and/or delay the process such as strikes and natural
disasters. These costs are calculated as a function of the total project costs (direct costs
plus design, engineering, management and consultant fees):

122
𝐶𝑐𝑜𝑛 = (∑ 𝐶𝑝𝑒, 𝐶𝑠𝑒 , 𝐶𝑙𝑒 , 𝐶𝑄𝐶 , 𝐶𝐸𝑀𝑆, 𝐶𝑖𝑒 , 𝐶𝑏𝑠, 𝐶𝑐, 𝐶𝑙 , 𝐶𝑦, 𝐶𝑒𝑛𝑔) × 𝑟𝐶𝑐𝑜𝑛/𝐶𝑡𝑜𝑡 (2.17)
where 𝑟𝑐𝑜𝑛/𝑡𝑜𝑡 = ratio between contingency costs and total
project costs
2.4 Process economics model
The process economics model used to compute the COG associated with different
manufacturing strategies was developed in Microsoft Excel (Microsoft® Corporation,
Redmond, WA) as this programme offers a user friendly interface. This model uses a
similar approach to those published in Hassan et al (2015) and Simaria et al (2014) to
simulate the manufacturing process of cell therapy products across multiple
commercialisation scenarios selected by the user. The process economics model mimics
single product cell therapy facilities manufacturing autologous or allogeneic cell therapy
products. The facilities modelled produce multiple batches with durations defined by the
user. This model is capable of evaluating the economic and operational benefits of
multiple process designs by carrying out detailed mass balance and equipment sizing for
each of the process unit operations within the manufacturing process of cell therapy
products, while accounting for possible product losses characteristic of the different unit
operations.
The scope of the processes captured in this bioprocess economics model includes all
manufacturing unit operations carried out between tissue acquisition and the final
formulation of the product. The process sequence and length as well as the resource
requirement for each unit operation are dependent on the cell therapy product being
manufactured and were selected with the product purity, potency and viability in mind.
The mass balance and equipment sizing results are used to estimate COG for different

123
types of cell therapy products (e.g. autologous v allogeneic, adherent v suspension cell
culture etc.).
2.4.1 Mass balance & equipment sizing
Multiple unit operations are used during cell therapy manufacture. The specific aim of
each of these unit operations have been described in detail in Chapter 1 Section 1.4.
Throughout the manufacturing process for cell therapy products, the cells go from one
unit operation to the other with product loss occurring during most unit operators. Hence,
the number of cells loaded into a particular unit operation are the same as the cells that
exit the previous unit operation. The cells exiting a unit operation n are calculated as:
𝑁𝑐𝑜𝑢𝑡 = 𝑁𝑐𝑖𝑛
× 𝑌𝑛 (2.18)
where 𝑁𝑐𝑜𝑢𝑡 = no of cells exiting the unit operation n
𝑁𝑐𝑖𝑛 = no of cells entering the unit operation n
𝑌𝑛 = yield of the unit operation n
The step yield of each different unit operation is retrieved form the database and can be
found in Chapter 4 and Chapter 5. In order to account for cell losses suffered during the
manufacturing process and hence ensuring that the adequate demand is fulfilled, the
number of cells initially loaded into the process is calculated by applying a redundancy
ratio in order to consider issues that may occur during product transportation or
administration which have been described in Chapter 1 Section 1.6:
𝑁𝑐𝑖𝑛0 =
𝑁𝑐𝑡𝑎𝑟𝑔𝑒𝑡× 𝑟𝑟
(𝑌𝑛0 × 𝑌𝑛1 … .× 𝑌𝑛) × 𝑒𝑘×(𝑡−1)
(2.19)
where 𝑁𝑐𝑖𝑛0 = no of cells initially loaded into the process
124
𝑁𝑐𝑡𝑎𝑟𝑔𝑒𝑡 = target no of cells at the end of the
manufacturing process
𝑟𝑟 = redundancy ratio (autologous CAR T-cell
manufacture only)
𝑌𝑛 = yield of each process step
𝑘 = exponential constant
t = no of cell culture days
Due to the limitations in capacity of current technologies for allogeneic cell therapy
manufacture, it is likely that a high number of batches will be required in order to fulfil
large annual demands (Chereau 2011; Heathman et al. 2015; Simaria et al. 2014b). In
autologous cell therapy manufacture, each patient represents one batch. Hence, in high
annual demand scenarios a very high number of batches will also be required. If the
number of batches required to fulfil a particular annual demand exceeds the maximum
number of batches that can be processed in series within the manufacturing year, then
parallel processing is carried out. The number of batches manufactured in parallel
required to fulfil a particular annual demand is calculated as follows:
𝑁𝐵𝑝𝑎𝑟𝑎𝑙𝑙𝑒𝑙 =
𝑁𝐵𝑝𝑒𝑟 𝑦𝑒𝑎𝑟× 𝐿𝑝𝑟𝑜𝑐
𝑌𝑀𝐹𝐺
(2.20)
where 𝑁𝐵𝑝𝑎𝑟𝑎𝑙𝑙𝑒𝑙 = no of batches in parallel
𝑁𝐵𝑝𝑒𝑟 𝑦𝑒𝑎𝑟 = batches per year
𝐿𝑝𝑟𝑜𝑐 = length of the process
𝑌𝑀𝐹𝐺 = Manufacturing year
2.4.1.1 Reagents
Buffers
125
Multiple buffers are required throughout the manufacturing process of cell therapy
products. During elutriation and magnetic separation of autologous CAR T-cells, the
quantities of buffers required are evaluated as a function of the number of cycles required
to process the target number of cells. These buffers include: magnetic rinse buffer,
magnetic separation buffer, NaCl and PBS. The number of cycles required to processes a
given amount of cells is evaluated as follows:
𝑁𝐶𝑦 =𝑁𝑐𝑖𝑛𝑛
𝑁𝑐𝑚𝑎𝑥𝑛
(2.21)
where 𝑁𝑐𝑖𝑛𝑛 = no of cells loaded into the unit operation n
𝑁𝑐𝑚𝑎𝑥𝑛 = max no of cells which can be loaded per cycle
in unit operation n
The volume of rinse buffer, NaCl, PBS for elutriation and hydroxyethyl (Hespan)
required can then be evaluated:
𝑉𝑅𝑖= 𝑁𝐶𝑦 × 𝑉𝑅𝑖/𝑐𝑦 (2.22)
where 𝑉𝑅𝑖 = volume of reagent i (buffer or Hespan)
𝑉𝑅𝑖/𝑐𝑦 = volume of reagent i (buffer or Hespan)
required per cycle
Multiple steps are required for magnetic separation of T-cells including pellet
resuspension, cell dilution, pellet dilution, column load, column wash and elution. Hence,
a different method is used to calculate the volume of separation buffer required:
𝑉𝑅𝑖= (𝑉𝑙 + 𝑉𝑒 + (𝑉𝑝𝑑 ×
𝑁𝑐𝑖𝑛𝑛
𝑁𝑐𝑝𝑑𝑚𝑎𝑥) + (𝑉𝑝𝑟 ×
𝑁𝑐𝑖𝑛𝑛
𝑁𝑐𝑝𝑟𝑚𝑎𝑥) + (𝑉𝑐𝑑
− (𝑉𝑝𝑟 × 𝑁𝑐𝑖𝑛𝑛
𝑉𝑝𝑟𝑚𝑎𝑥) ) × 𝑁𝐶𝑦
(2.23)
where 𝑉𝑅𝑖 = volume of reagent i (separation buffer)
𝑉𝑙 = column load volume

126
𝑉𝑒 = elution volume
𝑉𝑝𝑑 = pellet dilution volume
𝑁𝑐𝑝𝑑𝑚𝑎𝑥 = max no of cells per set of separation buffer
for pellet dilution
𝑉𝑝𝑟 = pellet resuspension volume
𝑁𝑐𝑝𝑟𝑚𝑎𝑥 = max no of cells per set of separation buffer
for pellet resuspension
𝑉𝑐𝑑 = cell dilution volume
Throughout the CAR T-cell manufacturing process multiple wash and volume reduction
unit operations are required. In order to evaluate the volume of PBS required for cell
wash, the number of washes performed must be considered:
𝑉𝑅𝑖= 𝑁𝑤 × 𝑁𝐶𝑦 ×
𝑁𝑐𝑖𝑛𝑛× 𝑌𝑛
𝐶𝑜𝑛𝑐𝑑𝑒𝑠𝑖𝑟𝑒𝑑
(2.24)
where 𝑉𝑅𝑖 = volume of reagent i (PBS for cell wash)
𝑁𝑤 = no of washes
𝑌𝑛 = yield of unit operation
𝐶𝑜𝑛𝑐𝑑𝑒𝑠𝑖𝑟𝑒𝑑 = desired cell concentration
Furthermore, in allogeneic CAR T-cell manufacture, an electroporation unit operation is
required. This step requires a special buffer. The volume of buffer used is evaluated
according to the number of cells that are going through the electroporation process:
𝑉𝑅𝑖=
𝑁𝑐𝑖𝑛𝑛
𝐶𝑜𝑛𝑐𝑑𝑒𝑠𝑖𝑟𝑒𝑑
(2.25)
where 𝑉𝑅𝑖 = volume of reagent i (electroporation buffer)

127
As a fluidised bed centrifuge is used for microcarrier removal, cell wash and
concentration in allogeneic MSC manufacture, a different method was applied when
calculating the buffer volume requirement. The buffers required for this unit operation
are prime buffer and wash buffer. The volume of prime buffer required is calculated
taking into account the bowl volume, number of chambers selected and holdup volume.
𝑉𝑅𝑖= (𝑉𝑏𝑜𝑤𝑙 × 𝑁𝑐ℎ) + 𝑉ℎ) × 𝑁𝐹𝐵𝐶 (2.26)
where 𝑉𝑅𝑖 = volume of reagent i (prime buffer)
𝑉𝑏𝑜𝑤𝑙 = bowl volume
𝑁𝑐ℎ = no of chambers used
𝑉ℎ = holdup volume
𝑁𝐹𝐵𝐶 = no of fluidised bed centrifuges
The number of fluidised bed centrifuge units required for microcarrier removal and for
cell wash may differ and is given by:
𝑁𝐹𝐵𝐶 = 𝑁𝑐𝑦
𝑁𝑐𝑦𝑀𝑎𝑥
(2.27)
where 𝑁𝑐𝑦𝑀𝑎𝑥 = maximum no of cycles per fluidised bed
centrifuge
The maximum number of cycles per fluidised bed centrifuge is calculated according to
the time required of each stage of the microcarrier separation, wash and concentration
process:
𝑁𝑐𝑦𝑀𝑎𝑥=
𝑉𝑖𝑛
𝑄𝑠𝑡𝑎𝑟𝑡+
𝑉𝑖𝑛
𝑄𝑁𝑜𝑟𝑚𝑎𝑙+
𝑉𝑜𝑢𝑡
𝑄𝐻𝑎𝑟𝑣𝑒𝑠𝑡
𝑇𝑚𝑎𝑥
(2.28)
where 𝑄𝑠𝑡𝑎𝑟𝑡 = starting flowrate
𝑄𝑁𝑜𝑟𝑚𝑎𝑙 = wash flowrate

128
𝑄𝐻𝑎𝑟𝑣𝑒𝑠𝑡 = harvest flowrate
𝑉𝑜𝑢𝑡 = volume out of the FBC
𝑇𝑚𝑎𝑥 = maximum time allocated to downstream
process
If microcarriers are not used for MSC cell culture, then 𝑉𝑖𝑛 is the volume of cells attained
from the cell culture process and 𝑉𝑜𝑢𝑡 is the volume of the cells attained from the cell
culture process multiplied by the yield of the wash and concentration process. If on the
other hand microcarriers are used during MSC cell culture, a two-step fluidised bed
centrifugation is performed; the first stage is used to remove microcarriers, hence 𝑉𝑖𝑛 is
the volume of cells attained from the cell culture process and 𝑉𝑜𝑢𝑡 is 𝑉𝑖𝑛 minus the volume
of microcarriers. The second unit operation is used to wash and concentrate the cells
where 𝑉𝑖𝑛 is the volume of cells loaded in the fluidised bed system minus the volume of
microcarriers, and 𝑉𝑜𝑢𝑡 is the volume of cells required to achieve the final target
concentration. The volume of the wash buffer required is also calculated as a function of
the number of washes required:
𝑉𝑅𝑖= ( (𝑉𝑜𝑢𝑡 × 𝑁𝑤) + 𝑉ℎ) × 𝑁𝐹𝐵𝐶 (2.29)
where 𝑉𝑅𝑖 = volume of reagent i (wash buffer) required
𝑉ℎ = holdup volume
𝑁𝐹𝐵𝐶 = no fluidised bed centrifuge
In order to cryopreserve the cells, these must first be suspended in formulation solution
typically containing 10% DMSO. The volume of formulation solution required is the
same as the volume out of the final wash and concentration stage.
𝑉𝑅𝑖=
𝐶𝑜𝑛𝑐𝑓𝑖𝑛𝑎𝑙
(𝑁𝑐𝑖𝑛× 𝑌)
(2.30)

129
Where 𝑉𝑅𝑖= = volume of reagent i (DMSO containing
solution) required
𝐶𝑜𝑛𝑐𝑓𝑖𝑛𝑎𝑙 = final concentration
𝑁𝑐𝑖𝑛 = cells into the fluidised bed centrifuge
𝑌 = yield of the unit operation
Magnetic beads for isolation of specific T-cell populations
The volume of magnetic selection beads required is calculated according to the number
of cells being separated:
𝑉𝑅𝑖=
𝑁𝑐𝑖𝑛𝑛
𝑁𝑐𝑀𝐴𝑋 × 𝑉𝑚𝑏 × 𝑁𝑐𝑦
(2.31)
where 𝑉𝑅𝑖 = volume of reagent i (magnetic beads)
𝑁𝑐𝑖𝑛𝑛 = no of T-cells loaded into the unit operation
𝑁𝑐𝑀𝐴𝑋 = maximum no of T-cells per set of microbeads
𝑉𝑚𝑏 = volume microbeads per set
CD3/CD28 nanomatrix for T-cell activation
The volume of CD3/CD28 nanomatrix required for T-cell activation is calculated
according to the number of cells being activated:
𝑉𝑅𝑖=
𝑁𝑐𝑖𝑛𝑛
𝐶𝑜𝑛𝑐𝑛𝑎𝑛𝑜 × 𝑟𝑛𝑎𝑛/𝑐
(2.32)
where 𝑉𝑅𝑖 = is volume of reagent i (nanomatrix)
required
𝑁𝑐𝑖𝑛𝑛 = no of cells to be activated
𝐶𝑜𝑛𝑐𝑛𝑎𝑛𝑜 = is the concentration of activation
nanomatrix

130
𝑟𝑛𝑎𝑛/𝑐 = is the ratio between the units of nanomatrix
and the cells added
Viral vector for T-cell genetic modification
The number of infectious units (IFU) for viral transduction is also evaluated as a function
of the number of cells being transduced:
𝑁𝑣𝑝 = 𝑁𝑐𝑖𝑛𝑛 × 𝑀𝑂𝐼 (2.33)
where 𝑁𝑣𝑝 = no of viral particles required
𝑁𝑐𝑖𝑛𝑛 = noof cells to be transduced
𝑀𝑂𝐼 = no of viral particles per cell
Retronectin for T-cell genetic modification
The quantities of retronectin required are given in micrograms and are a function of the
geometry of the cell culture vessel:
𝑀𝑅𝑖= 𝑆𝑣𝑒𝑠𝑠𝑒𝑙 × 𝐶𝑜𝑛𝑐𝑟𝑒𝑡𝑟𝑜 (2.34)
where 𝑀𝑅𝑖 = mass of reagent i required (retronectin)
𝑆𝑣𝑒𝑠𝑠𝑒𝑙 = size of cell culture vessel (for planar cell
culture vessels: surface area of the based. For
3D cell culture vessels: working volume of the
cell culture vessel)
𝐶𝑜𝑛𝑐𝑟𝑒𝑡𝑟𝑜 = concentration of retronectin required
Cell culture media
The cell culture media used is calculated differently for planar and 3D cell culture vessels.
For planar cell culture vessels this is calculated a function of the surface area of the base
of the cell culture vessel whilst for 3D cell culture vessels it is calculated as a function of
the working volume of the vessel. Hence for planar technologies:

131
𝑉𝑅𝑖= ∑ 𝐶𝑎𝑝𝑢𝑛𝑖𝑡 × 𝑁𝑒𝑥 × 𝑁𝑢𝑛𝑖𝑡𝑛
𝑖=𝑛
𝑖=1
× 𝑟𝑚𝑒𝑑/𝑎𝑟𝑒𝑎 (2.35)
where 𝑉𝑅𝑖 = is the volume of reagent i required ( cell
culture media)
𝐶𝑎𝑝𝑢𝑛𝑖𝑡 = capacity of cell culture vessels ( surface
area)
𝑟𝑚𝑒𝑑/𝑎𝑟𝑒𝑎 = is the volume of media added per unit area
of the base of the cell culture vessel
𝑁𝑒𝑥 = no of media exchanges carried out
𝑁𝑢𝑛𝑖𝑡𝑛 = no of cell culture cell culture vessels
required for expansion stage n
Similarly in 3D cell culture vessels, the volume of media required is evaluated as follows:
𝑉𝑅𝑖= ∑ 𝐶𝑎𝑝𝑢𝑛𝑖𝑡 × 𝑁𝑒𝑥 × 𝑁𝑢𝑛𝑖𝑡𝑛
𝑖=𝑛
𝑖=1
(2.36)
where 𝑉𝑅𝑖 = is the volume of reagent i required ( cell
culture media)
𝐶𝑎𝑝𝑢𝑛𝑖𝑡 = capacity of cell culture vessels ( working
volume)
𝑁𝑒𝑥 = No of media exchanges carried out
𝑁𝑢𝑛𝑖𝑡𝑛 = No of cell culture cell culture vessels
required for expansion stage n
The number of cell culture vessels required for a particular expansion stage depends on
the number of cells that must be produced and the capacity of the cell culture vessel. In
adherent cell culture where microcarriers are not used, this is calculated as follows:

132
𝑁𝑢𝑛𝑖𝑡𝑛=
𝑁𝑐𝑜𝑢𝑡𝑛
𝐷ℎ𝑎𝑟𝑣𝑒𝑠𝑡
𝐶𝑎𝑝𝑢𝑛𝑖𝑡
(2.37)
where 𝑁𝑢𝑛𝑖𝑡𝑛 = no of cell culture vessels required for
expansion stage n
𝑁𝑐𝑜𝑢𝑡𝑛 = no of cells produced at the end of expansion
stage n
𝐷ℎ𝑎𝑟𝑣𝑒𝑠𝑡 = cell harvest density
𝐶𝑎𝑝𝑢𝑛𝑖𝑡 = capacity of cell culture vessels
When no microcarriers are used, the number Capunit corresponds to the surface area of the
cell culture vessel. If microcarriers in stirred tank bioreactors are used on the other hand,
the Capunit is a function of the concentration of microcarriers added to the stirred tank
bioreactor. The capacity of stirred tank bioreactors for adherent cell expansion is then
given by:
𝑁𝑢𝑛𝑖𝑡𝑛= 𝑉𝑢𝑛𝑖𝑡 × 𝑀𝐶𝑐𝑜𝑛𝑐 × 𝐴𝑀𝑐 (2.38)
where 𝑉𝑢𝑛𝑖𝑡 = working volume of cell culture vessel
𝑀𝐶𝑐𝑜𝑛𝑐 = concentration of microcarriers in the
bioreactor
𝐴𝑀𝑐 = surface area per gram of microcarrier
In suspension cell culture, the number of cell culture vessels required is given as function
of the volume of the cell culture vessel as follows:
𝑁𝑢𝑛𝑖𝑡𝑛=
𝑁𝑐𝑜𝑢𝑡𝑛
𝐶𝑜𝑛𝑐𝑑𝑒𝑠𝑖𝑟𝑒𝑑
𝐶𝑎𝑝𝑢𝑛𝑖𝑡
(2.39)
where 𝑁𝑢𝑛𝑖𝑡𝑛 = no of cell culture vessels required for
expansion stage n

133
𝑁𝑐𝑜𝑢𝑡𝑛 = no of cells produced at the end of
expansion stage n
𝐶𝑜𝑛𝑐𝑑𝑒𝑠𝑖𝑟𝑒𝑑 = desired concentration of cells at the end of
the cell culture process
𝐶𝑎𝑝𝑢𝑛𝑖𝑡 = capacity of cell culture vessels (volume)
Transcription activator-like effector nucleases (TALEN) for genetic modification
The quantities of TALEN reagent used during cell electroporation are given in grams and
are calculated according to the volume of electroporation buffer used:
𝑀𝑅𝑖= 𝑉𝑏𝑢𝑓𝐸𝑙 × 𝐶𝑜𝑛𝑐𝑇𝐴𝐿𝐸𝑁 (2.40)
where 𝑀𝑅𝑖 = mass of reagent i (TALEN) required
𝑉𝑏𝑢𝑓𝐸𝑙 = volume of electroporation buffer
𝐶𝑜𝑛𝑐𝑇𝐴𝐿𝐸𝑁 = concentration of TALEN
2.4.1.2 Consumables
Elutriation disposable set, wash & concentration set, centrifugation tube, magnetic
selection column
The number of sets of consumables used a particular pre or post cell culture step equals
the number of cycles required for that process step:
𝑁𝑐𝑜𝑛𝑗 = 𝑁𝑐𝑦 (2.41)
where 𝑁𝑐𝑜𝑛𝑗 = is the no of units of disposable set j
(Elutriation disposable set, centrifugation
tube, magnetic selection column)
Cell culture vessel
The number of cell culture vessels required per batch has been described in 2.37 - 2.39.

134
Aseptic vials and cryopreservation bags
The number of aseptic vials and cryopreservation bags required per batch is dependent
on the volume per dose and the capacity of the vials/bags:
𝑁𝑐𝑜𝑛𝑗=
𝑉𝑜𝑢𝑡
𝐶𝑎𝑝𝑣/𝑏
(2.42)
where 𝑁𝑐𝑜𝑛𝑗 = no of disposable set j (aseptic vials/
cryopreservation bags)
𝑉𝑜𝑢𝑡 = volume per dose
𝐶𝑎𝑝𝑣/𝑏 = volume per vial/bag
2.4.1.3 Equipment
Dedicated equipment
The list of dedicated equipment includes incubators and dedicated skids for cell culture
vessels. For a particular type of dedicated equipment, the number of equipment units
required within a facility is calculated using the number of cell culture vessels per batch,
the maximum number of cell culture vessels that the equipment can handle and the
number of batches being manufactured in parallel as follows.
𝑁𝑒𝑞𝑢𝑧=
𝑁𝑢𝑛𝑖𝑡
𝐶𝑎𝑝𝑒𝑞𝑢𝑖
× 𝑁𝐵𝑝𝑎𝑟𝑎𝑙𝑙𝑒𝑙 (2.43)
where 𝑁𝑒𝑞𝑢𝑧 = no of units of equipment z
𝑁𝑢𝑛𝑖𝑡 = no of cell culture vessels per batch
𝐶𝑎𝑝𝑒𝑞𝑢𝑧 = no of cell culture vessels which a single unit
of equipment z can hold
𝑁𝐵𝑝𝑎𝑟𝑎𝑙𝑙𝑒𝑙 = no of batches in parallel
Shared equipment

135
Shared equipment includes biosafety cabinets, cell wash and recovery systems, elutriation
systems, magnetic recovery systems, electroporation systems, automated filling units,
controlled rate freezers and shared skids for cell culture vessels. As some of these
technologies are likely to be used in different unit operations throughout the
manufacturing process, and the duration of these unit operations is likely to differ, the
number of units required for shared equipment is calculated as a function of the maximum
time for which the equipment is being used:
𝑁𝑒𝑞𝑢𝑧=
𝑁𝑢𝑛𝑖𝑡
𝐶𝑎𝑝𝑒𝑞𝑢𝑗
×𝑇𝑠𝑀𝐴𝑋
𝑇𝑀𝐴𝑋 × 𝐵𝑝𝑎𝑟𝑎𝑙𝑙𝑒𝑙
(2.44)
where 𝑇𝑠𝑀𝐴𝑋 = duration of the longest unit operation for
which equipment z is used
𝑇𝑀𝐴𝑋 = maximum time allowed for longest unit
operation for which equipment z is used
𝐵𝑝𝑎𝑟𝑎𝑙𝑙𝑒𝑙 = no of batches in parallel
𝐶𝑎𝑝𝑒𝑞𝑢𝑗 = maximum no of cell culture vessel units that
one unit of equipment z can handle
2.4.1.4 Labour
The methods used for estimating the labour requirement for CAR T-cell-based processes
and MSC-based process differ. In CAR T-cell manufacture, the complexity of the labour-
intensive unit operations requires dedicated operators; therefore, the number of operators
is calculated as a function of the number of batches being manufactured in parallel:
𝑁𝑜𝑝 = 𝑁𝑜𝑝/𝑡𝑒𝑎𝑚
𝐶𝑎𝑝𝑡𝑒𝑎𝑚 × 𝑁𝐵𝑝𝑎𝑟𝑎𝑙𝑙𝑒𝑙
(2.45)
where 𝑁𝑜𝑝/𝑡𝑒𝑎𝑚 = no of operators per team of operators
𝑁𝐵𝑝𝑎𝑟𝑎𝑙𝑙𝑒𝑙 = no of batches in parallel

136
𝐶𝑎𝑝𝑡𝑒𝑎𝑚 = maximum no of batches which a team of
operator can process in parallel
In allogeneic MSC-based processes however, less unit operations are required and hence,
operators are able to processes multiple batches in parallel. The number of operators
required is calculated according to the time taken to perform the longest process unit
operation within the manufacturing process and the maximum time allowed per unit
operation:
𝑁𝑜𝑝 = 𝑁𝐵𝑝𝑎𝑟𝑎𝑙𝑙𝑒𝑙 ×𝑇𝑠𝑀𝐴𝑋
𝑇𝑀𝐴𝑋 × 𝑁𝑜𝑝/𝑡𝑒𝑎𝑚
(2.46)
where 𝑁𝑜𝑝/𝑡𝑒𝑎𝑚 = no of operators per team of operators
𝑇𝑠𝑀𝐴𝑋 = duration of the longest unit operation
𝑇𝑀𝐴𝑋 = maximum time allowed per process unit
operation
𝑁𝑜𝑝/𝑡𝑒𝑎𝑚 = no of operators per team of operators
𝑁𝐵𝑝𝑎𝑟𝑎𝑙𝑙𝑒𝑙 = no of batches in parallel
2.4.2 COG
Both indirect and direct costs were considered in this model. The direct costs include QC
materials, transportation costs, reagents and consumables. The indirect costs considered
were equipment and facility depreciation, equipment maintenance, utilities, cleanroom
monitoring, labour costs and gowning costs. The materials costs for QC were assumed to
have a fixed value per batch that depends on whether the process is autologous or
allogeneic. Transportation costs were also assumed to be a fixed costs; this cost however
varies with the distance between the cell therapy production site and the administration
site. The summary of the methods used to compute both direct and indirect costs are
summarised in Table 2.1. Table 2.1 is used to compute the COG of mesenchymal stem
cell-based cell therapies (Chapter 4). This table is later modified (Chapter 5 Table 5.1)

137
to capture additional calculations for costs that are more dominant in autologous CAR T-
cell processes.
Table 2.1 Summary of the methods used to compute COG
Cost category Value
Direct Direct raw materials f (utilization per batch) QC materials f (utilization per batch)
Indirect Depreciation FCI / depreciation period / no batches per year
Facility maintenance 0.1 x FCI / No batches per year
Labour 2.2* x No operators x annual salary /No
batches per year
Cost of goods per batch Direct costs + indirect costs
* The labour cost multiplier (2.2) corresponds to the costs related to management,
supervisors, and quality (QC, QA and QP) labour
2.4.2.1 Direct costs
The total reagents costs were calculated by adding the multiplication of the number of
units of each reagent required by the costs per unit of reagent. For some reagents, the
number of units required is given as a volumetric unit such as buffers, Hespan, NaCl,
nanomatrix, magnetic beads and media. Other reagents such as TALEN® and retronectin
are measured in units of mass. Furthermore, reagents can also be given in terms of
particles used, this is the case of viral vectors. The calculation of the number of units
required for each reagent is shown in equations 2.21 to 2.40.
𝐶𝑟 = ∑ 𝑁𝑢𝑖× 𝐶𝑢𝑖
𝑖0
𝑖𝑛
(2.47)
where 𝐶𝑟 = reagents costs
𝑁𝑢𝑖 = no units of reagent i ( volume, mass,
particles)
𝐶𝑢𝑖 = cost per unit of reagent i

138
The consumables costs were calculated in a similar manner, by multiplying the number
of each consumable set required by the cost per set. The calculations of the number of
units of each consumable set required are shown in equations 2.41 and 2.42.
𝐶𝑐𝑜𝑛 = ∑ 𝑁𝑢𝑗× 𝐶𝑢𝑗
𝑗0
𝑗𝑛
(2.48)
where 𝐶𝑐𝑜𝑛 = consumable costs
𝑁𝑢𝑗 = No units of consumable j
𝐶𝑢𝑗 = cost per unit of consumable j
2.4.2.2 Indirect costs
The equipment costs are also calculated by multiplying the number of units of each type
of equipment by the cost per equipment unit. Given that equipment units can be used
across a number of years, the equipment costs per year must also consider the depreciation
period. The explanation of the calculation of the number of equipment units required can
be found in equations 2.43 and 2.44.
𝐶𝑝𝑒 = ∑ 𝑁𝑢𝑧
× 𝐶𝑢𝑧𝑧0𝑧𝑛
𝑇𝑑𝑒𝑝𝑟𝑒
(2.49)
where 𝐶𝑝𝑒 = main process equipment costs
𝑁𝑈𝑧 = No units of equipment z
𝐶𝑈𝑧 = cost per unit of equipment z
𝑇𝑑𝑒𝑝𝑟𝑒 = depreciation period
In the case study exploring the cost-effectiveness of allogeneic cell therapy products
(Chapter 4), the facility costs were computed using the adjusted “Lang factor” used in
Hassan et al (2015). In the case study described in Chapter 5, the facility costs
characteristic of different CAR T-cell therapy processes were computed using the cost
139
factors described in Section 2.3. The facility depreciation costs per year are calculated by
dividing the total facility costs by the depreciation period.
𝐶𝐹 = 𝐶𝑝𝑒 × 𝐹𝑐
𝑇𝑑𝑒𝑝𝑟𝑒 − 𝐶𝑝𝑒
(2.50)
where 𝐶𝐹 = facility costs
𝐶𝑝𝑒 = main process equipment costs
𝐹𝑐 = cost factor (CAR T-cell therapy); Lang
factor (MSC therapy)
𝑇𝑑𝑒𝑝𝑟𝑒 = depreciation period
The equipment and facility maintenance costs per year are calculated as a function of the
total FCI:
𝐶𝑚𝑎𝑖𝑛𝑡 = (𝐶𝑝𝑒 + 𝐶𝐹) × 𝑟𝑚/𝑒 (2.51)
where 𝐶𝑚𝑎𝑖𝑛𝑡 = equipment and facility maintenance costs
𝐶𝑝𝑒 = main process equipment costs
𝐶𝐹 = facility costs
𝑟𝑚/𝑒 = ratio between equipment costs and
equipment maintenance costs
Labour costs per year are calculated a function of the number of operators required.
𝐶𝑙𝑎𝑏 = 𝑁𝑜𝑝 × 𝑆𝑜𝑝 × 𝑟𝑜ℎ/𝑙𝑎𝑏 (2.52)
where 𝐶𝑙𝑎𝑏 = labour costs
𝑁𝑜𝑝 = number of operators
𝑆𝑜𝑝 = annual operator salary

140
𝑟𝑜ℎ/𝑙𝑎𝑏 = ratio between operator costs and overheads
and supervisory costs
The total costs per batch can then be calculated as:
𝐶𝑂𝐺𝑏𝑎𝑡𝑐ℎ = 𝐶𝑟 + 𝐶𝑐𝑜𝑛 +𝐶𝑝𝑒 + 𝐶𝐹 + 𝐶𝑚𝑎𝑖𝑛𝑡 + 𝐶𝑙𝑎𝑏
𝑁𝐵𝑦𝑒𝑎𝑟
(2.53)
Where 𝐶𝑟 = reagent costs
𝐶𝑐𝑜𝑛 = consumable costs
𝐶𝑝𝑒 = main process equipment depreciation costs
𝐶𝐹 = facility depreciation costs
𝐶𝑚𝑎𝑖𝑛𝑡 = equipment and facility maintenance costs
𝐶𝑙𝑎𝑏 = labour costs
The COG per dose are calculated by dividing the COG per batch by the number of doses
per batch. In autologous cell therapy bioprocessing one dose is produced per batch; hence,
the COG per batch equals the COG per dose.
𝐶𝑂𝐺𝑑𝑜𝑠𝑒 = 𝐶𝑂𝐺𝑏𝑎𝑡𝑐ℎ
𝑁𝐷/𝑏𝑎𝑡𝑐ℎ
(2.54)
Where 𝐶𝑂𝐺𝑑𝑜𝑠𝑒 = COG per dose
𝐶𝑂𝐺𝑏𝑎𝑡𝑐ℎ = COG per batch
𝑁𝐷/𝑏𝑎𝑡𝑐ℎ = no doses per batch
The COG per year can be calculated by multiplying the COG per dose by the number of
doses per year:
𝐶𝑂𝐺𝑦𝑒𝑎𝑟 = 𝐶𝑂𝐺𝑑𝑜𝑠𝑒 × 𝑁𝐷/𝑦𝑒𝑎𝑟 (2.55)
Where 𝐶𝑂𝐺𝑦𝑒𝑎𝑟 = COG per year

141
𝐶𝑂𝐺𝑑𝑜𝑠𝑒 = COG per dose
𝑁𝐷/𝑦𝑒𝑎𝑟 = no doses per year
2.5 Brute force optimization
In order to evaluate rapidly multiple commercialisation scenarios the bioprocess
economics model was coupled with a brute force optimization macro. The brute-force
optimization macro was developed in Visual Basic Application, VBA (Microsoft
Corporation, Redmond, WA). During the simulations, brute-force is used to screen
through all possible demand, dose size, and manufacturing platform solutions in order to
select the manufacturing platform with the lowest COG that meets the conditions set by
the user. The only condition set in this model was that only solutions where the percentage
of the cell culture vessel occupied by cells at the end of the process equals to or exceeds
the minimum occupation limit established by the user would be considered. The brute
force optimization macro is summarised in Figure 2.4.

142
Figure 2.4 Schematic representation of brute force optimization. Brute force optimization searches through all
configurations (X) of the different types of cell culture vessel (i) and checks whether the minimum utilization (Y)
selected by the user is met.
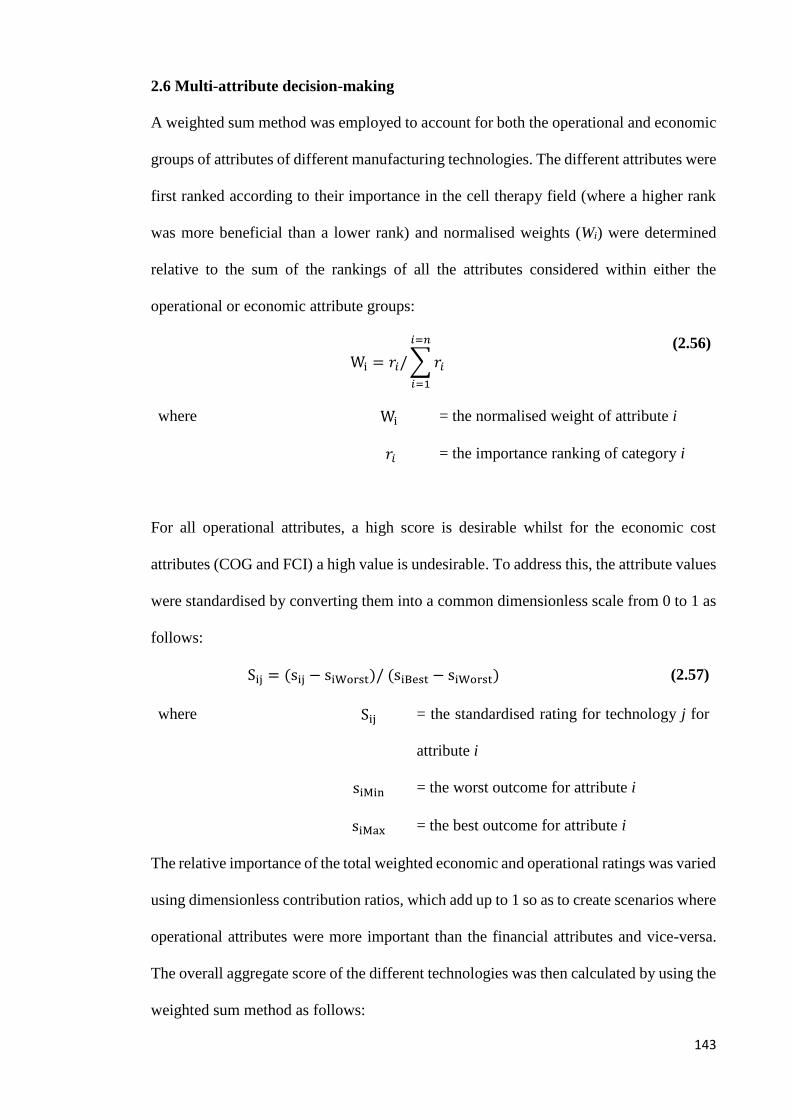
143
2.6 Multi-attribute decision-making
A weighted sum method was employed to account for both the operational and economic
groups of attributes of different manufacturing technologies. The different attributes were
first ranked according to their importance in the cell therapy field (where a higher rank
was more beneficial than a lower rank) and normalised weights (Wi) were determined
relative to the sum of the rankings of all the attributes considered within either the
operational or economic attribute groups:
Wi = 𝑟𝑖/ ∑ 𝑟𝑖
𝑖=𝑛
𝑖=1
(2.56)
where Wi = the normalised weight of attribute i
𝑟𝑖 = the importance ranking of category i
For all operational attributes, a high score is desirable whilst for the economic cost
attributes (COG and FCI) a high value is undesirable. To address this, the attribute values
were standardised by converting them into a common dimensionless scale from 0 to 1 as
follows:
Sij = (sij − siWorst)/ (siBest − siWorst) (2.57)
where Sij = the standardised rating for technology j for
attribute i
siMin = the worst outcome for attribute i
siMax = the best outcome for attribute i
The relative importance of the total weighted economic and operational ratings was varied
using dimensionless contribution ratios, which add up to 1 so as to create scenarios where
operational attributes were more important than the financial attributes and vice-versa.
The overall aggregate score of the different technologies was then calculated by using the
weighted sum method as follows:
144
𝑆𝑎𝑔𝑔𝑟𝑗 = (𝑅𝐶1 × ∑(Sopij
𝑖=𝑛
𝑖=1
Wi )) + (𝑅𝐶2 × ∑(Seconij
𝑖=𝑛
𝑖=1
Wi))
(2.58)
where 𝑆𝑎𝑔𝑔𝑟𝑗 = the aggregate weighted score of technology
j
𝑅𝐶1 = the operational combination ratio
𝑅𝐶2 = the economic combination ratio
2.7 Monte Carlo simulation model
Previous sections (2.3 to 2.5) have described deterministic models, which produce useful
metrics such as FCI and COG without accounting for process variability. Process
variability is a very important parameter to be considered in cell therapy bioprocessing
due to differences in donor characteristics and materials used (Heathman et al. 2015;
Lapinskas 2010; Lopez et al. 2010; Christodoulou et al. 2013). This is even more
important in autologous processes as cells are retrieved from sick donors and each dose
requires a different donor (Mason & Dunnill 2009; Brandenberger et al. 2011).
Stochastic models have previously been employed in assessing the robustness of different
manufacturing platforms for cell therapy bioprocessing (Jenkins et al. 2016). This section
describes a stochastic model which was employed in order evaluate the effect of possible
process-related variability as well as patient-to-patient variability on the robustness of
different manufacturing strategies in autologous and allogeneic cell therapy processing.
The stochastic model developed uses Monte Carlo simulation as this is able to capture the
complexity of cell therapy processes by mimicking the variability of multiple independent
parameters which may affect the robustness of the process. Monte Carlo simulations were
built using @Risk® (Palisade Corporation, Newfiled, NY), and coupled with the
bioprocess economics model. During simulations, multiple independent triangular
distributions of critical process variables such as process yield and patient weight were

145
introduced to the bioprocess economics model. @Risk was then used to perform multiple
iterations of these variables and measure the probability of different events occurring (e.g.
probability of achieving target COG). This same model was employed in estimating the
sensitivity of the desired metrics (e.g. COG) to different process parameters (e.g. process
yield), by individually changing the value of such parameters by ± a selected percentage
and measuring the impact that this change has on the desired parameter.
2.8 Net present value model
The methods described in all previous sections provide useful metrics to distinguish
between manufacturing platforms. However, these do not account for long-term benefits
and/or consequences associated with using a particular manufacturing strategy.
Therefore, an risk-adjusted cash flow model model was developed so as to investigate the
ramifications of different manufacturing strategies over several years. In order to
calculate NPV, a risk-adjusted cash flow model linked to the process economics model
was built using Excel®. The cash flow model captured different elements of the
development and commercialisation of cell therapy products. These elements include: the
commercialisation scenario, running costs, product development costs, facility
preparation costs, capital investment, sales parameters and risks parameters among
others.
The commercialisation scenario elements are set by the user and include factors such as
patient demand, dose size and number of facilities. Manufacturing costs are obtained from
the process economics model described in Section 2.4 according to the manufacturing
platform and cell therapy product selected. The running costs include facility oversight
costs, manufacturing costs, facility insurance costs, facility utilization charge (if product
manufacture is outsourced), sales and marketing and corporate tax. The manufacturing
costs are directly retrieved from the process economics tool.

146
The facility insurance costs per year are a percentage of the total FCI:
𝐶𝐹𝑖 = 𝐹𝐶𝐼 × 𝑟𝐹𝑖/𝐹𝐶𝐼 (2.59)
where 𝐶𝐹𝑖 = facility insurance costs
𝑟𝐹𝑖/𝐹𝐶𝐼 = ratio between facility insurance costs
and FCI
The facility utilization charge is calculated as a function of the total facility costs:
𝐶𝐹𝑢 = (𝐶𝐹𝐷 + 𝐶𝑢 + 𝐶𝑚𝑜𝑛) × 𝑟𝐹𝑢/𝐹𝑐 (2.60)
where 𝐶𝐹𝑢 = facility utilization charge costs
𝐶𝐹𝐷 = facility depreciation costs
𝐶𝑢 = utilities costs
𝐶𝑚𝑜𝑛 = facility monitoring costs
𝑟𝐹𝑢/𝐹𝑐 = ratio between facility utilisation costs
and total facility costs
The sales and marking costs are a function of the total profit before tax
𝐶𝑆𝑀 = 𝑃𝐵𝑇 × 𝑟𝑆𝑀/𝑃𝐵𝑇 (2.61)
where 𝐶𝑆𝑀 = sales and marketing costs
𝑃𝐵𝑇 = profit before tax (revenue – costs )
𝑟𝑆𝑀/𝑃𝐵𝑇 = ratio between sales and marketing
costs and profit before tax
The corporate tax calculation is also based on the profit after tax
𝐶𝐶𝑇 = (𝑃𝐵𝑇 − 𝐶𝑆𝑀) × 𝑟𝑆𝑀/𝑃𝐵𝑇 (2.62)
where 𝐶𝐶𝑇 = corporate tax costs
𝐶𝑆𝑀 = sales and marketing costs

147
𝑟𝑆𝑀/𝑃𝐵𝑇 = ratio between corporate tax costs
and profit before tax
The product development costs include the costs for a three-stage clinical trial process,
process development, technology transfer costs and product stability testing costs. The
total product development costs are calculated as follows:
𝐶𝑝𝑑𝑑 = ∑ ( 𝐶𝑂𝐺/𝑏𝑎𝑡𝑐ℎ𝑝 × 𝑟(
𝐶𝑂𝐺𝐶𝑜ℎ
)𝑝× 𝑁𝑏𝑎𝑡𝑐ℎ𝑝
)
𝑝=3
𝑝=1
+ ∑ 𝐶𝑝𝑐𝑑𝑝
𝑝=3
𝑝=1
+ ∑ 𝐶𝑝𝑠𝑝
𝑝=3
𝑝=1
+ ∑ 𝐶𝑡𝑡𝑝
𝑝=3
𝑝=1
(2.63)
where 𝐶𝑝𝑑𝑑 = product development costs
𝐶𝑂𝐺
/𝑏𝑎𝑡𝑐ℎ𝑝
= COG/batch for clinical trial phase p
𝑟(
𝐶𝑂𝐺𝐶𝑜ℎ
)𝑝 = ratio between clinical trials costs and the
clinical trials overhead costs
𝑁𝑏𝑎𝑡𝑐ℎ𝑝 = No of batches produced for phase p
𝐶𝑝𝑐𝑑𝑝 = process development costs for clinical trials
phase p
𝐶𝑝𝑠𝑝 = product stability testing costs for clinical
trials phase p
𝐶𝑡𝑡𝑝 = technology transfer costs for clinical trials
phase p
The facility prep costs vary with the number of facilities used in the selected
commercialisation scenario. These costs include technology transfer costs, facility
insurance, comparability studies, site license, engineering runs and process performance
qualification (PPQ) batches. The costs for engineering runs and PPQ batches are directly

148
attained from the process economics model. All other costs are attained from the database
incorporated in the integrated bioprocess economics decisional tool. The facility prep
costs are then calculated as follows:
𝐶𝐹𝑝 = (𝐶𝑡𝑡𝑐 + 𝐶𝑐𝑠 + 𝐶𝑠𝑙 + 𝐶𝑒𝑟 + 𝐶𝑃𝑃𝑄 ) × 𝑁𝐹 (2.64)
where 𝐶𝐹𝑠 = facility prep costs
𝐶𝑡𝑡𝑐 = technology transfer costs at commercial
stage
𝐶𝑐𝑠 = comparability studies costs
𝐶𝑠𝑙 = site license costs
𝐶𝑒𝑟 = engineering runs costs
𝐶𝑃𝑃𝑄 = PPQ batches costs
𝑁𝐹 = no of facilities
The annual sales are calculated considering parameters such as the selling price of the
cell therapy product, the sales ramp up over the years and the batch failure rate. The
annual sales are calculated as follows:
𝑆𝑎 = 𝑁𝐷𝑑𝑒𝑠𝑖𝑟𝑒𝑑 × 𝑆𝑃 × 𝑅𝐵𝐹 × 𝑆𝑟𝑎𝑚𝑝 (2.65)
Where 𝑆𝑎 = annual sales
𝑁𝐷𝑑𝑒𝑠𝑖𝑟𝑒𝑑 = desired number of doses per year
𝑆𝑃 = selling price
𝑅𝐵𝐹 = batch failure rate
𝑆𝑟𝑎𝑚𝑝 = sales ramp-up
Risks were also accounted for in this cash flow by adding a R&D risk factor. The NPV
is calculated as follows:
𝑁𝑃𝑉 = −𝐶𝑝𝑑𝑑 − 𝐶𝐹𝑝 − FCI + ∑(−𝑐𝑟 + 𝑆𝑎 ) × (𝑅&𝐷𝑟)𝑌
(1 + 𝑟)𝑌
𝑌=𝑛
𝑌=1
(2.66)

149
Where 𝐶𝑝𝑑𝑑 = product development costs
𝐶𝐹𝑝 = facility prep costs
𝐶𝑂𝐺
𝑦𝑒𝑎𝑟
= COG per year
𝑐𝑟 = running costs
𝑆𝑎 = sales
(𝑅&𝐷𝑟)
𝑌 = yearly R&D risk
𝑟 = discount rate
2.9 Data collection
Multiple parameters are considered in the process economics tool described in this
chapter. Some of these parameters are selected by the user, others were set as default
values derived from the following methods: historical data from the UCL Decisional
Tools Research Group, extensive literature review and discussions with vendors, industry
and academic experts. For the fixed capital investment case study described in Chapter
3, the data collected was obtained from literature review and reinforced through
discussions with design consultant experts (Andrew Besso and Paul Dempsey from
eXmoor pharma concepts, Bristol, UK). Although an extensive database was available
in the UCL Decisional Tools Research Group for the MSC case study described in
Chapter 4, additional data was still required as well as updates to the current data in the
database as the cell therapy field is under continuous development. This data was attained
through discussions with industry experts such as Matthieu Egloff (OUAT! Life Sciences,
Brussels, Belgium), Fabien Moncaubeig BIP-partners (Cugnaux, France), Thierry Bovy
( Promethera Biosciences, Louvain-la-Neuve), Greg Rusotti (Celgene, New Jersey, US
), Reinout Hesselink from eXmoor pharma concepts (Bristol, UK), Patrick Stragier
(Masthercel, Charleroi, Belgium), Philippe Willemsen (Promethera Biosciences,
Louvain-la-Neuve), Ohad Karneli (ATVIO biotechnology, Nesher, Israel), Claudia
Lobato da Silva (IBET, Lisbon, Portugal), Jon A Rowley (Roosterbio, Frederick, MD ,

150
US), Farlan Veraitch (UCL, London, UK), Bruce Levine (University of Pennsylvania,
PA, USA). Additional to literature review, discussions with industry and academic
experts were also required to build the set of assumptions used for the CAR T-cell case
study in Chapter 5. These included Fabien Moncaubeig (BIP-partners, Cugnaux,
France), Thierry Bovy (Promethera Biosciences, Louvain-la-Neuve), Bruce Levine
(University of Pennsylvania, PA, USA), Reinout Hesselink (eXmoor pharma concepts,
Bristol, UK), Tom Breiva and Greg Rusotti (Celgene, New Jersey, US ), Jim Faulkner
(Autolus, London, UK) and Clive Glover (Pall Life Sciences, Brussels, Belgium),
Romain du Hecquet de Rauville (MaSTherCell, Brussels, Belgium) and Yajin Ni, Ronald
Fedechko and Mark Leonard (Pfizer, South San Francisco, CA, USA).
2.10 Conclusions
This chapter has highlighted the key features of the advanced decisional tool used in
Chapters 3-5 to provide insights to critical questions facing cell therapy developers. In
Chapter 3, the FCI model will used provide a short-cut method for the evaluation of FCI
and facility footprint for bespoke cell therapy facilities considering project-specific
parameters such as technology selection, commercialisation scenario and facility
location. Chapter 4 the process economics model is used in combination with the brute-
force optimization macro, the MADM model and the Monte Carlo model, in order to
provide a holistic approach to assess the operational and economic features of different
technologies for MSC expansion. The process economics model is also used in Chapter
5. This time however, this model is coupled with the risk-adjusted cash flow model in
order to evaluate the long-term economic benefit of different aspects of different
strategies for CAR T-cell manufacture.

151
Chapter 3: A novel Method for Estimating Facility Footprint and
FCI
3.1 Introduction
Chapter 1 described the traditional method for calculating fixed capital investment (FCI)
for biotech facilities. This is called the “Lang factor” method where a number is
multiplied by the total equipment purchase costs (TEPC) (including utility costs) to
provide the total FCI. This number will vary from 3.63 to 4.74 depending on the product
being manufactured for chemical facilities (Lang 1948) and 4-8 for biopharmaceutical
protein facilities (Novais et al. 2001). Chapter 1 highlighted also some of the key
characteristics of cell therapy facilities and how these are likely to differ from traditional
biotech facilities. Such differences include lower space for clean utilities, as sterilization
in place (SIP) and cleaning in place (CIP) operations are reduced due to the use of single-
use technologies (Rogge et al. 2015; Barak & Bader 2008; Levine et al. 2012; Rayner
2010; Haigney 2016; Tiene 2016; Flaherty & Perrone 2012). Moreover, Chapter 1
underlined the importance of investigating the suitability of the current “Lang factor”
method for evaluating the FCI of different cell therapy facilities, by highlighting the
unique features of the different technologies for cell therapy manufacture currently
available on the market. This chapter uses the fixed capital investment model described
in Chapter 2 (Section 2.3) to provide detailed factorial methodology for estimating FCI
and footprint for bespoke cell therapy facilities. This method is employed in evaluating
FCI in Chapter 5.
3.2 Case study setup
The aim of this case study was to first validate the detailed model for FCI and facility
footprint evaluation described in the Chapter 2 (Section 2.3). The model was used to

152
help understand the trends in FCI and facility footprint for cell therapy manufacturing
processes using different combinations of technologies referred to as manufacturing
platforms with the aim of deriving benchmark correlations for project-specific short-cut
FCI and facility footprint estimation.
3.2.1 Validation of the detailed factorial methodology for estimating FCI and
footprint for bespoke cell therapy facilities
The FCI and facility footprint model was validated in order to increase the confidence in
the results attained using the short-cut method for FCI and facility footprint evaluation.
This was done by comparing the FCI and facility footprint results attained with the model
described in Chapter 2 (Section 2.3) against the values provided by eXmoor Pharma
concepts Ltd (Bristol, UK) for the same scenario. The scenario selected for this
comparison was of an allogeneic MSC-based cell therapy process using automated cell
factories for cell expansion and a fluidised bed centrifuge (FBC) for wash and recovery.
The equipment list established for this scenario included biosafety cabinets (BSCs),
multilayer flask incubators (MLINC), 40-layer flask incubators (INC40), automated
multilayer manipulators (AMLFM) and FBCs. The number of BSCs, MLINCs, INC40s,
AMLFMs and FBCs modelled in this scenario were 4, 2, 5, 2 and 1 respectively.
3.2.2 Capital investment and facility footprint for cell therapy facilities
The model was set to evaluate facility footprint and FCI of hypothetical cell therapy
facilities using different technologies were first evaluated across annual demands ranging
from 500 patients per year to 10,000 patients per year. The study was then extended to
help understand the relationships between technology selection, annual demand, FCI and
facility footprint. The understanding of these relationships was strengthened by the
identification of key parameters contributing towards facility footprint and FCI.

153
3.2.3 Estimating project-specific cost factor
FCI estimates may vary with geographic location. Therefore, the cost factors for FCI
estimation were adjusted by multiplying these by geographic location factors. The
geographic location factors were estimated according to the degree of economic
development of the geographic regions being considered. For example for regions with
relatively low economic development (e.g. Mexico and India), this factor was assumed to
be 0.85. For regions with medium economic development such as the Gulf Coast of the
US, this value was assumed to be 1, and for sites with high economic development such
as Western Europe and the West Coast of the US this value was assumed to be 1.25
(Coulson & Richardson 2005). Moreover, project requirements may also vary according
to the condition of the construction site. Facilities maybe built on a greenfield site,
brownfield site or an existing facility maybe refurbished to allow for cell therapy
manufacture. In scenarios where facilities are to be built on a brownfield site, it was
assumed that no yard improvements were required, hence these costs were removed. In
scenarios where a facility was to be refurbished (i.e. an existing shell is available), it was
assumed that the land costs, yard improvements and shell costs were null, so that the
facility shell was rented and refurbished.
3.2.4 Process overview
In order to evaluate the trends in FCI and facility footprint for cell therapy facilities with
the aim of deriving project-specific cost and area factors, multiple hypothetical facilities
for autologous and allogeneic cell therapy manufacture were modelled. The unit
operations carried out within these hypothetical facilities were pre-cell culture steps (e.g.
cell activation), cell culture, downstream process and formulation and fill.
The allogeneic process modelled in this case study was based on a 21day-long process
for the manufacture of mesenchymal stem cells (MSCs). This process is described in
detail Chapter 4 and the autologous process modelled was based on the manufacturing

154
process of a lentivirus-based chimeric antigen receptor T-cell (CAR T-cell) process
lasting 13 days (described in detail in Chapter 5).
For facilities manufacturing autologous CAR T-cells, it was assumed that the number of
product manufacture rooms was dependent on the manufacturing platform being used and
proportional to the number of processes being manufactured in parallel. For facilities
producing allogeneic MSC-based products on the other hand, it was assumed that the
starting material was retrieved from a frozen cell bank and therefore an inoculation stage
using T-flasks in biosafety cabinets surrounded by a Grade B cleanroom was required.
Moreover, in these facilities it was also assumed that the product manufacture area was
divided into four main suites: inoculation room, cell culture room, DSP room and
formulation and fill room.
3.2.5 Key assumptions
The dose size of both autologous and allogeneic cell therapy products manufactured
within the facilities modelled in this case study was assumed to be 100M cells. It was
assumed also that these facilities were built on a greenfield site in a medium economically
developed area and that they were active for 335 days per year.
The majority of the manufacturing platforms considered in this article allow for
functionally closed processes, which can be carried out in a Grade C cleanroom. This
trend excludes multilayer flasks for autologous CAR T-cell therapy manufacture, as these
require multiple open steps throughout the manufacturing process, and hence must be
operated in biosafety cabinets surrounded by Grade B processing cleanrooms. The
characteristics of the technologies combined together to form the different manufacturing
platforms are summarized on Table 3.1. All other cost and footprint assumptions used in
this case study are summarised on Table 3.2.

155
Table 3.1 Key characteristics of the manufacturing platforms studied in the FCI and facility footprint case study
Donor
type
Manufacturing platform Abbreviation Technologies
requireda
Max no batches/
cleanroom
Max capacity/unit
(no doses in
parallel)b
Costs/unit ($) Footprint/unit
(m2)c
Allogeneic Multilayer flasks MLF BSC; MLINC;
INC40; AMLFM;
FBC
NA 500; 31; 164; 28;
10,000
12,800; 13,440;
198,016;
482,560;
261,162
1; 0.46; 2.9;
2.3;0.77
Multi-plate bioreactor MPB BSC; MLINC;
MPBC; FBC
NA 500; 9-64 ; 1-32
;10,000
12,800; 56,000;
261,162
1; 0.46; 0.2; 0.77
Hollow fibre bioreactor HFB BSC; HFB; FBC NA 500; 5; 10,000 12,800; 150,000;
261,162
1; 0.3; 0.77
Stirred tank bioreactor STR BSC; STR; FBC NA 500; 1-2,898; 10,000 12,800; 35,584-
291,886;
261,162
1; 0.87-4.2; 0.77
Autologous Multilayer flasks with open
steps
MLF (open) BSC; MLINC;
SMF
1 2; 5; 2 12,800; 13,440;
79,429
1; 0.46; 0.35
Static suspension bags SSB MLINC; SMF 5 5; 2 13,440; 79,429 0.46; 0.35 Integrated USP/DSP platform INT INT 20 1; 235,500 0.38 Rocking motion bioreactor RMB MLINC; RMB;
SMF
10 5;1;2 13,440; 47,500;
79,429
0.46;0.22; 0.35
a main process equipment required where: BSC = biosafety cabinet; MLINC = multilayer flask incubator; INC40 = 40-layer flask incubator; AMLFM =
automated multilayer flask manipulator; FBC= fluidised bed centrifuge; MPBC = multi-plate bioreactor controller; HFB = hollow fibre bioreactor; STR =
stirred tank bioreactor (w microcarriers); SMF = spinning membrane filtration unit; INT = integrated USP/DSP platform; RMB = rocking motion
bioreactor. For allogenic processes, this capacity is calculated under the assumption that a harvest density of 45,000 cells/cm2 was achieved and that
microcarier-based processes offer 5,540 cm2/L. b number of doses of 100M cells which can be produced using each technology. For MPB multiple bioreactor sizes were considered (with 10 plates. 50
plates, 100 plates and 200 plates), these bioreactors use the same controller, hence a range in capacity is seen. In STR a range in the capacity of the
bioreactor is also seen as multiple bioreactor sizes were also considered (1L, 5L, 10L, 20L, 50L, 100L, 500L, 1,000L and 2,000L). c For equipment with large volumes ( STR 100L, STR 500L, STR 1,000L and STR 2,000L), footprint includes auxiliary equipment (e.g. holding tanks for media and harvest)

156
Table 3.2 Key case study assumptions for FCI and facility footprint evaluation
Parameter Value Unit
Dose size 100M cells/dose
No batches per year (allogeneic) 20 batches/year
Equipment area/ product manufacture
areaa 0.163 -
Material airlock footprintb 6 m2
Personnel airlock footprintb 6 m2
No QC labs/ facility 1 -
Process support equipment costsb 2,389 $/m2 of cleanroom
Logistics equipment costsb 548 $/m2 of cleanroom
EMS central unitb 108,800 $/unit
Probe costsb 1,920 $/sampling point
Equipment installation costsc 1,920 $/unit
Building shell costsb 548 $/m2
Fit-out costs (Grade B)b 8,320 $/m2
Fit-out costs (Grade C)b 6,106 $/m2
Fit-out costs (Grade D)b 5,082 $/m2
Fit-out costs (CNC)b 1,741 $/m2
Fit-out costs (unclassified)b 64 $/m2
Contractor feesb 12% of fit-out costs
Land costsd 6% of shell costs
Yard improvement costsd 10% of shell costs
Engineering, management and consultant
feesb 20% of direct costs
Contingency costsb 20%
of (direct costs + Engineering,
management and consultants
fees)
EMS = environment monitoring systems; CNC = controlled and non-classified aDerived from floorplans of different cell therapy facilities bDerived from materials provided by and personal contact with Andrew Besso and Paul
Dempsey (eXmoor pharma concepts, Bristol, UK) cDerived from personal contact with Eric Matthieu (MaSTherCell, Gosseles, Belgium) d(Peters & Timmerhaus 1991)

157
Table 3.3 Ratio between the footprint of the different sections within a facility and the
footprint of the product manufacture area
Facility section Area/Product manufacture area
Product manufacture 1.000
Clean change 1 0.105
Clean change 2 0.147
Clean corridors 0.322
Clean Janitor 0.042
QC labs 0.650
Microbiology lab 0.301
Labs corridor 0.273
PCR room 0.294
Janitor 0.042
Waste corridor 0.804
Waste change 0.042
Waste treatment 0.168
Logistics 1.077
Offices 3.147
Meeting rooms 0.105
Stairs 0.231
Cold rooms 0.168
Janitor 0.042
General corridor 0.399
Lorry/Van loading docks 0.224
Reception 0.538
WC 0.392
Plant level 4.755
The ratios between the cleanroom area and the footprint of all other sections within a facility were
derived materials provided by and personal contact with Andrew Besso and Paul Dempsey
(eXmoor pharma concepts, Bristol, UK)

158
Table 3.4 List of equipment required per QC lab and their unit costs
3.3 Results and discussion
This section provides a summary of the key results attained throughout this case study.
The case study started with the validation of the FCI model described in Chapter 2
(Section 2.3). The analysis was extended to investigate the relationship between
technology selection, FCI, annual demand and facility footprint. This allowed for the
generation of project-specific factors for FCI and facility footprint calculation.
3.3.1 Validating the fixed capital investment model
In order to validate the FCI and facility footprint predictions generated by the FCI and
facility footprint model, these were compared with values kindly provided by eXmoor
Equipment Costs ($/unit)
Balance (200g) 2,408
Cell Counter 2,816
CO2 incubator 13,440
ELISA/Spectrophotometer 51,200
Endotoxin Test 12,800
FACS 128,000
Filter Integrity Tester 12,800
FTIR 8,658
Gel Analysis Instrument 1,920
HPLC 64,000
Isolator, Grade A with VHP 153,600
Microscope 12,160
MSCII 12,800
Osmometer 16,698
PCR 57,600
PCR Hood – mini LAF for PCR amplification 12,800
pH Meter 1,039
Plate Reader 6,221
Power Packs 1,007
Peristaltic Pump 1,386
Sterility Test 153,600
Turbidity Meter 963
ELISA = enzyme-linked immunosorbent assay; FACS = fluorescence-activated cell sorting; FTIR
= Fourier-transform infrared spectroscopy; HPLC = high performance liquid chromatography; VHP
= vapour hydrogen peroxide; MSCII = class II microbial safety cabinet; PCR = polymerase chain
reaction
The list of typical QC equipment in a cell therapy facility was derived through discussions with lab
scientists and industrial experts. The individual equipment costs were obtained from vendor
websites.

159
Pharma concepts for the same scenario. This comparison is shown in Figure 3.1. Figure
3.1 illustrates a good agreement in the estimates of facility footprint (-3%) and FCI costs
(+3%) when comparing the results provided by eXmoor Pharma concepts and those
generated by the FCI and facility footprint model. The small difference in facility
footprint can be explained by differences in ratios used to compute the total facility
footprint (shown in Table 3.3).
Figure 3.1 Comparison between results attained using the FCI model and those provided
by eXmoor Pharma Concepts for a) facility footprint and b) FCI.

160
The key factors causing differences in the FCI predictions are the QC equipment costs
(+455%) and EMS costs (-23%). The difference in QC equipment costs is attributed to
the fact that the list of QC equipment included in the FCI model (Table 3.4) comprises
additional equipment that was not included in the analysis carried out by eXmoor Pharma
concepts. Moreover, in the FCI model, it was assumed that a single environmental
monitoring probe per measurement (humidity, pressure and temperature) is required in
each manufacturing suite. This may not ways be the case. Hence, the difference in EMS
costs can be attributed to differences in the number of environment monitoring probes
used.
3.3.2 Trends in facility footprint and capital investment for different manufacturing
platforms
As previously highlighted Chapter 1 (Section 1.5) and in Table 3.1, there are a number
of different technologies available on the market for the commercial scale manufacture
of cell therapy products. These technologies have different features therefore, when
selecting a platform for cell therapy manufacture, it is important to understand the effect
that this may have on the FCI and facility footprint. The effect of manufacturing platform
selection on the relationship between FCI and facility footprint of cell therapy facilities
with increasing demand was investigated in Figure 3.2. Figure 3.2 a shows that
autologous processes require higher footprints than allogeneic processes. This is an
expected trend since autologous products require a scale-out manufacturing model as
samples from different patients cannot be mixed. Allogeneic processes on the other hand
benefit from the use of a scale-up approach to product manufacture, thus rapidly
decreasing the facility footprint.
Figure 3.2 a also indicates that for allogenic cell therapies, the manufacturing platform
with the highest footprint is the multilayer flasks followed by the hollow fibre bioreactor.
The manufacturing platform with the lowest facility footprint alternates between the

161
multi-plate bioreactor and the stirred tank bioreactor depending on the commercialisation
scenario.
Multilayer flasks have the highest footprint across all manufacturing platforms. This is
due to the fact that specific incubators (INC40) and automation (AMLFM) are employed
for incubation and manipulation of larger multilayer flasks. These technologies have
relatively high footprints (INC40: 2.3m2; AMLFM: 2.9 m2), thus, increasing the facility
footprint for processes employing multilayer flasks.
Hollow fibre bioreactors have the second highest footprint across all platforms for
allogeneic cell therapy manufacture featured in this article. Given the dose size selected
for this study (100M cells), a single hollow fibre bioreactor is capable of producing 5
doses per batch. As the annual demand moves from 500 to 10,000 doses per year, the
batch size increases from 25 to 500 doses. Therefore, as the number annual demand
increases so does the number of hollow fibre bioreactors in parallel, increasing the facility
footprint.
The manufacturing platform with the lowest footprint alternates between the multi-plate
bioreactor and the stirred tank bioreactor. A single multi-plate bioreactor has a lower
footprint than a stirred tank bioreactor (Table 3.1) and is able to process up to 64 doses
of 100M cells. Therefore, at smaller annual demands, where a single multi-plate
bioreactor is required per batch, this platform offers a lower facility footprint than stirred
tank bioreactors. As the annual demand increases to 10,000 doses, multiple multi-plate
bioreactors are required in parallel to meet the batch size of 500 doses. As a single stirred
tank bioreactor can manufacture up to 2,898 doses per batch (Table 3.1), these become
the platform with the lowest facility footprint.
Figure 3.2 a also demonstrates that for autologous manufacturing platforms, multilayer
flasks are again the manufacturing platform with the highest facility footprint, followed

162
by the rocking motion bioreactor, the static suspension bags and the integrated USP/DSP
platform. As autologous processes operate at a relatively small scale, automated
manipulator and large incubators are not used in combination with multilayer flasks. The
relatively high facility footprint seen for these cell culture vessels in autologous
processing is attributed to the use of biosafety cabinets (BSCs) required for open
processing.
The rocking motion bioreactor has the second highest footprint. This is caused by two
factors: 1) a rocking motion platform is required per batch and 2) incubators are used
during the pre-cell culture steps as these are carried out in static suspension bags (SSBs)
as described in Chapter 4. In the static suspension bags manufacturing platform, no
dedicated equipment is required as all equipment used is shared across different batches
manufactured in parallel, reducing the facility footprint. When using the integrated
USP/DSP platform, a dedicated platform is also required per batch. However, this is an
“all-in-one” platform, with relatively low footprint (Table 3.1).
Figure 3.2 b highlights that similarly to the trends seen for facility footprint, FCI is higher
for autologous processes versus allogeneic processes. However, the manufacturing
platforms rank differently in FCI and facility footprint. Figure 3.2 b shows that the
allogeneic manufacturing platform with the highest FCI is the hollow fibre bioreactor
followed by multilayer flasks, and that the platform with the lowest FCI alternates
between multi-plate bioreactor and the stirred tank bioreactor.
The hollow fibre bioreactor has the highest FCI due to a combination of poor scalability
and relatively high equipment costs ($150,000/unit) (Table 3.1). Multilayer flasks have
the second highest FCI due to the requirement of INC40s and AMLFMs. These
technologies not only have high equipment costs (INC40 = $198,016; AMLFM =

163
$482,560), but also increase the facility footprint (as seen in Figure 3.2 a), increasing the
building shell and fit-out costs as well as land and yard improvements costs.
Similar trends are seen in the ranking for FCI and facility footprint for stirred tank
bioreactors and multi-plate bioreactors, where at lower annual demands multi-plate
bioreactors have the lowest FCI. As the annual demand increases, increasing the number
of multi-plate bioreactors per batch, stirred-tank bioreactors become the manufacturing
platform with the lowest FCI.
As for autologous platforms, Figure 3.2 b shows that multilayer flasks have the highest
FCI followed by the integrated USP/DSP platform, rocking motion bioreactor and static
suspension bags. Multilayer flasks have the highest FCI due the use of BSCs in Grade B
cleanrooms which causes all cleanroom-dependent costs (e.g. building shell costs, fit-out
costs etc.) to increase. The integrated USP/DSP platform has relatively high FCI due to
fact that a dedicated platform with relatively high equipment costs ($235,500/unit) is
required per batch.
Despite the fact that the rocking motion bioreactor was shown to be the platform for
autologous cell therapy manufacture with the second highest facility footprint (Figure
3.2 a), the equipment costs associated with the platform are relatively low, allowing this
platform to have the second lowest FCI. Moreover, static suspension bags have the lowest
FCI due to the fact that these only required shared equipment with relatively low costs.

164
Figure 3.2 a) Facility footprint b) FCI with increasing annual demand for different manufacturing platforms. The unit operations
included in the allogenic platforms were inoculation, cell culture and wash and volume reduction while the unit operations included
in the autologous platforms were cell wash, cell activation, viral transduction, cell culture and wash and volume reduction. For
allogenic processes a harvest density of 45,000 cells/m2 for all platforms and surface area/L for microcarier-based platforms of
5,540cm2/L were assumed . For autologous processes a maximum cell density for cell culture was 7 × 10⁶ cells/ml was assumed.
The abbreviations indicate the name of the different manufacturing platforms: MLF = multilayer flask; MPB = multi-plate
bioreactor; HFB = hollow fibre bioreactor; STR = stirred tank bioreactor; MLF (open) = multilayer flask with open steps; SSB =
static suspension bag; INT = integrated USP/DSP platform; RMB = rocking motion bioreactor.

165
3.3.3 Relationship between capital investment and facility footprint
Figure 3.2 has revealed that cell therapy facilities using different manufacturing
platforms have different facility footprints and FCI. This section will establish the
relationship between facility footprint and FCI across multiple manufacturing platforms
in order to draw general relationships between FCI, facility footprint and technology
selection.
Figure 3.3 a shows a linear relationship between FCI and facility footprint across all
manufacturing platforms. However, the slope of this relationship changes significantly
across manufacturing platforms, indicating that some manufacturing platforms have
higher FCI per m2 of facility footprint than others. In allogeneic facilities, this slope
ranges between 7,000 $/m2 (multilayer flasks) to 13,000 $/m2 (hollow fibre bioreactor).
Similarly, in autologous facilities, FCI per m2 ranges between 8,200 $/m2 (multilayer
flasks) to 16,000 $/m2 (integrated USP/DSP platforms). For the allogeneic processes, the
manufacturing platform with the highest FCI per m2 is the hollow fibre bioreactor
platform (13,000 $/m2) followed by the multi-plate bioreactor platform (9,500 $/m2), the
stirred tank bioreactor platform (8,000 $/m2) and finally the multilayer flasks platform
(7,500 $/m2).
Hollow fibre bioreactors have a relatively high FCI per m2 due the combination of low
capacity and high equipment costs as previously explained. Although both multi-plate
bioreactors and stirred tank bioreactors have relatively low FCI (Figure 3.2 b), these
platforms also have low facility footprints increasing the FCI: facility footprint ratio.
Moreover, even though the multilayer flasks have the second highest FCI across all
platforms for allogeneic cell therapy manufacture (Figure 3.2 b), this platform has
significantly high facility footprint (Figure 3.2 a), decreasing the FCI: facility footprint
ratio.

166
For autologous processes, Figure 3.3 a shows that the manufacturing platform with the
highest FCI per m2 is the integrated USP/DSP platform (15,000 $/m2) followed by the
rocking motion bioreactor (8,500 $/m2), the static suspension bag (8,400 $/m2) and finally
the multilayer flasks platform (8,300 $/m2). The relatively high FCI per m2 seen when
Figure 3.3 a) Relationship between FCI and facility footprint across multiple
manufacturing platforms. b) Relationship between FCI per m2 of facility and facility
footprint across multiple manufacturing platforms. The unit operations included in the
allogenic platforms were inoculation, cell culture and wash and volume reduction while
the unit operations included in the autologous platforms were cell wash, cell activation,
viral transduction, cell culture and wash and volume reduction. For allogenic processes a
harvest density of 45,000 cells/cm2 for all platforms and surface area/L for microcarier-
based platforms of 5,540 cm2/L were assumed . For autologous processes a maximum
cell density for cell culture was 7 × 10⁶ cells/ml was assumed. The abbreviations indicate
the name of the different manufacturing platforms: MLF = multilayer flask; MPB = multi-
plate bioreactor; HFB = hollow fibre bioreactor; STR = stirred tank bioreactor; MLF
(open) = multilayer flask with open steps; SSB = static suspension bag; INT = integrated
USP/DSP platform; RMB = rocking motion bioreactor.

167
using the integrated USP/DSP platform is attributed to high equipment costs previously
highlighted. Rocking motion bioreactor and static suspension bags offer lower FCI per
m2 due relatively low FCI associated with this platforms. Similar to the trends seen for
allogeneic processes, even though multilayer flasks have the highest FCI (Figure 3.3 b),
they also have the highest facility footprint across all manufacturing platforms for
autologous cell therapy manufacture considered in this case study, which reduced the FCI
per m2.
Figure 3.3 b shows the relationship between FCI per m2 of facility and facility footprint.
This figure shows that for allogeneic processes, FCI per m2 decreases with increasing
facility footprint across all manufacturing platforms but for autologous processes, this
ratio remains constant. This is due to the economies of scale achieved in allogeneic
processes as a result of a scale-up approach to cell therapy manufacture which allows for
fixed overhead costs (e.g. EMS and QC costs) to be spread over a higher number of doses.
3.3.4 Key factors influencing the fixed capital investment and footprint of cell
therapy facilities
As previously mentioned Chapter 1 (Section 1.7), the layout of cell therapy facilities is
likely to differ from traditional biotechnology. This section highlights the key features of
the facility layout of cell therapy facilities and identify the major factors contributing to
FCI. Figure 3.4 illustrates the relationship between the different sections within the
product manufacture floor of a cell therapy facility, by showing the detailed facility
floorplan used as the basis to evaluate the ratios provided in Table 3.3. Even though the
plat area is not shown in Figure 3.4 since it was assumed to be in a different floor, this is
the section within the facility with the highest footprint. The section with the second
highest footprint is the office space, this is also not clear from Figure 3.4, as this space
was split across two different levels.
168
Figure 3.5 shows that the cost drivers affecting the FCI vary across the different
manufacturing platforms. For allogeneic processes, when the annual demand is of 500
doses per year, the key direct cost drivers across most manufacturing platforms are
building fit-out costs followed by process equipment costs and QC equipment costs. The
effect of the core equipment costs on the hollow fibre bioreactor is higher than for other
manufacturing platforms due to a combination of high equipment costs and low capacity
as previously discussed. As the annual demand increases to 10,000 doses, economies of
scale allow for overhead costs (EMS and QC costs) to be spread over a higher number of
batches, reducing the relative contribution of these costs.
In autologous processes at 500 doses per year, for most manufacturing platforms, the
building fit-out costs are the key direct cost driver followed by process equipment costs
and the facility shell costs. This trend excludes the integrated USP/DSP platform due to
the significantly higher core equipment costs associated with this platform. Increasing the
annual demand to 10,000 has no significant effect on these trends due to the scale-out
approach applied in autologous cell therapy manufacture.
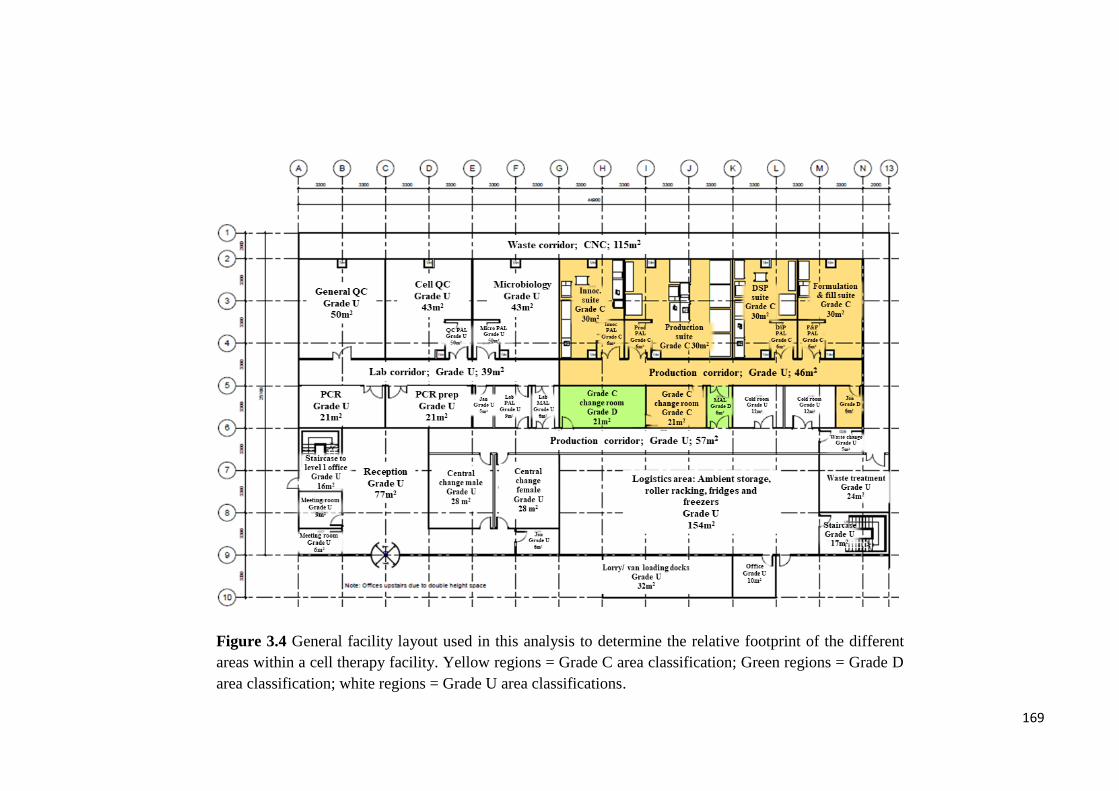
169
Figure 3.4 General facility layout used in this analysis to determine the relative footprint of the different
areas within a cell therapy facility. Yellow regions = Grade C area classification; Green regions = Grade D
area classification; white regions = Grade U area classifications.

170
3.3.5 Evaluating costs and area factors
Figure 3.2 and Figure 3.3 have shown that different manufacturing platforms require
very different facility footprints and FCI and that the relationship between FCI and facility
footprint may vary with annual demand. Therefore, costs and area factors were derived
in order to provide short-cut methods to evaluate footprint and FCI for bespoke cell
therapy facilities. This is shown in Figure 3.6. A detailed breakdown of the different
factors contributing to the overall cost factor across the different manufacturing platforms
can be found in Table 3.5.
Figure 3.6 a shows an inverse relationship between the cost factors and the area factors
where manufacturing platforms with the highest area factors (i.e. highest core equipment
costs per m2) (e.g. hollow fibre bioreactors and integrated USP/DSP platforms) have the
lowest cost factors (i.e lowest ratio between FCI and core equipment costs) and vice versa.
Figure 3.5 Contribution of the different factors towards the FCI for a dose size of 100M
cells and annual demands of 500 and 10,000 doses per year. The abbreviations indicate
the name of the different manufacturing platforms: MLF = multilayer flask; MPB =
multi-plate bioreactor; HFB = hollow fibre bioreactor; STR = stirred tank bioreactor;
MLF (open) = multilayer flask with open steps; SSB = static suspension bag; INT =
integrated USP/DSP platform; RMB = rocking motion bioreactor.
171
This figure also shows that annual demand has an impact on FCI and facility footprint of
allogeneic processes but not on autologous processes due to the economies of scale
achieved with allogeneic processes as previously discussed. Moreover, Figure 3.6 a
shows that for allogenic processes, area factors range between 950 (stirred tank
bioreactor) and 5,400 (hollow fibre bioreactor) and cost factors range from 2.3 (hollow
fibre bioreactor) and 8.3 (stirred tank bioreactor). Similar trends are seen for autologous
processes as area factors range between 980 (multilayer flasks) and 6,500 (integrated
USP/DSP platform) and cost factors vary from 2.3 (integrated USP/DSP platform) and
8.5 (multilayer flasks).
As Figure 3.6 a highlighted that the cost and area factors are sensitive to annual demand
in allogeneic processes, Figure 3.6 b was generated to illustrate the process of selecting
the adequate cost and area factor from Figure 3.6 a taking into account the manufacturing
platform used and the target annual demand.

172
Table 3.5 Cost factor breakdown for different hypothetical cell therapy facilities producing 5,000 doses per year
Items Allogeneic Autologous
MLF MPB HFB STR MLF (open) SSB INT RMB
𝑓1 Main process equipment 1.00 1.00 1.00 1.00 1.00 1.00 1.00 1.00
𝑓2 Process support equipment 0.10 0.11 0.03 0.15 0.23 0.09 0.02 0.08
𝑓3 QC equipment 0.12 0.56 0.05 0.79 0.07 0.09 0.02 0.04
𝑓4 Logistics equipment 0.02 0.03 0.01 0.04 0.05 0.02 0.01 0.02
𝑓5 EMS 0.03 0.16 0.01 0.22 0.02 0.02 0.00 0.01
𝑓6 Equipment installation 0.01 0.04 0.01 0.02 0.05 0.03 0.01 0.04
𝑓7 Shell costs 0.34 0.39 0.11 0.55 0.79 0.32 0.08 0.27
𝑓8 Fit-out costs 1.23 1.50 0.39 2.10 2.97 1.16 0.28 0.96
𝑓9 Contractor fees 0.15 0.18 0.05 0.25 0.36 0.14 0.03 0.12
𝑓10 Land costs Greenfield & Brownfield 0.02 0.02 0.01 0.03 0.05 0.02 0.00 0.02
𝑓11 Yard improvements Greenfield 0.03 0.04 0.01 0.05 0.08 0.03 0.01 0.03
𝑓12 Engineering, management and consultant fees
Greenfield 0.61 0.81 0.34 1.04 1.13 0.58 0.29 0.52
Brownfield 0.61 0.80 0.33 1.03 1.12 0.58 0.29 0.51
Refurbishment 0.60 0.79 0.33 1.03 1.11 0.57 0.29 0.51
𝑓13 Contingency
Greenfield 0.73 0.97 0.40 1.25 1.36 0.70 0.35 0.62
Brownfield 0.73 0.96 0.40 1.24 1.34 0.69 0.35 0.61
Refurbishment 0.72 0.95 0.40 1.23 1.33 0.69 0.35 0.61
𝐹𝐶 Total
Greenfield 4.41 5.80 2.42 7.51 8.16 4.21 2.11 3.71
Brownfield 4.36 5.75 2.41 7.43 8.04 4.16 2.10 3.67
Refurbishment 4.33 5.71 2.40 7.38 7.98 4.14 2.10 3.65

173
Figure 3.6 a) Trends in area factor and cost factor across multiple manufacturing platforms and commercialisation scenarios for
a products with dose size of 100M cells. The unit operations included in the allogenic platforms were inoculation, cell culture and
wash and volume reduction while the unit operations included in the autologous platforms were cell wash, cell activation, viral
transduction, cell culture and wash and volume reduction. For allogenic processes a harvest density of 45,000 cells/m2 for all
platforms and surface area/l for microcarier-based platforms of 5,540 were assumed . For autologous processes a maximum cell
density for cell culture was 7 × 10⁶ cells/ml was assumed. The abbreviations indicate the name of the different manufacturing
platforms: MLF = multilayer flask; MPB = multi-plate bioreactor; HFB = hollow fibre bioreactor; STR = stirred tank bioreactor;
MLF (open) = multilayer flask with open steps; SSB = static suspension bag; INT = integrated USP/DSP platform; RMB = rocking
motion bioreactor b) Method for evaluating facility footprint and FCI.

174
3.3.6 Selecting a project specific cost factor
The hypothetical facilities considered in this case study so far were assumed to be built
on a greenfield site. However, the starting condition of the site chosen to build the facility
may vary from project to project. Some projects may be built on a brownfield site and
others in an existing building shell. Moreover, the geographical location of the facility
will also have an effect on the FCI. Furthermore, different manufacturing platforms
require the use of different cost factors for relevant evaluating of FCI as previously
observed (Figure 3.2 and Figure 3.3). Hence, it is important to provide cost factors that
capture project-specific features in order to increase the accuracy of estimated. The
differences in cost factor across the manufacturing platforms were captured by grouping
them together into three categories according to the core equipment costs per m2
characteristic of the different platforms. These categories were: high equipment costs per
m2 of facility, medium equipment costs per m2 of facility and low equipment costs per m2
of facility.
The different platforms were grouped together according to the trends seen for area factor
on Figure 3.6 a. The hollow fibre bioreactor and integrated USP/DSP platforms were
considered to have relatively high equipment costs per m2. Platforms with medium
equipment costs per m2 of facility were assumed to be the multilayer flasks (allogeneic),
multi-plate bioreactor, static suspension bags and rocking motion bioreactor.
Manufacturing platforms with low equipment costs per m2 of facility were assumed to be
stirred tank bioreactor and the multilayer flask with open steps (autologous). The effect
of manufacturing platform selection, the starting condition of the construction site and its
geographical location and manufacturing platform selection are captured in Figure 3.7.
For each site condition-geographic region combination, each group of manufacturing
platforms seen Figure 3.7 offers a range of cost factors in order to account for the effect

175
of annual demand on the cost factor; such that at smaller annual demands, users may
choose higher cost factors and vice-versa.
Figure 3.7 shows that manufacturing platforms with high equipment costs per m2 have
cost factors between 2.1 and 3.5 depending on the annual demand, geographic region and
initial condition of the construction site. This factor increases to 3.5-7.5 for platforms
with medium equipment costs per m2 and 6.1-8.4 for platforms with high equipment costs
per m2. Moreover, Figure 3.7 shows also that in low economically developed areas such
as India and Mexico, the cost factors are lower as building materials, land and labour
costs are lower. As the degree of economic development increases to geographic areas
such as the US west coast or Eastern Europe, these costs increase, increasing the overall
cost factor. Furthermore, when building a facility in the Brownfield site as opposed to a
Green filed site, it was assumed that no yard improvements were required such that these
costs would be null, decreasing the overall project costs and hence the cost factor. This
assumption may not always apply as in some cases land remediation maybe required due
to possible soil contamination, which will incur some yard improvement costs. Moreover,
when considering building the facility in an existing (rented) shell, although the land
costs, yard improvement costs and shell costs maybe null, resulting in lower FCI, and
hence a lower cost factor, the facility running costs would be higher as the company now
must pay to rent the facility. Furthermore, when using an existing shell possible design
restrictions must also be considered.

176
3.4 Conclusion
This chapter aimed at proposing a detailed project-specific factorial methodology and
using it to provide benchmark short-cut ratios for FCI and facility footprint evaluation for
cell therapy facilities using the core equipment costs. The results clearly highlight that
allogenic facilities have significantly lower FCI and facility footprint than autologous
facilities. Moreover, when evaluating FCI and facility trends for different cell therapy
facilities, the results showed that multiple factors will have an effect on the FCI and
footprint of cell therapy facilities including annual demand, manufacturing technology,
initial condition of the construction site and geographic location of the facility. These
parameters caused the cost factors to range between 2.15 and 8.6 and the area factors to
range between 950 and 6,500.
Figure 3.7 Change in cost factor with initial condition of the facility site,
manufacturing platform and geographic location of the facility. The manufacturing
platforms with high costs/m2are the hollow fibre bioreactor and the integrated
USP/DSP. The manufacturing platforms with medium costs/m2 are the multilayer
flasks, multi-plate bioreactor, static suspension bags and rocking motion bioreactor and
the manufacturing platform with low costs/m2 are the stirred tank bioreactor and
multilayer flasks with open steps.
177
FCI and facility footprint are important factors to consider when selecting a
manufacturing strategy for a novel cell therapy product. This method can be used for
manufacturing platform selection based on crude FCI and facility footprint estimates
during the early stages of process development of novel cell therapy products.

178
Chapter 4: Impact of Allogeneic Stem Cell Manufacturing
Decisions on Cost of Goods, Process Robustness and
Reimbursement
4.1 Introduction
Chapter 1 has underlined the therapeutic potential of mesenchymal stem-based cell
therapies across a number of different indications as well as the challenges associated
with the manufacture of these therapies. These challenges include high cost of goods
(COG), high process variability and scale-up restrictions (Heathman et al. 2015;
Lapinskas 2010; Lopez et al. 2010; Christodoulou et al. 2013; Mount et al. 2015a;
Ratcliffe et al. 2011). As COG decreases with increasing manufacturing scale (Simaria et
al. 2014b), there is an increased interest in the development and evaluation of scalable
technologies for cell therapy manufacture. Methods for the evaluation of novel
technologies are based often on COG and process yield. However, there are a number of
less tangible issues that must be considered also when designing a manufacturing process
for cell therapy products such as robustness, biological limitations, technology scalability,
and ease of development. This chapter aims at utilizing the advanced decisional tool
described in Chapter 2 to provide a holistic approach to select the optimal manufacturing
technology for the manufacture of adherent cells (MSC-products) that captures economic
aspects (e.g. COG, fixed capital investment, reimbursement potential) as well as
operational aspects (e.g. robustness, resource requirement, ease of validation, ease of
operation, ease of development).
The remainder of this chapter is structured as follows. Section 4.2 presents the case study
setup. In Section 4.3 the results are presented and discussed. Section 4.3.1 focuses on the
deterministic analysis. In Section 4.3.2 multi-attribute decision-making and Monte Carlo
simulations are used to evaluate the operational features of different technologies for the

179
expansion of MSC. In Section 4.3.3 multiple reimbursement strategies are applied to
hypothetical cell therapy products with industrially relevant dose sizes, and the analysis
identifies scenarios where commercial feasibility will be challenging due to economic
and/or operational bottlenecks. Section 4.3.3 also provides insights on areas within the
manufacturing process, for which additional development would allow for commercial
feasibility of MSC-based cell therapy products.
4.2 Case study setup
The decisional tool described in Chapter 2 was used in this case study in order to assess
the economic and operational benefits of different manufacturing platforms for the
production of allogeneic MSC-based cell therapy products. The bioprocess economics
model simulates each day of a single product facility operating 335 days a year with two
annual maintenance shutdowns, one in the summer and one in the winter. The
manufacturing process modelled in this case study is based on a 21 day long cell culture
process with 3 expansion stages and with the final cell harvest, wash, concentration and
formulation occurring on day 21 (Table 4.1).
The annual demand for MSC-based products is likely to vary according to the indication
being targeted, for example, indications such as chronic low back pain have lower dose
sizes (~107 cells) (Pang et al. 2014; GlobeNewswire 2016b), whilst other indications such
as GvHD the dose requirement is much higher (~108-109 cells per patient) (Hare et al.
2009; Bell Potter 2011; Introna et al. 2014; Lin & Hogan 2011; Lazarus et al. 2005;
ClinicalTrials.gov 2016).
Given the differences in annual demands of different MSC-based cell therapy products,
the tool was used to analyse the behaviour of different manufacturing technologies across
manufacturing scales varying from 1 to 100 billion cells per batch and demands ranging
from 10 billion to 10,000 billion cells per year. This scale limit was established in Hassan
et al (2015) as the maximum number of cells which the current technologies for cell wash
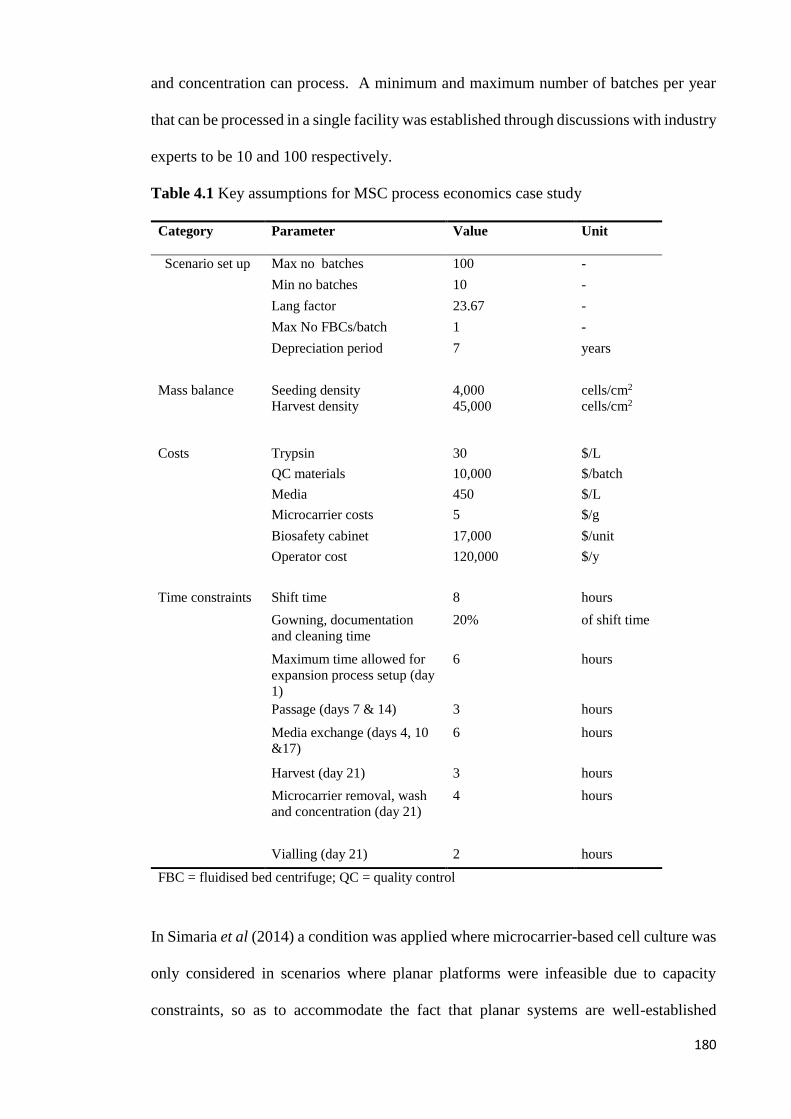
180
and concentration can process. A minimum and maximum number of batches per year
that can be processed in a single facility was established through discussions with industry
experts to be 10 and 100 respectively.
Table 4.1 Key assumptions for MSC process economics case study
Category Parameter Value Unit
Scenario set up Max no batches 100 -
Min no batches 10 -
Lang factor 23.67 -
Max No FBCs/batch 1 -
Depreciation period 7 years
Mass balance Seeding density 4,000 cells/cm2
Harvest density 45,000 cells/cm2
Costs Trypsin 30 $/L
QC materials 10,000 $/batch
Media 450 $/L
Microcarrier costs 5 $/g
Biosafety cabinet 17,000 $/unit
Operator cost 120,000 $/y
Time constraints Shift time 8 hours
Gowning, documentation
and cleaning time
20% of shift time
Maximum time allowed for
expansion process setup (day
1)
6 hours
Passage (days 7 & 14) 3 hours
Media exchange (days 4, 10
&17)
6 hours
Harvest (day 21) 3 hours
Microcarrier removal, wash
and concentration (day 21)
4 hours
Vialling (day 21) 2 hours
FBC = fluidised bed centrifuge; QC = quality control
In Simaria et al (2014) a condition was applied where microcarrier-based cell culture was
only considered in scenarios where planar platforms were infeasible due to capacity
constraints, so as to accommodate the fact that planar systems are well-established
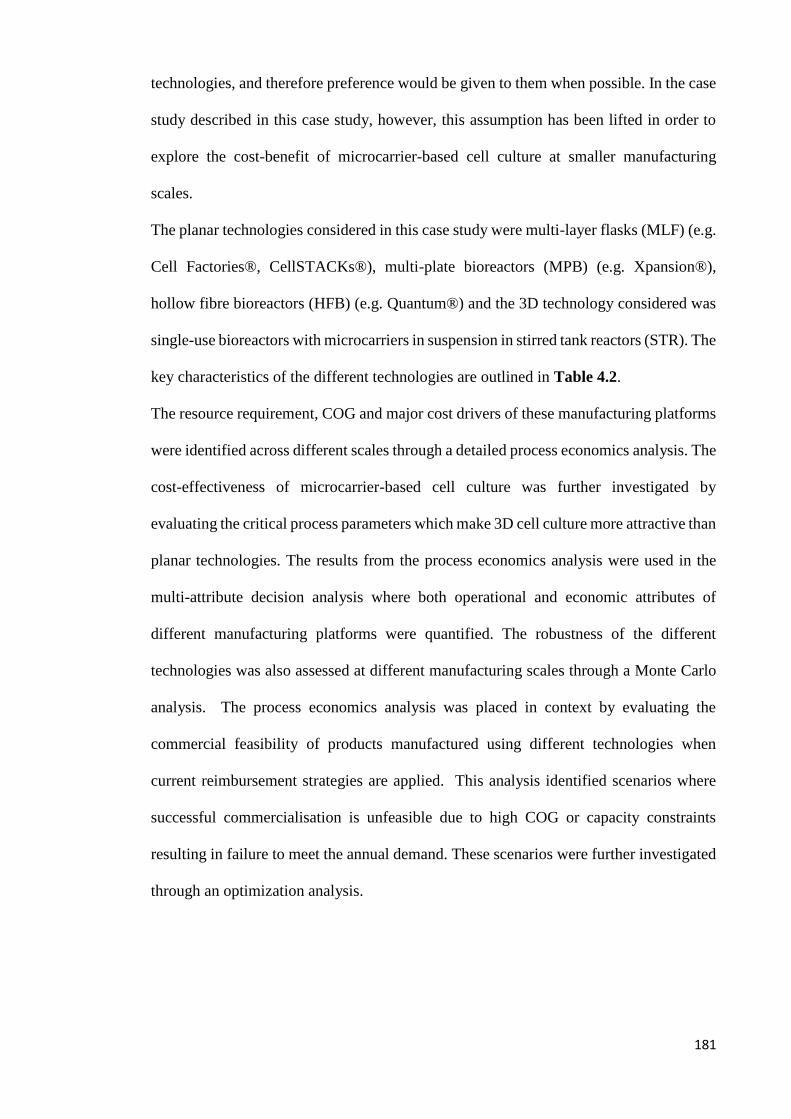
181
technologies, and therefore preference would be given to them when possible. In the case
study described in this case study, however, this assumption has been lifted in order to
explore the cost-benefit of microcarrier-based cell culture at smaller manufacturing
scales.
The planar technologies considered in this case study were multi-layer flasks (MLF) (e.g.
Cell Factories®, CellSTACKs®), multi-plate bioreactors (MPB) (e.g. Xpansion®),
hollow fibre bioreactors (HFB) (e.g. Quantum®) and the 3D technology considered was
single-use bioreactors with microcarriers in suspension in stirred tank reactors (STR). The
key characteristics of the different technologies are outlined in Table 4.2.
The resource requirement, COG and major cost drivers of these manufacturing platforms
were identified across different scales through a detailed process economics analysis. The
cost-effectiveness of microcarrier-based cell culture was further investigated by
evaluating the critical process parameters which make 3D cell culture more attractive than
planar technologies. The results from the process economics analysis were used in the
multi-attribute decision analysis where both operational and economic attributes of
different manufacturing platforms were quantified. The robustness of the different
technologies was also assessed at different manufacturing scales through a Monte Carlo
analysis. The process economics analysis was placed in context by evaluating the
commercial feasibility of products manufactured using different technologies when
current reimbursement strategies are applied. This analysis identified scenarios where
successful commercialisation is unfeasible due to high COG or capacity constraints
resulting in failure to meet the annual demand. These scenarios were further investigated
through an optimization analysis.

182
Table 4.2 Manufacturing platform-specific assumptions for the MSC case study
Category Parameter Multi-layer Multi - plate Hollow
fibre
Single-use
bioreactors with
microcarrierb
Resource
capacities and
requirements
Technology name MLF 1 MLF 2 MLF 5 MLF 10 MLF 40 MLF10 MPB
50
MLB
100
MPB
200
HFB STR: 1L – 2,000L
Surface area (cm2) 636 1,272 3,180 6,320 25,280 6,120 30,600 61,200 122,400 21,000 5,540-11,080 ,000c
Media volume (ml/
cm2)
0.25 0.25 0.25 0.16 0.16 0.27 0.18 0.18 0.18 0.37 0.09
Incubator capacity 60 60 24 12 16 2 2 2 2 - -
Equipment
capacitya
- - - - 16 1 1 1 1 1 1
Executing:
Documentation
operator ratio
1:1 1:1 1:1 1:1 1:1 2:1 2:1 2:1 2:1 2:1 2:1
Costs Consumable costs
($/unit)
60 73 241 507 1,265 2,310 4,412 6,778 9,820 12,000 680-10,500
Incubator costs
($/unit))
17,835 17,835 17,835 17,835 30,000 10,000 10,000 10,000 10,000 - -
Equipment costs
($/ unit)
- - - - 425,000 59,800 59,800 59,800 59,800 150,000 88,470-575,000
Time Start culture
duration (h)
0.14 0.14 0.14 0.14 1.3 1 1 1 1 0.17 2 (for volume
≤ 200 L), 3 (for
volume > 200L)
Media exchange
duration (h)
0.07 0.07 0.07 0.07 0.67 0.5 0.5 0.5 0.5 0 1 (for volume ≤
200L), 1.5 (for
volume >200L)
Passage time (h) 0.21 0.21 0.21 0.21 1.97 1.5 1.5 1.5 1.5 0.37 3 (for volume ≤
200L), 4.5 (for
volume >200L)
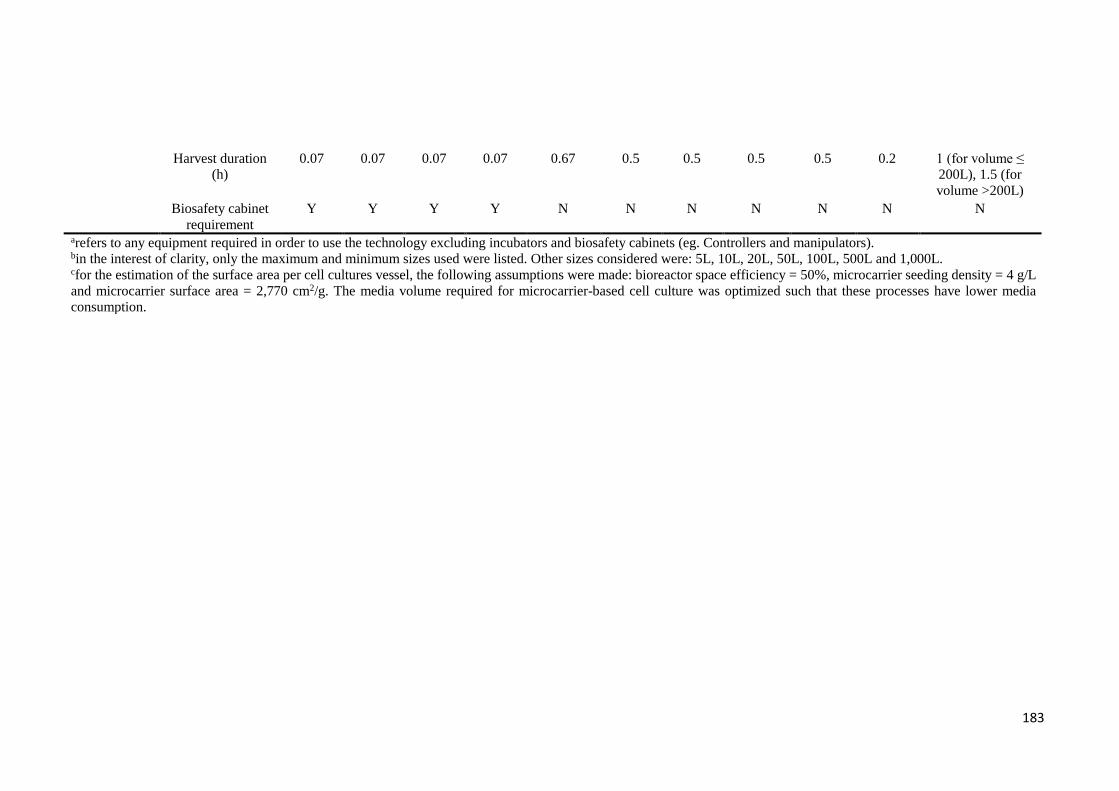
183
Harvest duration
(h)
0.07 0.07 0.07 0.07 0.67 0.5 0.5 0.5 0.5 0.2 1 (for volume ≤
200L), 1.5 (for
volume >200L)
Biosafety cabinet
requirement
Y Y Y Y N N N N N N N
arefers to any equipment required in order to use the technology excluding incubators and biosafety cabinets (eg. Controllers and manipulators). bin the interest of clarity, only the maximum and minimum sizes used were listed. Other sizes considered were: 5L, 10L, 20L, 50L, 100L, 500L and 1,000L. cfor the estimation of the surface area per cell cultures vessel, the following assumptions were made: bioreactor space efficiency = 50%, microcarrier seeding density = 4 g/L
and microcarrier surface area = 2,770 cm2/g. The media volume required for microcarrier-based cell culture was optimized such that these processes have lower media
consumption.
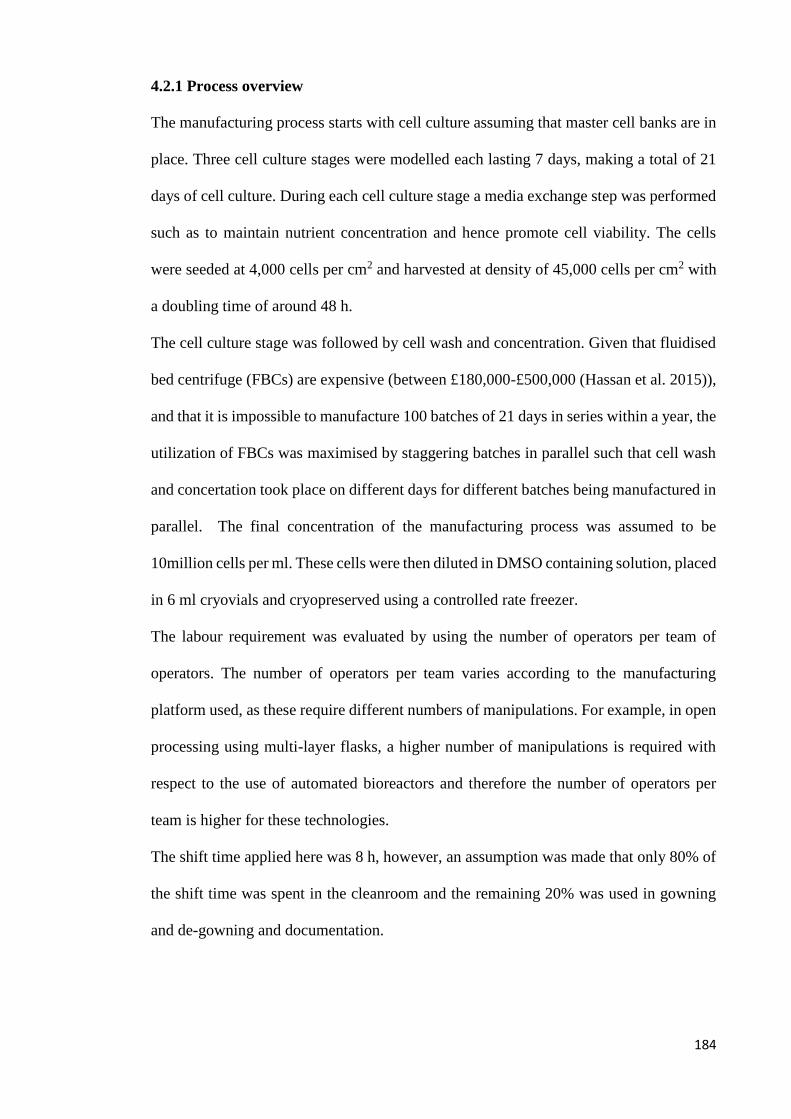
184
4.2.1 Process overview
The manufacturing process starts with cell culture assuming that master cell banks are in
place. Three cell culture stages were modelled each lasting 7 days, making a total of 21
days of cell culture. During each cell culture stage a media exchange step was performed
such as to maintain nutrient concentration and hence promote cell viability. The cells
were seeded at 4,000 cells per cm2 and harvested at density of 45,000 cells per cm2 with
a doubling time of around 48 h.
The cell culture stage was followed by cell wash and concentration. Given that fluidised
bed centrifuge (FBCs) are expensive (between £180,000-£500,000 (Hassan et al. 2015)),
and that it is impossible to manufacture 100 batches of 21 days in series within a year, the
utilization of FBCs was maximised by staggering batches in parallel such that cell wash
and concertation took place on different days for different batches being manufactured in
parallel. The final concentration of the manufacturing process was assumed to be
10million cells per ml. These cells were then diluted in DMSO containing solution, placed
in 6 ml cryovials and cryopreserved using a controlled rate freezer.
The labour requirement was evaluated by using the number of operators per team of
operators. The number of operators per team varies according to the manufacturing
platform used, as these require different numbers of manipulations. For example, in open
processing using multi-layer flasks, a higher number of manipulations is required with
respect to the use of automated bioreactors and therefore the number of operators per
team is higher for these technologies.
The shift time applied here was 8 h, however, an assumption was made that only 80% of
the shift time was spent in the cleanroom and the remaining 20% was used in gowning
and de-gowning and documentation.

185
4.2.2 Key assumptions
Robustness analysis was performed using the Monte Carlo simulation model described
in Chapter 2 (Section 2.7). During this analysis, the manufacturing process was fixed
and different critical process parameters were varied such that the absolute COG
remained constant whilst the throughput varied. Moreover an assumption was made that
in scenarios where the number of cells produced exceeded the expected number of cells,
these additional cells would still be commercialised and not wasted resulting in lower
COG/million cells in such scenarios.
The values used for the critical process variables were attained through a series of
discussions with industry experts. The rationale behind these assumptions is based on the
fact that multi-layer flasks are manual systems and therefore prone to variability. This
was assumed to have an impact on the cell doubling time and batch failure rate due to the
limited control over the process parameters. Moreover, given that microcarrier-based cell
culture is a more nascent technique in the cell therapy field, it was also assumed that the
variability in the proliferation rate of cells would also be higher in these systems. The
additional degree of difficulty in dissociating cells from microcarriers with respect to 2D
technologies was also accounted for by allowing extra variability in cell detachment
efficiency in 3D cell culturing. Table 4.3 summarises the minimum, maximum and most
likely values of the parameters evaluated.
Multi-attribute analysis was performed in order to quantify both operational and
economic parameters. The scores for operational attributes were attained by distributing
a survey questionnaire across multiple industry experts on their experience in designing
a process for commercial scale manufacture of cell therapy products. In total, seven
interviews were carried out with experts spanning roles such as senior pilot plant
manager, business development manager, global product manager, vice president of
technology and manufacturing, and head of cell culture services across innovator

186
companies, contract manufacturers and vendors. The survey asked them to rank
operational categories according to their importance and to rank different cell culture
technologies on those categories. The operational categories considered were ease of
development, ease of validation, ease of setup, ease of operation and ease of scale-up.
The actual development costs were not considered at this stage but have been explored in
parallel work by Hassan et al 2015. The scores used in this section were the average of
the responses and are summarised in Table 4.3. The scores from both economical
categories (FCI and COG/million cells) were gathered from the process economics
model. Here, an assumption was made that the COG/million cells was twice as important
as the FCI costs, such that the long term benefits of using a particular technology would
outweigh the initial capital investment.
In this analysis, the capacity of the different manufacturing technologies for producing
enough cells for different commercialisation scenarios was assessed. An assessment of
the commercial feasibility of MSC-based cell products under the UK’s National Institute
of Health and Care Excellence (NICE) maximum reimbursement limit (approximately
$40,000 per quality adjusted life) (Bubela et al. 2015) was also carried out. This allowed
for the identification of scenarios where commercial failure would occur due to capacity
or economic constraints.

187
Table 4.3 Assumptions for multi-attribute decision-making and stochastic cost analysis
Attribute Ranka MLF MPB HFB STR
Multi-attribute decision-making analysis
Oper
atio
nal
par
amet
ers
Ease development Tr(1,2.2,3) Tr(1,4,5) Tr(2,3.4,5) Tr(2,3.2,5) Tr(1,2.4,4)
Ease of validation Tr(2,3.6,4) Tr(2,3.2,5) Tr(3,3.4,5) Tr(1,2.8,5) Tr(2,3,4)
Ease of setup Tr(1,2.8,5) Tr(1,3.6,5) Tr(2,3,4) Tr(3,3.8,5) Tr(2,3,4)
Ease of operation Tr(2,3.4,5) Tr(1,2.2,4) Tr(2,3.6,4) Tr(1,3.6,5) Tr(3,3.6,4)
Ease of scale-up Tr(1,3.8,5) Tr(1,2.4,4) Tr(3,3.6,5) Tr(1,1.6,2) Tr(1,3.2,5)
Eco
nom
ic
par
amet
ers COG/millionb ($) 2 Tr(25,78,435) Tr(21,46,99) Tr(85,163,351) Tr(10,37,10)
FCIb ($M) 1 55.7 19.8 81 21
Robustness analysis
Cell detachment
yield - Tr(0.85,0.9,0.95) Tr(0.85,0.9,0.95) Tr(0.85,0.9,0.95) Tr(0.6,0.75,0.9)
DSP yield - Tr(0.58,0.68,0.78) Tr(0.58,0.68,0.78) Tr(0.58,0.68,0.78) Tr(0.512,0.612,0.712)
Batch success rate - Tr(0.9,0.95,0.97) Tr(0.93,0.95,0.98) Tr(0.93,0.95,0.98) Tr(0.93,0.95,0.98)
Doubling time (h) - Tr(32,34,37) Tr(33,34,35) Tr(33,34,35) Tr(32,34,37)
For the operational criteria, a higher score of 5 indicated the best technology in that particular criteria and a lower score of 1 indicated the worst technology.
Tr(a,b,c) refers to the triangular probability distribution where a, b, c are the minimum, most likely, and maximum values, respectively. aThe ranks and scores were attained from a survey distributed across industry experts in positions such as: Senior pilot plant manager, business development
manager, global product manager, vice president of technology and manufacturing, head of cell culture services of Eufets GmbH, Promethera, Pluristem and Pall
Life Sciences. The higher the rank the better the technology. A higher value of the rank indicated a criterion of greater importance/weighting. bCOG and FCI are taken from a scenario with a batch size of 10 B cells per batch and a demand of 100 B cells per year.
MLF = multilayer flask; MPB = multi-pate bioreactor; HFB = hollow fibre bioreactor; STR = stirred tank bioreactor

188
In order to recommend possible process improvements to overcome these challenges, a
sensitivity analysis was performed. This analysis aimed at identifying the key factors
contributing to both economic and operational bottlenecks. During the sensitivity analysis
cost parameters were varied by ±25% and operational parameters varied according to the
minimum and maximum values used in the robustness analysis (Table 4.3). The effect of
varying these factors on COG and throughput was measured and the factors with the
highest impact on the economic and operational performance of MSC-based
manufacturing processes were then used during the optimization analysis, where target
values for these factors were recommended.
4.3 Results and discussion
This section summarises the key insights from the techno-economic analysis of
alternative cell culture technologies for allogeneic MSC therapies across different dose-
demand scenarios. The analysis identifies key COG drivers, weighs up the financial and
operational benefits, and determines the robustness and reimbursement potential of each
technology. For scenarios where product commercialisation was deemed infeasible, the
key parameters which influence both cost-effectiveness and capacity were identified and
optimised.
4.3.1 Process economics analysis
4.3.1.1 Deterministic cost comparison
The relative cost-effectiveness of different manufacturing platforms is highly dependent
on the scale and demand being explored (Simaria et al. 2014b). This is illustrated in
Figure 4.1 a, which shows the COG per million cells profile of the different
manufacturing platforms featured in this case study across different annual demands and
scales. At a smaller scale of 1 billion cells per batch, planar platforms are more cost-
effective than 3D cell culture. When such small batch sizes are manufactured in low
frequency (10 times per year) such that indirect costs dominate the overall COG, multi-

189
plate bioreactors become the most cost-effective option due to the low equipment costs
and relatively low labour requirement. When the number of batches is increased to 100,
direct costs become the major cost driver, which causes the optimal technology to shift
to multi-layer flasks; this is due to the fact that these have considerably lower consumable
costs with respect to all other manufacturing platforms (Table 4.2). These scenarios can
be translated into a process manufacturing 100 to 1,000 doses per year of an MSC based
treatment for heart disease with a dose size of 100 million cells (Bell Potter 2011; Introna
et al. 2014; Lin & Hogan 2011; Lazarus et al. 2005; ClinicalTrials.gov 2016; Hare et al.
2009).
When increasing the scale to 10 billion cells per batch, reaching demands of 1 trillion
cells per year (10,000 doses per year of a treatment for heart disease), the scalability of
the different manufacturing platforms determines their cost-effectiveness. High
scalability decreases the number of cell culture vessels used per batch, and therefore
decreases the requirement for equipment and personnel. Hence, microcarrier-based cell
culture becomes the most cost-effective technology at both demands, 100 billion and 1
trillion cells per year, with a very small economic advantage with respect to multi-plate
bioreactors ($21/million cells vs $27/million cells). Increasing the scale further to 100
billion cells per batch reaching high demands of up to 100,000 doses of 100 million cells
per year, increases the importance of scalability, making microcarrier-based cell culture
significantly more cost-effective than all other technologies. Furthermore, in scenarios
where the market penetration increases over time, such that the production of MSCs
increases from low demands up to “blockbuster-like” quantities being manufactured
annually, microcarriers offer relatively low COG across the different scales of production.
Figure 4.1 a portrays hollow fibre bioreactors as the least cost-effective technology
across most scales and demands. These bioreactors, offer superior operational features
(Table 4.3), however, the high consumable and equipment costs associated with this
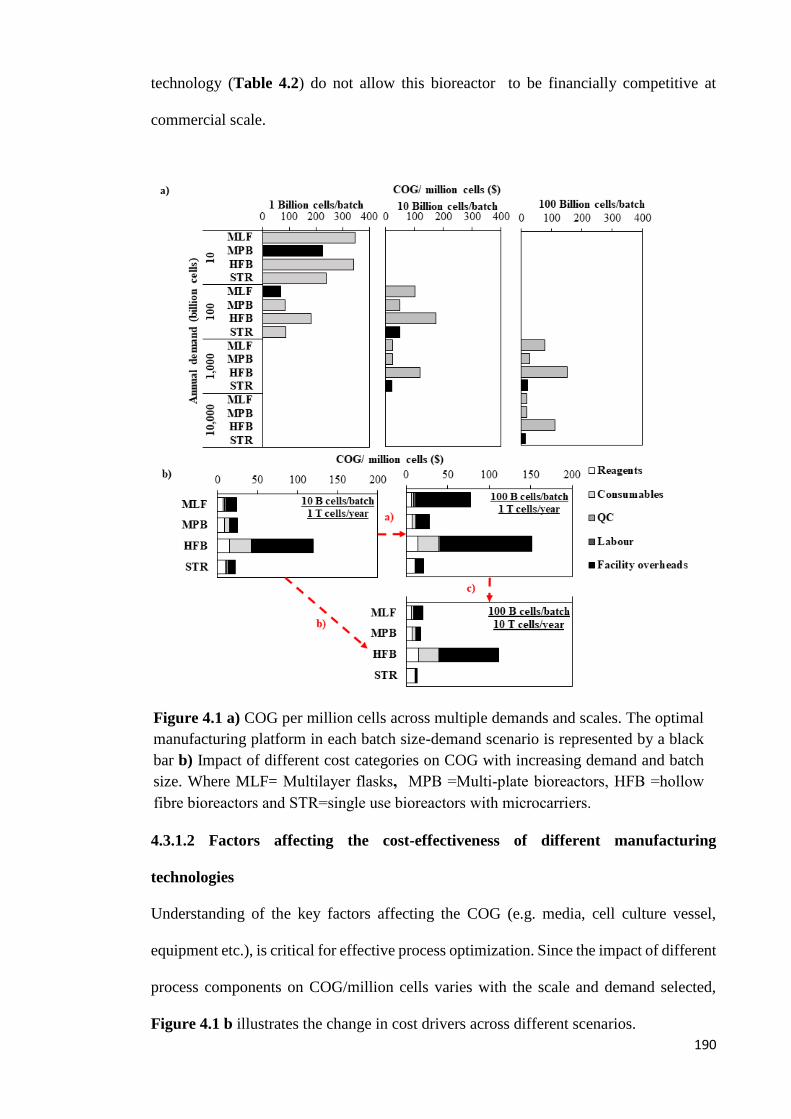
190
technology (Table 4.2) do not allow this bioreactor to be financially competitive at
commercial scale.
4.3.1.2 Factors affecting the cost-effectiveness of different manufacturing
technologies
Understanding of the key factors affecting the COG (e.g. media, cell culture vessel,
equipment etc.), is critical for effective process optimization. Since the impact of different
process components on COG/million cells varies with the scale and demand selected,
Figure 4.1 b illustrates the change in cost drivers across different scenarios.
Figure 4.1 a) COG per million cells across multiple demands and scales. The optimal
manufacturing platform in each batch size-demand scenario is represented by a black
bar b) Impact of different cost categories on COG with increasing demand and batch
size. Where MLF= Multilayer flasks, MPB =Multi-plate bioreactors, HFB =hollow
fibre bioreactors and STR=single use bioreactors with microcarriers.
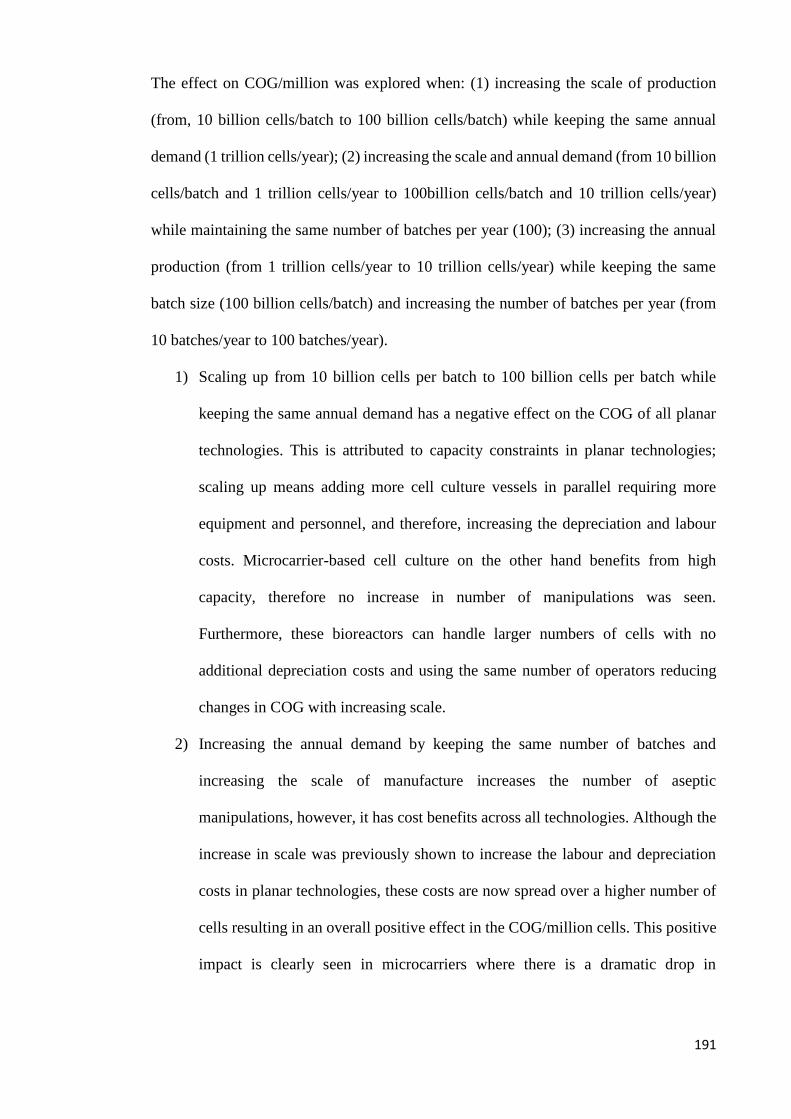
191
The effect on COG/million was explored when: (1) increasing the scale of production
(from, 10 billion cells/batch to 100 billion cells/batch) while keeping the same annual
demand (1 trillion cells/year); (2) increasing the scale and annual demand (from 10 billion
cells/batch and 1 trillion cells/year to 100billion cells/batch and 10 trillion cells/year)
while maintaining the same number of batches per year (100); (3) increasing the annual
production (from 1 trillion cells/year to 10 trillion cells/year) while keeping the same
batch size (100 billion cells/batch) and increasing the number of batches per year (from
10 batches/year to 100 batches/year).
1) Scaling up from 10 billion cells per batch to 100 billion cells per batch while
keeping the same annual demand has a negative effect on the COG of all planar
technologies. This is attributed to capacity constraints in planar technologies;
scaling up means adding more cell culture vessels in parallel requiring more
equipment and personnel, and therefore, increasing the depreciation and labour
costs. Microcarrier-based cell culture on the other hand benefits from high
capacity, therefore no increase in number of manipulations was seen.
Furthermore, these bioreactors can handle larger numbers of cells with no
additional depreciation costs and using the same number of operators reducing
changes in COG with increasing scale.
2) Increasing the annual demand by keeping the same number of batches and
increasing the scale of manufacture increases the number of aseptic
manipulations, however, it has cost benefits across all technologies. Although the
increase in scale was previously shown to increase the labour and depreciation
costs in planar technologies, these costs are now spread over a higher number of
cells resulting in an overall positive effect in the COG/million cells. This positive
impact is clearly seen in microcarriers where there is a dramatic drop in

192
COG/million cells of 42% with the increase in scale causing cell culture media to
be the main cost driver.
3) Increasing the annual production by increasing the number of batches per year
and keeping the same batch size decreases the COG/million further for all
technologies as the indirect costs are spread over more cells as seen in the previous
point.
4.3.1.3 Critical parameters contributing to the cost effectiveness of microcarrier-
based cell culture
Microcarriers in single-use bioreactors are the most cost-effective technology for the
manufacture of adherent cell therapy products with high annual demands (Figure 4.1 a).
Since different microcarriers have different surface areas and will result in different cell
detachment yields (Chen et al. 2011b), Figure 4.2 illustrates the critical process
parameters which allow for microcarrier-based cell processing to be more cost-effective
than planar technologies across different scales and demands. In Figure 4.2, the
efficiency in separating the cells from the microcarriers (cell detachment yield) is varied,
and the critical cell detachment yield for which microcarriers are more cost-effective than
planar technologies is calculated. Figure 4.2 shows that at small scales of 1 billion cells
per batch, where planar technologies are more cost-effective (Figure 4.1 a), the yield of
the microcarrier-cell detachment step must be increased from 75% to up to 85% in order
for these to be more cost-effective than planar technologies. Losses in detachment yield
can be minimised by using thermosensitive microcarriers or even avoided with injectable
or dissolvable microcarriers. When using thermosensitive mircrocarriers, the cells can be
detached from the microcarriers by changing the temperature instead of using enzymes
and thus this enhances the detachment yield (Yang et al. 2010). When using injectable
microcarriers, no microcarrier separation step is required (Confalonieri et al. 2017). The
use of injectable microcarriers will pose some regulatory implications as it will change

193
the properties of the product. Moreover, the use of injectable microcarriers may also affect
the cryopreservation process. Additional strategies to enhance the detachment yield
include optimizing the conditions for cell detachment (e.g. enzyme used, washing
protocol, incubation time and temperature). As the scale increases, scalability plays its
part and microcarriers become more cost-effective than planar platforms, hence this
critical cell detachment yield drops significantly to as low as 30%. Figure 4.2 also shows
that the manufacturing scale has a higher effect on the relative cost-effectiveness of
microcarrier-based cell culture than annual demand.
Figure 4.2 Critical surface area per litre for which single use bioreactors with
microcarriers are more cost effective than planar platforms across multiple scales and
demands for a recovery efficiency of 75% and critical detachment efficiency for which
single use bioreactors with microcarriers are more cost-effective than planar
technologies across multiple scales and demands, for non-porous microcarriers with a
surface area per litre of 11,080cm2. Min and max number of batches per year = 10 and
100 respectively.
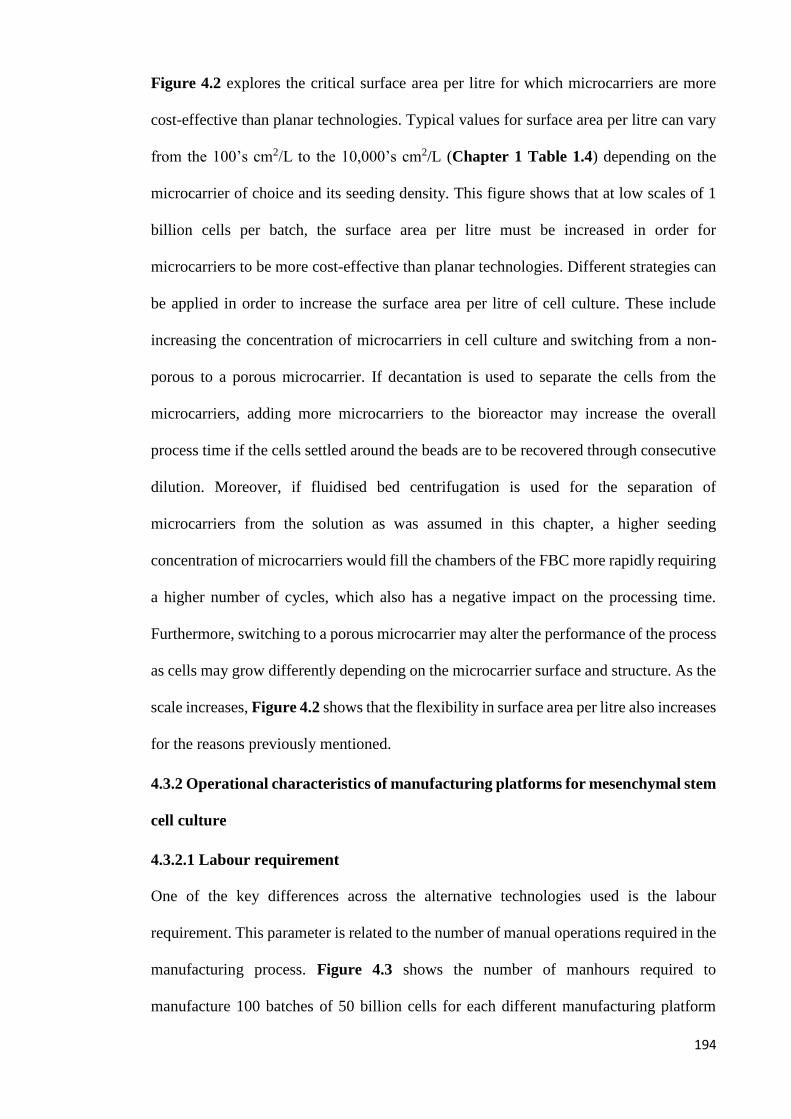
194
Figure 4.2 explores the critical surface area per litre for which microcarriers are more
cost-effective than planar technologies. Typical values for surface area per litre can vary
from the 100’s cm2/L to the 10,000’s cm2/L (Chapter 1 Table 1.4) depending on the
microcarrier of choice and its seeding density. This figure shows that at low scales of 1
billion cells per batch, the surface area per litre must be increased in order for
microcarriers to be more cost-effective than planar technologies. Different strategies can
be applied in order to increase the surface area per litre of cell culture. These include
increasing the concentration of microcarriers in cell culture and switching from a non-
porous to a porous microcarrier. If decantation is used to separate the cells from the
microcarriers, adding more microcarriers to the bioreactor may increase the overall
process time if the cells settled around the beads are to be recovered through consecutive
dilution. Moreover, if fluidised bed centrifugation is used for the separation of
microcarriers from the solution as was assumed in this chapter, a higher seeding
concentration of microcarriers would fill the chambers of the FBC more rapidly requiring
a higher number of cycles, which also has a negative impact on the processing time.
Furthermore, switching to a porous microcarrier may alter the performance of the process
as cells may grow differently depending on the microcarrier surface and structure. As the
scale increases, Figure 4.2 shows that the flexibility in surface area per litre also increases
for the reasons previously mentioned.
4.3.2 Operational characteristics of manufacturing platforms for mesenchymal stem
cell culture
4.3.2.1 Labour requirement
One of the key differences across the alternative technologies used is the labour
requirement. This parameter is related to the number of manual operations required in the
manufacturing process. Figure 4.3 shows the number of manhours required to
manufacture 100 batches of 50 billion cells for each different manufacturing platform

195
featured in this chapter. For greater resolution, the figure only shows the first 50 days of
the year. The different batches are staggered one day apart such that harvest occurs on
different days for each batch as previously described in Section 4.2.2. The manufacturing
process from cell culture to formulation occurs in 21 days. In Figure 4.3, seven batches
are being manufactured in parallel in staggered mode, and, the highest labour utilization
occurs from day 14 to 24. On the 14th day the passage to the last expansion stage (the
stage with the highest number of cell culture vessels per batch) is carried out. The media
exchange at the last expansion stage is carried out on day 17 and harvest on day 21 (Table
4.1). As 7 batches are being staggered, labour utilization is increased from day 14 to day
16 as the final passage is being carried out on 3 batches, from day 17 to 20 the other 4
batches are passaged, however, media exchange of the first batch occurs on day 17
explaining the dramatic increase in labour utilization. On day 21, all batches have been
passaged but the first batch is being harvested and the last media exchange of batch 5 is
initiated, explaining the slight drop in labour utilisation. Finally on day 24, media
exchange in the last expansion stage was concluded for all 7 batches, and the only
operation taking place is the harvest of batch 4 and therefore the number of manhours
required drops further and the cycle is repeated for the next set of 7 batches.
Figure 4.3 shows clearly that multilayer flasks have relatively high labour requirement.
A similar trend in labour requirement would be expected when using hollow fibre
bioreactors due to the fact that these also have limited capacity in comparison with multi-
plate bioreactors and single-use bioreactors with microcarriers (Table 4.2); however, the
fact that hollow fibre bioreactors are automated systems causes its labour requirement to
be reduced. Microcarriers in stirred tank bioreactors have high capacity and therefore only
a single bioreactor is used per batch reducing the number of manipulations required and
hence reducing the number of operators needed.
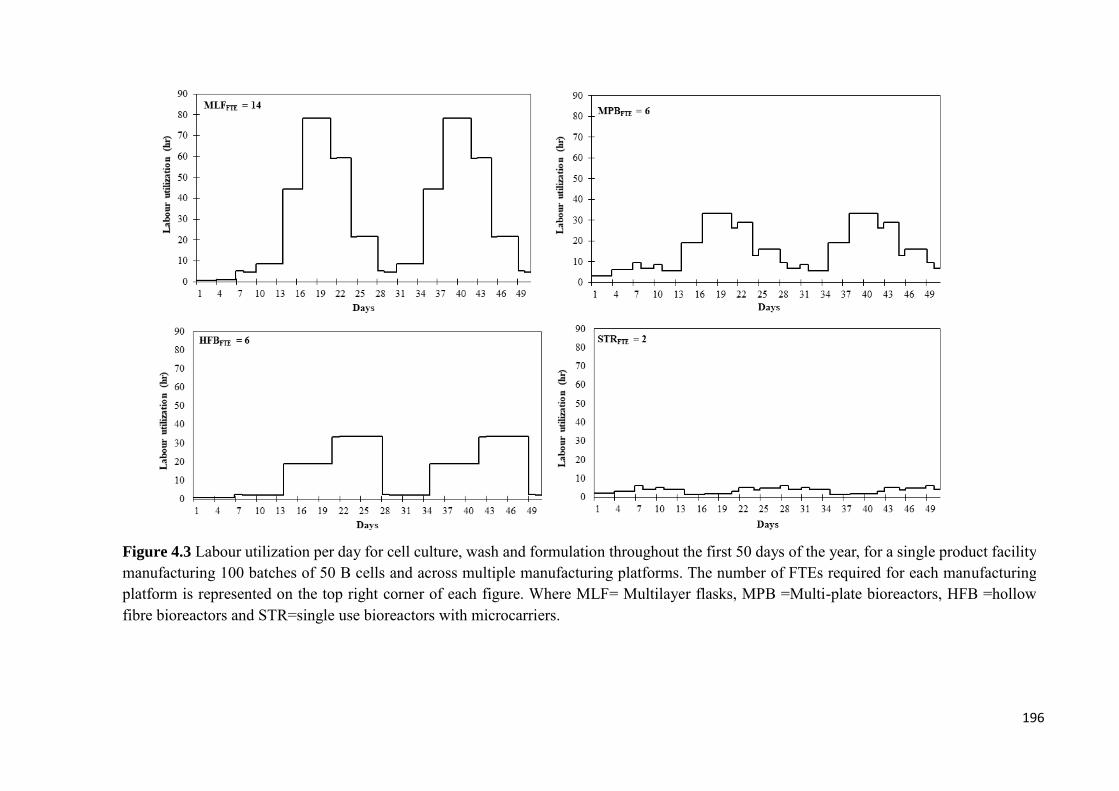
196
Figure 4.3 Labour utilization per day for cell culture, wash and formulation throughout the first 50 days of the year, for a single product facility
manufacturing 100 batches of 50 B cells and across multiple manufacturing platforms. The number of FTEs required for each manufacturing
platform is represented on the top right corner of each figure. Where MLF= Multilayer flasks, MPB =Multi-plate bioreactors, HFB =hollow
fibre bioreactors and STR=single use bioreactors with microcarriers.

197
4.3.2.2 Multi-attribute decision-making
Additional to resource requirement, operational benefits of technologies for adherent cell
expansion also include: ease of development, ease of validation, ease of setup and ease
of operation. The relative scores of the different manufacturing technologies in each of
these categories are summarised in Table 4.3. The category which was voted to have the
highest importance when selecting a manufacturing technology was ease of scale-up.
Table 4.3 also shows that processes using multi-layer flasks are relatively easy to validate
and develop but difficult to operate and scale-up. Multi-plate bioreactor-based processes
are relatively easy to validate, are automated and easy to scale-up. These systems are
however considered relatively difficult to setup with respect to hollow fibre bioreactors
and multilayer flasks. Hollow fibre bioreactors are relatively easy to setup and provide a
high degree of automation, however, these bioreactors pose challenges during scale-up.
Microcarrier-based cell culture is relatively easy to scale-up and it is a highly automated
platform; the challenges associated with this platform include setting-up the bioreactor
and developing the microcarrier-based process.
Figure 4.4 a shows the weighted sum of the operational and economic attributes of the
technologies featured in this chapter across different commercialisation scenarios. This
figure highlights that at small scale-small demand combinations, for all values of the
economic combination ratio, multi-plate bioreactors have the highest rank with the
highest aggregate score. This is due to the fact that these bioreactors have the highest
overall operational score, and that these are also the most cost-effective technology at 1
billion cells per batch and 10 billion cells per year as seen in Figure 4.1.
In the same scenario, the second optimal technology for all combination ratios of
economic features versus operational features are single use bioreactors with
microcarriers, and, although these have a slightly lower operational score with respect to
multi-layer flasks, they are far more cost-effective than these. This trend becomes more

198
evident as the combination ratio of the economic attribute increases, resulting in a greater
difference between the aggregate scores of single use bioreactors with microcariers and
multi-layer flasks. Figure 4.1 illustrated that in small scale-small demand scenarios, the
decision between microcarriers and multi-plate bioreactors is challenging as there is only
a 10% difference in COG between the two systems. Figure 4.4 a helps discriminate
further between these manufacturing platforms by reconciling economic and operational
benefits characteristic of each platform. In this scenario, the multi-plate bioreactors have
the highest overall aggregate score and can hence be considered the optimal technology.
On the other hand, when the annual demand is increased to 10,000 billion cells in Figure
4.4 a, the technology rankings change. At this higher scale, there are now only two
manufacturing platforms competing against each other, as the others lack the capacity to
fulfil such high scales. As previously mentioned, multi-plate bioreactors have superior
operational features with respect to microcarrier-based cell culture, however, when
considering the financial attributes, the COG per million for these manufacturing
platforms is now $17.4 and $13.3 respectively resulting in a 30% difference. This causes
the trends seen in Figure 4.4 a where, on the left hand side, where operational features
are prioritized, multi-plate bioreactors rank first. This ranking slowly changes, and, in the
middle, when both economic and operational characteristics have the same importance,
microcarrier systems take over as the optimal manufacturing technology remaining in
first place as the priority is shifted towards the economic benefits. Figure 4.4 a shows
that despite the superior operational features of multi-plate bioreactors, scalability is the
most important parameter in large scale manufacture of adherent cell therapy products (as
shown in Table 4.3) and therefore microcarrier systems are the best technology to be used
in such scenarios.
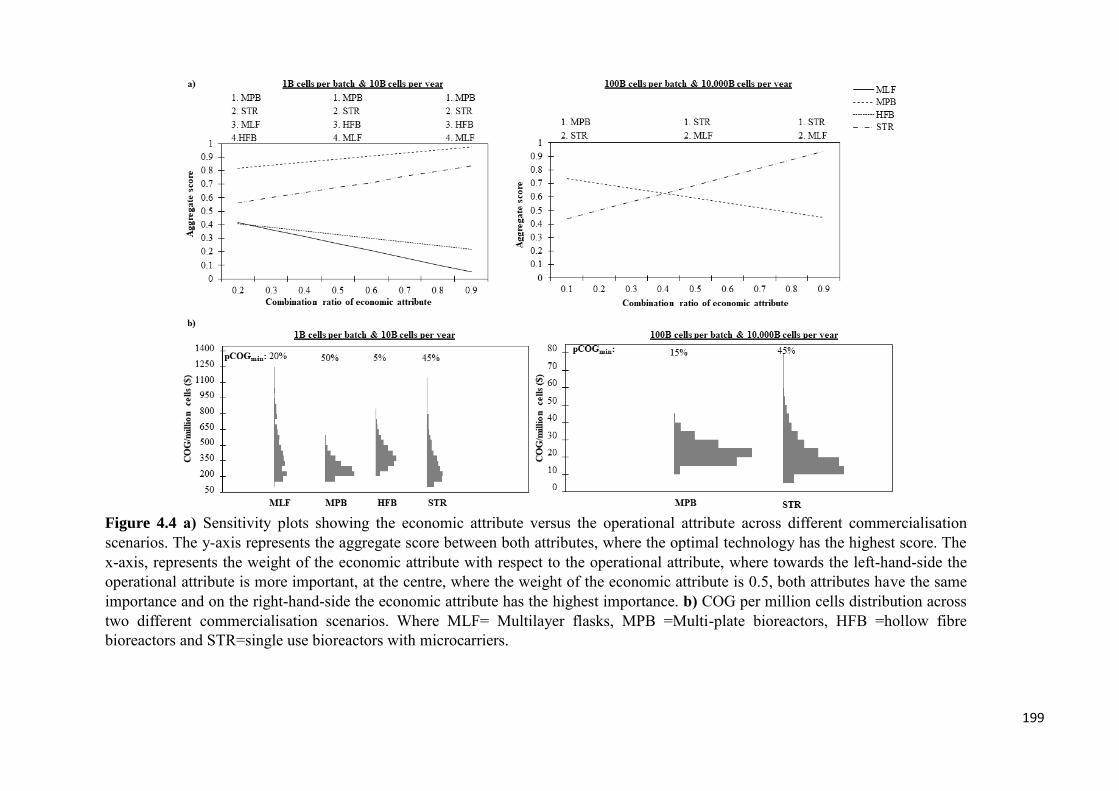
199
Figure 4.4 a) Sensitivity plots showing the economic attribute versus the operational attribute across different commercialisation
scenarios. The y-axis represents the aggregate score between both attributes, where the optimal technology has the highest score. The
x-axis, represents the weight of the economic attribute with respect to the operational attribute, where towards the left-hand-side the
operational attribute is more important, at the centre, where the weight of the economic attribute is 0.5, both attributes have the same
importance and on the right-hand-side the economic attribute has the highest importance. b) COG per million cells distribution across
two different commercialisation scenarios. Where MLF= Multilayer flasks, MPB =Multi-plate bioreactors, HFB =hollow fibre
bioreactors and STR=single use bioreactors with microcarriers.

200
4.3.2.3 Robustness analysis
Process variability is another key operational parameter which may affect the potential
for commercial success of cell therapy processes, as failure to meet the demand will
increase the COG/million cells. Figure 4.4 a shows clearly the effect of the higher
variability of processes employing microcarriers and multi-layer flasks through wider
COG distributions. Despite this fact, and although the deterministic analysis portrays
multi-plate bioreactors as the most cost-effective technology in small scale scenarios,
microcarriers still have a similar probability of achieving the optimal COG/million cells
(lowest COG/million cells). This is due to the fact that the variability of the different
parameters is both positive and negative and the difference in COG between multi-plate
bioreactors and stirred tank bioreactors with microcarriers is small. Increasing the scale
and demand decreases the probability of multi-plate bioreactors achieving the minimal
(optimal) COG/million cells and emphasises that, despite the uncertainties surrounding
microcarrier systems, these are the optimal platform to be used for large scale production
of MSC-based cell therapy products.
Table 4.4 confirms that although microcarriers have higher variability they still have the
highest probability of achieving the optimal COG/million cells at higher scales. The table
also indicates that at smaller manufacturing scales multi-plate bioreactors have a slightly
higher probability of being the technology with the highest economic and operational
aggregate score with respect to microcarrier-based platforms, and as the scale increases,
this trend is altered as microcarriers have the highest aggregate score. All distributions
were found to be significantly different from one another as indicated by all p-values
being smaller than 0.05; an illustration of these p-values is highlighted in Table 4.4
compared to the baseline planar technology at low and high demands.
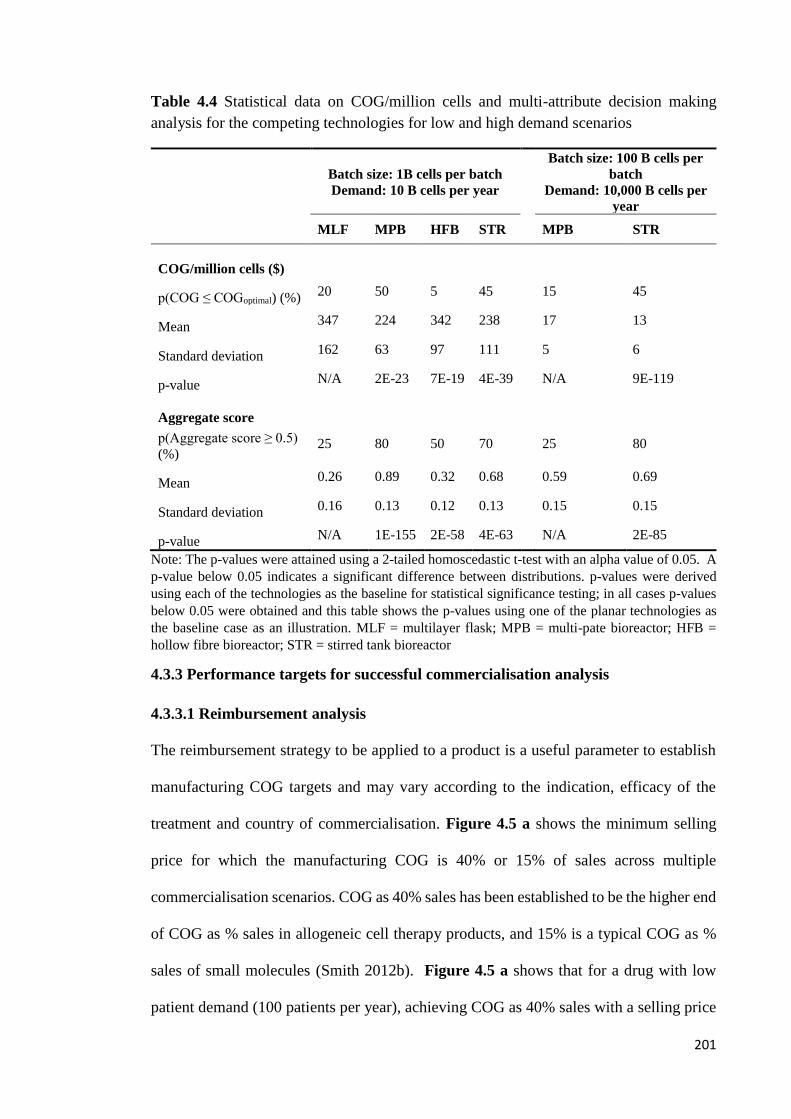
201
Table 4.4 Statistical data on COG/million cells and multi-attribute decision making
analysis for the competing technologies for low and high demand scenarios
Batch size: 1B cells per batch
Demand: 10 B cells per year
Batch size: 100 B cells per
batch
Demand: 10,000 B cells per
year
MLF MPB HFB STR
MPB STR
COG/million cells ($)
p(COG ≤ COGoptimal) (%) 20 50 5 45
15 45
Mean 347 224 342 238
17 13
Standard deviation 162 63 97 111
5 6
p-value N/A 2E-23 7E-19 4E-39
N/A 9E-119
Aggregate score
p(Aggregate score ≥ 0.5)
(%) 25 80 50 70
25 80
Mean 0.26 0.89 0.32 0.68
0.59 0.69
Standard deviation 0.16 0.13 0.12 0.13
0.15 0.15
p-value N/A 1E-155 2E-58 4E-63
N/A 2E-85
Note: The p-values were attained using a 2-tailed homoscedastic t-test with an alpha value of 0.05. A
p-value below 0.05 indicates a significant difference between distributions. p-values were derived
using each of the technologies as the baseline for statistical significance testing; in all cases p-values
below 0.05 were obtained and this table shows the p-values using one of the planar technologies as
the baseline case as an illustration. MLF = multilayer flask; MPB = multi-pate bioreactor; HFB =
hollow fibre bioreactor; STR = stirred tank bioreactor
4.3.3 Performance targets for successful commercialisation analysis
4.3.3.1 Reimbursement analysis
The reimbursement strategy to be applied to a product is a useful parameter to establish
manufacturing COG targets and may vary according to the indication, efficacy of the
treatment and country of commercialisation. Figure 4.5 a shows the minimum selling
price for which the manufacturing COG is 40% or 15% of sales across multiple
commercialisation scenarios. COG as 40% sales has been established to be the higher end
of COG as % sales in allogeneic cell therapy products, and 15% is a typical COG as %
sales of small molecules (Smith 2012b). Figure 4.5 a shows that for a drug with low
patient demand (100 patients per year), achieving COG as 40% sales with a selling price
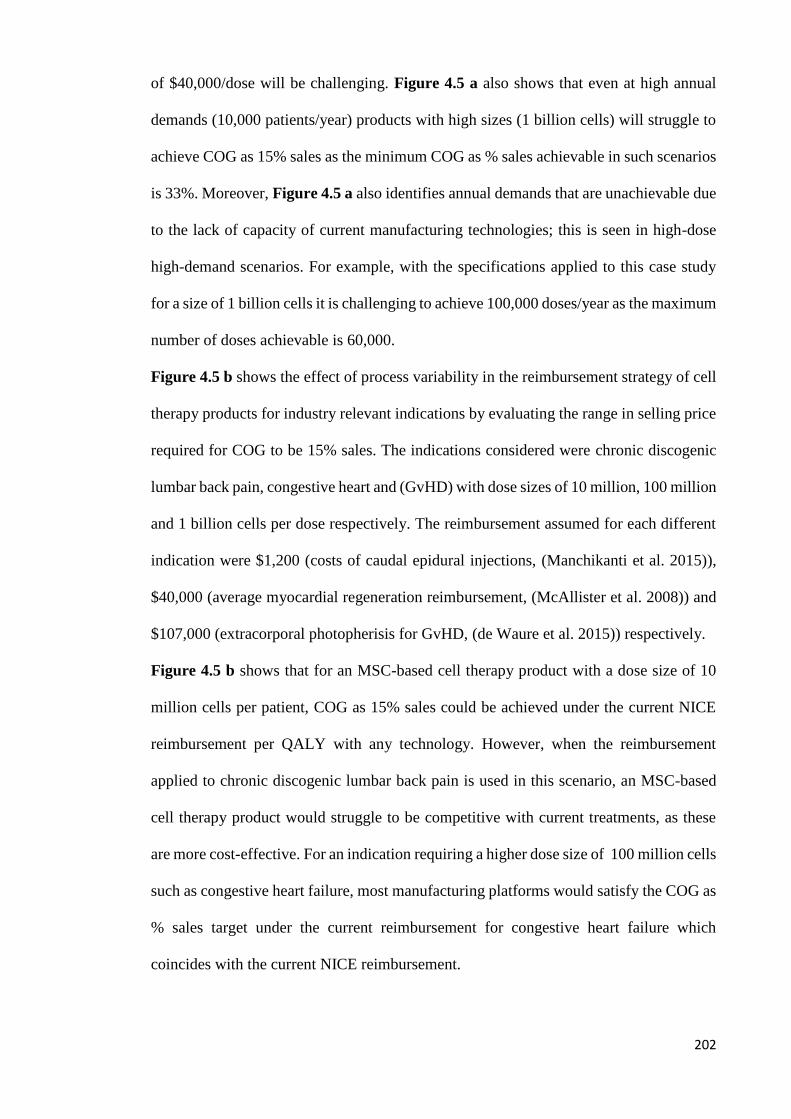
202
of $40,000/dose will be challenging. Figure 4.5 a also shows that even at high annual
demands (10,000 patients/year) products with high sizes (1 billion cells) will struggle to
achieve COG as 15% sales as the minimum COG as % sales achievable in such scenarios
is 33%. Moreover, Figure 4.5 a also identifies annual demands that are unachievable due
to the lack of capacity of current manufacturing technologies; this is seen in high-dose
high-demand scenarios. For example, with the specifications applied to this case study
for a size of 1 billion cells it is challenging to achieve 100,000 doses/year as the maximum
number of doses achievable is 60,000.
Figure 4.5 b shows the effect of process variability in the reimbursement strategy of cell
therapy products for industry relevant indications by evaluating the range in selling price
required for COG to be 15% sales. The indications considered were chronic discogenic
lumbar back pain, congestive heart and (GvHD) with dose sizes of 10 million, 100 million
and 1 billion cells per dose respectively. The reimbursement assumed for each different
indication were $1,200 (costs of caudal epidural injections, (Manchikanti et al. 2015)),
$40,000 (average myocardial regeneration reimbursement, (McAllister et al. 2008)) and
$107,000 (extracorporal photopherisis for GvHD, (de Waure et al. 2015)) respectively.
Figure 4.5 b shows that for an MSC-based cell therapy product with a dose size of 10
million cells per patient, COG as 15% sales could be achieved under the current NICE
reimbursement per QALY with any technology. However, when the reimbursement
applied to chronic discogenic lumbar back pain is used in this scenario, an MSC-based
cell therapy product would struggle to be competitive with current treatments, as these
are more cost-effective. For an indication requiring a higher dose size of 100 million cells
such as congestive heart failure, most manufacturing platforms would satisfy the COG as
% sales target under the current reimbursement for congestive heart failure which
coincides with the current NICE reimbursement.

203
Figure 4.5 a) Minimum selling price across multiple dose size and demands for which COG is 40% and 15% of sales when the minimum
COG/dose across the different manufacturing platforms is applied. The dashed line represents the current reimbursement from the NICE.
b) Minimum selling price distribution for which COG is 15% of sales. For an annual demand of 10,000 patients per year and for indications
with different dose sizes and reimbursement strategies. The dashed line on each graph represents the typical reimbursement applied to
these indications. Where MLF= Multilayer flasks, MPB =Multi-plate bioreactors, HFB =hollow fibre bioreactors and STR=single use
bioreactors with microcarriers.

204
Higher reimbursements may be considered as some of these treatments may replace the
requirement for a heart transplant which are priced up to $500,000 (Touchot & Flume
2015). Furthermore, comparing the NICE reimbursement with the reimbursement applied
in Heartcelligram-AMI® (Pharmicell, South Korea) an autologous MSC-based cell
therapy product for post-myocardial infraction which is priced at $19,000 per dose
(Bravery n.d.), it is clear that current processes for the manufacture of MSC-based
products shown in Figure 4.5 b will struggle even more to reach commercial success.
A further increase in dose size to 1,000 million cells will narrow down the choices in
technology availability for MSC cell culture, as only multi-plate bioreactors and
microcarrier systems are able to satisfy such high scales of production. Moreover, none
of these platforms would be able to achieve satisfactory COG as % sales under current
NICE reimbursement. Furthermore, even when the typical reimbursement with similar
dose size is applied (GvHD), multi-plate bioreactors are not able to meet the target COG
as % sales and microcarrier systems would struggle to do the same. When applying the
reimbursement applied to Temcel® (Mesoblast, Australia) an allogeneic MSC-based
product targeted at GvHD with a dose size of 1.2 – 1.7 billion cells resulting in a selling
price of $117,983 – $167,143 per dose ($7,079 per 72 million cells) (GlobeNewswire
2016a), it is clear that even at this higher selling price, both manufacturing platforms will
struggle to meet the target COG as % of sales.
4.3.3.2 Sensitivity analysis
In order to understand the direction in which the development effort should be focused,
so as to address both the gross margin limitations, and the capacity constraints mentioned
in Figure 4.5, a sensitivity analysis was performed. The manufacturing platform used in
this analysis is the single-use bioreactor with microcarriers, as this is the most cost-
effective technology to be used in a high demand scenario such as this (Figure 4.1).
Figure 4.6 indicates that the factors that have the greatest impact on COG at high dose
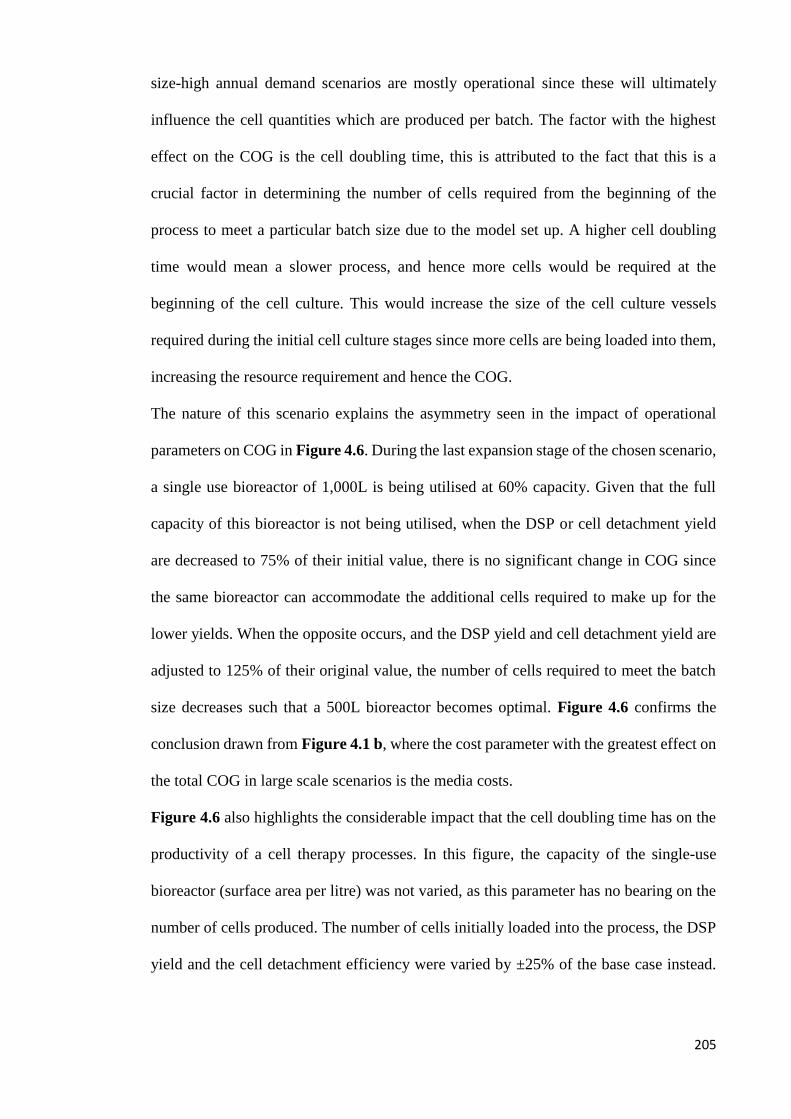
205
size-high annual demand scenarios are mostly operational since these will ultimately
influence the cell quantities which are produced per batch. The factor with the highest
effect on the COG is the cell doubling time, this is attributed to the fact that this is a
crucial factor in determining the number of cells required from the beginning of the
process to meet a particular batch size due to the model set up. A higher cell doubling
time would mean a slower process, and hence more cells would be required at the
beginning of the cell culture. This would increase the size of the cell culture vessels
required during the initial cell culture stages since more cells are being loaded into them,
increasing the resource requirement and hence the COG.
The nature of this scenario explains the asymmetry seen in the impact of operational
parameters on COG in Figure 4.6. During the last expansion stage of the chosen scenario,
a single use bioreactor of 1,000L is being utilised at 60% capacity. Given that the full
capacity of this bioreactor is not being utilised, when the DSP or cell detachment yield
are decreased to 75% of their initial value, there is no significant change in COG since
the same bioreactor can accommodate the additional cells required to make up for the
lower yields. When the opposite occurs, and the DSP yield and cell detachment yield are
adjusted to 125% of their original value, the number of cells required to meet the batch
size decreases such that a 500L bioreactor becomes optimal. Figure 4.6 confirms the
conclusion drawn from Figure 4.1 b, where the cost parameter with the greatest effect on
the total COG in large scale scenarios is the media costs.
Figure 4.6 also highlights the considerable impact that the cell doubling time has on the
productivity of a cell therapy processes. In this figure, the capacity of the single-use
bioreactor (surface area per litre) was not varied, as this parameter has no bearing on the
number of cells produced. The number of cells initially loaded into the process, the DSP
yield and the cell detachment efficiency were varied by ±25% of the base case instead.

206
As expected, increasing any of these parameters by 25% increases the number of
maximum doses produced by 25%.
4.3.3.3 Optimization case study
Having identified the key parameters affecting the profitability and capacity of
technologies for adherent cell culture, this section will determine the development effort
required to overcome current process and economic challenges.
Figure 4.7 shows how varying the different parameters highlighted by the sensitivity
analysis affects the COG as % sales for a selling price of $40,000. The base case scenario
presented in this figure shows that in order to achieve COG as 15% sales, the surface area
per litre inside the bioreactor must be at least 20,000cm2. If the cell doubling time is
decreased (Scenario 2), the COG as 15% sales target can be reached by almost doubling
the current bioreactor capacity (5,540 cm2 per litre) to 10,000cm2 per litre in combination
with increasing the detachment yield from 75% to 100%. Solutions for increasing the
detachment yield have previously been discussed in Section 3.1. The same COG target
can be achieved without changing the proliferation rate of the cells if the DSP yield can
Figure 4.6 Sensitivity analysis showing the impact of varying both process parameters
and cost parameters by ±25% with the exception of the batch success rate (varied by±5%
since the base case is 95%). This figure shows the effect of process and economic
parameters on the COG and throughput of an MSC product with dose size of 1 B cells
and a demand of 10,000 cells per patient.

207
be enhanced from 61 to 81% (Scenario 4). The DSP yield is a combination of microcarrier
removal, cell wash, concentration and cryopreservation yields, with the values of 90%,
85% and 80% (Hassan et al. 2015; Smith 2010) respectively. In this analysis, an
assumption was made that the FBC would be used to remove the microcarriers from the
cell containing solution. An alternative way to increase the yield of this step is the
employment of the harvestainerTM (Thermoscientific, Waltham, MA, USA) technology
instead of the FBC system for microcarrier removal. Another alternative to increase the
overall DSP yield is to use a different cryoprotectant to DMSO in order to decrease cell
loss during cryopreservation (Ostrowska et al. 2009) . Moreover, additional strategies to
increase the DSP yield include decreasing the concentration of the cryoprotectant used
and optimizing freezing process.
Figure 4.8 shows how varying the key parameters which influence the productivity of a
manufacturing process for MSCs affects its ability to achieve 100,000 doses per year of
1billion cells. Figure 4.8 shows that the process throughput is dependent on the DSP
yield, and, that the maximum number of doses achievable across all scenarios is 75,600.
This target is only achievable if the DSP yield is increased to 81% (Scenario 3 & 5).
Figure 4.8 also shows that excessively increasing the number of cells initially added to
the process under the base case detachment yield would not increase productivity;
although this would result in a higher number of cells achieved during the expansion
process, the maximum capacity of a single FBC system under 4 h is ~1 trillion cells,
which translates into 1.8 billion cells initially added to the process. Furthermore, Figure
4.8 shows that the capacity of current DSP technologies is the key obstacle to commercial
scale manufacture of MSC-based cell therapy products. Moreover, improving the
performance of these technologies will result in lower COG as COG decreases with
increasing scale, hence the development effort should be shifted towards the downstream
process.

208
Figure 4.7 Measurement of the impact of different parameters on the ability of reaching COG as 15% sales for a selling price
of $40,000 per dose, an annual demand of 10,000 doses and a dose size of 1 billion cells. The shaded are represents scenarios
where COG as 15% sales is reached. A = discount on media costs, B= cell doubling time and C= DSP yield.

209
Figure 4.8 Measurement of the impact of different parameters on the ability of reaching 100,000 doses per year of 1 billion
cells. A = Cell doubling time. B =DSP yield; C= Batch success rate.
Scenario 5: A = 34h B = 81.2% C = 100%

210
4.4 Conclusion
This study has explored the economic and operational performance of four candidate
technologies for the commercial scale expansion of MSCs in order to evaluate the
probability of each of these technologies leading to a feasible business model. The results
show that from an economic perspective, planar manufacturing platforms are most cost-
effective at smaller scales (≤ 1B cells/batch) whilst microcarrier systems are more cost-
effective at medium to large scales (10-100B cells/batch). The results have revealed that
for applications with low dose sizes (10 million cells), the COG/dose varies between
$485-$1750 and for applications with high dose sizes (1 billion cells), the COG/dose
varies between $13k-$111k depending on the technology and manufacturing scale
selected. The results also show that the superior operational characteristics of multi-plate
bioreactors allows them to closely compete with microcarrier systems even at larger
scales. However, ultimately, microcarriers are the optimal technology for large-scale
expansion of allogeneic MSC-based cell therapy products. Furthermore, this study
highlights that in order to achieve commercial success under current reimbursement
strategies significant improvement is required in the sector for treatments with large dose
sizes and that the market penetration of certain indications is limited by the capacity of
the current technologies. This study has also shown that future resources for the
development of technologies for commercial scale manufacture of cell therapy products
should be focused on DSP technologies. These findings can be used to understand and
quantify the current limitations and characteristics of the different technologies for
mesenchymal cell expansion and can be extended to explore further options such as the
use of cultures based on aggregates or spheroids. Such analyses help predict the minimum
reimbursement levels for different MSC-based cell therapy products that allow for
feasible business models. The next chapter will illustrate how this holistic approach can

211
be adapted and applied to tackle some of the critical challenges facing autologous CAR
T-cell developers.
.

212
Chapter 5: Addressing the Challenges to Successful
Commercialization of CAR T-cell Therapies: Technology, Costs,
Reimbursement and Supply Chain
5.1 Introduction
The previous chapter explored the economic and operational features of multiple
platforms for the manufacture of allogeneic mesenchymal stem cell (MSC) -based cell
therapy products. In this chapter, extra model features were developed to apply the
decisional tool to a case study focused on highlighting and addressing some of the
inherently different challenges associated with autologous therapies, using the complex
example of chimeric antigen receptor (CAR) T-cell products. These features included
additional unit operations, manufacturing platforms and facility configurations.
Chapter 1 underlined some of the key characteristics, benefits and challenges related to
CAR T-cell therapies as well as the technologies currently available in the market for the
manufacture of these products. At the top of the list of issues surrounding CAR T-cell
therapies is the high cost of goods (COG) associated with these products which are
currently estimated to be between $45,000-$150,000 (Reuters 2015). Furthermore, there
are challenges related to single-site manufacture of patient-specific products, which
include limited market access, poor response to market fluctuations, risk of supply chain
interruption and complex logistics (Medcalf 2016; Davie 2013; Rafiq 2013; Trainor et al.
2014; Coopman & Medcalf 2008). Moreover, debate exists on the key implications and
advantages of using an allogeneic approach to CAR T-cell manufacture in an effort to
solve some of the issues characteristic of autologous processes.
Hence, this chapter explores the following questions related to CAR T-cell manufacture:
technology selection considering operational and economic parameters, COG versus

213
reimbursement of CAR T-cell therapy products, long-term benefits of multi-site
manufacture for patient-specific products and economic benefits of allogeneic cell
therapy manufacture. To address these questions, the decisional tool was extended to
incorporate the more rigorous factorial FCI methodology outlined in Chapter 2 (Section
2.3), a revised COG model with additional unit operations and more detail on quality
costs since they are more significant with autologous processes, and a database of default
values for CAR T-cell processes. In addition, a risk-adjusted lifecycle cash flow model
were built to evaluate holistically the impact of different degrees of multi-site
manufacture compared to centralised manufacture. This accounted for impact of the
different facility configurations not only on FCI and COG but also on activities such as
technology transfer, comparability studies and transportation. The CAR T-cell case study
provides the first in-depth process economic analysis for these therapies with a set of
insights at both the technology level and an enterprise’s facility configuration level.
The remainder of this chapter is organised as follows. In Section 5.3 an overview of the
case study is described, which addresses multiple questions related to the process
economics of CAR T-cell therapies. In Section 5.3.1 provides an understanding of how
the COG, technology availability, ranking and cost drivers vary with dose size and annual
demand. Section 5.3.2 explores the operational features and resource requirement of
different technologies for autologous CAR T-cell manufacture. Section 5.3.3 assesses the
economic feasibility of autologous CAR T-cell products under current reimbursement
strategies. Section 5.3.4 investigates the capital investment requirement, risk and
potential long-term economic benefits of different facility configurations for multi-site
manufacture of patient-specific therapies. Finally, Section 5.3.5 provides insights on the
cost-effectiveness of allogeneic CAR T-cell therapies with respect to autologous CAR T-
cell therapies.
5.2 Case study setup

214
The case study described in this chapter aims at using the decisional tool described in
Chapter 2 (Section 2.4) to evaluate different strategies for the manufacture of CAR T-
cell products in Europe. In order to do so, significant modifications were made to the
bioprocess economics model described in Chapter 2 (Section 2.4 ) so as to include more
detailed calculations of costs which are higher in autologous cell therapy manufacture
such as facility-related costs, labour and material costs associated with pre-cell culture
steps and quality activities. Table 5.1 summarises the methods used to compute the cost
categories used to compute the COG/dose in this case study.
The case study starts with an appraisal of the economic and operational benefits of
multiple platforms for the manufacture of autologous CAR T-cell products. This analysis
was then extended to capture the long-term effect of adopting different facility
configurations for patient-specific CAR T-cell manufacture. In order to do so, a risk-
adjusted cash flow model was incorporated into the advanced decisional tool described
in Chapter 2. The final section of this case study assesses the cost benefit of adopting an
allogeneic approach to CAR T-cell therapy manufacture.
When evaluating the advantages of different strategies for the manufacture of CAR T-
cell products, multiple commercialisation scenarios were considered which included
annual demands varying between 100-10,000 patients per year and dose sizes (transduced
cells / patient) ranging between 5M-500M cells. The metrics used to quantify these
benefits were COG, fixed capital investment (FCI), facility footprint, personnel
requirement, rNPV and financial risk expressed as the minimum selling price for which
rNPV = 0.
In contrast with the case study described in Chapter 4, in addition to the manufacturing
process (core process & release testing), the scope of the case study was also extended to
capture tissue acquisition via leukapheresis and inbound and outbound transportation
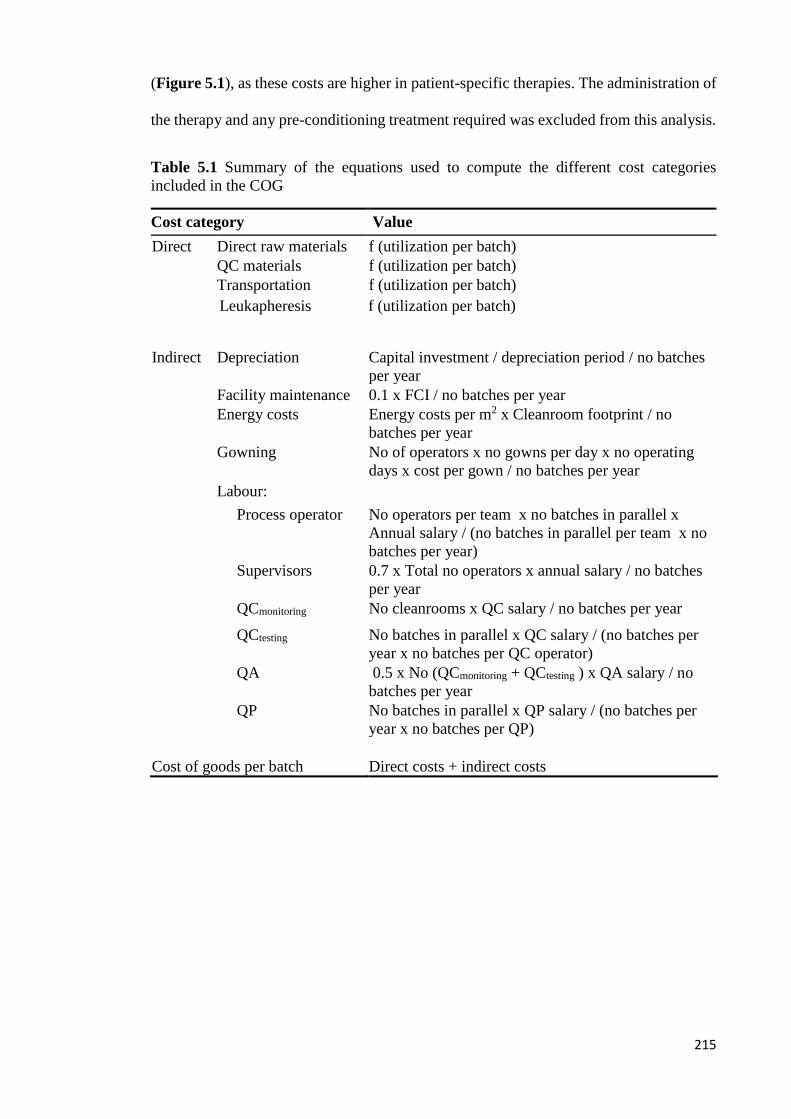
215
(Figure 5.1), as these costs are higher in patient-specific therapies. The administration of
the therapy and any pre-conditioning treatment required was excluded from this analysis.
Table 5.1 Summary of the equations used to compute the different cost categories
included in the COG
Cost category Value
Direct Direct raw materials f (utilization per batch) QC materials f (utilization per batch) Transportation f (utilization per batch) Leukapheresis f f (utilization per batch)
Indirect Depreciation Capital investment / depreciation period / no batches
per year Facility maintenance 0.1 x FCI / no batches per year Energy costs Energy costs per m2 x Cleanroom footprint / no
batches per year Gowning No of operators x no gowns per day x no operating
days x cost per gown / no batches per year
Labour:
Process operator No operators per team x no batches in parallel x
Annual salary / (no batches in parallel per team x no
batches per year)
Supervisors 0.7 x Total no operators x annual salary / no batches
per year QCmonitoring No cleanrooms x QC salary / no batches per year
QCtesting No batches in parallel x QC salary / (no batches per
year x no batches per QC operator) QA 0.5 x No (QCmonitoring + QCtesting ) x QA salary / no
batches per year QP No batches in parallel x QP salary / (no batches per
year x no batches per QP)
Cost of goods per batch
Direct costs + indirect costs

216
Figure 5.1 Schematic representation of the CAR T-cell therapy supply chain activities captured in this case study. These include
leaukapheresis, inbound transportation, manufacturing process (core process & release testing) and outbound transportation. The y-axis in
the bar chart represents the different steps within the manufacturing process and the x-axis represents the manufacturing platforms
considered in this case study where MLF = multilayer flasks, SSB = static suspension bags, GPV = gas permeable vessel, HFB = hollow
fibre bioreactor, INT = integrated USP/DSP platform and RMB = rocking motion bioreactor. The colour of the bar in each process step-
manufacturing platform combination represents the technology used, which is listed in the bottom legend.

217
5.2.2 Key assumptions for autologous and allogeneic CAR T-cell process flowsheets
In this chapter, manufacturing processes for both autologous and allogeneic cell therapy
products were modelled. In autologous processes, it was assumed that the initial cells
loaded into the process were retrieved from the patient according to the dose size of the
CAR T-cell treatment, with no limit on the max number of cells that each patient can
provide. In allogeneic processes on the other hand, cells were retrieved from a healthy
donor to produce a single batch and the number of doses produced per batch varied
according to the dose size. The maximum number of cells that could be retrieved from an
allogeneic donor was assumed to be 1.67 × 10¹⁰ cells.
In this case study, gene editing of T-cells was achieved by viral transduction and process
flows with two different viral vectors were considered, namely lentivirus and γ-retrovirus.
The process steps modelled were the same for both viral vectors. However, the length of
these process steps differed across viral vectors (Figure 5.1).
In both lentivirus-based and γ-retrovirus-based processes, it was assumed that cell
enrichment, cell wash and magnetic T-cell selection were carried out on the first day of
the manufacturing process. In lentivirus-based processes, T-cell activation was also
carried out on day 1 followed by gene editing on day 2 and cell culture on the 3rd day of
the manufacturing process. In γ-retrovirus-based processes, 2 days were allowed for cell
activation (day 1 and 2) and a further 2 days were allowed for gene editing (days 3 and
4) such that cell culture started on the 5th day of the manufacturing process. This was done
to account for the fact that γ-retrovirus cannot infect non-dividing cells as it requires
nuclear deconstruction of the target cell for integration of the cDNA into the chromosome
(Cooray et al. 2012; Luigi Naldini et al. 1996; Liechtenstein et al. 2013).

218
Gene editing using γ-retrovirus requires the use of retronectin for co-localization of T-
cells and the viral vector (Cooray et al. 2012; Tumaini et al. 2013; Dodo et al. 2014; Rees
2014; Ascierto et al. 2015). The costs of retronectin were computed differently across
manufacturing platforms. For the flask-based platforms such as multilayer flasks and gas
permeable vessels, these costs were calculated using a retronectin concentration of
25µg/cm2 of the base of the flask. For all other manufacturing platforms, the
concentration of retronectin used was 25µg/ml of the cell containing fluid inside the cell
culture vessels.
Moreover, the fact that transduction efficiencies of γ-retrovirus-based processes are
typically lower than for lentivirus-based processes was also accounted for. This was done
by assuming that the viral transduction for γ-retrovirus and lentivirus processes were 20%
and 30% respectively.
The quantities of viral vector required for T-cell transduction are often given in
multiplicity of infection (MOI). The values reported for this metric in CAR T-cell therapy
manufacture vary between 0.2-18 (Valton et al. 2015; Zhou et al. 2003; Milone et al.
2009; Barry et al. 2000). In this study, it was assumed that an MOI of 5 was applied in
both lentivirus and γ-retrovirus-based processes. Furthermore, the difficulty of producing
lentivirus vectors with respect to γ-retrovirus vectors due to the lack of stable packaging
cell lines (Cooray et al. 2012; Qasim & Thrasher 2014) was also highlighted in this study
by attributing significantly higher viral vector costs to lentivirus-based processes (Table
5.2).
In both the lentivirus-based and γ-retrovirus-based processes, it was assumed that the cell
culture step lasted for 10 days. Published articles show that the proliferation rate achieved
with CAR T-cells vary significantly across sources as shown in Chapter 1. Table 1.3
shows that the reported cell doubling times for CAR T-cells range from 31h to 257h. In

219
this study, it was assumed that the cell doubling time was 65h such that a 10-fold increase
in cell number was achieved in 10 days of cell culture. In both lentivirus and γ-retrovirus-
based processes, the final wash and concentration as well as cryopreservation were
assumed to be carried out on the last day of the processes. This resulted in a total process
length of 13 days and 15 days for lentivirus and γ-retrovirus-based processes respectively.
The allogeneic process modelled in this chapter resembles the autologous process using
lentivirus for gene editing previously described. In order to minimize the risk of GvHD,
two additional steps were incorporated into the allogenic process. The first step is an
additional gene editing stage prior to cell culture. This additional gene editing step targets
the constant region of alpha chain of the T-cell receptor (TRAC) and is typically carried
out using transcription activator-like effector nuclease (TALEN) via electroporation
(Qasim et al. 2017). The second step is a magnetic cell enrichment step and it is carried
out after the wash and concentration step. These two extra process steps result in a lower
overall process yield for allogenic processes (16%) with respect to autologous processes
(28%) as the electroporation efficiency and the yield of the final magnetic purification
step were assumed to be of 70% and 80% respectively. The key differences between the
schedules used for autologous and allogeneic process are summarised in Figure 5.2.
CAR T-cell products are prone to variability at the point of care due to differences in
thawing technique across physicians (Davie 2013; Trainor et al. 2014). Furthermore, the
transportation of fresh or frozen CAR T-cell products requires complex supply chain
models. In order to ensure that the adequate dose (transduced cells/patient) was delivered
to all patients, a redundancy multiplier was added to this analysis such that the number of
cells produced were double the cells stipulated in the dose size. These additional cells
would be stored in the facility in case of failure during transportation or point of care
delivery. Since allogeneic CAR T-cell therapies were considered to be “off-the-shelf”
products, this redundancy ratio was not applied for these therapies, since another dose
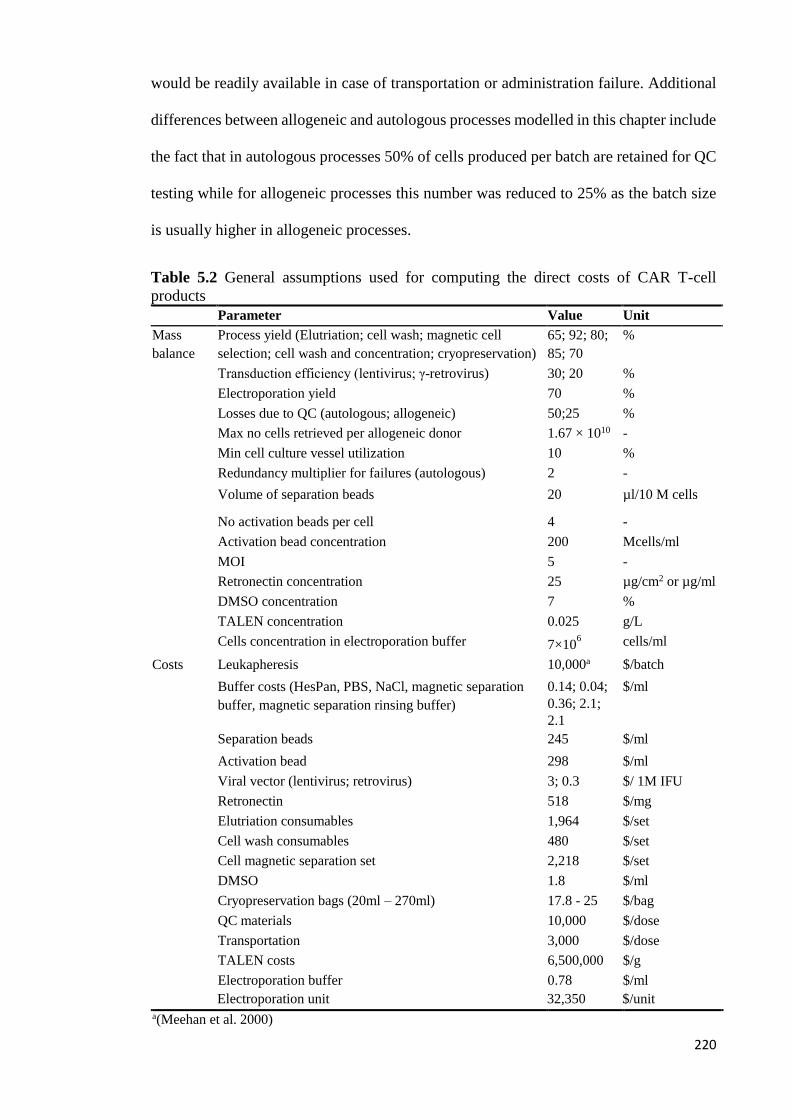
220
would be readily available in case of transportation or administration failure. Additional
differences between allogeneic and autologous processes modelled in this chapter include
the fact that in autologous processes 50% of cells produced per batch are retained for QC
testing while for allogeneic processes this number was reduced to 25% as the batch size
is usually higher in allogeneic processes.
Table 5.2 General assumptions used for computing the direct costs of CAR T-cell
products Parameter Value Unit
Mass
balance
Process yield (Elutriation; cell wash; magnetic cell
selection; cell wash and concentration; cryopreservation)
65; 92; 80;
85; 70
%
Transduction efficiency (lentivirus; γ-retrovirus) 30; 20 %
Electroporation yield 70 %
Losses due to QC (autologous; allogeneic) 50;25 %
Max no cells retrieved per allogeneic donor 1.67 × 10¹⁰ -
Min cell culture vessel utilization 10 %
Redundancy multiplier for failures (autologous) 2 -
Volume of separation beads 20 µl/10 M cells
No activation beads per cell 4 -
Activation bead concentration 200 Mcells/ml
MOI 5 -
Retronectin concentration 25 µg/cm2 or µg/ml
DMSO concentration 7 %
TALEN concentration 0.025 g/L
Cells concentration in electroporation buffer 7×10⁶ cells/ml
Costs Leukapheresis 10,000a $/batch
Buffer costs (HesPan, PBS, NaCl, magnetic separation
buffer, magnetic separation rinsing buffer)
0.14; 0.04;
0.36; 2.1;
2.1
$/ml
Separation beads 245 $/ml
Activation bead 298 $/ml
Viral vector (lentivirus; retrovirus) 3; 0.3 $/ 1M IFU
Retronectin 518 $/mg
Elutriation consumables 1,964 $/set
Cell wash consumables 480 $/set
Cell magnetic separation set 2,218 $/set
DMSO 1.8 $/ml
Cryopreservation bags (20ml – 270ml) 17.8 - 25 $/bag
QC materials 10,000 $/dose
Transportation 3,000 $/dose
TALEN costs 6,500,000 $/g
Electroporation buffer 0.78 $/ml
Electroporation unit 32,350 $/unit a(Meehan et al. 2000)

221
5.2.3 Key assumptions for different platforms for autologous CAR T-cell
manufacture
The metrics used to evaluate different platforms for autologous CAR T-cell manufacture
were COG/dose, personnel requirement and facility footprint. The annual demands
considered in this analysis range between 100 and 10,000 doses per year of 5M to 500M
cells.
Figure 5.2 Schematic representation of the differences between the autologous and
allogeneic processes modelled in this chapter.

222
The manufacturing platforms evaluated in this chapter are composed of a combination of
technologies currently available on the market, which were previously described in
Chapter 1 (Section 1.5). The sequence in which these technologies are employed within
each manufacturing platform can be found in Figure 5.1 and a summary of the
characteristics of the different manufacturing platforms considered in this chapter is
shown in Table 5.3. The fundamental difference between these manufacturing platforms
is the cell culture vessel used during the cell culture stage. Moreover, the manufacturing
platforms also require different facility designs and labour efforts. In order to compute
the labour costs for the different manufacturing platforms, six different labour categories
were considered (Table 5.1). These categories were: process operator, supervisors &
managers, QCtesting scientists, QCmonitoring scientists, QA scientists and QP.
Process operators correspond to the operators that carry out the day-to-day tasks of the
core process. The number of process operators required was calculated taking into
account the degree of automation incorporated in each manufacturing platform. In this
case study, the manufacturing platforms were divided into three categories: manual
(multilayer flasks, gas permeable flasks and suspension bags), semi-automated (rocking
motion bioreactor and hollow fibre bioreactor) and fully automated (integrated USP/DSP
platform). A ratio between the number of process operators per team and the maximum
number of batches in parallel that a single team can process was applied. This ratio was
assumed to be 3:2, 2:2 and 2:6 for the manual, semi-automated and fully automated
platforms respectively. The number of managers and supervisors were computed as a
function of the number of process operators.
The QCtesting scientists are responsible for batch release testing. The number of QCtesting
personnel was calculated under the assumption that each QCtesting can process up to 2
batches in parallel. The QCmonitoring scientists are responsible for analysing samples for
environment monitoring. The number of QCmonitoring scientists are calculated according to
223
the number of cleanrooms within the facility. In this case study, it was assumed that each
QCmonitoring scientist was capable of looking after 2 cleanrooms simultaneously. The
number of cleanrooms within the facility is dependent on the number of batches that can
be manufactured per cleanroom. As a risk-mitigation strategy against cross-
contamination, the number of cleanrooms varied according to the manufacturing platform
used. For manual platforms that require open processing (multilayer flasks), the
maximum number of batches per cleanroom was assumed to be 1. Manual platforms that
do not require open processing (static suspension bags and gas permeable vessels) would
allow for up to 5 batches to be manufactured in parallel per cleanroom. This number was
doubled for semi-automated and closed manufacturing platforms (rocking motion
bioreactor and hollow fibre bioreactor) and increased by 4-fold in processes employing
fully automated closed platforms (integrated USP/DSP platform). QA engineers are
responsible for reviewing the documents generated by the QC team. In this case study, it
was a assumed that the ratio between QA engineers and QC scientists was 1:2. In Europe,
a QP is required for batch certification prior to final release and sale. In this analysis, the
number of QPs within a facility was calculated assuming that each QP could certify 2
batches manufactured in parallel.
As seen in Chapter 3, most manufacturing platforms do not require open processing and
therefore can be operated in a “Grade C” environment. The manufacturing platform using
multilayer flasks is the only platform evaluated in this case study that requires open
processing. Therefore, biosafety cabinets surrounded by “Grade B” rooms were assumed
to be in place when using this platform.

224
Table 5.3 Manufacturing platform-specific assumptions for the CAR T-cell case study
Manufacturing
platform Abbreviation Type
Vessel
volume
(L)
Vessel
Capacity
(cells/
cell
culture
vessel)
No of
operators
per team:
lots in
parallel
ratio
Max no
of
batches
per
room
Vessel
costs
Incubator
requirement
Biosafety
cabinet
requirement
Dedicated
equipment
costs
Multilayer flask MLF Manual 0.025-
3.14
175M -
22B 3:2
1 $2 -
$241 Y Y -
Static
suspension bag SSB Manual 0.05-3
350M -
21B 3:2
5 $57 -
$198 Y N -
Gas permeable
vessel GPV Manual
0.07-
3.6
500M -
25B 3:2
5 $50 -
$950 Y N $15,000
Hollow fibre
bioreactor HFB
Semi -
automated 0.2 1.4B 2:2
10 $1,200 Y N $150,000
Integrated
USP/DSP
platform
INT Automated 0.4 2.8B 2:6 10
$2512 N N $235,500
Rocking motion
bioreactor RMB
Semi -
automated 3.14-20
22B –
140B 2:2
20 $326 -
$713 Y N $47,500/$70,000

225
FCI costs were estimated using the detailed factorial methodology for estimating FCI and
footprint for bespoke cell therapy facilities described on Chapter 2 Section 2.3 and
applied in Chapter 3. It was assumed that incubators with the capacity to hold 5 batches
(1 batch her shelf) were in place when multilayer flasks, gas permeable vessels and static
suspension bags were in use. The summary of the assumptions used to compute the labour
and facility-related costs is shown in Table 5.4.
Table 5.4 General assumptions used to compute the indirect costs of CAR T-cell products
Parameter Value Unit
Scenario No of active days 330 Days/year Process length (lentivirus, retrovirus) 13; 15 Days Time spent in cleanroom per shift 6.4 Hours Depreciation period 7 Years
Mass balance &
sizing
No batches per QC operator 2 -
No cleanrooms per QCmonitoring
scientist
No QA scientist: QC scientist 0.5 -
No batches per QP 2 - No supervisors & managers: no of
process operators
0.7 -
No gowns used per operator per day 4 -
Max no cells per final purification
cycle
5 × 10¹⁰ -
Max no purification cycles per
magnetic purification unit per shift
2 -
Max no batches per QC lab 10 -
Costs Annual salary 120,000 $/operator Gowning costs (Grade B ; Grade C) 60; 45 $/gown Facility energy costs 637 $/m2 /year
Capacity of shared equipment (A; B,
C, D, E, F)
2; 5; 4; 2; 2;4 Batches/ unit
Cost of shared equipment (A; B, C,
D, E, F)
12.8; 13.4; 62.4; 79.5;
55; 32.4
$‘000s/ unit
Cryofreezer capacity 1.8 L
Cryofreezer costs 30 $’000s/ unit
A= Biosafety cabinet; B= 5-shelve incubator; C= Elutriation system; D= Spinning membrane
filtration; E= Magnetic selection system; F = Electroporation system
226
5.2.4 Key assumptions for commercial feasibility scenario of autologous CAR T-cell
products under current reimbursement constraints
Following the identification of COG/dose, the commercial feasibility of CAR T-cell
products manufactured using different manufacturing platforms was investigated under
current reimbursement strategies. In this analysis, autologous CAR T-cell products with
an annual demand of 10,000 doses of 50M and 5000M cells were considered.
As estimating a suitable reimbursement for CAR T-cell products is a challenge at present,
the commercial feasibility of the different manufacturing platforms was evaluated by
calculating the selling price required to reach COG as % sales of 15% and 40% and
comparing these to the selling prices of current autologous CAR T-cell therapy products
on the market. COG as 15% of sales has been established as the standard for traditional
biopharmaceutical products and COG as 40% of sales has been proposed as a benchmark
for autologous cell therapy products (Smith 2012b).
5.2.5 Key assumptions for multi-site manufacture scenario for patient-specific cell
therapy products
Chapter 1 (Section 1.7.6) highlighted some of the challenges associated with centralised
manufacture of patient-specific products, which included complex supply chain and poor
response to market demand. This section will explore the economic benefit to the inventor
company of multiple alternative facility configurations for the manufacture of an
autologous CAR T-cell product with an annual demand of 10,000 doses of 500M cells.
This analysis was carried out using the cash flow model described in Chapter 2 (Section
2.8). This model was set to assess the long term benefits of different facility
configurations by assessing important trade-offs in FCI, financial risk and rNPV caused
by a number of factors including facility start-up costs (tech transfer, comparability
studies, facility validation and site license etc.), transportation costs, potential fees paid
to the administration and/or manufacturing site. The FCI was attained from the detailed

227
factorial methodology for estimating FCI and footprint for bespoke cell therapy facilities
described in Chapter 2 Section (2.3) which was adapted to account for multi-site
configurations. Financial risk was evaluated by computing the minimum selling price for
which NPV = 0 where a high selling price was associated with high risk; and the rNPV
was computed by discounting future cash flows by a discount rate that relates to the risk
associated the project and the company’s cost of capital.
In this case study, a sales ramp-up was assumed of 40% in years 1 and 2, 70% in years 3
and 5 and 100% from year 6 after market release of the CAR T-cell product. It was also
assumed that in multi-site facility configuration the facilities were built in response to
annual demand whilst in the centralised manufacture facility configuration it was
assumed that a single facility with adequate capacity for product manufacture at 100%
market penetration would be in place as soon as the product was released into the market.
The selling price used in this analysis was the selling price that resulted in a COG as %
sales of 40% when using the integrated USP/DSP platform to manufacture 10,000 doses
per year of 50M cells. The integrated USP/DSP platform was selected for this analysis as
it was the platform with the lowest COG/dose in the selected commercialisation scenario
and it was the only manufacturing platform that resembled a fully integrated and
automated platform for end-to-end CAR T-cell therapy manufacture.
In order to provide a complete cash flow analysis the development costs were included in
the cash flow model and assumed to be absorbed by the inventor company, even though
these costs did not differ across facility configurations. The development costs included
in this analysis were clinical trials costs (Phase I to Phase III), technology transfer costs,
comparability studies, product stability studies and process development. The clinical
trials costs were estimated according to the number of patients treated at each stage, the
overheads costs per patient and the COG/dose of the CAR T-cell product generated by

228
the bioprocess economics model for scenarios with annual demands of 10 (Phase I), 50
(Phase II) and 100 (Phase III) patents. In this case study, it was assumed that the stability
studies and comparability studies were carried out using the materials generated during
clinical trials, process performance qualification batches (PPQ) and engineering runs.
Moreover, additional assay costs for these studies were also considered. The technology
transfer costs, and process development costs were computed based on the number of
fulltime equivalent (FTE) personnel required to carry out these tasks.
Furthermore, this case study also considers facility preparation costs. These costs were
also assumed absorbed by the inventor company. The facility preparation costs included
in this analysis were site license, engineering runs and PPQ batches and additional
technology transfer and comparability studies. The site license costs included comprised
all the costs related to acquiring a license for cell therapy manufacture, which included
validation activities. The costs associated with engineering runs and PPQ batches were
attained from the process economics model. In this case study it was assumed that 5
engineering runs and 3 PPQ batches were carried out per manufacturing site.
The facility configurations investigated in this case study were: centralised, decentralised,
hospital site and “GMP-in-a-box” manufacture. The key characteristics of these facility
configurations are summarised in Table 5.5. In the centralised facility configuration, it
was assumed that a single facility would cater for the whole market and that the inventor
company would be responsible for all costs related to providing the product, from tissue
acquisition to transportation to the administration site. In return, the inventor company
would retain the full revenue from product sales. A similar model was applied in the
decentralised manufacture configuration; this time however, a single facility was replaced
by multiple identical sites resulting in a higher proximity between the manufacturing site
and the administration site, which decreases the transportation costs.

229
Table 5.5 Key characteristics of the centralised and different multi-site facility configurations
Parameter Centralised Decentralised Hospital site “GMP-in-a-box”
Batch failure rate 5% 5% 5% 5%
Revenue 100% Sales 100% Sales 100% Sales 95% Sales
FCI Equipment + Facility Equipment + Facility Equipment Equipment
Development costs
Clinical trials
Development stage tech transfer
Process development
Product stability tests
Clinical trials
Development stage tech transfer
Process development
Product stability tests
Clinical trials
Development stage tech transfer
Process development
Product stability tests
Clinical trials
Development stage tech transfer
Process development
Product stability tests
Facility prep costs
Facility insurance
Commercial stage tech transfer
Comparability studies
Site license
Engineering runs
PPQ batches
Facility insurance
Commercial stage tech transfer
Comparability studies
Site license
Engineering runs
PPQ batches
Commercial stage tech transfer
Comparability studies
Site license
Engineering runs
PPQ batches
Commercial stage tech transfer
Comparability studies
Site license
Engineering runs
PPQ batches
Running costs Materials
Labour
Facility & equipment overheads
QC
Materials
Labour
Facility & equipment overheads
QC
Materials
Facility charge
Labour
Equipment overheads
QC
Materials
Equipment overheads
QC
Hospital charge
Transportation costs $3,000/dose $1,500/dose - -

230
In the hospital site configuration, the product manufacture activities were moved to
existing cleanrooms within the administration site rented by the inventor company for a
fixed annual fee (referred to as facility charge). For this facility configuration, it was
assumed that the inventor company would be responsible for providing the adequate
personnel, equipment and materials for product manufacture and that it would retain full
revenue from product sales. As the product manufacture and administration were
collocated, the transportation costs were nullified.
In the “GMP-in-a-box” facility configuration, it was assumed that a single fully
integrated and automated equipment that requires minimal manipulation for “end-to-end”
manufacture of CAR T-cell products was provided to the administration sites by the
inventor company along with all the materials required for the manufacturing process.
Given the degree of automation of this hypothetical platform, it was assumed that the
hospital staff would be able to operate this fully automated equipment for a fee of 5% of
the revenue from each dose (referred to as hospital charge).
For all multi-site manufacture scenarios, two different QC strategies were modelled-
centralised and decentralised QC testing. In the decentralised QC scenario, QC labs were
present in each manufacturing site whilst in the centralised QC scenario a single QC lab
was shared across the different manufacturing sites with the aim of increasing the
utilization of the lab facilities and personnel such as to reduce costs. The key assumptions
used in the case study are summarised in Table 5.6.

231
Table 5.6 General NPV assumptions for facility configuration case study
Parameter Value Unit
Market penetration 40% (years 1-2); 70% (years 3-5); 100% (years 6-10) -
Running costs Facility charge (hospital site only) 1.20 × (Facility depreciation + Facility maintenance costs + Facility monitoring costs) $/y
Hospital charge (“GMP-in-a-box” only) 0.05 × sales
Facility insurance 0.01 × FCI -
Sales and marketing (S&M) 10% of sales/y
Corporate tax 24% of taxable
income
Development
costs Process development 500,000 (Phase I); 500,000 (Phase II); 1,500,000 (Phase III) $
Technology transfer 500,000 (Phase I); 500,000 (Phase II); 1,500,000 (Phase III) $
Product stability 50,000 (Phase I); 40,000 (Phase II) $
Number of patients for clinical trials 10 (Phase I); 50 (Phase II); 100 (Phase III) -
Autologous clinical trials (centralised,
decentralised and hospital site) 87,584 (Phase I); 41,116 (Phase II); 39,281 (Phase III) $
Autologous clinical trials (“GMP-in-a-
box”) 168,399 (Phase I); 95,283 (Phase II); 94,141 (Phase III) $
Allogeneic clinical trials 159,377 (Phase I); 42,105 (Phase II); 27,163(Phase III) $
Facility prep
costs PPQ batches
3 × 39,281 ( autologous: centralised, decentralised and hospital site); 3 × 94,141
(autologous: “GMP-in-a-box”); 3 × 27,163 (allogeneic: centralised and decentralised ) $/site

232
Engineering runs 5 × 39,281 ( autologous: centralised, decentralised and hospital site); 5 × 94,141
(autologous: “GMP-in-a-box”); 5 × 27,163 (allogeneic: centralised and decentralised ) $/site
Technology transfer 1,500,000 $/site
Comparability studies 350,000 $/site
Site license 3,000,000 $/site
Risk Clinical failure risk 0% (Phase I); 13% (Phase II); 45% (Phase III); 64% (Commercial stage) -
Other Discount rate 10% -

233
5.2.6 Key assumptions for allogeneic versus autologous CAR T-cell therapy products
scenario
The final scenario investigated the cost-effectiveness of allogeneic CAR T-cell products
with respect to autologous CAR T-cell products under the assumption that both
autologous and allogeneic CAR T-cell therapy products would achieve comparable safety
and efficacy profiles. The annual demands considered in this comparison ranged between
100-10,000 doses of 5M-500M cells. In this analysis, process flows with lentivirus for
genetic editing were considered for both autologous and allogeneic processes. For
autologous processes, the optimal manufacturing platform (with the lowest COG/dose)
for each commercialisation scenario was compared against allogeneic processes using the
rocking motion bioreactor. This platform was selected with the aim of maximising
economics of scale given that this is the manufacturing platform with the highest capacity
(Table 5.3)
As previously mentioned, a final magnetic purification step is required in allogenic
processes such as to minimise the risks of GvHD. Current technologies for magnetic
purification have limited capacity (5 × 10¹⁰ cells/cycle) and in situations where the
number of cells produced during cell culture exceeded the maximum number of cells that
the DSP could handle, it was assumed that the excess cells would be discarded.
As previously mentioned, this case study assumed that the maximum number of cells that
can be retrieved from a donor is 1.67 × 10¹⁰ which results in a total cell number of 5.26 ×
1011 after the cell culture step. Given the current capacity contains of technologies for
magnetic separation of T-cells, it is clear that the cells produced during cell culture will
overwhelm the DSP process. Hence the effect of using multiple magnetic purification
units in parallel was explored. Moreover, the benefits of re-sizing the manufacturing
process according to the constraints of the DSP process such as to minimize the number
of magnetic purification units used while avoiding discarding cells was also investigated.
234
5.3 Results and discussion
This section analyses and discusses the results from the case studies highlighted in the
previous section. The case studies provide useful insights to some of the critical questions
faced by cell therapy developers when designing a manufacturing strategy for CAR T-
cell therapy products. The questions addressed in these case studies included operational
and economic benefits of manufacturing platforms, commercial feasibility under current
reimbursement limits, long term benefits of multi-site manufacture of patient-specific
products and cost benefits of allogeneic CAR T-cell therapy products.
5.3.1 Identifying and understanding current COG of autologous CAR T-cell therapy
products
Understanding the trends in COG and how these change across commercialisation
scenarios and manufacturing strategies is key to making informed decisions during early
stages of the process development. Figure 5.3 shows how the COG/dose of processes
using different manufacturing platforms and viral vectors varies with increasing dose size
and annual demand. Figure 5.3 shows that for autologous CAR T-cell therapy products,
COG/dose varies between $60,000 and $160,000 and that both the availability of
manufacturing platforms for autologous CAR T-cell manufacture and the COG/dose
increase with dose size. The COG/dose shown in Figure 5.3 seem to be well in line with
the costs reported for autologous CAR T-cell therapy products which range between
$45,000 and $150,000 (Reuters 2015).
For lower doses sizes (5M cells), Figure 5.3 indicates that the static suspension bag is the
manufacturing platform that offers the lowest COG. As the dose size increases to 50M
cells, the integrated USP/DSP platform becomes the most cost-effective manufacturing
platform and at larger dose sizes of 500M cells, the rocking motion bioreactor provides
the lowest COG/dose. This trend remains unchanged irrespectively of the annual demand
and viral vector selected for gene editing.

235
Figure 5.3 COG/dose for CAR T-cell products manufactured using different manufacturing platforms across different
commercialisation scenarios for lentivirus-based processes and γ-retrovirus-based processes. MLF = multilayer flasks.
SSB = static suspension bags¸ GPV = gas permeable vessel, HFB = hollow fibre bioreactor, INT = integrated USP/DSP
platform and RMB = rocking motion bioreactor.

236
The number of candidate manufacturing platforms increases with increasing dose size
due to a constraint placed in this case study which states that the utilization of the cell
culture vessel used during cell culture must be 10% or higher for that manufacturing
platform to be considered. Figure 5.3 indicates that for a dose size of 5M cells, which
translates into a ~20ml and ~30ml cell culture for lentivirus-based and γ-retrovirus-based
processes respectively, the only manufacturing platforms that are suited for such small
cell culture volumes are the multilayer flasks, static suspension bags and gas permeable
vessels. Higher cell culture volumes are required with γ-retrovirus-based processes as
these have lower transduction efficiencies and hence additional cells must be processed
in order to achieve the same number of transduced T-cell per dose (Table 5.2). In this
scenario, static suspension bags is the platform with the lowest COG/dose with a marginal
advantage with respect to gas permeable vessels (~1%). The higher cost-effectiveness of
these platforms with respect to the multilayer flasks is attributed to the fact that indirect
costs (labour, gowning and facility-related costs) dominate the COG/dose of autologous
CAR T-cell therapy products with small dose sizes. Given that multilayer flasks require
the use of biosafety cabinets in a “Grade B” environment the indirect costs associated
with this platforms are higher than for the other candidate platforms.
For lentivirus-based processes, increasing the dose size further to 50M cells (~190ml and
~280ml of cell culture volume for lentivirus and γ-retrovirus-based processes
respectively) allows the integrated USP/DSP platforms and the rocking motion bioreactor
to appear in the list of candidate technologies. In these medium dose size scenarios, the
integrated USP/DSP platform becomes the most cost-effective option, due to the lower
labour costs associated with the platform.
At the highest dose size scenario of 500M cells (which translated into cell culture volumes
of 1.9L and 2.8L for lentivirus and γ-retrovirus processes respectively), multiple cell
culture vessels were required in order to meet the batch size with the hollow fibre
237
bioreactor and the integrated USP/DSP platform due to capacity constraints, making these
the least cost-effective platforms. The number of hollow fibre bioreactors required per
batch was as high as 10 (lentivirus process) – 14 ( γ-retrovirus). The integrated USP/DSP
platform has a higher capacity than hollow fibre bioreactors, hence a lower number of
cell culture vessels per batch was required (5 and 7 for lentivirus and γ-retrovirus
respectively).
A single rocking motion bioreactor is capable of coping with large dose sizes of 500M
cells for both lentivirus and γ-retrovirus-based processes. This combined with the fact
that the rocking motion bioreactor has lower labour costs than manual platforms makes
the rocking motion bioreactor the optimal manufacturing platform for CAR T-cell therapy
products with this high dose size.
Increasing the annual demand to 10,000 doses per year has no effect on the trends seen
in both lentivirus and γ-retrovirus processes as the dose size has a higher effect on the
COG/dose than the annual demand. This is due to the poor economies of scale
characteristic of the scale-out model applied to autologous processes.
The relative contribution of the different factors which influence the COG changes
significantly with dose size; understanding the effect of these different factors will help
identify where to focus development efforts. Figure 5.4 shows the cost breakdown by
major supply chain activity, manufacturing process step and cost category with increasing
dose size when the annual demand is 10,000 patients.

238
Figure 5.4 COG breakdown at medium and high doses across different
manufacturing platforms for an annual demand of 10,000 doses per year. a) COG
breakdown by activity, b) COG breakdown by process step and c) COG breakdown
by cost category (for the manufacturing process only). MLF = multilayer flasks, SSB
= static suspension bags¸ GPV = gas permeable vessel, HFB = hollow fibre
bioreactor, INT = integrated USP/DSP platform and RMB = rocking motion
bioreactor. Medium dose = 50M cells, high dose = 500M cells.

239
Figure 5.4 a) shows that at a medium dose (50Mcells), for all viral vector-manufacturing
platform combinations, the major supply chain activities with the highest COG are the
core process activities (38%-54% of COG), product release testing (28%-38% of COG)
and the collection and testing of the leukapheresis sample (13%-19% of COG). As the
dose size increases, so does the materials costs required during the manufacturing process,
which causes for the manufacturing process to have a higher effect on COG (47%- 71%).
When taking a closer look into the manufacturing process, Figure 5.4 b) shows that the
process step with the highest labour and materials costs is the product release testing step
(32% - 58% of COGMFG) followed by the cell culture step (20% -51%) and the gene
editing step ( 3% - 17%). This is due to the fact that product release testing requires
dedicated labour and the cell culture is the longest step and therefore has the highest core
process-related labour costs.
As the dose size increases from 50M cells to 500M cells, the relative contribution of the
gene editing step towards the COGMFG increases for all viral vector-manufacturing
platform combinations (from 3% - 5% of COGMFG to 3% - 17% of COGMFG). In
lentivirus-based processes this is attributed to the higher quantities of viral vector used
and in γ-retrovirus-based processes the increase in gene editing costs is caused by the
higher use of retronectin.
These trends are confirmed by Figure 5.4 c), which shows the manufacturing cost
breakdown by cost category with increasing dose size. Figure 5.4 c) shows that the
relative contribution of viral vector costs towards the COGMFG increases in lentivirus-
based processes from 1% - 2% of COGMFG to 8% - 14% of COGMFG. In γ-retrovirus-
based processes the increase in the relative contribution of the retronectin costs towards
the COGMFG is seen by the increase of the reagent cost as a proportion of COGMFG from
2%-4% to 5% - 12% of COGMFG.

240
Figure 5.4 c) also shows that the cost category with the highest effect on the COG for all
manufacturing platforms at lower dose sizes of 50M cells is the labour costs (33% - 55%
of COG). This is due to the manual nature of current processes for autologous CAR T-
cell manufacture combined with the scale-out approach used for patient-specific
therapies. The relative contribution of this cost category is magnified in medium dose size
scenarios where the material costs are lower.
As previously mentioned, at high dose sizes of 500M cells multiple hollow fibre
bioreactors and integrated USP/DSP platforms are required per batch during cell culture.
Figure 5.4 c) shows clearly the effect of capacity constraints of manufacturing platforms
through the dramatic increase in facility overheads costs as a proportion of the total COG
seen for these manufacturing platforms with increasing dose size. The relative cost
contribution of the facility-related costs increases from 14% to 36% for hollow fibre
bioreactors and 21% to 46% for integrated USP/DSP platform.
5.3.2 Operational features of manufacturing platforms for autologous CAR T-cell
manufacture
While COG/dose is an excellent parameter to base manufacturing process decisions on,
in autologous CAR T- cell process there are many other parameters that must be
considered when selecting a platform for product manufacture. Moreover, when working
with autologous products for high annual demand applications, the number of batches
manufactured in parallel rapidly increases increasing the personnel number and the
facility footprint. This section investigates the personnel and facility footprint when
different manufacturing platforms are used to manufacture a CAR T-cell therapy with a
dose size of 50M cells across annual demands of 100 patients and 10,000 patients.
Figure 5.5 a) shows that the facility footprint required for autologous CAR T-cell
manufacture changes with annual demand, viral vector and manufacturing platform. For

241
lentivirus-based processes the facility footprint changes from 200m2 (multilayer flasks) -
400m2(integrated USP/DSP platform) to 13,500m2 – 33,300m2 when moving from an
annual demand of 100 patients per year to 10,000 patients per year. The values for facility
footprint achieved in γ-retrovirus-based processes are higher. This is due to the fact that
γ-retrovirus-based processes were assumed to be longer (Figure 5.1) and hence a higher
number of batches in parallel would be required to satisfy the same annual demand. The
facility footprint for γ-retrovirus-based processes ranged between 350m2 (static
suspension bags) – 550 m2 (multilayer flasks) and 18,200m2 – 38,000m2 for annual
demands of 100 and 10,000 patients respectively.
For both lentivirus-based and γ-retrovirus-based processes, Figure 5.5 a) shows that the
manufacturing platform with the highest facility footprint is the multilayer flaks. The
higher facility footprint achieved with multilayer flasks is caused by the use of biosafety
cabinets and the higher number of cleanrooms. The platform with the lowest facility
footprint is the integrated USP/DSP (lentivirus –based process) and the static suspension
bags (γ-retrovirus-based processes).
The integrated USP/DSP platform is an “all-in-one” platform which can carry out most
process steps within the manufacturing process and hence does not require most of the
additional shared equipment that are necessary in other manufacturing platforms (e.g.
incubators, spinning membrane filtration units and biosafety cabinets) resulting in a lower
facility footprint. When the integrated USP/DSP platform is used in γ-retrovirus
processes, the additional cells manufactured to compensate for the lower viral
transduction efficiency assumed for γ-retrovirus causes for multiple units of the integrated

242
USP/DSP platform to be required during cell culture which increases the facility
footprint.
Figure 5.5 a) Facility footprint across different manufacturing platforms and viral vectors
with increasing annual demand and a dose size of 50M cells. b) Breakdown of personnel
requirement with increasing annual demand. The numbers in the embedded table
correspond to working volume of the cell culture vessels in ml used during cell culture for
dose sizes of 50M and 500M cells. The number on top of each bar represents the ratio
between the number of process operators and the total personnel number within a facility.
MLF = multilayer flasks, SSB = static suspension bags¸ GPV = gas permeable vessel, HFB
= hollow fibre bioreactor, INT = integrated USP/DSP platform and RMB = rocking motion
bioreactor.

243
Figure 5.5 b) shows the breakdown of the different personnel categories modelled in the
chapter with increasing annual demand. This figure shows that the personnel number
increases from 11(integrated USP/DSP platform) – 30 (multilayer flask) and 750 – 2,500
as we move from 100 patients per year to 10,000 patients per year. This figure also shows
that the personnel number required is higher for γ-retrovirus-based processes and that the
ra tio between the different types of personnel changes with manufacturing platform.
For both lentivirus-based and γ-retrovirus-based processes, the integrated USP/DSP
platform has the lowest personnel requirement. This is due to the degree of automation
incorporated into this manufacturing platform, which results in lower process operator
numbers and a high ratio of total personnel number to operator number (5.5 – 7). For all
other manufacturing platforms, core process staff are the highest contributors toward the
total staff number.
The multilayer flask is the platform with the highest staff number. This is due to a
combination of poor automation (which increases the number of process operators) and
high number of processing rooms (which increases the number of QCmonitoring scientists).
The ratio between total personnel number and process operator number ranges between
3.5 and 3.8 for this platform.
Static suspension bags and gas permeable vessels have the second highest personnel
number. This is due to the fact that these platforms are manual and hence require a
relatively high number of process operators. The ratio between total personnel number
and process operators are lower for these platforms than for multilayer flasks due to the
lower number of facility monitoring staff (2.7 and 3).
Rocking motion and hollow fibre bioreactors are semi-automated platforms and therefore
have the second lowest number of process operators. This combined with a lower number

244
of facility monitoring staff results in similar rations between total personnel number and
process operators to multilayer flasks (3.1 and 3.8).
5.3.3 Assessing the commercial feasibility of autologous CAR T-cell products
This section aims at investigating the commercial feasibility of CAR T-cell products
manufactured using the platforms considered in this thesis by measuring the selling price
for which COG is 15% and 40% of sales and comparing this selling price with the price
of current autologous CAR T-cell therapy products in the market.
To date only two autologous CAR T-cell products that have received approval for market
release. These products are Yescarta® (Kite Pharma, Los Angeles, CA, USA) and
Kymriah® (Novartis, Basel, Switzerland). Yescarta® is a CAR T-cell product targeted at
adult large B-cell lymphoma and is priced at $373,000 per treatment (Clarke & Berkrot
2017; Herper 2017; Ramsey 2017). Kymriah® is a CAR T-cell therapy targeted at B-cell
Figure 5.6 Minimum selling price for which COG is 15% (grey bar) and 40% (black bar)
sales across different manufacturing platforms and viral vectors. The dashed lines
represent the reimbursement for current autologous CAR T-cell products in the market –
Kymriah (red) and Yescarta (yellow). The commercialisation scenario selected is of an
annual demand of 10,000 patients and dose sizes of 50M and 500M cells. MLF =
multilayer flasks, SSB = static suspension bags¸ GPV = gas permeable vessel, HFB =
hollow fibre bioreactor, INT = integrated USP/DSP platform and RMB = rocking motion
bioreactor.

245
acute lymphoblastic leukaemia in children and young adults and is priced at $475,000 per
treatment (Sagonowsky 2017b; Mukherjee 2017; Lauerman & Paton 2017).
Figure 5.6 shows that for a medium dose size of 50M cells, in order for COG as 40%
sales to be achieved, the selling prices applied must be $130,000 - $185,000. If lower
COG as % sales of 15% are to be achieved, then the selling prices must increase to
$350,000 - $495,000. These selling prices are well in line with the reimbursement values
applied to current autologous CAR T-cell therapy products.
For autologous CAR T-cell products with higher dose sizes of 500M cells, the selling
prices required to achieve COG as 40% of sales are again in line with current products in
the market ($165,000 - $370,000). However, if the target COG as % sales is reduced to
15%, Figure 5.6 shows that the chances of achieving this cost target with the current
reimbursement applied to autologous CAR T-cell products will be highly dependent on
the manufacturing platform employed. The selling prices required to reach COG as 15%
of sales for a CAR T-cell product with a dose size of 500M cells are between $370,000
and $980,000. The platforms that fail to meet this cost target under current reimbursement
strategies applied to autologous CAR T-cell products are the multilayer flasks, hollow
fibre bioreactor and integrated USP/DSP platform. This trend is attributed to the high
facility-related costs associated with these platforms. For multilayer flasks, this is caused
by the use of biosafety cabinets in “Grade B” environment and for hollow fibre bioreactor
and integrated USP/DSP platforms, this trend is caused by the requirement of multiple
units per batch due to capacity constraints. This underlines the importance of selecting
the correct platform for autologous CAR T-cell manufacture.

246
5.3.4 Assessing the risk, reward and investment of different strategies for multi-site
manufacture of CAR T-cells
Multi-site manufacture can be presented in different configurations such as decentralised
facility manufacture, hospital site manufacture and bedside “GMP-in-a-box”
manufacture. The economic benefit of each of these strategies with respect to a single
centralised facility will be evaluated in this section under different QC strategies when
the number of manufacturing sites is varied between 5 and 50. The scenario selected for
this analysis was of an annual demand 10,000 patients per year and a dose size of 50M
cells. The manufacturing platform selected for this scenario was the integrated USP/DSP
platform and the selling price selected was $150,000, as this is the selling price which
results in a COG of ~ 40% of sales ( COG/dose = $53,000).
Figure 5.7 shows the relationship between rNPV, capital investment and financial risk of
different facility configurations for autologous CAR T-cell manufacture. Given that the
same selling price was applied across all facility configurations, the differences in NPV
are caused by the net present costs associated with the different strategies. The detailed
breakdown of these costs is shown in Figure 5.8. This figure shows that the economic
benefit of multi-site facility configurations decreases with increasing number of sites and
it is maximised when QC testing for all sites is carried out in a single facility. Moreover,
in the scenario presented in this case study, the “GMP-in-a-box” and the hospital site
manufacture configuration provide very similar economic benefits.
In multi-site facility configurations, when the number of manufacturing is set to 5, Figure
5.7 shows that the decentralised manufacture is the only facility configuration which has
a higher capital investment than the centralised facility configuration. Figure 5.7 also
shows that with a low number of sites, all multi-site facility configurations offer a higher
rNPV and lower risk than a centralised facility.
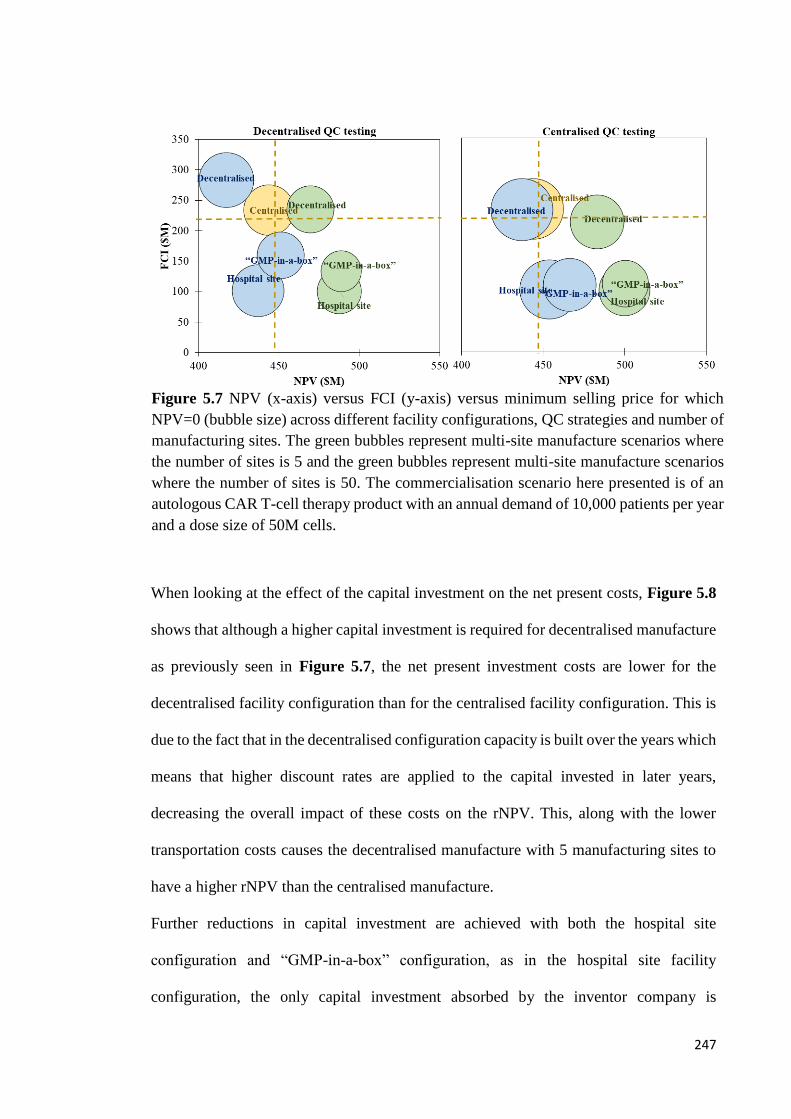
247
When looking at the effect of the capital investment on the net present costs, Figure 5.8
shows that although a higher capital investment is required for decentralised manufacture
as previously seen in Figure 5.7, the net present investment costs are lower for the
decentralised facility configuration than for the centralised facility configuration. This is
due to the fact that in the decentralised configuration capacity is built over the years which
means that higher discount rates are applied to the capital invested in later years,
decreasing the overall impact of these costs on the rNPV. This, along with the lower
transportation costs causes the decentralised manufacture with 5 manufacturing sites to
have a higher rNPV than the centralised manufacture.
Further reductions in capital investment are achieved with both the hospital site
configuration and “GMP-in-a-box” configuration, as in the hospital site facility
configuration, the only capital investment absorbed by the inventor company is
Figure 5.7 NPV (x-axis) versus FCI (y-axis) versus minimum selling price for which
NPV=0 (bubble size) across different facility configurations, QC strategies and number of
manufacturing sites. The green bubbles represent multi-site manufacture scenarios where
the number of sites is 5 and the green bubbles represent multi-site manufacture scenarios
where the number of sites is 50. The commercialisation scenario here presented is of an
autologous CAR T-cell therapy product with an annual demand of 10,000 patients per year
and a dose size of 50M cells.
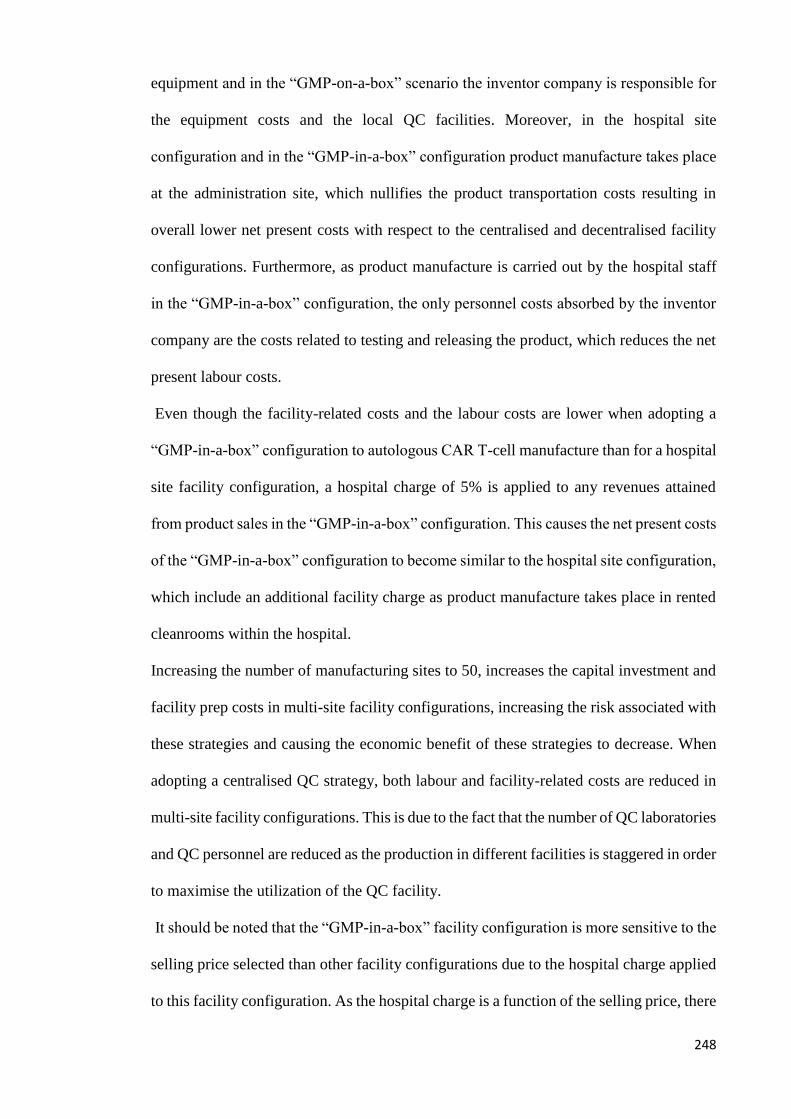
248
equipment and in the “GMP-on-a-box” scenario the inventor company is responsible for
the equipment costs and the local QC facilities. Moreover, in the hospital site
configuration and in the “GMP-in-a-box” configuration product manufacture takes place
at the administration site, which nullifies the product transportation costs resulting in
overall lower net present costs with respect to the centralised and decentralised facility
configurations. Furthermore, as product manufacture is carried out by the hospital staff
in the “GMP-in-a-box” configuration, the only personnel costs absorbed by the inventor
company are the costs related to testing and releasing the product, which reduces the net
present labour costs.
Even though the facility-related costs and the labour costs are lower when adopting a
“GMP-in-a-box” configuration to autologous CAR T-cell manufacture than for a hospital
site facility configuration, a hospital charge of 5% is applied to any revenues attained
from product sales in the “GMP-in-a-box” configuration. This causes the net present costs
of the “GMP-in-a-box” configuration to become similar to the hospital site configuration,
which include an additional facility charge as product manufacture takes place in rented
cleanrooms within the hospital.
Increasing the number of manufacturing sites to 50, increases the capital investment and
facility prep costs in multi-site facility configurations, increasing the risk associated with
these strategies and causing the economic benefit of these strategies to decrease. When
adopting a centralised QC strategy, both labour and facility-related costs are reduced in
multi-site facility configurations. This is due to the fact that the number of QC laboratories
and QC personnel are reduced as the production in different facilities is staggered in order
to maximise the utilization of the QC facility.
It should be noted that the “GMP-in-a-box” facility configuration is more sensitive to the
selling price selected than other facility configurations due to the hospital charge applied
to this facility configuration. As the hospital charge is a function of the selling price, there
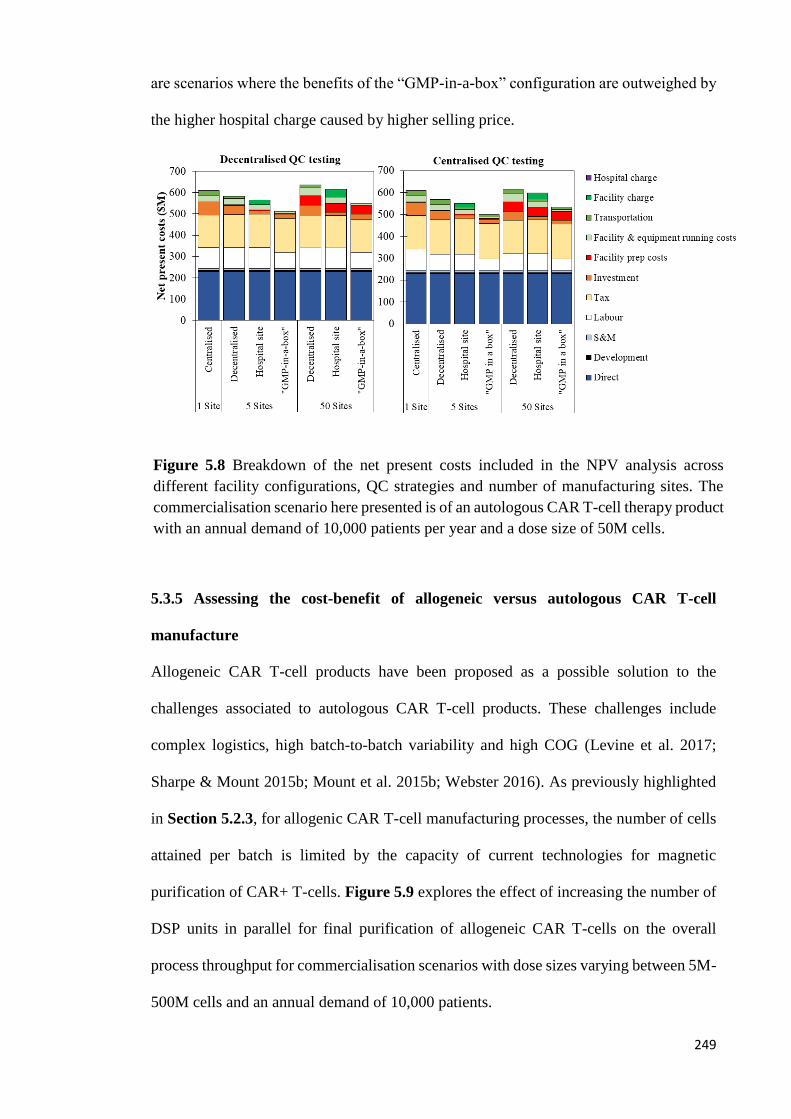
249
are scenarios where the benefits of the “GMP-in-a-box” configuration are outweighed by
the higher hospital charge caused by higher selling price.
5.3.5 Assessing the cost-benefit of allogeneic versus autologous CAR T-cell
manufacture
Allogeneic CAR T-cell products have been proposed as a possible solution to the
challenges associated to autologous CAR T-cell products. These challenges include
complex logistics, high batch-to-batch variability and high COG (Levine et al. 2017;
Sharpe & Mount 2015b; Mount et al. 2015b; Webster 2016). As previously highlighted
in Section 5.2.3, for allogenic CAR T-cell manufacturing processes, the number of cells
attained per batch is limited by the capacity of current technologies for magnetic
purification of CAR+ T-cells. Figure 5.9 explores the effect of increasing the number of
DSP units in parallel for final purification of allogeneic CAR T-cells on the overall
process throughput for commercialisation scenarios with dose sizes varying between 5M-
500M cells and an annual demand of 10,000 patients.
Figure 5.8 Breakdown of the net present costs included in the NPV analysis across
different facility configurations, QC strategies and number of manufacturing sites. The
commercialisation scenario here presented is of an autologous CAR T-cell therapy product
with an annual demand of 10,000 patients per year and a dose size of 50M cells.
250
As the cells attained per donor is fixed (1.67 × 10¹⁰ cells), the number cells produced at
the end of the cell culture process is also constant (7.20 × 10¹¹ cells). Therefore, as the
dose size increases the number of doses produced per batch decreases and the number of
batches per year required to reach a particular annual demand (doses/year) increases.
Figure 5.9 shows that increasing the number of DSP units used in parallel per batch
increases the number of doses produced per batch as less cells are being discarded after
cell culture and hence decreases the number of batches required per year. Figure 5.10
and 5.11 illustrate the effect of dose size, annual demand and number of DSP purification
units on the cost-effectiveness of allogeneic CAR T-cell products as the ratio of
COG/dose of autologous to COG/dose of allogeneic products vary between 0.73 and 118.
These figures show that the cost-effectiveness of allogeneic CAR T-cell products
increases with annual demand and decreases with dose size.
Figure 5.10 shows that when comparing the COG/dose of an autologous CAR T-cell
product against an allogeneic product with a dose size of 5M cells/dose and an annual
demand of 100 patients per year, the indirect costs (labour & facility and equipment
Figure 5.9 Number of doses produced per batch and number of batches required per year
in order to fulfil an annual demand of 10,000 patients across different DSP strategies for
allogeneic CAR T-cell products with different dose sizes. Allo = allogeneic, 1_DSP = 1
magnetic purification unit/batch, 3_DSP = 3 magnetic purification units/batch and 6_DSP
= 6 magnetic purification units/batch.

251
overheads) dominate the COG. Moreover, if in the same commercialisation scenario the
maximum number of DSP units available per batch is set to 1, the costs of producing the
allogeneic product are 43% lower than the costs of the autologous product. If the
allogeneic process is re-sized to fit a single DSP unit, allogenic processes become even
more cost-effective, as the costs of allogeneic products become 54% lower than for
autologous products. This trend is explained by the fact that autologous products have
higher labour, materials, QC and transportation costs as only one dose is produced per
batch.
Increasing the number of DSP units available for the allogeneic process to 3, increases
the facility-related costs and the labour costs as extra personnel would be required to
operate the additional DSP units. At a low annual demand, these additional costs are
spread over a limited number of doses, reducing the making allogeneic products only 6%
cheaper than autologous products. Further increasing the number of DSP units in parallel
for allogeneic CAR T-cell manufacture to 6, increases the indirect costs even further,
making allogeneic cell therapy products 45% more expensive than autologous products.
When the annual demand is increased to 10,000 doses, allogenic CAR T-cell products
become more cost-effective than autologous products even in scenarios where the number
of DSP units in parallel is 6. This is explained by the fact that at higher annual demands,
the additional indirect costs caused by the higher number of DSP units are spread over a
higher number doses. When allowing 6 DSP units in parallel resulting in a maximum of
12 cycles/batch (two cycles/ unit/ shift), the COG/dose of allogeneic CAR T-cell products
remains unchanged whether the process is resized or not. This is due to the fact that the
number of cycles required to process one batch (5.26 × 10¹¹ cells) is 11 and hence no cells
are discarded in both scenarios. For autologous products, little change in COG/dose is
achieved with increasing annual demand as previously seen in Figure 5.3.

252
Figure 5.10 COG breakdown across two different annual demands dose sizes. Auto = autologous, Allo = allogeneic,
_DSP = 1 magnetic purification unit/batch, 3_DSP = 3 magnetic purification units/batch, 6_DSP = 6 magnetic purification
units/batch and Resized = cell culture process resized accroding to DSP limitations.
.
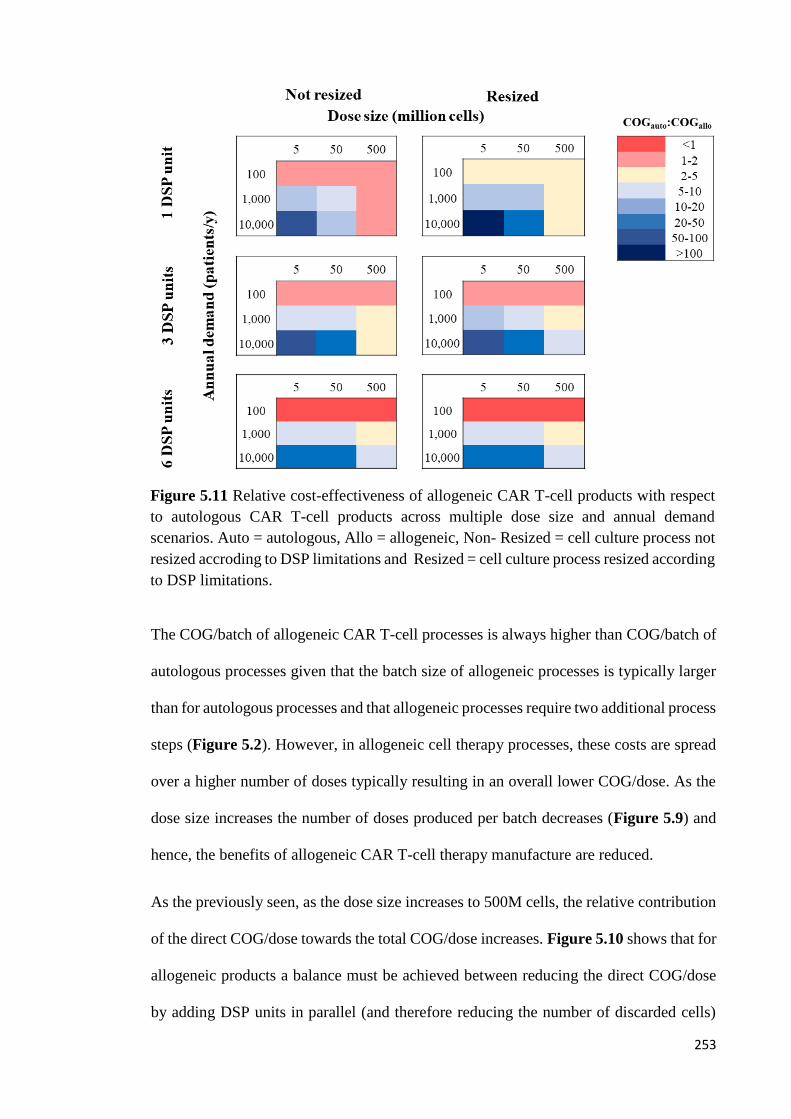
253
The COG/batch of allogeneic CAR T-cell processes is always higher than COG/batch of
autologous processes given that the batch size of allogeneic processes is typically larger
than for autologous processes and that allogeneic processes require two additional process
steps (Figure 5.2). However, in allogeneic cell therapy processes, these costs are spread
over a higher number of doses typically resulting in an overall lower COG/dose. As the
dose size increases the number of doses produced per batch decreases (Figure 5.9) and
hence, the benefits of allogeneic CAR T-cell therapy manufacture are reduced.
As the previously seen, as the dose size increases to 500M cells, the relative contribution
of the direct COG/dose towards the total COG/dose increases. Figure 5.10 shows that for
allogeneic products a balance must be achieved between reducing the direct COG/dose
by adding DSP units in parallel (and therefore reducing the number of discarded cells)
Figure 5.11 Relative cost-effectiveness of allogeneic CAR T-cell products with respect
to autologous CAR T-cell products across multiple dose size and annual demand
scenarios. Auto = autologous, Allo = allogeneic, Non- Resized = cell culture process not
resized accroding to DSP limitations and Resized = cell culture process resized according
to DSP limitations.

254
and reducing the indirect COG/dose by reducing equipment and personnel numbers.
Hence, at smaller annual demands of 100 patients per year, it is optimal to reduce the
number of DSP units in parallel for the reasons mentioned. However, as the annual
demand increases and the direct COG dominate the COG/dose, it is optimal to increase
the number of DSP units and resize the process according to the DSP limitations so as to
reduce the number of batches in parallel and reduce the number of cells discarded after
the cell culture process.
5.4 Conclusions
This chapter aimed at assessing the economic and operational benefit of different
strategies for CAR T-cell manufacture and at providing useful benchmarks for decision
making during early development stages of CAR T-cell therapy products such as to
enhance the commercial feasibility of these therapies. The case studies discussed in this
chapter tackled some of the critical questions facing CAR T-cell therapies developers.
These questions were related to the selection of the optimal manufacturing platform,
optimal facility configuration and optimal donor source (autologous v allogeneic).
The results show that the COG/dose for autologous CAR T-cell products vary between
$60,000 and $160,000 and that the dose and the manufacturing platform used have a
greater effect on the COG/dose than the annual demand. Moreover, the analysis also
revealed that given the current reimbursement strategies for CAR T-cell cell therapy
products, technology selection is a crucial factor to be taken into account when designing
a manufacturing strategy for these products. The need to selected adequate manufacturing
platforms for autologous CAR T-cell products is magnified if there is pressure to reduce
the current selling price; in such cases additional development would be required in order
to achieve successful commercialisation of autologous CAR T-cell products.

255
The economic benefits of multi-site manufacture were clearly underlined in this chapter.
This benefit changes significantly with the number of manufacturing sites and the facility
configuration selected. Hence, it is very important to identify the optimal combination of
these factors when selecting a facility configuration.
The results have also revealed that the cost-effectiveness of allogenic CAR T-cell
products increases with increasing annual demand and decreases with increasing dose
size. Therefore, it is important to consider the commercialisation scenario when selecting
the donor source for CAR T-cell products. Moreover, the results also highlighted the
current limitations of technologies for magnetic purification of allogeneic CAR T-cell
products and that addressing these constraints will yield significant cost reductions.

256
Chapter 6: Conclusions and Future Work
6.1 Introduction
This thesis has discussed the creation and application of advanced decisional tools for
tackling some of the critical challenges facing cell therapy companies with the aim of
providing useful insights on how different aspects of the manufacturing strategy can be
optimized to enhance the commercial feasibility of these products. A series of case studies
were carried out addressing multiple factors to be considered when designing a
manufacturing strategy for cell therapy products including technology selection,
reimbursement constraints, fixed capital investment (FCI) and facility configuration with
the specific example of mesenchymal stem cell (MSC) and chimeric antigen receptor
(CAR) T-cell products. This chapter summarises the key contributions from the thesis
and suggests further steps to extend this research.
6.2 A technology-specific detailed factorial method for estimating facility footprint
and FCI with benchmark cost and area factors for cell therapy facilities
6.2.1 Key contributions
Chapter 3 provided short-cut methods for facility footprint and FCI estimates. These
methods are highly tailored to cell therapy facilities as they consider their unique features
including technology considerations, manufacturing mode (scale-up versus scale-out),
facility layout and cleanroom classification. The method proposed for FCI calculation
(the cost factor method) resembles the “Lang factor” approach used for biotech/pharma
facilities, while the method proposed for estimating facility footprint (the area factor
method) is based on a novel factorial approach where the user can compute the facility
footprint of bespoke cell therapy facilities using the costs of the core process equipment.

257
In the method described in Chapter 3 two different ratios were provided for FCI and
facility footprint estimation – the cost factor and the area factor. The cost factor is the
ratio between the FCI and the core process equipment costs (e.g. incubators and skids).
The area factor is the ratio between the core process equipment costs and the facility
footprint. As the different technologies for cell therapy manufacture have significantly
different characteristics, the detailed factorial methodology for estimating FCI and
footprint for bespoke cell therapy facilities described in Chapter 2 Section 2.3 was used
to compute technology-specific cost and area factors so as to increase the accuracy of the
estimates. The estimates attained using the detailed factorial methodology for estimating
FCI and footprint for bespoke cell therapy facilities were successfully validated against
values provided by an engineering company for the same scenario. Moreover, the case
study was extended to capture additional project-specific features of cell therapy facilities
such as the geographic location of the facility and the initial condition of the building site
(e.g. greenfield v refurbishment).
The results revealed that the cost factors varied between 2-12 and the area factors varied
between 800$/m2-7,000$/m2 depending on the project specifications (e.g. annual
throughput, technology selected, geographic location). The results showed also that the
parameter that has the greatest effect on both cost factor and area factor is the combination
of technologies (manufacturing platform) selected for cell therapy manufacture.
Platforms with high equipment costs per unit footprint have higher area factors and lower
cost factors and vice versa. These results clearly illustrate the need for bespoke methods
such as this for estimating footprint and capital investment for cell therapy facilities.
6.2.2 Future work
Even though, multiple manufacturing platforms were included in the case study described
in Chapter 3, a number of manufacturing steps were excluded from the analysis as
emphasis was put in the cell culture step. Further research could explore the change in the

258
costs and area factors when technologies for magnetic purification, electroporation, filling
and cryopreservation are considered. Moreover, the fact that the emphasis of this case
study was placed on the cell culture technologies meant that the technologies for pre and
post cell culture steps remained constant across manufacturing platforms. Future work
could explore also the effect on the FCI and facility footprint when, for example, the
fluidised bed centrifuge for cell wash and concentration is replaced with tangential flow
filtration systems. Moreover, the mass balance and sizing of equipment for the chapter
was carried out for a fixed process schedule. The number of equipment units required
may vary significantly with the process schedule employed. For example, if multiple
batches are to be harvested simultaneously, the number of DSP units required would be
higher than if the batches were staggered. Future research could capture also the effect of
different process schedules on resource requirement. Finally, in this chapter, it was
assumed that manufacturing facilities modelled would not include provisions for buffer
and media preparation and that these reagents would come pre-formulated into the facility
as this is common practice in the cell therapy industry. In the future, companies may opt
to produce these reagents in-house and hence further research could explore the trade-
offs of in-house buffer and media preparation.
6.3 Impact of allogeneic stem cell manufacturing decisions on cost of goods,
process robustness and reimbursement
6.3.1 Key contributions
Chapter 4 aimed at providing a novel holistic approach to evaluate the operational and
economic benefits of different candidate technologies for the manufacture of MSCs with
emphasis on the cell culture process. This chapter also aimed at identifying performance
targets to be reached in order to overcome economic challenges and/or operational
constraints which may affect the commercial feasibility of these products. This was
achieved by using different components of the decisional tool described in Chapter 2 to

259
compute operational and economic metrics such as COG, FCI and probability of reaching
optimal COG. These components were the process economics model, the Monte Carlo
model and the multi-attribute decisional-making model. The candidate technologies
included in this study were the multilayer flasks, multi-plate bioreactors, hollow fibre
bioreactors and microcarriers in stirred tanks.
The results showed that the COG/dose of allogeneic cell therapies decreases with annual
demand and planar manufacturing platforms are most cost-effective at smaller scales (≤
1B cells/batch) whilst microcarrier systems are more cost-effective at medium to large
scales (10-100B cells/batch). The results highlighted also that when considering both
economic and operational features, multi-plate and microcarriers in stirred tanks compete
closely even at higher manufacturing scales but ultimately microcarriers in stirred tanks
are the optimal technology for large-scale expansion of MSCs.
Moreover, this study shows that the market penetration for MSC-based products with
high dose sizes is constrained by the capacity limitations of current DSP technologies and
that significant process optimization is required in order for commercial success of these
therapies to be achieved under current reimbursement limits. This work has clearly shown
that, in order for cell therapy products to be commercially successful, manufacturing
platform selection must be carried out with the commercialisation scenario (annual
demand & dose size) in mind. Moreover, this study has also illustrated the use of
decisional tools for identifying process bottlenecks and ways to overcome these.
6.3.2 Future work
As the emphasis of this case study was also placed on the technologies for expansion of
MSCs, the potential cost-benefits of alternative DSP technologies was not captured.
Future work could focus on evaluating the operational and economic trade-offs of using
TFF systems for cell wash and concentration and of using Harvestainer® for microcarrier
removal. In this chapter, the issues related to the use of microcarriers for MSC cell culture

260
were highlighted as well as how some of these issues may be addressed with the use of
alternative methods for suspension cell culture of MSCs such as spheroids and aggregate
cell culture and injectable/ thermosensitive microcarriers. Future work could aim to assess
the operational and economic implications of the use of these alternative methods for
suspension cell culture of MSC products.
Furthermore, this case study assumed that adequate cell banks were in place for MSC cell
culture without considering costs of cell bank development and the typical size of MSC
cell banks. Future work could aim to capture the costs of developing MSC cell banks as
well as any potential constraints in cell number that may affect the maximum scale of the
cell culture step.
6.4 Addressing the challenges to the successful commercialization of CAR T-cell
products
6.4.1 Key contributions
Chapter 5 employs the bioprocess economics tool described in Chapter 2 to provide the
first in-depth economics analysis for CAR T-cell product at an technology level and an
enterprise’s facility configuration level. This chapter addresses some of the key
challenges faced by companies aiming to designing strategies for autologous CAR T-cell
therapy manufacture. The topics addressed in this chapter included technology selection,
resource requirement, reimbursement, facility configuration and cell source selection
(autologous v allogeneic). This also provides a visualisation of the personnel numbers
and facility footprint required for commercial scale manufacture of patient-specific cell
therapy products with high annual demands.
The results have shown that the COG/dose of autologous CAR T-cell products range
between $60,000-$160,000 depending on the manufacturing platform selection, viral
vector used for gene editing and the commercialisation scenario and that the parameters

261
with the highest effect on the COG/dose are the dose size and manufacturing platform.
This chapter also shows that under the reimbursement applied to the autologous CAR T-
cell therapy products currently available in the market (~$400,000), low COG as % sales
levels of 15% are achievable with current manufacturing processes. However, if the
reimbursement limits are to be lowered to $150,000, then products with high dose sizes
would struggle to be commercially successful highlighting the need to develop cell
therapy products with lower dose sizes.
The results also revealed the effect of manufacturing platform selection on the personnel
number and facility footprint for a given commercialisation scenario; personnel number
estimates varied by 3-fold and facility footprint estimates varied by 2.5-fold depending
on the manufacturing platform selected.
This chapter shows also that the economic benefit of different strategies for multi-site
manufacture of autologous CAR T-cell products is highly dependent on the number of
sites built. Moreover, the results have also shown that the cost-effectiveness of allogeneic
CAR T-cell products with respect to autologous CAR T-cell products varies significantly
with the commercialisation scenario selected. This chapter has also highlighted the batch
size of allogeneic CAR T-cell products is limited by current capacity constraints of DSP
technologies for magnetic purification.
This study is another example of how commercial success of cell therapy products is
contingent on the selection of the correct manufacturing platform and that the
commercialisation scenario is a crucial factor to be considered when designing a
manufacturing strategy for cell therapy products. These findings can help guide CAR T-
cell therapy developers in selecting the optimal manufacturing strategy according to their
product specifications.

262
6.4.2 Future work
The case study in Chapter 5 focused on evaluating the trade-offs of different platforms
for autologous CAR T-cell manufacture with emphasis on the technology used during the
cell culture step and hence, the technologies used for pre and post cell culture steps were
kept constant across different manufacturing platforms. Future work could explore the
benefits of different technologies for pre and post cell culture steps (e.g. replacing the
spinning membrane filtration system for cell wash and concentration with a centrifuge).
This case study has revealed that the labour costs are one of the major cost drivers in
autologous CAR T-cell processes. A number of different personnel categories were
included in this case study such as process operators, QA & QC scientists and QP.
However, a number of additional personnel categories were excluded from the case study
such as facility managers, supply chain managers and engineers. Future work could aim
to capture all the different personnel categories within a cell therapy facility in order to
evaluate the full effect of the labour costs on the total COG. Moreover, multiple
companies are currently looking to automation in order to reduce labour costs and
promote process robustness. Future research could also capture the economic and
operational trade-offs of implementing automation in autologous CAR T-cell
manufacture.
Operator-handling is not the only cause of batch-to-batch variability in autologous cell
therapy processes. The patient cells can also be a source of variability. Moreover, in CAR
T-cell therapy, doses are typically given as a function of the patient weight; hence, future
work could investigate the effect of these variables on the suitability of different
technologies for autologous CAR T-cell manufacture.
One of the key benefits of adopting a decentralised approach to the manufacture of
biopharmaceutical products is the potentially higher market penetration as different

263
facilities can be designed to comply with the regulatory bodies in different geographic
regions. This advantage was not captured in this case study, as it was assumed that all
facilities were situated in Europe. Future work could aim to capture the implications of
the geographic location of the facilities for autologous CAR T-cell manufacture such as
reimbursement levels, market penetration and the requirement for QP for batch release.
When comparing the relative cost-effectiveness of allogeneic CAR T-cell products with
respect to autologous products, an assumption was made that these products were equally
safe and efficacious. Future research could investigate if this assumption is accurate once
more information on the clinical performance of allogeneic products is available. If this
data shows that allogeneic CAR T-cell products do not perform as well as autologous
products, then additional research is required in order to evaluate how the dose size and
reimbursement of allogeneic products would compare to autologous products.
The series of case studies described in this thesis have highlighted the role of decisional
tools in enabling commercial success of cell therapy products as they have illustrated the
key factors to be considered when designing different aspects of the manufacturing
strategy for cell therapy products. This research has provided also benchmark values and
short-cut methods for estimating parameters such as FCI, facility footprint, COG/dose
and personnel numbers. These findings can be implemented early on within process
development of cell therapy products enabling companies to save time and money.

264
Chapter 7: Process Validation in Cell Therapy
7.1 Introduction
Like in traditional biopharmaceutical products, process validation in cell therapy is a
complex task, which involves the validation of different aspects of the cell therapy facility
and manufacturing process that may affect the quality of the product. These aspects
include equipment, materials and cleanrooms. Process validation often takes place at the
same time as the Phase III of clinical trials. In order to achieve successful validation of a
cell therapy product, it is crucial to understand the features of the product. Cell therapy
products are significantly more complex than traditional biopharmaceutical products and
parameters such as dose size, potency, impurities and formulation must be considered
early on in the process development (Shanley 2015). Moreover, considering technology
selection early on within the process development so as to identify the most cost-effective
platform for cell therapy manufacture can result in significant cost and time savings by
avoiding the need for major process change applications (Hassan et al. 2016). This thesis
has demonstrated how decisional tools can provide a fast and cost-effective framework
for evaluating different manufacturing strategies early on within process development.
A Quality by Design approach (QbD) is often applied during the validation process of
cell therapy products. QbD allows for comprehensive and methodical understanding of
the product and the manufacturing process (Shanley 2015). The QbD process starts when
quality target product profile is identified (QTPP). This is a collection of the wanted
product characteristics, such as identity and shelf life.
The identification of the QTTP is followed by the identification of the critical quality
attributes of the product (CQAs) such as potency and purity (Shanley 2015; Lipsitz et al.

265
2016; Davie et al. 2012). Some of these characteristics have to be defined as early as
phase II of clinical trials (Food and Drugs Administration 2003). The potency of the
product provides information of its in vivo activity (Lipsitz et al. 2016) and the purity of
the product is related to the safety of the product (Lipsitz et al. 2016). In order to identify
these CQAs suitable assays must be developed to carryout adequate tests such as
microbiological tests (Mycoplasma, sterility testing, adventitious agent texting), identity,
purity, potency, viability, etc. (Food and Drugs Administration 2003).
After the recognition of the CQAs, the critical process parameters are identified (Lipsitz
et al. 2016). These are the parameters that may influence the safety and efficacy of the
product. Subsequent to the identification of the critical process parameters a design space
is established which shows how changes in the parameters may influence the CQAs
(Lipsitz et al. 2016).
The design space can be identified through the use of a design of experiment approach
(DoE) (Campbell et al. 2015). The next stage is to create a control strategy which keeps
the process parameters within the ranges which do not affect the quality of the product
(Lipsitz et al. 2016). A schematic representation of QbD applied to cell therapy is shown
in Figure 7.1. This chapter will briefly highlight some of the validation challenges facing
cell therapy companies with emphasis in the two types of cell therapy products that were
discussed in this thesis: allogeneic mesenchymal stem cell-based cell therapy products
and chimeric antigen receptor cell therapy products.

266
Figure 7.1 Schematic representation of a QbD process. Adapted from Lipsitz et al. (2016).

267
7.2 Validation challenges in cell therapy
As previously mentioned, cell therapy products are typically manufactured using single-
use technologies. Even though the use of such technologies has the benefit of a shorter
cleaning validation processes, as the parts that come into contact with the product are
thrown away after each batch, the use of single-use technologies have additional
validation issues which must be carefully addressed in order to ensure that the product is
safe to administered to patients.
One of the key validation issues related to the use of single-use technologies is the
potential release of leachables and extractables into the product (Flaherty & Perrone 2012;
Levine et al. 2012; Langer & Rader 2014). As cells cannot be sterilized, it is very
important to demonstrate that the levels of leachables and extractables in the final form
of the product are within the pre-defined acceptable range.
Most technologies currently available for cell therapy manufacture, require high levels of
manual handling, which can potentially increase batch-to-batch variability. Sources for
batch-to-batch variability are not limited to the manufacturing process and include the
cell bank used and the cryostorage. During the validation process companies must
demonstrate consistency across batches. Potential strategies to address this issue include
the implementation of automated systems. Doing so however will increase the capital
investment and development costs which may discourage smaller companies. Moreover,
automation in combination with fully closed systems also eases the validation process for
companies aiming to manufacture cell therapy products across multiple sites as a risk-
mitigation strategy.

268
In autologous CAR T-cell therapy, the patient is the donor and hence sources of variability
may occur before the product enters the manufacturing facility (e.g. different centres may
adopt different leukapheresis protocols) as well as after the product has left the
manufacturing facility (e.g. the adoption of different thawing techniques). As the quality
of the starting material for CAR T-cell manufacture is a crucial factor in achieving a
successful batch, autologous CAR T-cell products may only be available in selected
clinical sites such as to increase the success rate of these therapies (Davie 2013; Trainor
et al. 2014; Flinn et al. 2016). Moreover, the quality of the starting material can also be
affected by the patient itself. Patient-specific factors affecting the quality of the starting
material include the progression of the illness as well as previous treatments undergone
by the patient. This may difficult achieving consistent results when running the process
performance qualification (PPQ) batches required during the validation process.
In allogeneic cell therapy, a single cell bank is used to manufacture multiple batches.
Due to limitation in the expansion potential of mesenchymal stem cells, it is unlikely that
a single cell bank will be employed throughout the lifecycle of the product. Hence,
multiple cell banks may be required. As the quality of mesenchymal stem cells changes
depending on multiple factors such as the cell source, age and health of the donor, it is
crucial to screen carefully these cell banks in order to ensure that they meet the adequate
standards for product manufacture. Moreover, it is also important to consider that each
new cell bank must be validated which requires time and money.
The reagents used during the manufacturing process of cell therapy products can also be
a source for variation. For example, multiple companies use serum-containing media.
Different batches of serum provided by the vendors may contain slightly different

269
characteristics and thus adding to the high number of factors that must be taken into
account when validating a cell therapy process.
A number of the factors mentioned above have been accounted for in the case studies
described in this thesis. These include the development costs characteristic of cell therapy
products, which were considered in the net present value calculations in Chapter 5.
Moreover, the batch-to-batch variability characteristic of different processes for cell
therapy manufacture was accounted for in Chapter 4. This chapter also underlines the
reductions in batch-to-batch variability achieved through the implementation of
automation.
270
References
Ab Kadir, R. et al., 2012. Characterization of mononucleated human peripheral blood
cells. TheScientificWorldJournal, 2012, p.843843. Available at:
http://www.ncbi.nlm.nih.gov/pubmed/22666162 [Accessed May 9, 2017].
Abou-El-Enein, M. et al., 2013. Good Manufacturing Practices (GMP) manufacturing of
advanced therapy medicinal products: a novel tailored model for optimizing
performance and estimating costs. Cytotherapy, 15(3), pp.362–383. Available at:
http://www.ncbi.nlm.nih.gov/pubmed/23579061 [Accessed December 28, 2016].
Acesurgical, Osteocel Plus: The cellular advantage. Available at:
http://www.acesurgical.com/index.php/downloads/dl/file/id/8/info_ace_osteocel.pd
f [Accessed May 6, 2017].
Adis Insight, 2016a. Adipose stem cell therapy - Anterogen -. Available at:
http://adisinsight.springer.com/drugs/800033751 [Accessed May 5, 2017].
Adis Insight, 2016b. Mesenchymal stem cell therapy for cartilage repair - Medipost -
AdisInsight. Available at:
http://adisinsight.springer.com/drugs/800034605#disabled [Accessed May 5, 2017].
Ahmed, N. et al., 2015. Human Epidermal Growth Factor Receptor 2 (HER2) -Specific
Chimeric Antigen Receptor-Modified T Cells for the Immunotherapy of HER2-
Positive Sarcoma. Journal of clinical oncology : official journal of the American
Society of Clinical Oncology, 33(15), pp.1688–96. Available at:
http://ascopubs.org/doi/10.1200/JCO.2014.58.0225 [Accessed May 15, 2017].
Alliance for Regenerative medicine, 2014. Regenerative medicine annual industry report
2014, Available at:
https://alliancerm.org/sites/default/files/ARM_Annual_Report_2014.pdf [Accessed
May 8, 2017].
Alliance for Regenerative Medicine, 2013. Regenerative Medicine Annual Report. ,
(March 2012), pp.1–71.
Andon, N., 2017. The Role of Automation in Cell Therapy Commercialization -
MedCision. Medcision. Available at: http://www.medcision.com/automation-cell-
therapy-commercialization/ [Accessed May 27, 2017].
Anon, 2012. Cell Therapy and Regenerative Medicine Glossary. Regenerative Medicine,
7(3s), pp.S1–S124. Available at:
http://www.futuremedicine.com/doi/10.2217/rme.12.38 [Accessed May 2, 2017].
Apel, M. et al., 2013. Integrated clinical scale manufacturing system for cellular products
derived by magnetic cell separation, centrifugation and cell culture. Chemie-
Ingenieur-Technik, 85(1–2), pp.103–110.
Appelbaum, F.R., 2007. Hematopoietic-Cell Transplantation at 50. New England Journal
of Medicine, 357(15), pp.1472–1475. Available at:
http://www.nejm.org/doi/abs/10.1056/NEJMp078166 [Accessed May 2, 2017].
Areadevelopment, 2015. Belgium-Based Cardio3 BioSciences To Open Facility In
Rochester, Minnesota - Area Development. www.areadevelopment.com. Available
at: http://www.areadevelopment.com/newsItems/3-3-2015/cardio3-biosciences-
rochester-minnesota423355.shtml [Accessed March 16, 2017].
Argos therapeutics, 2014. Argos Therapeutics Announces Plans for New Manufacturing

271
Facility in Research Triangle Park Area in Durham, North Carolina. sec.gov.
Available at:
https://www.sec.gov/Archives/edgar/data/1105533/000117184314004610/newsrel
ease.htm [Accessed March 16, 2017].
Ascierto, P., Stroncek, D. & Wang, E., 2015. Developments in T cell based cancer
immunotherapies,
Aubert, J. et al., 2003. Screening for mammalian neural genes via fluorescence-activated
cell sorter purification of neural precursors from Sox1-gfp knock-in mice.
Proceedings of the National Academy of Sciences, 100(Supplement 1), pp.11836–
11841. Available at: http://www.ncbi.nlm.nih.gov/pubmed/12923295 [Accessed
May 25, 2017].
Bajgain, P. et al., 2014. Optimizing the production of suspension cells using the G-Rex
"M" series. Molecular Therapy — Methods & Clinical Development,
1(10). Available at: http://ac.els-cdn.com/S2329050116300808/1-s2.0-
S2329050116300808-main.pdf?_tid=ea96ac50-1254-11e7-a390-
00000aacb35e&acdnat=1490554338_3884c3d0f7a8ee32fc3388dd8195b5a2
[Accessed March 26, 2017].
Bang, O.Y. et al., 2016. Adult Stem Cell Therapy for Stroke: Challenges and Progress.
Journal of Stroke, 18(3), pp.256–266. Available at: http://j-
stroke.org/journal/view.php?doi=10.5853/jos.2016.01263 [Accessed May 13,
2017].
Barak, B. & Bader, B., 2008. Lifecycle Cost Analysis for Single-Use Systems. Biopharm
International. Available at: http://www.biopharminternational.com/lifecycle-cost-
analysis-single-use-systems [Accessed February 22, 2017].
Barrett, D., Grupp, S. & June, C., 2015. Chimeric Antigen Receptor– and TCR-Modified
T Cells Enter Main Street and Wall Street. The Journal of Immunology, 195(3).
Available at: http://www.jimmunol.org/content/195/3/755 [Accessed May 16,
2017].
Barry, S. et al., 2000. Lentiviral and murine retroviral transduction of T cells for
expression of human CD40 ligand. Human gene therapy, 11(2), pp.323–32.
Available at: http://www.ncbi.nlm.nih.gov/pubmed/10680845.
Bartholomew, A. et al., 2002. Mesenchymal stem cells suppress lymphocyte proliferation
in vitro and prolong skin graft survival in vivo. Experimental Hematology, 30(1),
pp.42–48. Available at:
http://www.sciencedirect.com.libproxy.ucl.ac.uk/science/article/pii/S0301472X010
0769X [Accessed May 9, 2017].
Beatty, G. et al., 2014. Mesothelin-Specific Chimeric Antigen Receptor mRNA-
Engineered T Cells Induce Antitumor Activity in Solid Malignancies. Cancer
Immunology Research, 2(2). Available at:
http://cancerimmunolres.aacrjournals.org/content/2/2/112.short [Accessed May 15,
2017].
Bell Potter, 2011. Phase II success in heart failure. , pp.1–9. Available at:
http://202.66.146.82/listco/au/mesoblast/analystrep/ar111115.pdf [Accessed May
13, 2017].
Bello, Y., Falabella, A. & Eaglstein, W., 2001. Tissue-engineered skin. Current status in
wound healing. American journal of clinical dermatology, 2(5), pp.305–13.
Available at: http://www.ncbi.nlm.nih.gov/pubmed/11721649 [Accessed May 6,

272
2017].
Berard, M. & Tough, D., 2002. Qualitative differences between naïve and memory T
cells. Immunology, 106, pp.127–138.
Berenson, R., 2003. XCYTE THERAPIES INC (Form: S-1, Received: 10/10/2003
17:31:55). www.nasdaq.com. Available at:
http://www.nasdaq.com/markets/ipos/filing.ashx?filingid=2378531 [Accessed
March 16, 2017].
Bernardo, M. et al., 2013. Mesenchymal Stromal Cells: Sensors and Switchers of
Inflammation. Cell Stem Cell, 13(4), pp.392–402. Available at:
http://www.ncbi.nlm.nih.gov/pubmed/24094322 [Accessed May 9, 2017].
Bersenev, A., 2016a. Stem Cell Blog - Why price for cell/ gene therapy products is so
high? | Cell Trials. Cell trials Current trends in cell therapy. Available at:
http://celltrials.info/2016/09/06/pricing/ [Accessed May 5, 2017].
Bersenev, A., 2012. Stem cell therapeutic products on the market. Stem cell assays.
Available at: http://stemcellassays.com/2012/02/stem-cell-therapeutic-products-
market/ [Accessed May 6, 2017].
Bersenev, A., 2016b. Will Prodigy change everything ? Stem cell assays. Available at:
http://stemcellassays.com/2016/08/will-prodigy-change-everything/.
Bianco, P., 2014. “Mesenchymal” Stem Cells. Annual Review of Cell and Developmental
Biology, 30(1), pp.677–704. Available at:
http://www.ncbi.nlm.nih.gov/pubmed/25150008 [Accessed May 9, 2017].
BioDlogics, 2014. BioDFactor. Available at:
http://www.biodlogics.com/technology/biod-factor [Accessed May 5, 2017].
biopharm services Limited, 2014. Mab manufacturing today and tomorrow,
Biosafe, Sepax(R) system - brochure, Available at: http://www.biosafechina.com/wp-
content/uploads/2011/12/1992MD_Sepax_technology_brochure_lowres.pdf
[Accessed December 24, 2016].
Le Blanc, K., 2003. Immunomodulatory effects of fetal and adult mesenchymal stem
cells. Cytotherapy, 5(6), pp.485–489. Available at:
http://linkinghub.elsevier.com/retrieve/pii/S1465324903711190 [Accessed May 13,
2017].
Le Blanc, K. et al., 2008. Mesenchymal stem cells for treatment of steroid-resistant,
severe, acute graft-versus-host disease: a phase II study. The Lancet, 371(9624),
pp.1579–1586. Available at:
http://www.sciencedirect.com/science/article/pii/S014067360860690X [Accessed
May 12, 2017].
Bone therapeutics, 2013. Bone Therapeutics invests in cell therapy manufacturing
facility. Bone therapeutics. Available at:
http://www.bonetherapeutics.com/upload/files/20130225_Bone_Therapeutics_Pres
s_Release.pdf [Accessed March 16, 2017].
Borowski, M. et al., 2008. Basic pluripotent stem cell culture protocols, Harvard Stem
Cell Institute. Available at: http://www.ncbi.nlm.nih.gov/pubmed/23658979
[Accessed May 22, 2017].
Boyman, O. & Sprent, J., 2012. The role of interleukin-2 during homeostasis and
activation of the immune system. Nature Reviews Immunology, 12(3), pp.180–90.
Available at: http://www.ncbi.nlm.nih.gov/pubmed/22343569 [Accessed December
24, 2016].

273
Bozenhardt, E., 2017. Cell Therapy: Facility Design. Pharmaceutical Processing.
Available at: http://www.pharmpro.com/blog/2017/03/cell-therapy-facility-design
[Accessed May 26, 2017].
Bozenhardt, H. & Bozenhardt, E., 2017. Designing The Cell Therapy Facility Of The
Future. Bioprocess online. Available at:
https://www.bioprocessonline.com/doc/designing-the-cell-therapy-facility-of-the-
future-0001 [Accessed March 9, 2017].
Brandenberger, R. et al., 2011. Cell Therapy Bioprocessing Integrating Process and
Product Development for the Next Generation of Biotherapeutics. Bioprocess
International, Supplement, pp.30–37. Available at:
http://www.bioprocessintl.com/wp-
content/uploads/2014/07/BPI_A_110901SUPAR07_146731a.pdf [Accessed May
4, 2017].
Bravery, C.A., Are Biosimilar Cell Therapy Products Possible? Available at:
http://advbiols.com/documents/Bravery-AreBiosimilarCellTherapiesPossible.pdf
[Accessed October 23, 2017a].
Bravery, C.A., Regulatory Implications of Allogeneic Cell Banking Strategy. Available
at: http://advbiols.com/documents/BraveryAllogeneicCBstrategyAbstract31.pdf
[Accessed May 4, 2017b].
Brennan, D. & Golonka, K., 2002. Evolving Process Designs. , 80(September).
Brennan, Z., 2015. ImmunoCellular taps PharmaCell to manufacture dendritic cell-based
vaccine for trial. Outsourcing Pharma. Available at: http://mobile.outsourcing-
pharma.com/Product-Categories/Contract-Manufacturing/ImmunoCellular-taps-
PharmaCell-to-manufacture-dendritic-cell-based-vaccine-for-trial [Accessed March
16, 2017].
Brentjens, R., 2012. CARs and cancers: questions and answers. Blood, 119(17), pp.3872–
3873. Available at: http://www.ncbi.nlm.nih.gov/pubmed/22538493 [Accessed
December 24, 2016].
Brindley, D. et al., 2014. Cell Therapy Bioprocessing Technologies and Indicators of
Technological Convergence A Concise Review. BioProcess International, 12(1).
Available at: http://www.bioprocessintl.com/wp-content/uploads/2014/03/Tables-
BPI-vol12-is_231819a.pdf [Accessed May 24, 2017].
Brower, V., 2015. The CAR T-Cell Race | The Scientist Magazine®. Available at:
http://www.the-scientist.com/?articles.view/articleNo/42462/title/The-CAR-T-
Cell-Race/ [Accessed December 24, 2016].
Bubela, T. et al., 2015. Bringing regenerative medicines to the clinic: the future for
regulation and reimbursement. Regen. Med, 10(7), pp.897–911. Available at:
http://www.futuremedicine.com/doi/pdf/10.2217/rme.15.51 [Accessed May 25,
2017].
Bussolati, B., 2011. Stem cells for organ repair: support or replace? Organogenesis, 7(2),
p.95. Available at: http://www.ncbi.nlm.nih.gov/pubmed/21617365 [Accessed May
2, 2017].
Butler, M. et al., 2012. Ex Vivo Expansion of Human CD8+ T Cells Using Autologous
CD4+ T Cell Help D. Unutmaz, ed. PLoS ONE, 7(1), p.e30229. Available at:
http://dx.plos.org/10.1371/journal.pone.0030229 [Accessed March 24, 2017].
Bzjournals, 2009. Dendreon may put plant in Atlanta - Atlanta Business Chronicle.
bzjournals.com. Available at:

274
http://www.bizjournals.com/atlanta/stories/2009/07/13/daily99.html [Accessed
March 17, 2017].
Cameron, B. et al., 2013. Identification of a Titin-derived HLA-A1-presented peptide as
a cross-reactive target for engineered MAGE A3-directed T cells. Science
translational medicine, 5(197), p.197ra103. Available at:
http://www.ncbi.nlm.nih.gov/pubmed/23926201.
Campbell, A. et al., 2015. Concise Review: Process Development Considerations for Cell
Therapy. Stem cells translational medicine, 4(10), pp.1155–63. Available at:
http://www.ncbi.nlm.nih.gov/pubmed/26315572 [Accessed May 25, 2017].
CaridianBCT, 2008. Experience the freedom to innovate with the Elutra ® cell separation
system, Available at:
http://www.equipnet.com/mp_data/media/538193_2016112910167_510436_1.pdf
[Accessed May 19, 2017].
Carroll, J., 2009. Dendreon blueprints $70M Provenge facility in Atlanta | FierceBiotech.
FierceBiotech. Available at: http://www.fiercebiotech.com/biotech/dendreon-
blueprints-70m-provenge-facility-atlanta [Accessed March 17, 2017].
Carroll, J., 2014. Novartis’ leading CAR-T cancer therapy gains breakthrough status at
the FDA | FierceBiotech. Available at:
http://www.fiercebiotech.com/regulatory/novartis-leading-car-t-cancer-therapy-
gains-breakthrough-status-at-fda [Accessed December 24, 2016].
Carroll, J., 2013. Organogenesis preps “heart breaking” cuts as Medicare slashes
reimbursement | FierceBiotech. Fiercebiotech. Available at:
http://www.fiercebiotech.com/biotech/organogenesis-preps-heart-breaking-cuts-as-
medicare-slashes-reimbursement [Accessed May 5, 2017].
Carswell, K. & Papoutsakis, E., 2000. Culture of human T cells in stirred bioreactors for
cellular immunotherapy applications: shear, proliferation, and the IL-2 receptor.
Biotechnology and bioengineering, 68(3), pp.328–38. Available at:
http://www.ncbi.nlm.nih.gov/pubmed/10745201 [Accessed March 25, 2017].
Cartellieri, M. et al., 2014. A novel Ex Vivo isolation and expansion procedure for
chimeric antigen receptor engrafted human T cells. PLoS ONE, 9(4), pp.1–12.
Castillo, J., 2014. Indutrialization of Stem Cell Processes – how to identify the right
strategy ? In ISCT. Paris. Available at:
http://c.ymcdn.com/sites/www.celltherapysociety.org/resource/resmgr/2014_Annu
alMtgPresentations/SC8_J.Castillo.pdf [Accessed May 22, 2017].
Cell Medica, 2014. Transforming the Treatment of Cancer and Infections. In UCL cell
therapy MBI.
Chapman, P. & Krishnan, M., 2010. Beyond the bioreactor: Exploiting the full potential
of single-use technologies. Bioprocessing, pp.70–72. Available at:
http://www.iptonline.com/articles/public/Millipore article NP.pdf [Accessed
February 25, 2017].
Chen, A. et al., 2011a. Critical microcarrier properties affecting the expansion of
undifferentiated human embryonic stem cells. Stem Cell Research, 7(2), pp.97–111.
Available at: http://dx.doi.org/10.1016/j.scr.2011.04.007.
Chen, A. et al., 2011b. Critical microcarrier properties affecting the expansion of
undifferentiated human embryonic stem cells. Stem Cell Research, 7(2), pp.97–111.
Available at: http://www.ncbi.nlm.nih.gov/pubmed/21763618 [Accessed May 24,
2017].

275
Chen, Y.-S., 2016. Mesenchymal Stem Cell: Considerations for Manufacturing and
Clinical Trials on Cell Therapy Product. International Journal of Stem cell Research
& Therapy, 3(1). Available at:
https://clinmedjournals.org/articles/ijscrt/international-journal-of-stem-cell-
research-and-therapy-ijscrt-3-029.php?jid=ijscrt [Accessed May 11, 2017].
Chereau, F., 2011. The Challenge of Cell Therapies. Drug discovery and development.
Available at: https://www.dddmag.com/article/2011/02/challenge-cell-therapies
[Accessed May 13, 2017].
Chester, J., 2008. Isolators v. RABS: Isolators v. RABS: Facility Design Considerations
for Facility Design Considerations for a Fill a Fill - -Finish Suite Finish Suite. In
APV Basle conference. Available at:
https://static1.squarespace.com/static/52d6d893e4b0edcb252bf2af/t/52d99bb2e4b0
826240a700ee/1389992882658/2008ChesterAPVBasleRABSFacility-Rev5-08.pdf
[Accessed March 15, 2017].
Chmielewski, M., Hombach, A. & Abken, H., 2013. Antigen-specific T-cell activation
independently of the MHC: Chimeric antigen receptor-redirected T cells. Frontiers
in Immunology, 4(NOV), pp.1–7.
Christodoulou, I. et al., 2013. Comparative Evaluation of Human Mesenchymal Stem
Cells of Fetal (Wharton’s Jelly) and Adult (Adipose Tissue) Origin during Prolonged
In Vitro Expansion: Considerations for Cytotherapy. Stem cells international, 2013,
p.246134. Available at: http://www.ncbi.nlm.nih.gov/pubmed/23533440 [Accessed
May 13, 2017].
Clarke, T. & Berkrot, B., 2017. FDA approves Gilead cancer gene therapy; price set at
$373,000. Reuters. Available at: https://uk.reuters.com/article/us-gilead-sciences-
fda/fda-approves-gilead-cancer-gene-therapy-price-set-at-373000-
idUKKBN1CN35H [Accessed November 19, 2017].
clinicaltrials.gov, Home - ClinicalTrials.gov. Available at: https://clinicaltrials.gov/
[Accessed December 24, 2016].
ClinicalTrials.gov, 2016. A Prospective Study of Remestemcel-L, Ex-vivo Cultured
Adult Human Mesenchymal Stromal Cells, for the Treatment of Pediatric Patients
Who Have Failed to Respond to Steroid Treatment for Acute GVHD - Full Text
View - ClinicalTrials.gov. ClinicalTrials.gov. Available at:
https://clinicaltrials.gov/ct2/show/NCT02336230?term=MSC+AND+GvHD&rank
=31 [Accessed May 13, 2017].
Confalonieri, D. et al., 2017. An Injectable Recombinant Collagen I Peptide–Based
Macroporous Microcarrier Allows Superior Expansion of C2C12 and Human Bone
Marrow-Derived Mesenchymal Stromal Cells and Supports Deposition of
Mineralized Matrix. Tissue Engineering Part A, p.ten.tea.2016.0436. Available at:
http://online.liebertpub.com/doi/10.1089/ten.tea.2016.0436 [Accessed July 25,
2017].
Connolly, A. et al., 2011. Underdiagnosis of dementia in primary care: Variations in the
observed prevalence and comparisons to the expected prevalence. Aging & Mental
Health, 15(8), pp.978–984. Available at:
http://www.tandfonline.com/doi/abs/10.1080/13607863.2011.596805 [Accessed
May 5, 2017].
Coopman, K. & Medcalf, N., 2008. From production to patient: challenges and
approaches for delivering cell therapies. StemBook. Available at:

276
http://www.ncbi.nlm.nih.gov/pubmed/24945057 [Accessed May 13, 2017].
Cooray, S., Howe, S. & Thrasher, A., 2012. Retrovirus and Lentivirus Vector Design and
Methods of Cell Conditioning. In Methods in enzymology. pp. 29–57. Available at:
http://www.ncbi.nlm.nih.gov/pubmed/22365768 [Accessed December 24, 2016].
Corning(R), Surface Areas and Recommended Medium Volumes for Corning ® Cell
Culture Vessels,
Coulson & Richardson, 2005. Coulson & Richardsons Chemical Engineering Design,
ELSEVIER. Available at:
http://books.google.com/books?id=DJaxUL3numgC&pgis=1.
Cox, S. et al., 2008. The Environmental Impact of Disposable Technologies. BioPharm
International. Available at: http://www.biopharminternational.com/environmental-
impact-disposable-technologies?id=&sk=&date=&pageID=3 [Accessed March 2,
2017].
Crabb, N. & Stevens, A., 2016. Exploring the assessment and appraisal of regenerative
medicines and cell therapy products,
Cribbs, A. et al., 2013. Simplified production and concentration of lentiviral vectors to
achieve high transduction in primary human T cells. BMC biotechnology, 13(1),
p.98. Available at:
http://www.pubmedcentral.nih.gov/articlerender.fcgi?artid=3830501&tool=pmcent
rez&rendertype=abstract.
Culme-Seymour, E. et al., 2012. A decade of cell therapy clinical trials (2000–2010).
Regenerative Medicine, 7(4), pp.455–462. Available at:
http://www.futuremedicine.com/doi/10.2217/rme.12.45 [Accessed May 4, 2017].
Curran, K. et al., 2015. Enhancing Antitumor Efficacy of Chimeric Antigen Receptor T
Cells Through Constitutive CD40L Expression. Available at: http://ac.els-
cdn.com/S152500161630096X/1-s2.0-S152500161630096X-
main.pdf?_tid=ea6fc254-1027-11e7-a2fe-
00000aacb35e&acdnat=1490315108_2c94132a4fe91ba270cae9b2a2520ab8
[Accessed March 24, 2017].
Dai, H. et al., 2016. Chimeric antigen receptors modified T-cells for cancer therapy.
Journal of the National Cancer Institute, 108(7), pp.1–15.
Dang, Y. et al., 2007. Tumor Antigen-Specific T-Cell Expansion Is Greatly Facilitated
by In vivo Priming. Clinical Cancer Research, 13(6), pp.1883–1891. Available at:
http://www.ncbi.nlm.nih.gov/pubmed/17363545 [Accessed March 25, 2017].
Danova, M., Torchio, M. & Mazzini, G., 2011. Isolation of rare circulating tumor cells in
cancer patients: technical aspects and clinical implications. Expert Review of
Molecular Diagnostics, 11(5), pp.473–485. Available at:
http://www.ncbi.nlm.nih.gov/pubmed/21707456 [Accessed December 24, 2016].
Davie, N., 2013. How many facilities? Centralized vs. decentralized manufacture -
Signals Blog. Signals blog. Available at: http://www.signalsblog.ca/how-many-
facilities-centralized-vs-decentralized-manufacture/ [Accessed May 27, 2017].
Davie, N. et al., 2012. Streamlining Cell Therapy Manufacture From Clinical to
Commercial Scale. Supplement 24 BioProcess International, 10(3), pp.24–29.
Available at: http://www.bioprocessintl.com/wp-
content/uploads/2014/05/BPI_A_121003SUPAR05_176462a.pdf [Accessed May
25, 2017].
Deans, R., 2014. Deans Catapult 3. In Cell therapy catapult, ed. Get it right from the start.

277
Cell therapy MBI. London.
DeBruyn, J., 2016. Durham’s Argos Therapeutics, Inc. (Nasdaq: ARGS) expands cancer-
fighting scope with new trial - Triangle Business Journal. Triangle business journal.
Available at: http://www.bizjournals.com/triangle/news/2016/03/24/durhams-
argos-expands-cancer-fighting-scope-with.html [Accessed March 16, 2017].
Department of health, 2010. Improving the health and well-being of people with long term
conditions World class services for people with long term conditions, Available at:
http://webarchive.nationalarchives.gov.uk/20130107105354/http://www.dh.gov.uk
/prod_consum_dh/groups/dh_digitalassets/@dh/@en/@ps/documents/digitalasset/
dh_111187.pdf [Accessed May 5, 2017].
Department of Labor and Industries, 2002. Autologous Chrondocyte Implantation (ACI)
2002 Update. Available at:
http://www.lni.wa.gov/ClaimsIns/Files/OMD/AciUpdate.pdf [Accessed May 5,
2017].
Dietz, A., Padley, D. & Gastineau, D., 2007. Infrastructure Development for Human Cell
Therapy Translation. Clinical Pharmacology & Therapeutics, 82(3), pp.320–324.
Available at: http://doi.wiley.com/10.1038/sj.clpt.6100288 [Accessed March 9,
2017].
Dillman, R. et al., 2004. Tumor-infiltrating lymphocytes and interleukin-2: dose and
schedules of administration in the treatment of metastatic cancer. Cancer biotherapy
& radiopharmaceuticals, 19(6), pp.730–737. Available at:
http://www.ncbi.nlm.nih.gov/pubmed/15665620%5Cnhttp://online.liebertpub.com/
doi/abs/10.1089/cbr.2004.19.730.
Diogo, M., da Silva Lobato, C. & Cabral, J., 2012. Separation technologies for stem cell
bioprocessing. Biotechnology and Bioengineering, 109(11), pp.2699–2709.
Dirks, R., 2011. PSTI driven by High-Volume Manufacturing Capabilities, Proprietary
Stem Cells and New positive Phase I clinical data for PAD. Pluristem. Available at:
http://pluristem.netron-webs.com/images/stories/publications/BioMedReports-
14.11.11.pdf [Accessed March 16, 2017].
Dodo, K. et al., 2014. An efficient large-scale retroviral transduction method involving
preloading the vector into a retronectin-coated bag with low-temperature shaking.
PLoS ONE, 9(1).
Dodson, B. & Levine, A., 2015a. Challenges in the translation and commercialization of
cell therapies. BMC Biotechnology, 15(1), p.70. Available at:
http://www.biomedcentral.com/1472-6750/15/70 [Accessed February 24, 2017].
Dodson, B. & Levine, A., 2015b. Challenges in the translation and commercialization of
cell therapies. BMC Biotechnology, 15(1), p.70. Available at:
http://www.ncbi.nlm.nih.gov/pubmed/26250902 [Accessed May 16, 2017].
Donnan, P. et al., 2009. Development of a decision support tool for primary care
management of patients with abnormal liver function tests without clinically
apparent liver disease: a record-linkage population cohort study and decision
analysis (ALFIE). Health Technology Assessment, 13(25), p.iii–iv, ix–xi, 1-134.
Available at: http://www.ncbi.nlm.nih.gov/pubmed/19413926 [Accessed May 28,
2017].
Dragani, A. et al., 1990. Comparison of five methods for concentrating progenitor cells
in human marrow transplantation. Blut, 60(5), pp.278–281. Available at:
http://link.springer.com/10.1007/BF01736228 [Accessed December 24, 2016].

278
Dropulic, B. & June, C., 2006. Gene-based immunotherapy for human immunodeficiency
virus infection and acquired immunodeficiency syndrome. Human Gene Therapy,
17(6), pp.577–588. Available at: http://www.ncbi.nlm.nih.gov/pubmed/16776567.
Dufait, I. et al., 2012. Retroviral and Lentiviral Vectors for the Induction of
Immunological Tolerance. Scientifica, 2012, pp.1–14.
Dufey, V. et al., 2017. Scalable expansion of human mesenchymal stem cells in stirred-
tank bioreactors. Cytotherapy, 19(5), p.S145. Available at:
http://linkinghub.elsevier.com/retrieve/pii/S1465324917302682 [Accessed May 24,
2017].
Dunnell, K., 2007. The changing demographic picture of the UK: national statistician’s
annual article on the population. Population trends, pp.9–21.
Dutton, R. & Fox, J., 2006. Robotic Processing in Barrier–Isolator Environments: A Life
Cycle Cost Approach. Pharm eng, 26(5).
Eibl, R. & Eibl, D., 2010. Single-Use Technology in Biopharmaceutical Manufacture,
Available at:
https://books.google.co.uk/books?id=vO57HWijFOoC&pg=PT617&lpg=PT617&
dq=cost+single+use+facility&source=bl&ots=C6ie9oCkWM&sig=3EMnVn43st2
Os7YvdzB1ZX1Ds1s&hl=en&sa=X&ved=0ahUKEwiRwbiNmKTSAhXMIcAKH
cv6Ce44FBDoAQggMAE#v=onepage&q=cost single use facility [Accessed
February 22, 2017].
Eichler, H. et al., 2012. Adaptive Licensing: Taking the Next Step in the Evolution of
Drug Approval. Clinical Pharmacology & Therapeutics, 91(3), pp.426–437.
Available at: http://doi.wiley.com/10.1038/clpt.2011.345 [Accessed May 16, 2017].
Elghali, L. et al., 2008. Decision support methodology for complex contexts. Proceedings
of the Institution of Civil Engineers - Engineering Sustainability, 161(1), pp.7–22.
Available at: http://www.icevirtuallibrary.com/doi/10.1680/ensu.2008.161.1.7
[Accessed May 28, 2017].
Ennis, W., Sui, A. & Bartholomew, A., 2013. Stem Cells and Healing: Impact on
Inflammation. Advances in wound care, 2(7), pp.369–378. Available at:
http://www.ncbi.nlm.nih.gov/pubmed/24587974 [Accessed May 2, 2017].
European Medicines Agency, 2009a. ASSESSMENT REPORT FOR ChondroCelect
Common name: characterised viable autologous cartilage cells expanded ex vivo
expressing specific marker proteins. Available at: http://www.emea.europa.eu
[Accessed May 5, 2017].
European Medicines Agency, 2009b. GUIDELINE ON FOLLOW-UP OF PATIENTS
ADMINISTERED WITH GENE THERAPY MEDICINAL. Available at:
http://www.emea.europa.eu [Accessed May 16, 2017].
Fang, Q. & Boas, D., 2009. Monte Carlo Simulation of Photon Migration in 3D Turbid
Media Accelerated by Graphics Processing Units. Optics Express, 17(22), p.20178.
Available at: https://www.osapublishing.org/abstract.cfm?URI=oe-17-22-20178
[Accessed May 28, 2017].
Farid, S., 2012. Evaluating and Visualizing the Cost-Effectiveness and Robustness of
Biopharmaceutical Manufacturing Strategies. In Biopharmaceutical Production
Technology. Weinheim, Germany: Wiley-VCH Verlag GmbH & Co. KGaA, pp.
717–741. Available at: http://doi.wiley.com/10.1002/9783527653096.ch22
[Accessed May 28, 2017].
Felder, J., Goyal, S. & Attinger, C., 2012. A Systematic Review of Skin Substitutes for

279
Foot Ulcers. Plastic and Reconstructive Surgery, 130(1), pp.145–164. Available at:
http://content.wkhealth.com/linkback/openurl?sid=WKPTLP:landingpage&an=000
06534-201207000-00029 [Accessed May 5, 2017].
Fernandes, A. et al., 2007. Mouse embryonic stem cell expansion in a microcarrier-based
stirred culture system. Journal of Biotechnology, 132(2), pp.227–236. Available at:
http://www.ncbi.nlm.nih.gov/pubmed/17644203 [Accessed May 24, 2017].
Fernandes, A. et al., 2009. Successful scale-up of human embryonic stem cell production
in a stirred microcarrier culture system. Brazilian journal of medical and biological
research = Revista brasileira de pesquisas medicas e biologicas, 42(6), pp.515–22.
Available at: http://www.ncbi.nlm.nih.gov/pubmed/19448900 [Accessed May 24,
2017].
Field, A.-C. et al., 2013. Comparison of lentiviral and sleeping beauty mediated αβ T cell
receptor gene transfer. PloS one, 8(6), p.e68201. Available at:
http://www.pubmedcentral.nih.gov/articlerender.fcgi?artid=3695921&tool=pmcent
rez&rendertype=abstract.
Fierce Biotech, Dendreon: Provenge to cost $93K for full course of treatment |
FierceBiotech. Available at: http://www.fiercebiotech.com/biotech/dendreon-
provenge-to-cost-93k-for-full-course-of-treatment [Accessed February 24, 2017].
FierceBiotech, 2010. Dendreon: Provenge to cost $93K for full course of treatment |
FierceBiotech. FierceBiotech. Available at:
http://www.fiercebiotech.com/biotech/dendreon-provenge-to-cost-93k-for-full-
course-of-treatment [Accessed May 6, 2017].
Fitzpatrick, I., 2008. Cellular Therapy Success Through Integrated Automation.
BioProcess International, 6(S6), pp.32–37. Available at:
http://www.invetech.com.au/download/cellular therapy success through integrated
automation_bpi_october.pdf.
Flaherty, W. & Perrone, P., 2012. Environmental and Financial Benefits of Single-Use
Technology, Available at:
http://www.ilcdover.com/sites/default/files/EnvironmentalFinancialBenefitsSingle
UseTechnology_1_.pdf [Accessed February 25, 2017].
Flandersbio, 2015. Bone Therapeutics officially opens its new headquarters in Gosselies
| News | FlandersBio. FlandersBio. Available at: http://flandersbio.be/news/bone-
therapeutics-officially-opens-its-new-headquarters-in-gosselies/ [Accessed March
16, 2017].
Flinn, I. et al., 2016. Obstacles to Using CAR-T Therapy in Hematologic Malignancies.
Available at: http://www.onclive.com/peer-exchange/lymphoid-malignancies/cart-
challenges [Accessed May 16, 2017].
Food and Drugs Administration, 2003. Guidance for Reviewers Instructions and
Template for Chemistry, Manufacturing, and Control (CMC) Reviewers of Human
Somatic Cell Therapy Investigational New Drug Applications (INDs). Available at:
http://www.fda.gov/cber/guidelines.htm. [Accessed May 25, 2017].
Food and drugs agency, 2015. Considerations for the Design of Early-Phase Clinical
Trials of Cellular and Gene Therapy Products
_________________________________ Guidance for Industry. Available at:
http://www.fda.gov/BiologicsBloodVaccines/GuidanceComplianceRegulatoryInfo
rmation/Guida [Accessed May 16, 2017].
Food and drugs agency, 2007. Genzime Carticel (autologous culture chrondocytes).

280
Available at:
https://www.fda.gov/downloads/BiologicsBloodVaccines/CellularGeneTherapyPro
ducts/ApprovedProducts/UCM109339.pdf [Accessed May 5, 2017].
Food and drugs agency, HIGHLIGHTS OF PRESCRIBING INFORMATION:
Gintuit(R). Available at:
https://www.fda.gov/downloads/biologicsbloodvaccines/cellulargenetherapyprodu
cts/approvedproducts/ucm295525.pdf [Accessed May 6, 2017a].
Food and drugs agency, HIGHLIGHTS OF PRESCRIBING INFORMATION:
MACI(R). Available at:
https://www.fda.gov/downloads/biologicsbloodvaccines/cellulargenetherapyprodu
cts/approvedproducts/ucm533182.pdf [Accessed May 6, 2017b].
Food and drugs agency, Highlights of prescribing information: Provenge(R). Available
at:
https://www.fda.gov/downloads/BiologicsBloodVaccines/CellularGeneTherapyPro
ducts/ApprovedProducts/UCM210031.pdf [Accessed May 6, 2017c].
Food and drugs agency, 2011. Sepax Cell Separation System and Single-Use Kits, Sepax
2 S-100 Summary,
Food and drugs agency, 1998. SUMMARY OF SAFETY AND EFFECTIVENESS
DATA: Apligraf(R). Available at:
https://www.accessdata.fda.gov/cdrh_docs/pdf/P950032b.pdf [Accessed May 5,
2017].
Food and drugs agency, 2001. SUMMARY OF SAFETY AND EFFECTIVENESS
DATA: Orcel(R). Available at:
https://www.accessdata.fda.gov/cdrh_docs/pdf/P010016b.pdf [Accessed May 6,
2017].
Forbes, S. & Rosenthal, N., 2014. Preparing the ground for tissue regeneration: from
mechanism to therapy. Nature Medicine, 20(8), pp.857–869. Available at:
http://www.nature.com/doifinder/10.1038/nm.3653 [Accessed May 4, 2017].
Frauenschuh, S. et al., 2007. A Microcarrier-Based Cultivation System for Expansion of
Primary Mesenchymal Stem Cells. Biotechnology Progress, 23(1), pp.187–193.
Available at: http://doi.wiley.com/10.1021/bp060155w [Accessed May 24, 2017].
Fresenius Kabi, LOVO: Automated laboratory cell processing system,
Garde, D., 2015. CAR-T player Kite Pharma buys its way into Europe and pads its
anticancer arsenal | FierceBiotech. FierceBiotech. Available at:
http://www.fiercebiotech.com/financials/car-t-player-kite-pharma-buys-its-way-
into-europe-and-pads-its-anticancer-arsenal [Accessed March 16, 2017].
Garland, R. et al., 1999. The use of Teflon cell culture bags to expand functionally active
CD8 q cytotoxic T lymphocytes. Journal of Immunological Methods, 227, pp.53–
63. Available at: www.elsevier.nlrlocaterjim [Accessed March 25, 2017].
Garlie, N. et al., 1999. T cells coactivated with immobilized anti-CD3 and anti-CD28 as
potential immunotherapy for cancer. Journal of immunotherapy (Hagerstown, Md. :
1997), 22(4), pp.336–45. Available at:
http://www.ncbi.nlm.nih.gov/pubmed/10404435 [Accessed March 25, 2017].
Gašová, Z. et al., 2005. PBPC collection techniques: standard versus large volume
leukapheresis (LVL) in donors and in patients. Transfusion and Apheresis Science,
32(2), pp.167–176. Available at: http://www.ncbi.nlm.nih.gov/pubmed/15784451
[Accessed December 24, 2016].

281
GE healthcare, GE Healthcare Life Sciences "Xuri Cell Expansion System Cellbag
Basic, 2 L" Available at:
http://www.gelifesciences.com/webapp/wcs/stores/servlet/ProductDisplay?categor
yId=32565&catalogId=10101&productId=205613&storeId=12751&langId=-1
[Accessed December 24, 2016].
GE Healthcare, 2014. Xuri TM . Believe in better futures. Available at:
https://www.gelifesciences.com/gehcls_images/GELS/Related
Content/Files/1400489554581/litdoc29107809_20161015152137.pdf [Accessed
May 24, 2017].
Geipel-Kern, A., 2009. Single-Use Technologies in Biomanufacturing. Bioprocess world.
Available at: http://www.process-worldwide.com/single-use-technologies-in-
biomanufacturing-a-302185/ [Accessed February 25, 2017].
Genzyme Biosurgery, 2014. Epicel ® (cultured epidermal autografts) HDE# BH990200
Patient Information. , pp.1–8. Available at:
https://www.fda.gov/downloads/BiologicsBloodVaccines/BloodBloodProducts/Ap
provedProducts/PremarketApprovalsPMAs/UCM539204.pdf [Accessed May 5,
2017].
Gering, J. & Campesi, C., 2013. Facility Construction Outlook: Costs Stable &
Trending Up. Controlled enviroments. Available at:
http://www.cemag.us/article/2013/12/facility-construction-outlook-costs-stable-
trending [Accessed March 3, 2017].
Giancola, R., Bonfini, T. & Iacone, A., 2012. Cell therapy: cGMP facilities and
manufacturing. Muscles, ligaments and tendons journal, 2(3), pp.243–7. Available
at: http://www.ncbi.nlm.nih.gov/pubmed/23738304 [Accessed May 26, 2017].
Gibbons, G., 2015. Grafix(®), a Cryopreserved Placental Membrane, for the Treatment
of Chronic/Stalled Wounds. Advances in wound care, 4(9), pp.534–544. Available
at: http://www.ncbi.nlm.nih.gov/pubmed/26339532 [Accessed May 6, 2017].
Gilham, D. et al., 2012. CAR–T cells and solid tumors: tuning T cells to challenge an
inveterate foe. Trends in Molecular Medicine, 18(7), pp.377–384. Available at:
http://www.sciencedirect.com/science/article/pii/S147149141200072X [Accessed
May 16, 2017].
Glenn, J. & Whartenby, K., 2014. Mesenchymal stem cells: Emerging mechanisms of
immunomodulation and therapy. World journal of stem cells, 6(5), pp.526–39.
Available at: http://www.ncbi.nlm.nih.gov/pubmed/25426250 [Accessed May 9,
2017].
Global industry analysts, 2016. Ability to provide targeted delivery of therapeutics to
drive the global mesenchymal stem cells market. Available at:
http://www.strategyr.com/MarketResearch/Mesenchymal_Stem_Cells_Market_Tre
nds.asp [Accessed May 11, 2017].
GlobeNewswire, 2010. Aastrom and ATEK Medical Form Strategic Manufacturing and
Development Partnership Nasdaq:ASTM. Nasdaq|GlobeNewswire. Available at:
https://globenewswire.com/news-release/2010/10/26/432419/204763/en/Aastrom-
and-ATEK-Medical-Form-Strategic-Manufacturing-and-Development-
Partnership.html [Accessed March 16, 2017].
GlobeNewswire, 2016a. First Allogeneic Cell Therapy Product Launched in Japan by
Mesoblast Licensee Australian Stock Exchange:MSB.AX. GlobeNewswire.
Available at: https://globenewswire.com/news-
282
release/2016/02/24/813541/0/en/First-Allogeneic-Cell-Therapy-Product-
Launched-in-Japan-by-Mesoblast-Licensee.html [Accessed May 6, 2017].
GlobeNewswire, 2016b. Mesoblast’s Full 24-Month Trial Results for Chronic Low Back
Pain Presented at Spine Intervention Society Annual Meeting, Receive Award for
Best Basic Science Australian Stock Exchange:MSB.AX. GlobeNewswire.
Available at: https://globenewswire.com/news-
release/2016/08/01/860414/0/en/Mesoblast-s-Full-24-Month-Trial-Results-for-
Chronic-Low-Back-Pain-Presented-at-Spine-Intervention-Society-Annual-
Meeting-Receive-Award-for-Best-Basic-Science.html [Accessed May 13, 2017].
GlobeNewswire, 2014. TiGenix completes the sale of its Dutch manufacturing facility to
PharmaCell Brussels Stock Exchange:TIG. Nasdaq| GlobeNewswire. Available at:
http://globenewswire.com/news-release/2014/06/02/640819/10084050/en/TiGenix-
completes-the-sale-of-its-Dutch-manufacturing-facility-to-PharmaCell.html
[Accessed March 16, 2017].
González, M. et al., 2009. Treatment of experimental arthritis by inducing immune
tolerance with human adipose-derived mesenchymal stem cells. Arthritis &
Rheumatism, 60(4), pp.1006–1019. Available at:
http://doi.wiley.com/10.1002/art.24405 [Accessed May 9, 2017].
Granzin, M. et al., 2015. Fully automated expansion and activation of clinical-grade
natural killer cells for adoptive immunotherapy. Cytotherapy, 17(5), pp.621–632.
Available at: http://linkinghub.elsevier.com/retrieve/pii/S1465324915006957
[Accessed December 24, 2016].
Green, J. et al., 2000. Coordinate Regulation of T Cell Activation by CD2 and CD28. The
Journal of Immunology, 164(7), pp.3591–3595. Available at:
http://www.jimmunol.org/content/164/7/3591.full.
Guldager, N., 2010. Cost advantages of single use technologies. Pharmaceutical
technology.
Guldager, N., 2009. Next-Generation Facilities for Monoclonal Antibody Production.
Pharmatech.com, 33(7). Available at: http://www.pharmtech.com/next-generation-
facilities-monoclonal-antibody-production?id=&sk=&date=&pageID=2 [Accessed
March 3, 2017].
Guo, Y., Wang, Y. & Han, W., 2016. Chimeric Antigen Receptor-Modified T Cells for
Solid Tumors: Challenges and Prospects. Journal of Immunology Research, 2016,
pp.1–11. Available at: http://www.hindawi.com/journals/jir/2016/3850839/
[Accessed May 15, 2017].
Haemonetics, Cell saver 5+ Standard of care in intraoperative autotransfusion,
Available at:
http://www.haemonetics.com/~/media/sharepoint/devices/cell_saver_5+/marketing
/brochures/colpp000009usbrochurecs5pdf.pdf [Accessed May 19, 2017].
Haigney, S., 2016. Integrating Single-Use Systems in Pharma Manufacturing.
PharmaTech.com, 40(6), pp.42–44. Available at:
http://www.pharmtech.com/integrating-single-use-systems-pharma-manufacturing
[Accessed February 22, 2017].
Hampson, B., Riding the Cell Therapy Wave. The Medicine Maker. Available at:
https://themedicinemaker.com/issues/1116/riding-the-cell-therapy-wave/ [Accessed
May 27, 2017].
Hampson, B., 2015. What can Automation do for Your Cell Therapy? PCT Pulse.

283
Available at: http://www.pctcelltherapy.com/pct-pulse/what-can-automation-do-
for-your-cell-therapy [Accessed May 27, 2017].
Han, E. et al., 2013. Chimeric antigen receptor-engineered T cells for cancer
immunotherapy: progress and challenges. Journal of hematology & oncology, 6,
p.47. Available at: http://www.ncbi.nlm.nih.gov/pubmed/23829929 [Accessed May
15, 2017].
Hanley, P. et al., 2014. Efficient manufacturing of therapeutic mesenchymal stromal cells
with the use of the Quantum Cell Expansion System. Cytotherapy, 16(8), pp.1048–
58. Available at: http://www.ncbi.nlm.nih.gov/pubmed/24726657 [Accessed May
23, 2017].
Hanrahan, B., 2016. Factors influencing automation decisions in cell & advanced
therapy manufacture. Cell & Gene therapy insights , 2(4), pp.481–487. Available at:
http://insights.bio/cell-and-gene-therapy-insights/wp-
content/uploads/sites/2/2016/11/Hanrahan-Interview_Invetech.pdf [Accessed May
27, 2017].
Hara, A., Sato, D. & Sahara, Y., 2014. New Governmental Regulatory System for Stem
Cell–Based Therapies in Japan. Therapeutic Innovation & Regulatory Science,
48(6), pp.681–688. Available at:
http://journals.sagepub.com/doi/10.1177/2168479014526877 [Accessed May 16,
2017].
Hare, J. et al., 2009. A Randomized, Double-Blind, Placebo-Controlled, Dose-Escalation
Study of Intravenous Adult Human Mesenchymal Stem Cells (Prochymal) After
Acute Myocardial Infarction. JAC, 54, pp.2277–2286. Available at: http://ac.els-
cdn.com/S0735109709030927/1-s2.0-S0735109709030927-
main.pdf?_tid=9aeb79ec-34eb-11e7-8f95-
00000aab0f26&acdnat=1494357397_7c76a13aa00bddf43c78ab00107d2ed2
[Accessed May 9, 2017].
Harel Adrian, 2013. Cryopreservation and Cell Banking for Autologous Mesenchymal
Stem Cell-Based Therapies. Cell & Tissue Transplantation & Therapy, p.1.
Available at: http://la-press.com/cryopreservation-and-cell-banking-for-autologous-
mesenchymal-stem-cell-article-a3541.
Harris, I., Meacle, F. & Powers, D., 2016. Automation in Cell Therapy Manufacturing.
BioProcess International, 14(4). Available at: http://www.bioprocessintl.com/wp-
content/uploads/2016/04/14-4-sup-Harris.pdf [Accessed May 27, 2017].
Harrison, R., 2010. Introduction To Monte Carlo Simulation. AIP conference
proceedings, 1204, pp.17–21. Available at:
http://www.ncbi.nlm.nih.gov/pubmed/20733932 [Accessed May 28, 2017].
Harvard Medical School, 2010. Immunotherapy: A new option for advanced prostate
cancer - Harvard Health. Harvard Health Publications. Available at:
http://www.health.harvard.edu/newsletter_article/immunotherapy-a-new-option-
for-advanced-prostate-cancer [Accessed May 13, 2017].
Hass, R. et al., 2011. Different populations and sources of human mesenchymal stem cells
(MSC): A comparison of adult and neonatal tissue-derived MSC. Cell
communication and signaling : CCS, 9, p.12. Available at:
http://www.ncbi.nlm.nih.gov/pubmed/21569606 [Accessed May 18, 2017].
Hassan, S. et al., 2015. Allogeneic cell therapy bioprocess economics and optimization:
downstream processing decisions. Regenerative Medicine, 10(5), pp.591–609.
284
Available at: http://www.ncbi.nlm.nih.gov/pubmed/26237703 [Accessed December
28, 2016].
Hassan, S. et al., 2016. Process change evaluation framework for allogeneic cell therapies:
impact on drug development and commercialization. Regenerative Medicine, 11(3),
pp.287–305. Available at: http://www.futuremedicine.com/doi/10.2217/rme-2015-
0034 [Accessed December 28, 2016].
Heathman, T. et al., 2015. The translation of cell-based therapies: Clinical Landscape and
Manufacturing Challenges. Regenerative medicine, 10(1), pp.49–64. Available at:
http://www.ncbi.nlm.nih.gov/pubmed/25562352.
Herper, M., 2017. FDA Approves Another Amazing And Costly Cancer-Killing Gene
Therapy. Forbes. Available at:
https://www.forbes.com/sites/matthewherper/2017/10/18/fda-approves-another-
amazing-and-costly-cancer-killing-gene-therapy/#4cc21b4a4afa [Accessed
November 19, 2017].
Hillerdal, V. et al., 2014. Systemic treatment with CAR-engineered T cells against PSCA
delays subcutaneous tumor growth and prolongs survival of mice. BMC cancer, 14,
p.30. Available at:
http://www.pubmedcentral.nih.gov/articlerender.fcgi?artid=3899402&tool=pmcent
rez&rendertype=abstract.
Hoffmann, P. et al., 2004. Large-scale in vitro expansion of polyclonal human CD4 ϩ
CD25 high regulatory T cells. The American Society of Hematology, 104(3), pp.895–
903. Available at:
http://www.bloodjournal.org/content/bloodjournal/104/3/895.full.pdf?sso-
checked=true [Accessed March 24, 2017].
HollandBio, Kite Pharma Acquires T-Cell Factory for $21M Up Front - Nieuws -
HollandBIO. HollandBIO. Available at:
https://www.hollandbio.nl/nieuwsberichten/kite-pharma-acquires-t-cell-factory-
for-21m-up-front [Accessed March 16, 2017].
Hollyman, D. et al., 2009a. Manufacturing validation of biologically functional T cells
targeted to CD19 antigen for autologous adoptive cell therapy. Journal of
immunotherapy (Hagerstown, Md. : 1997), 32(2), pp.169–80. Available at:
http://www.ncbi.nlm.nih.gov/pubmed/19238016%5Cnhttp://www.pubmedcentral.n
ih.gov/articlerender.fcgi?artid=PMC2683970%5Cn/pmc/articles/PMC2683970/?re
port=abstract.
Hollyman, D. et al., 2009b. Manufacturing validation of biologically functional T cells
targeted to CD19 antigen for autologous adoptive cell therapy. J Immunother, 32(2),
pp.169–180. Available at:
https://www.ncbi.nlm.nih.gov/pmc/articles/PMC2683970/pdf/nihms87197.pdf
[Accessed March 23, 2017].
Hosing, C. et al., 2003. Long-term results favor allogeneic over autologous hematopoietic
stem cell transplantation in patients with refractory or recurrent indolent non-
Hodgkin’s lymphoma. Annals of Oncology, 14(5), pp.737–744. Available at:
https://academic.oup.com/annonc/article-lookup/doi/10.1093/annonc/mdg200
[Accessed May 4, 2017].
Hourd, P. et al., 2014. Manufacturing models permitting roll out/scale out of clinically
led autologous cell therapies: regulatory and scientific challenges for comparability.
Cytotherapy, 16(8), pp.1033–1047. Available at:

285
http://www.sciencedirect.com/science/article/pii/S1465324914005453 [Accessed
May 27, 2017].
http://www.access.wa.gov/, 2002. II. Reason for Review, Washington.
Huang, G., Gronthos, S. & Shi, S., 2009. Mesenchymal stem cells derived from dental
tissues vs. those from other sources: their biology and role in regenerative medicine.
Journal of dental research, 88(9), pp.792–806. Available at:
http://www.ncbi.nlm.nih.gov/pubmed/19767575 [Accessed May 9, 2017].
Hümmer, C. et al., 2016. Automation of cellular therapy product manufacturing: results
of a split validation comparing CD34 selection of peripheral blood stem cell
apheresis product with a semi-manual vs. an automatic procedure. Journal of
translational medicine, 14, p.76. Available at:
http://www.ncbi.nlm.nih.gov/pubmed/26983643 [Accessed May 27, 2017].
Hussain, W. et al., 2013. Reproducible culture and differentiation of mouse embryonic
stem cells using an automated microwell platform. Biochemical Engineering
Journal, 77, pp.246–257. Available at:
http://www.sciencedirect.com/science/article/pii/S1369703X13001587 [Accessed
May 22, 2017].
Ikonomou, L. et al., 2002. Microcarrier Culture of Lepidopteran Cell Lines: Implications
for Growth and Recombinant Protein Production. Biotechnology Progress, 18(6),
pp.1345–1355. Available at: http://www.ncbi.nlm.nih.gov/pubmed/12467471
[Accessed May 24, 2017].
in `t Anker, P. et al., 2003. Amniotic fluid as a novel source of mesenchymal stem cells
for therapeutic transplantation. Blood, 102(4), pp.1548–1549. Available at:
http://www.ncbi.nlm.nih.gov/pubmed/12900350 [Accessed May 9, 2017].
Introna, M. et al., 2014. Treatment of Graft versus Host Disease with Mesenchymal
Stromal Cells: A Phase I Study on 40 Adult and Pediatric Patients. Biology of Blood
and Marrow Transplantation, 20(3), pp.375–381. Available at:
http://www.ncbi.nlm.nih.gov/pubmed/24321746 [Accessed May 13, 2017].
Inventech, Cell Therapy Commercialisation Through Automated Processing — Invetech.
Available at: http://www.invetech.us/markets/cell-therapy/ [Accessed December 28,
2016].
InvestHolland, 2015. Kite Pharma Acquires Dutch Biotech Firm to Establish Amsterdam
EHQ - NFIA. Investinholland. Available at: http://investinholland.com/kite-pharma-
acquires-dutch-biotech-firm-to-establish-amsterdam-ehq/ [Accessed March 16,
2017].
Invetech, Cell Therapy Commercialisation Through Automated Processing — Invetech.
Cell & Advanced Therapies . Available at:
http://www.invetech.com.au/markets/cell-therapy/ [Accessed May 27, 2017].
Jackson, H. et al., 2004. A robust human T-cell culture method suitable for monitoring
CD8+ and CD4+ T-cell responses from cancer clinical trial samples. Available at:
http://ac.els-cdn.com/S0022175904001553/1-s2.0-S0022175904001553-
main.pdf?_tid=17dde92c-1029-11e7-96c7-
00000aab0f26&acdnat=1490315613_4a0847c460cb858b6040eb4cf7a8effc
[Accessed March 24, 2017].
Jacquemart, R. et al., 2016. A Single-use Strategy to Enable Manufacturing of Affordable
Biologics. Computational and structural biotechnology, 14, pp.309–318. Available
at: http://creativecommons.org/licenses/by/4.0/ [Accessed February 22, 2017].

286
Janas, M. et al., 2015. Perfusion’s role in maintenance of high-density T-cell cultures.
BioProcess International, 13(1).
Jansen of Lorkeers, S. et al., 2014. Similar Effect of Autologous and Allogeneic Cell
Therapy for Ischemic Heart Disease: Systematic Review and Meta-Analysis of
Large Animal Studies. Circulation Research. Available at:
http://circres.ahajournals.org/content/early/2014/09/03/CIRCRESAHA.116.30487
2 [Accessed May 4, 2017].
Jena, B., Dotti, G. & Cooper, L., 2010. Redirecting T-cell specificity by introducing a
tumor-specific chimeric antigen receptor. Blood, 116(7), pp.1035–1044. Available
at: http://www.ncbi.nlm.nih.gov/pubmed/20439624 [Accessed December 24, 2016].
Jenkins, M. et al., 2016. Patient-specific hiPSC bioprocessing for drug screening:
Bioprocess economics and optimisation. Biochemical Engineering Journal, 108,
pp.84–97.
Jin, H. et al., 2013. Comparative Analysis of Human Mesenchymal Stem Cells from Bone
Marrow, Adipose Tissue, and Umbilical Cord Blood as Sources of Cell Therapy. Int.
J. Mol. Sci, 14, pp.17986–18001. Available at: www.mdpi.com/journal/ijms
[Accessed May 13, 2017].
Jin, J. et al., 2012. Simplified Method of the Growth of Human Tumor Infiltrating
Lymphocytes in Gas-permeable Flasks to Numbers Needed for Patient Treatment.
Journal of Immunotherapy, 35(3), pp.283–292. Available at:
http://www.ncbi.nlm.nih.gov/pubmed/22421946 [Accessed December 24, 2016].
Jossen, V. et al., 2014. Mass Production of Mesenchymal Stem Cells — Impact of
Bioreactor Design and Flow Conditions on Proliferation and Differentiation.
Available at: http://dx.doi.org/10.5772/59385 [Accessed May 24, 2017].
Julaey, M., Hosseini, M. & Amani, H., 2016. Stem Cells Culture Bioreactor Fluid Flow,
Shear Stress and Microcarriers Dispersion Analysis Using Computational Fluid
Dynamics. Journal of Applied Biotechnology Reports Original Article Journal of
Applied Biotechnology Reports Spring, 3(2), pp.425–431. Available at:
file:///C:/Users/Tania/Downloads/101-333-1-PB.pdf [Accessed May 24, 2017].
Kahn, D., Plapp, R. & Modi, A., 2001. Modeling a multi-step protein synthesis and
purification process: A case study of a CAPE application in the pharmaceutical
industry. In pp. 419–426. Available at:
http://linkinghub.elsevier.com/retrieve/pii/S1570794601800651 [Accessed May 24,
2017].
Kaiser, A. et al., 2015. Towards a commercial process for the manufacture of genetically
modified T cells for therapy. Cancer gene therapy, 22(2), pp.72–8. Available at:
http://www.nature.com/cgt/journal/v22/n2/full/cgt201478a.html#bib15%5Cnhttp://
www.nature.com/cgt/journal/v22/n2/full/cgt201478a.html#bib9%5Cnhttp://dx.doi.
org/10.1038/cgt.2014.78.
Kaiser, A., Assnmacher, M. & Johnston, I., 2015. METHOD FOR AUTOMATED
GENERATION OF GENETICALLY MODIFIED T CELLS. Available at:
https://patentscope.wipo.int/search/en/detail.jsf?docId=WO2015162211 [Accessed
December 24, 2016].
Kalamasz, D. et al., 1997. Optimization of Human T-Cell Expansion Ex Vivo Using
Magnetic Beads Conjugated with Anti-CD3 and Anti-CD28 Antibodies, Lippincott-
Raven Publishers. Available at: http://ovidsp.tx.ovid.com.libproxy.ucl.ac.uk/sp-
3.24.1b/ovidweb.cgi?QS2=434f4e1a73d37e8c9c245f63f5b4d54d51f2f03751be5fd

287
0c3eeddc993d7f6f60c27f7fff5fd24396d589684fb433a1cf1cf7d097c66d073a92127
42f285d5ea94438b0ec740ed1605652a9400cf384a7fe9e86763611e2e575e6f3
[Accessed March 23, 2017].
Kalos, M. et al., 2011. T cells with chimeric antigen receptors have potent antitumor
effects and can establish memory in patients with advanced leukemia. Science
translational medicine, 3(95), p.95ra73. Available at:
http://stm.sciencemag.org/content/3/95/95ra73.full.
Kan, I. et al., 2007. Dopaminergic differentiation of human mesenchymal stem cells—
Utilization of bioassay for tyrosine hydroxylase expression. Neuroscience Letters,
419(1), pp.28–33. Available at:
http://www.sciencedirect.com/science/article/pii/S0304394007003497 [Accessed
May 9, 2017].
Karnieli, O., 2015. Cell Therapy: Early Process Development and Optimization of the
Manufacturing Process are Critical to Ensure Viability of the Product, Quality,
Consistency and Cost Efficiency. Journal of Commercial Biotechnology, 21(1).
Available at: http://commercialbiotechnology.com/index.php/jcb/article/view/695
[Accessed December 28, 2016].
Katz, S. et al., 2015. Phase I Hepatic Immunotherapy for Metastases Study of Intra-
Arterial Chimeric Antigen Receptor–Modified T-cell Therapy for CEA+ Liver
Metastases. Clinical Cancer Research, 21(14). Available at:
http://clincancerres.aacrjournals.org/content/21/14/3149.short [Accessed May 15,
2017].
Kavanaugh, K., 2007. Aastrom expands operations, expects to add more than a dozen
positions. metromode. Available at:
http://www.secondwavemedia.com/metromode/innovationnews/aastrom2707.aspx
[Accessed March 16, 2017].
Kebriaei, P. et al., 2009. Adult Human Mesenchymal Stem Cells Added to Corticosteroid
Therapy for the Treatment of Acute Graft-versus-Host Disease. Biology of Blood
and Marrow Transplantation, 15(7), pp.804–811. Available at:
http://www.ncbi.nlm.nih.gov/pubmed/19539211 [Accessed May 13, 2017].
Kinsella, K. & Dewan, S., 2015. SINGLE-USE MARKET - Rise of Single-Use
Technologies & Systems in Biopharmaceuticals | Articles | drug development
and delivery back issues | Drug Development & Delivery. Drug Development
& Delivery. Available at: http://www.drug-dev.com/Main/Back-
Issues/SINGLEUSE-MARKET-Rise-of-SingleUse-Technologies-Sy-1022.aspx
[Accessed February 25, 2017].
Konishi, A. et al., First Approval of Regenerative Medical Products under the PMD Act
in Japan. Cell Stem Cell, 18. Available at:
http://www.cell.com/cms/attachment/2062243599/2063919197/mmc1.pdf
[Accessed May 6, 2017].
Kowolik, C. et al., 2005. Adoptive transfer of gene-engineered CD4+ helper T cells
induces potent primary and secondary tumor rejection. Blood, 106(9), pp.2995–
3003. Available at: http://www.ncbi.nlm.nih.gov/pubmed/16030195 [Accessed
March 24, 2017].
de la Portilla, F. et al., 2016. Autologous and Allogeneic Stem Cell Transplantation for
Treatment of Crohn’s Fistulae. In New Insights into Inflammatory Bowel Disease.
InTech. Available at: http://www.intechopen.com/books/new-insights-into-

288
inflammatory-bowel-disease/autologous-and-allogeneic-stem-cell-transplantation-
for-treatment-of-crohn-s-fistulae [Accessed May 4, 2017].
Lambert, L. et al., 2017. Improving T Cell Expansion with a Soft Touch. American
Chemical Society, 17, pp.821–826. Available at:
http://pubs.acs.org/doi/pdf/10.1021/acs.nanolett.6b04071 [Accessed March 24,
2017].
Lambrechts, T. et al., 2016. Large-Scale Mesenchymal Stem/Stromal Cell Expansion: A
Visualization Tool for Bioprocess Comparison. Tissue engineering. Part B, Reviews,
22(6). Available at:
http://online.liebertpub.com.libproxy.ucl.ac.uk/doi/pdf/10.1089/ten.teb.2016.0111
[Accessed May 24, 2017].
Lamers, C. et al., 2002. Protocol for gene transduction and expansion of human T
lymphocytes for clinical immunogene therapy of cancer. Cancer gene therapy, 9(7),
pp.613–23. Available at: http://dx.doi.org/10.1038/sj.cgt.7700477.
Lamers, C. et al., 2006. Treatment of metastatic renal cell carcinoma with autologous T-
lymphocytes genetically retargeted against carbonic anhydrase IX: first clinical
experience. Journal of clinical oncology : official journal of the American Society of
Clinical Oncology, 24(13), pp.22–24.
Lang, H., 1948. Simplified Approach to Preliminary Cost Estimates. Chemical
Engineering, 55, pp.112–113.
Langer, E. & Rader, R., 2014. Single-use technologies in biopharmaceutical
manufacturing: A 10-year review of trends and the future. Engineering in Life
Sciences, 14(3), pp.238–243. Available at:
http://doi.wiley.com/10.1002/elsc.201300090 [Accessed February 27, 2017].
Lapinskas, E., 2010. Overcoming The Challenges Of Cell-Based BioProcessing.
PharmaTech.com, pp.1–4.
Lauerman, J. & Paton, J., 2017. Novartis’s $475,000 Price on Cancer Therapy Meets
Resistance - Bloomberg. Bloomberg. Available at:
https://www.bloomberg.com/news/articles/2017-09-22/novartis-s-475-000-price-
tag-on-cancer-drug-meets-resistance [Accessed November 19, 2017].
Lawson, T. et al., 2017. Process development for expansion of human mesenchymal
stromal cells in a 50L single-use stirred tank bioreactor. Biochemical Engineering
Journal, 120, pp.49–62. Available at:
http://www.sciencedirect.com/science/article/pii/S1369703X16303266 [Accessed
May 24, 2017].
Lazarus, H. et al., 2005. Cotransplantation of HLA-Identical Sibling Culture-Expanded
Mesenchymal Stem Cells and Hematopoietic Stem Cells in Hematologic
Malignancy Patients. Biology of Blood and Marrow Transplantation, 11(5), pp.389–
398. Available at: http://www.ncbi.nlm.nih.gov/pubmed/15846293 [Accessed May
13, 2017].
Ledford, H., 2014. Immune cells boost cancer survival from months to years. Nature,
516, pp.156–156. Available at: http://www.nature.com/doifinder/10.1038/516156a.
Lennon, D. & Caplan, A., 2006. Isolation of human marrow-derived mesenchymal stem
cells. Experimental Hematology, 34(11), pp.1604–1605. Available at:
http://linkinghub.elsevier.com/retrieve/pii/S0301472X06004541 [Accessed May
24, 2017].
Leonard, K., 2015. Global Cancer Spending Reaches $100B | Data Mine | US News.

289
Available at: http://www.usnews.com/news/blogs/data-mine/2015/05/05/global-
cancer-spending-reaches-100b [Accessed December 24, 2016].
LesBiologics, BioDFcator(R) BioDFence BioDDreyFlex Regenerative tissue repair.
Available at: https://lesbiologics.com/pdf/3-Product-Sales-Sheet.pdf [Accessed
May 5, 2017].
Lever, M. et al., 2014. Phenotypic models of T cell activation. Nature Reviews:
Immunology, 14(9), pp.619–629. Available at:
http://dx.doi.org/10.1038/nri3728%5Cnpapers3://publication/doi/10.1038/nri3728.
Levine, B. et al., 2017. Global Manufacturing of CAR T Cell Therapy. Molecular
Therapy - Methods & Clinical Development, 4, pp.92–101. Available at:
http://www.sciencedirect.com/science/article/pii/S2329050116302029?np=y&npK
ey=91642712201fe3c7954a8c0f19ed45199c6254b578ad916c28c1c6e2c13c8f81
[Accessed May 16, 2017].
Levine, B. et al., 1998. Large-Scale Production of CD4+ T Cells from HIV-1-Infected
Donors After CD3/CD28 Costimulation*. JOURNAL OF HEMATOTHERAPY, 7,
pp.437–448. Available at:
http://online.liebertpub.com.libproxy.ucl.ac.uk/doi/pdf/10.1089/scd.1.1998.7.437
[Accessed March 25, 2017].
Levine, B., 2011a. Magnetic-and Centrifugal-Based Cell Sorting for Clinical Trials. In
ISCT meeting. Rotterdam. Available at:
http://c.ymcdn.com/sites/www.celltherapysociety.org/resource/resmgr/uploads/file
s/Annual Meetings/2011/Presentations/ISCT 2011 Levine Tech Session 2 for
web.pdf [Accessed December 24, 2016].
Levine, B., 2011b. Magnetic and centrifugal based sorting for clinical trials. ISCT
meeting.
Levine, B., 2015. Performance-enhancing drugs: design and production of redirected
chimeric antigen receptor (CAR) T cells. Cancer Gene Therapy, 22(2), pp.79–84.
Available at: http://www.ncbi.nlm.nih.gov/pubmed/25675873 [Accessed December
24, 2016].
Levine, B., 2015. Performance-enhancing drugs: design and production of redirected
chimeric antigen receptor (CAR) T cells. Cancer Gene Therapy, 22(2), pp.79–84.
Available at: http://www.nature.com/doifinder/10.1038/cgt.2015.5 [Accessed May
19, 2017].
Levine, H. et al., 2012. Efficient, Flexible Facilities for the 21st Century. Supplement 2
BioProcess International, 10(11).
Li, M., Atkins, H. & Bubela, T., 2014a. The global landscape of stem cell clinical trials.
Regenerative medicine, 9(1), pp.27–39. Available at:
http://www.ncbi.nlm.nih.gov/pubmed/24236476.
Li, M., Atkins, H. & Bubela, T., 2014b. The global landscape of stem cell clinical trials.
Regenerative Medicine, 9(1), pp.27–39. Available at:
http://www.futuremedicine.com/doi/10.2217/rme.13.80 [Accessed May 2, 2017].
Li, Y. & Kurlander, R., 2010. Comparison of anti-CD3 and anti-CD28-coated beads with
soluble anti-CD3 for expanding human T cells: differing impact on CD8 T cell
phenotype and responsiveness to restimulation. Journal of translational medicine,
8, p.104. Available at: http://www.ncbi.nlm.nih.gov/pubmed/20977748 [Accessed
December 25, 2016].
Liebergall, M. et al., 2013. Stem Cell–based Therapy for Prevention of Delayed Fracture

290
Union: A Randomized and Prospective Preliminary Study. Molecular Therapy,
21(8), pp.1631–1638. Available at:
http://www.ncbi.nlm.nih.gov/pubmed/23732992 [Accessed May 12, 2017].
Liechtenstein, T., Perez-Janices, N. & Escors, D., 2013. Lentiviral vectors for cancer
immunotherapy and clinical applications. Cancers, 5(3), pp.815–837.
Lim, A. et al., 2006. A computer-aided approach to compare the production economics
of fed-batch and perfusion culture under uncertainty. Biotechnology and
Bioengineering, 93(4), pp.687–697. Available at:
http://www.ncbi.nlm.nih.gov/pubmed/16259001 [Accessed May 28, 2017].
Lin, Y. & Hogan, W., 2011. Clinical Application of Mesenchymal Stem Cells in the
Treatment and Prevention of Graft-versus-Host Disease. Advances in hematology,
2011, p.427863. Available at: http://www.ncbi.nlm.nih.gov/pubmed/22190941
[Accessed May 13, 2017].
Lindroos, B. et al., 2009. Serum-free, xeno-free culture media maintain the proliferation
rate and multipotentiality of adipose stem cells in vitro. Cytotherapy, 11(7), pp.958–
972. Available at:
http://www.sciencedirect.com.libproxy.ucl.ac.uk/science/article/pii/S14653249097
03433 [Accessed May 18, 2017].
Linette, G. et al., 2013. Cardiovascular toxicity and titin cross-reactivity of af fi nity-
enhanced T cells in myeloma and melanoma. Blood, 122(6), pp.863–872.
Lipsitz, Y., Timmins, N. & Zandstra, P., 2016. Quality cell therapy manufacturing by
design. NATURE BIOTECHNOLOGY, 34(4). Available at:
http://www.nature.com.libproxy.ucl.ac.uk/nbt/journal/v34/n4/pdf/nbt.3525.pdf
[Accessed May 25, 2017].
Lopes, A., 2015. Single-use in the biopharmaceutical industry: A review of current
technology impact, challenges and limitations. Food and Bioproducts Processing,
93, pp.98–114.
Lopez, F. et al., 2010. A Quality Risk Management Model Approach for Cell Therapy
Manufacturing. Risk Analysis, 30(12), pp.1857–1871.
Lu, L. et al., 2006. Isolation and characterization of human umbilical cord mesenchymal
stem cells with hematopoiesis-supportive function and other potentials.
Haematologica, 91(8). Available at:
http://www.haematologica.org/content/91/8/1017.full.pdf+html [Accessed May 18,
2017].
Majhail, N. et al., 2015. Indications for Autologous and Allogeneic Hematopoietic Cell
Transplantation: Guidelines from the American Society for Blood and Marrow
Transplantation. Biology of Blood and Marrow Transplantation, 21(11), pp.1863–
1869. Available at:
http://www.sciencedirect.com/science/article/pii/S1083879115005121 [Accessed
May 4, 2017].
Malek, S., Advances in chronic lymphocytic leukemia,
Malik, N., 2012. Supplementary Material for Allogeneic Versus Autologous Stem-Cell
Therapy: Manufacturing Costs and Commercialization Strategies. BioPharm
International, 25(7).
Mamidi, M. et al., 2012. Comparative cellular and molecular analyses of pooled bone
marrow multipotent mesenchymal stromal cells during continuous passaging and
after successive cryopreservation. Journal of Cellular Biochemistry, 113(10),

291
pp.3153–3164. Available at: http://doi.wiley.com/10.1002/jcb.24193 [Accessed
May 9, 2017].
Manchikanti, L. et al., 2015. Cost Utility Analysis of Percutaneous Adhesiolysis in
Managing Pain of Post-lumbar Surgery Syndrome and Lumbar Central Spinal
Stenosis. Pain Practice, 15(5), pp.414–422. Available at:
http://www.ncbi.nlm.nih.gov/pubmed/24666747 [Accessed June 14, 2017].
Mansbridge, J., 2006. Commercial considerations in tissue engineering. Journal of
Anatomy, 209(4), pp.527–532. Available at: http://doi.wiley.com/10.1111/j.1469-
7580.2006.00631.x [Accessed May 5, 2017].
Marr, L. et al., 2012. Immunology in the clinic review series; focus on cancer: Double
trouble for tumours: Bi-functional and redirected T cells as effective cancer
immunotherapies. Clinical and Experimental Immunology, 167(2), pp.216–225.
Martin, P., Hawksley, R. & Turner, A., 2009. The Commercial Development of Cell
Therapy – Lessons for the Future ? Survey of the Cell Therapy Industry and the Main
Products in Use and Development Part 1 : Summary of findings. Engineering and
Physical Science Research Council, EPSRC, (April), pp.1–43.
Martin, Y. et al., 2011. Microcarriers and their potential in tissue regeneration. Tissue
engineering. Part B, Reviews, 17(1), pp.71–80. Available at:
http://www.ncbi.nlm.nih.gov/pubmed/21083436 [Accessed May 24, 2017].
Mason, C. et al., 2011. Cell therapy industry: billion dollar global business with unlimited
potential. Regenerative Medicine, 6(3), pp.265–272. Available at:
http://www.futuremedicine.com/doi/10.2217/rme.11.28 [Accessed May 5, 2017].
Mason, C. & Dunnill, P., 2009. Assessing the value of autologous and allogeneic cells
for regenerative medicine. Regen Med, 4(6), pp.835–853. Available at:
http://dx.doi.org/10.2217/rme.09.64.
MaSTherCell, MaSTherCell - Take a Tour. MaSTherCell. Available at:
http://www.masthercell.com/Take-a-Tour [Accessed March 16, 2017].
Maus, M. et al., 2014. ANTIBODY DERIVATIVES AS NEW THERAPEUTICS FOR
HEMATOLOGIC Antibody-modi fi ed T cells : CARs take the front seat for
hematologic malignancies. Blood, 123(17), pp.2625–2635.
Maus, M. et al., 2013. T Cells Expressing Chimeric Antigen Receptors Can Cause
Anaphylaxis in Humans. Cancer Immunology Research, 1(1). Available at:
http://cancerimmunolres.aacrjournals.org/content/1/1/26.full [Accessed May 15,
2017].
McAllister, T. et al., 2008. Cell-based therapeutics from an economic perspective: primed
for a commercial success or a research sinkhole? Regenerative medicine, 3(6),
pp.925–937.
Medcalf, N., 2016. Centralized or decentralized manufacturing ? Key business model
considerations for cell therapies. Cell and Gene Therapy Insights, 2(1), pp.95–109.
Medipost, MEDIPOST - The Future of Biotechnology. Available at: http://www.medi-
post.com/front/eng/stemcell/cartistem.do [Accessed May 5, 2017].
Meehan, K. et al., 2000. Mobilization, Collection, and Processing of Autologous
Peripheral Blood Stem Cells: Development of a Clinical Process with Associated
Costs. JOURNAL OF HEMATOTHERAPY & STEM CELL RESEARCH, 9, pp.767–
771. Available at: www.liebertpub.com [Accessed July 8, 2018].
Melchiori, L. et al., 2014. Process improvement and comparability analysis for
engineered T cell manufacture. Journal for ImmunoTherapy of Cancer, 2(Suppl 3),

292
p.P29. Available at: http://jitc.biomedcentral.com/articles/10.1186/2051-1426-2-
S3-P29.
Melero-Martin, J. et al., 2006. Expansion of chondroprogenitor cells on macroporous
microcarriers as an alternative to conventional monolayer systems. Biomaterials,
27(15), pp.2970–2979. Available at:
http://www.ncbi.nlm.nih.gov/pubmed/16455134 [Accessed May 24, 2017].
Mendicino, M. et al., 2014. MSC-Based Product Characterization for Clinical Trials: An
FDA Perspective. Cell Stem Cell, 14(2), pp.141–145. Available at:
http://www.sciencedirect.com/science/article/pii/S1934590914000149 [Accessed
May 9, 2017].
Meuwly, F. et al., 2007. Packed-bed bioreactors for mammalian cell culture: Bioprocess
and biomedical applications. Biotechnology Advances, 25(1), pp.45–56. Available
at: http://www.sciencedirect.com/science/article/pii/S0734975006000991
[Accessed May 24, 2017].
Michiels, J.-F. & Egloff, M., 2013. Scaling Up Stem Cells. GEN magazine , 33(2).
Available at: http://www.genengnews.com/gen-articles/scaling-up-stem-cells/4690
[Accessed May 24, 2017].
MilliporeSigma, 2017. Renaissance in Immunotherapy in South Korea. Available at:
http://www.emdmillipore.com/INTERSHOP/static/WFS/Merck-Site/-
/Merck/en_US/EmergingBiotech/downloads/PR1254ENUS.pdf [Accessed May 5,
2017].
Milone, M. et al., 2009. Chimeric receptors containing CD137 signal transduction
domains mediate enhanced survival of T cells and increased antileukemic efficacy
in vivo. Mol Ther, 17(8), pp.1453–1464. Available at:
http://www.ncbi.nlm.nih.gov/pubmed/19384291.
Mizukami, A. et al., 2016. Stirred tank bioreactor culture combined with serum-
/xenogeneic-free culture medium enables an efficient expansion of umbilical cord-
derived mesenchymal stem/stromal cells. Biotechnology Journal, 11(8), pp.1048–
1059. Available at: http://doi.wiley.com/10.1002/biot.201500532 [Accessed May
24, 2017].
Mock, U. et al., 2016. Automated manufacturing of chimeric antigen receptor T cells for
adoptive immunotherapy using CliniMACS Prodigy. Cytotherapy, 18(8), pp.1002–
1011. Available at:
http://www.sciencedirect.com/science/article/pii/S1465324916303838 [Accessed
May 31, 2017].
Morgan, R. et al., 2013. Cancer Regression and Neurological Toxicity Following Anti-
MAGE-A3 TCR Gene Therapy. Journal of Immunotherapy, 36(2), pp.133–151.
Available at: http://www.ncbi.nlm.nih.gov/pubmed/23377668 [Accessed December
24, 2016].
Morgan, R. et al., 2006. Cancer regression in patients after transfer of genetically
engineered lymphocytes. Science (New York, N.Y.), 314(5796), pp.126–9. Available
at:
http://www.ncbi.nlm.nih.gov/pubmed/16946036%5Cnhttp://www.pubmedcentral.n
ih.gov/articlerender.fcgi?artid=PMC2267026.
Morgan, R. et al., 2006. Cancer Regression in Patients After Transfer of Genetically
Engineered Lymphocytes. Science, 314(5796), pp.126–129. Available at:
http://www.ncbi.nlm.nih.gov/pubmed/16946036 [Accessed December 24, 2016].
293
Morgan, R. et al., 2010a. Case report of a serious adverse event following the
administration of T cells transduced with a chimeric antigen receptor recognizing
ERBB2. Molecular therapy : the journal of the American Society of Gene Therapy,
18(4), pp.843–51. Available at: http://www.ncbi.nlm.nih.gov/pubmed/20179677
[Accessed December 24, 2016].
Morgan, R. et al., 2010b. Case Report of a Serious Adverse Event Following the
Administration of T Cells Transduced With a Chimeric Antigen Receptor
Recognizing ERBB2. Molecular Therapy, 18(4), pp.843–851. Available at:
http://www.sciencedirect.com/science/article/pii/S1525001616323425 [Accessed
May 16, 2017].
Mount, N. et al., 2015a. Cell-based therapy technology classifications and translational
challenges. Philosophical transactions of the Royal Society of London. Series B,
Biological sciences, 370(1680), p.20150017-. Available at:
http://rstb.royalsocietypublishing.org/content/370/1680/20150017.long.
Mount, N. et al., 2015b. Cell-based therapy technology classifications and translational
challenges. Philosophical Transactions of the Royal Society of London B: Biological
Sciences, 370(1680). Available at:
http://rstb.royalsocietypublishing.org/content/370/1680/20150017 [Accessed May
16, 2017].
Mukherjee, S., 2017. Novartis Kymriah CMS Deal: Is $475,00 Too Much for the Drug?
| Fortune. Fortune. Available at: http://fortune.com/2017/08/31/novartis-kymriah-
car-t-cms-price/ [Accessed November 19, 2017].
Naghdi, M. et al., 2009. Transdifferentiation of bone marrow stromal cells into
cholinergic neuronal phenotype: a potential source for cell therapy in spinal cord
injury. Cytotherapy, 11(2), pp.137–152. Available at:
http://linkinghub.elsevier.com/retrieve/pii/S1465324909702580 [Accessed May 9,
2017].
Naldini, L. et al., 1996. In vivo gene delivery and stable transduction of nondividing cells
by a lentiviral vector. Science (New York, N.Y.), 272(5259), pp.263–7. Available at:
http://www.ncbi.nlm.nih.gov/pubmed/8602510 [Accessed December 25, 2016].
Naldini, L. et al., 1996. In Vivo Gene Delivery and Stable Transduction of Nondividing
Cells by a Lentiviral Vector Published by : American Association for the
Advancement of Science Stable URL : http://www.jstor.org/stable/2889637
Accessed : 06-04-2016 15 : 36 UTC Your use of the. Science, 272(5259), pp.263–
267.
Naughton, C., Bennett, K. & Feely, J., 2006. Prevalence of chronic disease in the elderly
based on a national pharmacy claims database. Age and Ageing, 35(6), pp.633–636.
Available at: https://academic.oup.com/ageing/article-
lookup/doi/10.1093/ageing/afl106 [Accessed May 5, 2017].
Nelsen, B., 2017. Automation of Cell Therapy Manufacturing | Barbara Nelsen, Ph.D.,
M.B.A. | Pulse | LinkedIn. Linkedin. Available at:
https://www.linkedin.com/pulse/automation-cell-therapy-manufacturing-barbara-
nelsen-ph-d-m-b-a- [Accessed May 27, 2017].
New jersey business, 2012. Novartis buys Morris Plains drug manufacturing site in $43M
deal | NJBIZ. New Jersey business. Available at:
http://www.njbiz.com/article/20121220/NJBIZ01/121229984/novartis-buys-
morris-plains-drug-manufacturing-site-in-43m-deal [Accessed March 16, 2017].
294
Newick, K. et al., 2017. CAR T Cell Therapy for Solid Tumors. Annual Review of
Medicine, 68(1), pp.139–152. Available at:
http://www.annualreviews.org/doi/10.1146/annurev-med-062315-120245
[Accessed May 16, 2017].
Ng, Y.-C., Berry, J. & Butler, M., 1996. Optimization of physical parameters for cell
attachment and growth on macroporous microcarriers. Biotechnology and
Bioengineering, 50(6), pp.627–635. Available at:
http://www.ncbi.nlm.nih.gov/pubmed/18627071 [Accessed May 24, 2017].
Di Nicola, M. et al., 2002. Human bone marrow stromal cells suppress T-lymphocyte
proliferation induced by cellular or nonspecific mitogenic stimuli. Blood, 99(10).
Available at: http://www.bloodjournal.org/content/99/10/3838?sso-checked=true
[Accessed May 9, 2017].
Nie, W., 2015. COST EVALUATION AND PORTFOLIO MANAGEMENT
OPTIMIZATION FOR BIOPHARMACEUTICAL PRODUCT DEVELOPMENT.
University College London. Available at:
http://discovery.ucl.ac.uk/1461733/1/Thesis final version.pdf [Accessed August 11,
2018].
Niphadkar, S. et al., 2016. Autologous Stem Cell Transplant: A Cost Effective and
Efficacious Treatment for Newly Diagnosed Multiple Myeloma. Blood, 128(22).
Noort, W. et al., 2010. Mesenchymal stromal cells to treat cardiovascular disease:
strategies to improve survival and therapeutic results. Panminerva medica, 52(1),
pp.27–40. Available at: http://www.ncbi.nlm.nih.gov/pubmed/20228724 [Accessed
May 9, 2017].
Novais, J., Titchener-Hooker, N. & Hoare, M., 2001. Economic comparison between
conventional and disposables-based technology for the production of
biopharmaceuticals. Biotechnology and Bioengineering, 75(2), pp.143–153.
Novartis, 2015. Novartis highlights new CTL019 Phase II data demonstrating 93%
complete remission in pediatric patients with r/r ALL | Novartis. Available at:
https://www.novartis.com/news/media-releases/novartis-highlights-new-ctl019-
phase-ii-data-demonstrating-93-complete-remission [Accessed December 24,
2016].
Nuvasive, 2017. An introduction to Osteocel: Allograft cellular bone graft. Available at:
https://www.nuvasive.com/wp-content/uploads/2017/03/Osteocel-Patient-
Education-Brochure-US.pdf [Accessed May 6, 2017].
Octane, “see How” Octane technology can impact your goals. Available at:
http://octaneco.com/octane-download.pdf [Accessed May 25, 2017].
Office for National Statistics, 2014. National Life tables, United Kingdom, 2011-2013,
Available at:
http://webarchive.nationalarchives.gov.uk/20160105160709/http://www.ons.gov.u
k/ons/dcp171778_377972.pdf [Accessed May 5, 2017].
Olson, S. et al., 2012. Examination of mesenchymal stem cell-mediated RNAi transfer to
Huntington’s disease affected neuronal cells for reduction of huntingtin. Molecular
and Cellular Neuroscience, 49(3), pp.271–281. Available at:
http://linkinghub.elsevier.com/retrieve/pii/S104474311100265X [Accessed May 2,
2017].
Organogenesis, 2008. Apligraf : Reimbursement : Coding : HCPCS Product Code.
Available at:
295
http://www.apligraf.com/professional/reimbursement/coding/HCPCSCode.html
[Accessed May 5, 2017].
Organogenesis, 2015. Hospital outpatient setting. Available at:
http://www.dermagraft.com/wp-content/uploads/sites/1/Dermagraft_Hotsheet-
2015-Q3HOSPITAL.pdf [Accessed May 5, 2017].
Orthofix, Pages - Trinity Evolution®. Available at:
http://web.orthofix.com/Products/Pages/Trinity-Evolution.aspx [Accessed May 6,
2017].
Osiris, Osiris Therapeutics Inc. | Clinical Trials - Phase III Trial For Steroid-Refractory
Acute GvHD Is Currently Enrolling Patients. Available at:
http://osiris.com/OLD/clinical_prochymal_eap.php [Accessed May 6, 2017].
Ostrowska, A. et al., 2009. Hypothermic storage of isolated human hepatocytes: a
comparison between University of Wisconsin solution and a hypothermosol
platform. Archives of Toxicology, 83(5), pp.493–502. Available at:
http://link.springer.com/10.1007/s00204-009-0419-x [Accessed May 13, 2017].
Pall Corporation, XRS 20 Bioreactor System. Available at:
https://www.pall.com/main/biopharmaceuticals/product.page?lid=hdf24174
[Accessed December 24, 2016].
Pall Life sciences, 2015. Expansion of Vero Cells on Hillex® II Microcarriers via Serial
Passage in Stirred Vessels. Available at:
http://www.pall.de/pdfs/Biopharmaceuticals/Microcarriers_Vero_Cell_Expansion_
USD2974_AN.pdf [Accessed May 24, 2017].
Panchalingam, K. et al., 2015. Bioprocessing strategies for the large-scale production of
human mesenchymal stem cells: a review. Stem Cell Research & Therapy, 6(1),
p.225. Available at: http://www.ncbi.nlm.nih.gov/pubmed/26597928 [Accessed
May 24, 2017].
Pang, X., Yang, H. & Peng, B., 2014. Human umbilical cord mesenchymal stem cell
transplantation for the treatment of chronic discogenic low back pain. Pain
physician, 17(4), pp.E525-30. Available at:
http://www.ncbi.nlm.nih.gov/pubmed/25054402 [Accessed May 13, 2017].
Park, S. & Stephanopoulos, G., 1993. Packed bed bioreactor with porous ceramic beads
for animal cell culture. Biotechnology and Bioengineering, 41(1), pp.25–34.
Available at: http://doi.wiley.com/10.1002/bit.260410105 [Accessed May 24,
2017].
Parker, L. et al., 2000. Expansion and Characterization of T Cells Transduced with a
Chimeric Receptor against Ovarian Cancer. HUMAN GENE THERAPY, 11,
pp.2377–2387. Available at:
http://online.liebertpub.com.libproxy.ucl.ac.uk/doi/pdf/10.1089/104303400750038
480 [Accessed March 24, 2017].
Parkhurst, M. et al., 2011. T cells targeting carcinoembryonic antigen can mediate
regression of metastatic colorectal cancer but induce severe transient colitis.
Molecular therapy : the journal of the American Society of Gene Therapy, 19(3),
pp.620–6. Available at: http://dx.doi.org/10.1038/mt.2010.272.
Pattasseril, J. et al., 2013. Downstream technology landscape for large-scale therapeutic
cell processing. BioProcess International, 11(SUPPL. 3), pp.38–47.
Paul, S. et al., 2010. How to improve R&D productivity: the pharmaceutical
industry’s grand challenge. Nature Reviews Drug Discovery, 9(3), p.203. Available

296
at: http://www.nature.com/doifinder/10.1038/nrd3078 [Accessed May 25, 2017].
Pavlotsky, R., 2004. Approximating facilities costs. Solid State Technology. Available at:
http://electroiq.com/blog/2004/08/approximating-facilities-costs/ [Accessed
February 28, 2017].
Peng, L. et al., 2008. Comparative Analysis of Mesenchymal Stem Cells from Bone
Marrow, Cartilage, and Adipose Tissue. Stem Cells and Development, 17(4),
pp.761–774. Available at:
http://www.liebertonline.com/doi/abs/10.1089/scd.2007.0217 [Accessed May 18,
2017].
Penn Medicine News, 2016. Novartis-Penn Center for Advanced Cellular Therapeutics
Unveiled at Penn Medicine – PR News. Penn Medicine News. Available at:
https://www.pennmedicine.org/news/news-releases/2016/february/novartispenn-
center-for-advanc [Accessed March 16, 2017].
Percell Biolytica, Growth of HeLa cells. Available at: http://www.percell.se/116.pdf.
Pereira Chilima, T., Bovy, T. & Farid, S., 2016. Designing the Optimal Manufacturing
Strategy for an Adherent Allogeneic Cell Therapy. Bioprocess int, 14(9), pp.24–32.
Peters, M. & Timmerhaus, K., 1991. PLANT DESIGN AND ECONOMICS FOR
CHEMICAL ENGINEERS 4th ed.,
Petrides, D. et al., 2015. Bioprocess Design and Economics Bioseparations Science and
Engineering (2 nd Edition). Available at:
http://www.intelligen.com/downloads/BioProcessDesignAndEconomics_March_2
015.pdf [Accessed February 25, 2017].
Petry, F. et al., 2016. Manufacturing of Human Umbilical Cord Mesenchymal Stromal
Cells on Microcarriers in a Dynamic System for Clinical Use. Stem Cells
International, 2016, pp.1–12. Available at:
http://www.hindawi.com/journals/sci/2016/4834616/ [Accessed May 24, 2017].
Pharma IQ, 2013. Single Use Systems 6 Hot Topics for Disposable Solutions in
Biomanufacturing 3. Available at:
https://disposablebiomanufacturing.iqpc.co.uk/hot-topics-in-single-use-systems-
mc?ty-m= [Accessed February 22, 2017].
Pittenger, M. et al., 1999. Multilineage potential of adult human mesenchymal stem cells.
Science (New York, N.Y.), 284(5411), pp.143–7. Available at:
http://www.ncbi.nlm.nih.gov/pubmed/10102814 [Accessed May 9, 2017].
Poirot, L. et al., 2015. Multiplex genome edited T-cell manufacturing platform for
"off-the-shelf" adoptive T-cell immunotherapies. Cancer Research.
Pollard, D. et al., 2016. Standardized Economic Cost Modeling for Next-Generation MAb
Production. BioProcess International, 14(8). Available at:
http://www.bioprocessintl.com/wp-content/uploads/2016/09/14-08-Pollard.pdf
[Accessed May 28, 2017].
Pollock, J., Ho, S. & Farid, S., 2013. Fed-batch and perfusion culture processes:
Economic, environmental, and operational feasibility under uncertainty.
Biotechnology and Bioengineering, 110(1), pp.206–219. Available at:
http://www.ncbi.nlm.nih.gov/pubmed/22806692 [Accessed February 28, 2017].
Porter, D. et al., 2009. PILOT STUDY OF REDIRECTED AUTOLOGOUS T CELLS
ENGINEERED TO CONTAIN ANTI-CD19 ATTACHED TO TCRζ AND 4-1BB
SIGNALING DOMAINS IN PATIENTS WITH CHEMOTHERAPY RESISTANT
OR REFRACTORY CD19+ LEUKEMIA AND LYMPHOMA Principal
297
Investigator.
Porwollik, S., 2016. GMP-in-a-box – the future in cell therapy production? - Sampling
Science®. SamplingScience. Available at:
http://www.biocision.com/blog/12819/gmp-in-a-box-cell-therapy-production
[Accessed February 24, 2017].
Pourmoussa, A. et al., 2016. An update and review of cell-based wound dressings and
their integration into clinical practice. Annals of translational medicine, 4(23),
p.457. Available at: http://www.ncbi.nlm.nih.gov/pubmed/28090513 [Accessed
May 6, 2017].
Powell, D. et al., 2009. Efficient clinical-scale enrichment of lymphocytes for use in
adoptive immunotherapy using a modified counterflow centrifugal elutriation
program. Cytotherapy, 11(7), pp.923–935. Available at:
http://www.sciencedirect.com.libproxy.ucl.ac.uk/science/article/pii/S14653249097
03408 [Accessed April 3, 2017].
PR Newswire, 2016. T-Cell Immunotherapy Market, 2015-2030. Available at:
http://www.prnewswire.com/news-releases/t-cell-immunotherapy-market-2015-
2030-300234571.html [Accessed December 24, 2016].
Prasad, S., Sung, B. & Aggarwal, B., 2012. Age-associated chronic diseases require age-
old medicine: Role of chronic inflammation. Preventive Medicine, 54, pp.S29–S37.
Available at: http://www.ncbi.nlm.nih.gov/pubmed/22178471 [Accessed May 5,
2017].
Prieels, J.P. et al., 2012. Mastering industrialization of cell therapy products: An
opportunity for dedicated CMOs. BioProcess International, 10(SUPPL. 3), pp.12–
15.
Princeton, N., 2004. The Seattle Times: Business & Technology: Cray posts surprise
loss on defense sales decline. The Seattle times. Available at:
http://old.seattletimes.com/html/businesstechnology/2001916192_bizbriefs30.html
[Accessed March 16, 2017].
Prnewswire, 2016. Stem Cell Therapy Market Worth USD 60.94 Billion by 2022 - Scalar
Market Research. Prnewswire. Available at: http://www.prnewswire.com/news-
releases/stem-cell-therapy-market-worth-usd-6094-billion-by-2022---scalar-
market-research-599469571.html [Accessed May 5, 2017].
Pui, C.-H. & Evans, W., 2006. Treatment of Acute Lymphoblastic Leukemia. New
England Journal of Medicine, 354(2), pp.166–178. Available at:
http://www.ncbi.nlm.nih.gov/pubmed/16407512 [Accessed December 24, 2016].
Qasim, W. et al., 2017. Title: Molecular remission of infant B-ALL after infusion of
universal TALEN gene-edited CAR T cells. Science translational medicine, 9(374),
pp.1–14. Available at: http://discovery.ucl.ac.uk/1538479/1/QASIM aaj2013_final
OA wq.pdf [Accessed May 18, 2017].
Qasim, W. & Thrasher, A., 2014. Progress and prospects for engineered T cell therapies.
British Journal of Haematology, 166(6), pp.818–829. Available at:
http://www.ncbi.nlm.nih.gov/pubmed/24935654 [Accessed December 24, 2016].
Rafiq, Q., 2013. Culture of human mesenchymal stem cells on microcarriers in a 5 l
stirred-tank bioreactor. Biotechnology Letters, 35(8), pp.1233–1245. Available at:
http://dx.doi.org/10.1007/s10529-013-1211-9 [Accessed May 24, 2017].
Rafiq, Q., 2016. Decentralized Manufacture: The Drivers and Barriers. Fisher
BioServices. Available at: http://blog.fisherbioservices.com/decentralized-
298
manufacture-the-drivers-and-barriers [Accessed May 27, 2017].
Ramkisoensing, A. et al., 2011. Human Embryonic and Fetal Mesenchymal Stem Cells
Differentiate toward Three Different Cardiac Lineages in Contrast to Their Adult
Counterparts D. T. Covas, ed. PLoS ONE, 6(9), p.e24164. Available at:
http://dx.plos.org/10.1371/journal.pone.0024164 [Accessed May 9, 2017].
Ramsey, L., 2017. CAR-T cell therapy approval Gilead Kite Yescarta - Business Insider.
Business Insider . Available at: http://uk.businessinsider.com/car-t-cell-therapy-
approval-gilead-kite-2017-10 [Accessed November 19, 2017].
Rao, R., 2007. Introduction to Multiple Attribute Decision-making (MADM) Methods.
In Decision Making in the Manufacturing Environment. London: Springer London,
pp. 27–41. Available at: http://link.springer.com/10.1007/978-1-84628-819-7_3
[Accessed May 28, 2017].
Rasmussen, A.-M. et al., 2010. Ex vivo expansion protocol for human tumor specific T
cells for adoptive T cell therapy. Journal of Immunological Methods, 355(1–2),
pp.52–60. Available at:
http://linkinghub.elsevier.com/retrieve/pii/S0022175910000384 [Accessed March
24, 2017].
Ratcliffe, E., Thomas, R. & Williams, D., 2011. Current understanding and challenges in
bioprocessing of stem cell-based therapies for regenerative medicine. British
Medical Bulletin, 100(1), pp.137–155.
Raviv, L. & Karnieli, O., 2014. The challenges & Possible solutions for transferring cell
therapy from the bench to the industry. Drug Development and Delivery, 14(2),
pp.58–67.
Raynaud, C. et al., 2012. Comprehensive characterization of mesenchymal stem cells
from human placenta and fetal membrane and their response to osteoactivin
stimulation. Stem cells international, 2012, p.658356. Available at:
http://www.ncbi.nlm.nih.gov/pubmed/22701494 [Accessed May 9, 2017].
Rayner, A., 2010. The application of disposable single use equipment, and it’s impact on
biopharma plat design. Available at:
https://www.slideshare.net/Andy_Rayner/single-use-disposables-presentation
[Accessed February 22, 2017].
Rees, R., 2014. Tumor immunology and immunotherapy,
Reinders, M. et al., 2013. Autologous bone marrow-derived mesenchymal stromal cells
for the treatment of allograft rejection after renal transplantation: results of a phase
I study. Stem cells translational medicine, 2(2), pp.107–11. Available at:
http://www.ncbi.nlm.nih.gov/pubmed/23349326 [Accessed May 9, 2017].
reliance life sciences, Product and services: Relinethra C. Available at:
http://www.rellife.com/products_relinethra_c.html [Accessed May 6, 2017].
Reliance life sciences, Products and services Cardiorel. Available at:
http://www.rellife.com/products_cardiorel.html [Accessed May 6, 2017].
Reuters, 2015. Novartis, Juno face production hurdles for new blood cancer drugs |
Reuters. Available at: http://in.reuters.com/article/us-pharmaceuticals-cancer-
factories-anal-idINKCN0SO0F520151030F520151030 [Accessed December 24,
2016].
Robertson, K., 2010. Stem cell research center to open at UCD med center - Sacramento
Business Journal. Sacramento Business Journal. Available at:
http://www.bizjournals.com/sacramento/stories/2010/03/01/daily53.html [Accessed

299
March 16, 2017].
Rogge, P., Müller, D. & Schmidt, S., 2015. The Single-Use or Stainless Steel Decision
Process: A CDMO Perspective -. Bioprocess International. Available at:
http://www.bioprocessintl.com/manufacturing/single-use/the-single-use-or-
stainless-steel-decision-process-a-cdmo-perspective/ [Accessed February 22, 2017].
Rontis medical, COBE 2991 Cell Processor | Rontis Medical. Available at:
http://rontismedical.com/cobe-2991-cell-processor/ [Accessed December 24, 2016].
Rosenberg, S. et al., 1994. Treatment of Patients With Metastatic Melanoma With
Lymphocytes and Interleukin 2 Growth of TIL Cultures. Journal of the National
Cancer Institute, 86(15), pp.1159–1166.
Rosenberg, S. & Restifo, N., 2015. Adoptive cell transfer as personalized immunotherapy
for human cancer. Science, 348(6230), pp.62–68. Available at:
http://www.sciencemag.org/cgi/doi/10.1126/science.aaa4967.
Rowley, J. et al., 2012. Meeting lot-size challenges of manufacturing adherent cells for
therapy. BioProcess International, 10(SUPPL. 3), pp.16–22.
Sadeghi, A. et al., 2011. Large-scale bioreactor expansion of tumor-infiltrating
lymphocytes. Journal of Immunological Methods, 364(1–2), pp.94–100. Available
at: http://www.ncbi.nlm.nih.gov/pubmed/21111743 [Accessed December 24, 2016].
Sagonowsky, E., 2017a. At $475,000, is Novartis’ Kymriah a bargain—or another
example of skyrocketing prices? | FiercePharma. FiercePharma. Available at:
https://www.fiercepharma.com/pharma/at-475-000-per-treatment-novartis-
kymriah-a-bargain-or-just-another-example-skyrocketing [Accessed May 10,
2018].
Sagonowsky, E., 2017b. At $475,000, is Novartis’ Kymriah a bargain—or another
example of skyrocketing prices? | FiercePharma. FiercePharma. Available at:
https://www.fiercepharma.com/pharma/at-475-000-per-treatment-novartis-
kymriah-a-bargain-or-just-another-example-skyrocketing [Accessed November 19,
2017].
Saint-Gobain, 2016. VueLife ® Closed Culture System, Available at:
file:///C:/Users/Tania/Downloads/vuelife-closed-culture-system-brochure.pdf
[Accessed May 23, 2017].
Sandstrom, C., 2009. Disposable vs. Traditional equipment - A facility wide view. SBE
Special supplement: Disposables, pp.30–35.
Sandstrom, C., Single-use / Disposable Technology | Considerations for
Biopharmaceutical Facility Design. Pharma focus Asia. Available at:
https://www.pharmafocusasia.com/manufacturing/singleuse-disposable-technology
[Accessed February 22, 2017].
Sargent, B., 2013. Single-use stirred bioreactors: Enabling flexible biomanufacturing. The
cell dish culture. Available at: http://cellculturedish.com/2013/09/single-use-stirred-
bioreactors-enabling-flexible-biomanufacturing/.
Sart, S., Schneider, Y.-J. & Agathos, S., 2010. Influence of culture parameters on ear
mesenchymal stem cells expanded on microcarriers. Journal of Biotechnology,
150(1), pp.149–160. Available at: http://www.ncbi.nlm.nih.gov/pubmed/20708046
[Accessed May 24, 2017].
Schlatter, S. & Sood, R., Epicel Skin Grafts. Available at:
http://www.ele.uri.edu/Courses/bme281/F08/Sarah_1.pdf [Accessed May 5, 2017].
Schoenborn, J. et al., 2007. Transfection of primary mouse T cells for stimulation-

300
dependent cytokine enhancer assays : Protocol Exchange. Nature. Available at:
http://www.nature.com/protocolexchange/protocols/237 [Accessed December 24,
2016].
Schop, D. et al., 2008. Expansion of mesenchymal stem cells using a microcarrier-based
cultivation system: growth and metabolism. Journal of Tissue Engineering and
Regenerative Medicine, 2(2–3), pp.126–135. Available at:
http://doi.wiley.com/10.1002/term.73 [Accessed May 24, 2017].
Science daily, 2013. Stem cell therapy to repair damaged knee cartilage -- ScienceDaily.
Science daily. Available at:
https://www.sciencedaily.com/releases/2013/01/130124163246.htm [Accessed
May 5, 2017].
Seider, W., Seader, J. & Lewin, D., 2003. Product & Process Design Drinciles 2nd
ed., John Wiley and Sons Inc.
Semple, J. et al., 1993. Rapid separation of CD4+ and CD19+ lymphocyte populations
from human peripheral blood by a magnetic activated cell sorter (MACS).
Cytometry, 14(8), pp.955–960. Available at:
http://doi.wiley.com/10.1002/cyto.990140816 [Accessed April 4, 2017].
Sentman, C., 2013. Challenges of creating effective chimeric antigen receptors for cancer
therapy. Immunotherapy, 5(8), pp.783–5. Available at:
http://www.ncbi.nlm.nih.gov/pubmed/23902543 [Accessed May 16, 2017].
Serrick, C. & Scholz, M., 2005. Partial bowls using the Haemonetics Cell Saver 5: does
it produce a quality product? The journal of extra-corporeal technology, 37(2),
pp.161–4. Available at: http://www.ncbi.nlm.nih.gov/pubmed/16117453 [Accessed
May 19, 2017].
Shanley, A., 2015. Taking a "Development by Design" Approach to Cell
Therapies. PharmTech. Available at: http://www.pharmtech.com/taking-
development-design-approach-cell-therapies [Accessed May 25, 2017].
Sharpe, M. & Mount, N., 2015a. Genetically modified T cells in cancer therapy:
opportunities and challenges. Disease models & mechanisms, 8(4), pp.337–50.
Available at:
http://www.pubmedcentral.nih.gov/articlerender.fcgi?artid=4381333&tool=pmcent
rez&rendertype=abstract.
Sharpe, M. & Mount, N., 2015b. Genetically modified T cells in cancer therapy:
opportunities and challenges. Disease Models & Mechanisms, 8(4).
Sheng, H. et al., 2008. A critical role of IFNγ in priming MSC-mediated suppression of
T cell proliferation through up-regulation of B7-H1. Cell Research, 18(8), pp.846–
857. Available at: http://www.nature.com/doifinder/10.1038/cr.2008.80 [Accessed
May 9, 2017].
Sherman, R. et al., 2013. Expediting Drug Development — The FDA’s New
“Breakthrough Therapy” Designation. New England Journal of Medicine, 369(20),
pp.1877–1880. Available at: http://www.nejm.org/doi/10.1056/NEJMp1311439
[Accessed May 16, 2017].
Shukla, A. & Gottschalk, U., 2013. Single-use disposable technologies for
biopharmaceutical manufacturing. Trends in Biotechnology, 31(3), pp.147–154.
Simaria, A. et al., 2014a. Allogeneic cell therapy bioprocess economics and optimization:
Single-use cell expansion technologies. Biotechnology and Bioengineering, 111(1),
pp.69–83. Available at: http://www.ncbi.nlm.nih.gov/pubmed/23893544 [Accessed

301
December 27, 2016].
Simaria, A. et al., 2014b. Allogeneic cell therapy bioprocess economics and optimization:
Single-use cell expansion technologies. Biotechnology and Bioengineering, 111(1),
pp.69–83.
Sinclair, A. & Monge, M., 2005. Concept Facility Based on Single-Use Systems, Part 2:
Leading the Way for Biomanufacturing in the 21st Century. Bioprocess
Interntational, pp.51–55. Available at: http://www.bioprocessintl.com/wp-
content/uploads/bpi-content/0309su07_78595a.pdf [Accessed March 2, 2017].
Singh, H. et al., 2013a. Manufacture of Clinical-Grade CD19-Specific T Cells Stably
Expressing Chimeric Antigen Receptor Using Sleeping Beauty System and
Artificial Antigen Presenting Cells. PLoS ONE, 8(5), pp.1–11.
Singh, H. et al., 2013b. Manufacture of Clinical-Grade CD19-Specific T Cells Stably
Expressing Chimeric Antigen Receptor Using Sleeping Beauty System and
Artificial Antigen Presenting Cells H. M. Ashour, ed. PLoS ONE, 8(5), p.e64138.
Available at: http://dx.plos.org/10.1371/journal.pone.0064138 [Accessed March 26,
2017].
Skovrlj, B. et al., 2014. Cellular bone matrices: viable stem cell-containing bone graft
substitutes. The spine journal : official journal of the North American Spine Society,
14(11), pp.2763–72. Available at: http://www.ncbi.nlm.nih.gov/pubmed/24929059
[Accessed May 6, 2017].
Smith, C. et al., 2015. Ex vivo expansion of human T cells for adoptive immunotherapy
using the novel Xeno-free CTS Immune Cell Serum Replacement. Clinical &
translational immunology, 4(1), p.e31. Available at:
http://www.ncbi.nlm.nih.gov/pubmed/25671129 [Accessed March 24, 2017].
Smith, D., 2012a. Assessing commercial opportunities for autologous and allogeneic cell-
based products. Regenerative Medicine, 7(5), pp.721–732.
Smith, D., 2012b. Assessing commercial opportunities for autologous and allogeneic cell-
based products. Regenerative Medicine, 7(5), pp.721–732. Available at:
http://www.futuremedicine.com/doi/10.2217/rme.12.40 [Accessed February 24,
2017].
Smith, D., 2010. Manufacturing Cellular Therapies Preparing for Commercialization
Keys to Manufacturing Success. In Manufacturing Cellular Therapies Preparing for
Commercialization. London: World Stem Cells & Regenerative Medicine Congress.
Somerville, R. & Dudley, M., 2012. Bioreactors get personal. Oncoimmunology, 1(8),
pp.1435–1437. Available at:
http://www.pubmedcentral.nih.gov/articlerender.fcgi?artid=3518529&tool=pmcent
rez&rendertype=abstract.
Squillaro, T., Peluso, G. & Galderisi, U., 2016. Clinical Trials With Mesenchymal Stem
Cells: An Update. Cell Transplantation, 25(5), pp.829–848. Available at:
http://openurl.ingenta.com/content/xref?genre=article&issn=0963-
6897&volume=25&issue=5&spage=829 [Accessed May 12, 2017].
Startz, T. et al., 2016. WHITE PAPER Expansion of T-Cells in an Automated,
Functionally Closed Hollow-Fiber Bioreactor System QUANTUM ® CELL
EXPANSION SYSTEM.
Staton, T. & Palmer, E., 2012. Dendreon “monetizes” NJ plant with $43M sale to
Novartis | FiercePharma. FiercePharma. Available at:
http://www.fiercepharma.com/m-a/dendreon-monetizes-nj-plant-43m-sale-to-

302
novartis [Accessed March 16, 2017].
Stock R., 2011. Where is the Real Value in Applying Single-Use Technology to Clinical
and Commercial Manufacturing? | American Pharmaceutical Review - The Review
of American Pharmaceutical Business & Technology. American
Pharmaceutical Review. Available at:
http://www.americanpharmaceuticalreview.com/Featured-Articles/37038-Where-
is-the-Real-Value-in-Applying-Single-Use-Technology-to-Clinical-and-
Commercial-Manufacturing/ [Accessed February 22, 2017].
Stone, C., 2013. The evidence for plastic surgery, Available at:
https://books.google.co.uk/books?id=4u3QAgAAQBAJ&pg=PR9&lpg=PR9&dq=
The+Evidence+for+Plastic+Surgery+stone&source=bl&ots=-
kC3hv2eGk&sig=_061lHeO10Z2hEi9TbQg7fXsda0&hl=en&sa=X&ved=0ahUK
EwiSzqnc6NvTAhUgM8AKHRNHCFcQ6AEIJzAB#v=onepage&q=transcyte&f=
false [Accessed May 6, 2017].
StreetInsider, 2012. Pluristem (PSTI) Initiates IQ Process at cGMP Facility.
StreetInsider.com. Available at:
https://www.streetinsider.com/Corporate+News/Pluristem+(PSTI)+Initiates+IQ+Pr
ocess+at+cGMP+Facility/7809785.html [Accessed March 16, 2017].
Stroncek, D. et al., 2015. Production of Clinical T Cell Therapies. In Springer
International Publishing, pp. 129–150. Available at:
http://link.springer.com/10.1007/978-3-319-21167-1_6 [Accessed December 24,
2016].
Sui, Z., 2007. Simulation-based Meta-optimization in Vendor Managed Inventory
Systems. State University of New York at Buffalo. Available at:
http://search.proquest.com.libproxy.ucl.ac.uk/docview/304777312 [Accessed May
28, 2017].
Sullivan, T., 2002. Evaluating Environmental Decision Support Tools. BrookHaven
National Laboratory. Available at: www.bnl.gov [Accessed May 28, 2017].
Sumen, C., Williams, D. & Binder-Scholl, G., 2015. Adoptive T-cell therapies:
Unlocking the potential of engineered antigen receptors. Drug discovery world,
16(2), pp.47–54.
Sun, J. et al., 2015. Early transduction produces highly functional chimeric antigen
receptor-modified virus-specific T-cells with central memory markers: a Production
Assistant for Cell Therapy (PACT) translational application. Journal for
immunotherapy of cancer, 3, p.5. Available at:
http://www.pubmedcentral.nih.gov/articlerender.fcgi?artid=4346112&tool=pmcent
rez&rendertype=abstract.
Szczypka, M. et al., 2014. Single-use bioreactors and microcarriers. BioProcess
International, 12(3), pp.54–64.
Takara, RetroNectin® Recombinant Human Fibronectin Fragment RetroNectin®
(Recombinant Human Fibronectin Fragment),
The National Institute for Health and Care Excellence, 2014. The ReCell Spray‑On Skin
system for treating skin loss, scarring and depigmentation after burn injury |
Guidance and guidelines | NICE. Available at:
https://www.nice.org.uk/guidance/mtg21/documents/the-recell-sprayon-skin-
system-for-treating-skin-loss-scarring-and-depigmentation-after-burn-injury-
medical-technology-consultation-document [Accessed May 6, 2017].

303
ThermoFisher scientific, NuncTM Cell FactoryTM Systems. Available at:
https://www.thermofisher.com/order/catalog/product/139446 [Accessed May 22,
2017].
Thermoscientific, 2017. Harvestainer BioProcess Containers Self-contained, single-use
solutions for harvesting and separating microcarrier cell culture. Available at:
https://tools.thermofisher.com/content/sfs/brochures/harvestainer-bioprocess-
brochure.pdf [Accessed May 24, 2017].
Thirumala, S., Goebel, W. & Woods, E., 2009. Clinical grade adult stem cell banking.
Organogenesis, 5(3), pp.143–54. Available at:
http://www.ncbi.nlm.nih.gov/pubmed/20046678 [Accessed May 13, 2017].
Thirumala, S., Goebel, W. & Woods, E., 2013. Manufacturing and banking of
mesenchymal stem cells. Expert Opinion on Biological Therapy, 13(5), pp.673–691.
Available at: http://www.ncbi.nlm.nih.gov/pubmed/23339745 [Accessed May 13,
2017].
Thomas, D. et al., 2015. Clinical Development Success Rates 2006-2015. Available at:
https://www.bio.org/sites/default/files/Clinical Development Success Rates 2006-
2015 - BIO, Biomedtracker, Amplion 2016.pdf [Accessed May 25, 2017].
Thompson, C. et al., 1989. CD28 activation pathway regulates the production of multiple
T-cell-derived lymphokines/cytokines. Proceedings of the National Academy of
Sciences of the United States of America, 86(4), pp.1333–1337.
Tiene, G., 2016. Single-Use Now Key Technology in Biopharmaceutical Manufacturing
| Pharmaceutical Outsourcing - The Journal of Pharmaceutical &
Biopharmaceutical Contract Services. Pharmaceutical outsourcing. Available at:
http://www.pharmoutsourcing.com/Featured-Articles/182579-Single-Use-Now-
Key-Technology-in-Biopharmaceutical-Manufacturing/ [Accessed February 22,
2017].
Timmerman, L., 2011. Dendreon Wounds Are Self-Inflicted, Not the Start of a Biotech
Industry Virus | Xconomy. Available at:
http://www.xconomy.com/national/2011/08/08/dendreon-wounds-are-self-
inflicted-not-the-start-of-a-biotech-industry-virus/# [Accessed May 6, 2017].
Timmins, N. et al., 2012. Closed system isolation and scalable expansion of human
placental mesenchymal stem cells. Biotechnology and Bioengineering, 109(7),
pp.1817–1826. Available at: http://doi.wiley.com/10.1002/bit.24425 [Accessed
May 24, 2017].
Tompkins, M., Adkisson, H.D. & Bonner, K.F., 2013. DeNovo NT Allograft. Operative
techniques in sports medicine. Available at: http://www.jordan-
younginstitute.com/wp-content/uploads/2013/09/denovo-nt-allograft.pdf [Accessed
May 5, 2017].
Touchot, N. & Flume, M., 2015. The payers’ perspective on gene therapies. Nature
Biotechnology, 33(9), pp.902–904. Available at:
http://www.ncbi.nlm.nih.gov/pubmed/26348952 [Accessed May 7, 2017].
Tradeline, 2016. Novartis-Penn Center for Advanced Cellular Therapeutics Opens in
Philadelphia | www.tradelineinc.com. Tradeline. Available at:
https://www.tradelineinc.com/news/2016-2/novartis-penn-center-advanced-
cellular-therapeutics-opens-philadelphia [Accessed March 16, 2017].
Trainor, N., Pietak, A. & Smith, T., 2014. Rethinking clinical delivery of adult stem cell
therapies. Nature Biotechnology, 32(8), pp.729–735. Available at:
304
http://www.nature.com/nbt/journal/v32/n8/full/nbt.2970.html.
Tran, C.-A. et al., 2007. Manufacturing of Large Numbers of Patient-specific T Cells for
Adoptive Immunotherapy. Journal of Immunotherapy, 30(6), pp.644–654.
Available at:
http://content.wkhealth.com/linkback/openurl?sid=WKPTLP:landingpage&an=000
02371-200709000-00008 [Accessed March 23, 2017].
Tran, K. et al., 2008. Minimally Cultured Tumor-infiltrating Lymphocytes Display
Optimal Characteristics for Adoptive Cell Therapy. Journal of Immunotherapy,
31(8), pp.742–751. Available at: http://www.ncbi.nlm.nih.gov/pubmed/18779745
[Accessed December 24, 2016].
Trickett, A. & Kwan, Y., 2003. T cell stimulation and expansion using anti-CD3/CD28
beads. Journal of Immunological Methods, 275(1), pp.251–255.
Trounson, A. & McDonald, C., 2015. Stem Cell Therapies in Clinical Trials: Progress
and Challenges. Cell Stem Cell, 17(1), pp.11–22. Available at:
http://www.sciencedirect.com/science/article/pii/S1934590915002672 [Accessed
May 9, 2017].
Tsai, A.-C. & Ma, T., 2016. Expansion of Human Mesenchymal Stem Cells in a
Microcarrier Bioreactor. In pp. 77–86. Available at:
http://link.springer.com/10.1007/7651_2016_338 [Accessed May 24, 2017].
Tsang, E., Yung, P. & Li, J., 2004. EDDIE-Automation, a decision support tool for
financial forecasting. Decision Support Systems, 37(4), pp.559–565. Available at:
http://www.sciencedirect.com/science/article/pii/S0167923603000873 [Accessed
May 28, 2017].
Tumaini, B. et al., 2013. Simplified process for the production of anti–CD19-CAR–
engineered T cells. Cytotherapy, 15(11), pp.1406–1415. Available at:
http://www.ncbi.nlm.nih.gov/pubmed/23992830 [Accessed December 24, 2016].
Uccelli, A., Moretta, L. & Pistoia, V., 2008. Mesenchymal stem cells in health and
disease. Nature Reviews Immunology, 8(9), pp.726–736. Available at:
http://www.nature.com/doifinder/10.1038/nri2395 [Accessed May 9, 2017].
Ullah, I., Subbarao, R. & Rho, G., 2015. Human mesenchymal stem cells - current trends
and future prospective. Bioscience Reports, 35(2). Available at:
http://www.bioscirep.org/content/35/2/e00191#ref-87 [Accessed May 11, 2017].
Valton, J. et al., 2015. A Multidrug-resistant Engineered CAR T Cell for Allogeneic
Combination Immunotherapy. Molecular therapy : the journal of the American
Society of Gene Therapy, 23(9), pp.1507–18. Available at:
http://dx.doi.org/10.1038/mt.2015.104.
Verhoeyen, E. et al., 2003. IL-7 surface-engineered lentiviral vectors promote survival
and efficient gene transfer in resting primary T lymphocytes. Blood, 101(6),
pp.2167–2174.
Vericel, 2016. Epicel (cultured epidermal autografts) HDE# BH990200 Directions for
Use. Available at:
https://www.fda.gov/downloads/BiologicsBloodVaccines/BloodBloodProducts/Ap
provedProducts/PremarketApprovalsPMAs/UCM538555.pdf [Accessed May 5,
2017].
Voigt, F. et al., 2016. Sleeping Beauty transposase structure allows rational design of
hyperactive variants for genetic engineering. Nature Communications, 7, p.11126.
Available at: http://www.nature.com/doifinder/10.1038/ncomms11126 [Accessed

305
December 24, 2016].
Wagner, W. et al., 2005. Comparative characteristics of mesenchymal stem cells from
human bone marrow, adipose tissue, and umbilical cord blood. Experimental
Hematology, 33(11), pp.1402–1416. Available at:
http://www.sciencedirect.com/science/article/pii/S0301472X05003644 [Accessed
May 9, 2017].
Walker, A. & Johnson, R., 2016a. Chimeric Antigen Receptor Therapy in Haematology
and Oncology: Current Successes and Challenges Commercialization of cellular
immunotherapies for cancer The CAR-T landscape. Biochemical society
Transactions, 44, pp.329–332. Available at:
http://files.massbio.org/file/yj75EkR.vs0CW5hfj6G.2.pdf [Accessed May 16,
2017].
Walker, A. & Johnson, R., 2016b. Commercialization of cellular immunotherapies for
cancer. Biochemical Society Transactions, 44(2), pp.329–332. Available at:
http://biochemsoctrans.org/lookup/doi/10.1042/BST20150240 [Accessed February
24, 2017].
Waltz, E., 2013. Mesoblast acquires Osiris’ stem cell business. Nature Biotechnology,
31(12), pp.1061–1061. Available at:
http://www.nature.com/doifinder/10.1038/nbt1213-1061 [Accessed May 6, 2017].
Wang, G. et al., 1992. Modified CelliGen-packed bed bioreactors for hybridoma cell
cultures. Cytotechnology, 9(1–3), pp.41–49. Available at:
http://link.springer.com/10.1007/BF02521730 [Accessed May 24, 2017].
Wang, J. et al., 2010. Stem Cells from Human-Exfoliated Deciduous Teeth Can
Differentiate into Dopaminergic Neuron-Like Cells. Stem Cells and Development,
19(9), pp.1375–1383. Available at:
http://www.liebertonline.com/doi/abs/10.1089/scd.2009.0258 [Accessed May 9,
2017].
Wang, L. et al., 2009. A Comparison of Human Bone Marrow–Derived Mesenchymal
Stem Cells and Human Umbilical Cord–Derived Mesenchymal Stromal Cells for
Cartilage Tissue Engineering. Tissue Engineering Part A, 15(8), pp.2259–2266.
Available at: http://www.ncbi.nlm.nih.gov/pubmed/19260778 [Accessed May 13,
2017].
Wang, X. & Rivière, I., 2016. Clinical manufacturing of CAR T cells: foundation of a
promising therapy. Molecular Therapy - Oncolytics, 3. Available at:
http://www.sciencedirect.com/science/article/pii/S2372770516300390 [Accessed
May 19, 2017].
Ward, A. & Crow, D., 2015. Race to control costs of cancer therapy revolution. The
financial times. Available at: https://www.ft.com/content/ad76a316-9cee-11e5-
b45d-4812f209f861 [Accessed February 24, 2017].
de Waure, C. et al., 2015. Extracorporeal Photopheresis for Second-Line Treatment of
Chronic Graft-versus-Host Diseases: Results from a Health Technology Assessment
in Italy. Value in Health, 18(4), pp.457–466. Available at:
http://www.ncbi.nlm.nih.gov/pubmed/26091600 [Accessed June 14, 2017].
Webster, R., 2016. CAR T-Cell Therapy The Road Ahead. Bioprocess online. Available
at: https://www.bioprocessonline.com/doc/car-t-cell-therapy-the-road-ahead-0001
[Accessed May 15, 2017].
Wegener, C., 2014. Cell washing with the LOVO cell processing system. Bioprocess

306
international, p.78. Available at: http://www.bioprocessintl.com/wp-
content/uploads/2014/08/Cell_Washing_LOVO_Fresenius.pdf [Accessed
December 24, 2016].
Wegener, C., Heber, C. & Min, K., 2013. Novel cell washing device using spinning
membrane filtration. Cytotherapy, 15(4), p.S27. Available at:
http://linkinghub.elsevier.com/retrieve/pii/S1465324913002375 [Accessed
December 24, 2016].
Wei, X. et al., 2013a. Mesenchymal stem cells: a new trend for cell therapy. Acta
pharmacologica Sinica, 34(6), pp.747–54. Available at:
http://www.ncbi.nlm.nih.gov/pubmed/23736003.
Wei, X. et al., 2013b. Mesenchymal stem cells: a new trend for cell therapy. Acta
Pharmacologica Sinica, 34(6), pp.747–754. Available at:
http://www.nature.com/doifinder/10.1038/aps.2013.50 [Accessed May 11, 2017].
Wen, E., Ellis, R. & Pujar, N., 2015. Vaccine development and manufacturing,
Wendt, D. et al., 2009. Potential and bottlenecks of bioreactors in 3D cell culture and
tissue manufacturing. Advanced Materials, 21(32–33), pp.3352–3367.
Whitford, W., 2010. Single-Use Systems As Principal Components in Bioproduction.
Bioprocess International, pp.34–42.
Whitford, W. & Cadwell, J., 2009. Interest in hollow-fiber perfusion bioreactors is
growing. BioProcess International, 7(9), pp.54–64.
Whittle, N., 2017. Cell and gene therapy: scaling up and moving to mass production. Cell
& Gene Therapy insights, pp.1–5. Available at: http://insights.bio/cell-and-gene-
therapy-insights/wp-content/uploads/sites/2/2017/03/Whittle-1.pdf [Accessed May
4, 2017].
Willasch, A. et al., 2010. Enrichment of cell subpopulations applying automated MACS
technique: purity, recovery and applicability for PCR-based chimerism analysis.
Bone Marrow Transplantation, 45(1), pp.181–189. Available at:
http://www.nature.com/doifinder/10.1038/bmt.2009.89 [Accessed May 19, 2017].
Williams, A. & Hare, J., 2011. Mesenchymal Stem Cells. Circulation Research, 109(8).
Available at: http://circres.ahajournals.org/content/109/8/923 [Accessed May 9,
2017].
Williams, C., 2015. Stock Update (NASDAQ:ATHX): Athersys, Inc.’s MultiStem
Promotes Recovery After Acute Spinal Cord Injury in Preclinical Study - Smarter
Analyst. SmarterAnalyst. Available at:
https://www.smarteranalyst.com/2015/11/19/stock-update-nasdaqathx-athersys-
inc-s-multistem-promotes-recovery-after-acute-spinal-cord-injury-in-preclinical-
study/ [Accessed May 7, 2017].
Wilson Wolf, Wilson Wolf Manufacturing. Available at: http://www.wilsonwolf.com/
[Accessed December 24, 2016].
de Windt, T. et al., 2013. Is Magnetic Resonance Imaging Reliable in Predicting Clinical
Outcome After Articular Cartilage Repair of the Knee?: A Systematic Review and
Meta-analysis. The American Journal of Sports Medicine, 41(7), pp.1695–1702.
Available at: http://ajs.sagepub.com/lookup/doi/10.1177/0363546512473258
[Accessed May 4, 2017].
Wong, R., 2011. Mesenchymal stem cells: angels or demons? Journal of biomedicine &
biotechnology, 2011, p.459510. Available at:
http://www.ncbi.nlm.nih.gov/pubmed/21822372 [Accessed May 17, 2017].

307
Yang, H.S. et al., 2010. Suspension Culture of Mammalian Cells Using Thermosensitive
Microcarrier That Allows Cell Detachment Without Proteolytic Enzyme Treatment.
Cell Transplantation, 19(9), pp.1123–1132. Available at:
http://www.ncbi.nlm.nih.gov/pubmed/20719079 [Accessed May 24, 2017].
Yang, Y., Farid, S. & Thornhill, N., 2014. Data mining for rapid prediction of facility fit
and debottlenecking of biomanufacturing facilities. Journal of Biotechnology, 179,
pp.17–25. Available at: http://www.ncbi.nlm.nih.gov/pubmed/24637375 [Accessed
May 28, 2017].
Zhang, J. et al., 2015. The challenges and promises of allogeneic mesenchymal stem cells
for use as a cell-based therapy. Stem Cell Research & Therapy, 6(1), p.234.
Available at: http://stemcellres.com/content/6/1/234 [Accessed May 13, 2017].
Zhao, Y. et al., 2006. High-efficiency transfection of primary human and mouse T
lymphocytes using RNA electroporation. Molecular Therapy, 13(1), pp.151–159.
Zhion, 2011. LAVIV. Lavivi. Available at:
http://www.zhion.com/Skin_Care/LAVIV.html [Accessed May 6, 2017].
Zhong, S. et al., 2010. Retroviral transduction of T-cell receptors in mouse T-cells.
Journal of visualized experiments : JoVE, (44), pp.9–12.
Zhou, X. et al., 2003. Lentivirus-mediated gene transfer and expression in established
human tumor antigen-specific cytotoxic T cells and primary unstimulated T cells.
Human gene therapy, 14(11), pp.1089–1105.
Zimmer, 2009. Zimmer® DeNovo® NT Natural Tissue Graft Surgical Technique 97-
5608-002-00. Available at: http://www.zimmer.com/content/dam/zimmer-
web/documents/en-US/pdf/surgical-techniques/knee/zimmer-denovo-nt-natural-
tissue-graft-surgical-technique.pdf [Accessed May 5, 2017].

308
Appendix
Table A.01 Cost factor breakdown for an annual demand of 500 doses

309
Table A.02 Cost factor breakdown for an annual demand of 10,000 doses

310
Papers by the Author
Pereira Chilima T., Moncaubeig F., Farid S.S (2018): Impact of allogeneic stem cell
manufacturing decisions on cost of goods, process robustness and reimbursement.
Biochemical Engineering Journal
Mizukami A., Pereira Chilima T., Orellana M., Neto M., Covas D., Farid S., Swiech K.,
(2018): Technologies for large-scale umbilical cord-derived MSC expansion:
Experimental performance and cost of goods analysis. Biochemical Engineering
Journal
Pereira Chilima T., Bovy T., Farid S.S. (2016): Designing the Optimal Manufacturing
Strategy for an Adherent Allogeneic Cell Therapy. Bioprocess Int.