Decadal Water Mass Variations in the Northeast Atlantic Ocean G C Johnson, J Bullister, M Baringer,...
11
Decadal Water Mass Variations in the Northeast Atlantic Ocean G C Johnson, J Bullister, M Baringer, C Mordy, C Sabine, J-Z Zhang, R Wanninkhof, & R Feely (NOAA/PMEL, NOAA/AOML, & JISAO) 4 sections at 20W between 1988 & 2003 reveal: SubPolar Mode Water (SPMW) trends warmer, lighter, & shallower. Marked AOU & PV increases below SPMW. Mediterranean Outflow Water (MOW) spreads northward. Labrador Sea Water (LSW) trends colder, fresher, denser, & deeper. Changes consistent with North Atlantic Oscillation (NAO) shifts.
-
Upload
jeffrey-manning -
Category
Documents
-
view
215 -
download
0
Transcript of Decadal Water Mass Variations in the Northeast Atlantic Ocean G C Johnson, J Bullister, M Baringer,...

Decadal Water Mass Variations in the Northeast Atlantic OceanDecadal Water Mass Variations in the Northeast Atlantic Ocean
G C Johnson, J Bullister, M Baringer, C Mordy, C Sabine, J-Z Zhang, R Wanninkhof, &R Feely (NOAA/PMEL, NOAA/AOML, & JISAO)4 sections at 20W between 1988 & 2003 reveal:
SubPolar Mode Water (SPMW) trends warmer, lighter, & shallower.Marked AOU & PV increases below SPMW.Mediterranean Outflow Water (MOW) spreads northward.Labrador Sea Water (LSW) trends colder, fresher, denser, & deeper.Changes consistent with North Atlantic Oscillation (NAO) shifts.Repeat section analysis requires a spatial and temporal context.

20W Sections:
4 occupationsover 15 years
20W Sections:
4 occupationsover 15 years
2003 CO2/CLIVARRepeat HydrographyNOAA/NSF FundedBullister & Gruber
1998 CHAOS Smythe-Wright
1993 NOAA OACES Wanninkhof & Doney
1988 WOCE A16N McCartney, Talley, & Tsuchiya
2003 CO2/CLIVARRepeat HydrographyNOAA/NSF FundedBullister & Gruber
1998 CHAOS Smythe-Wright
1993 NOAA OACES Wanninkhof & Doney
1988 WOCE A16N McCartney, Talley, & Tsuchiya
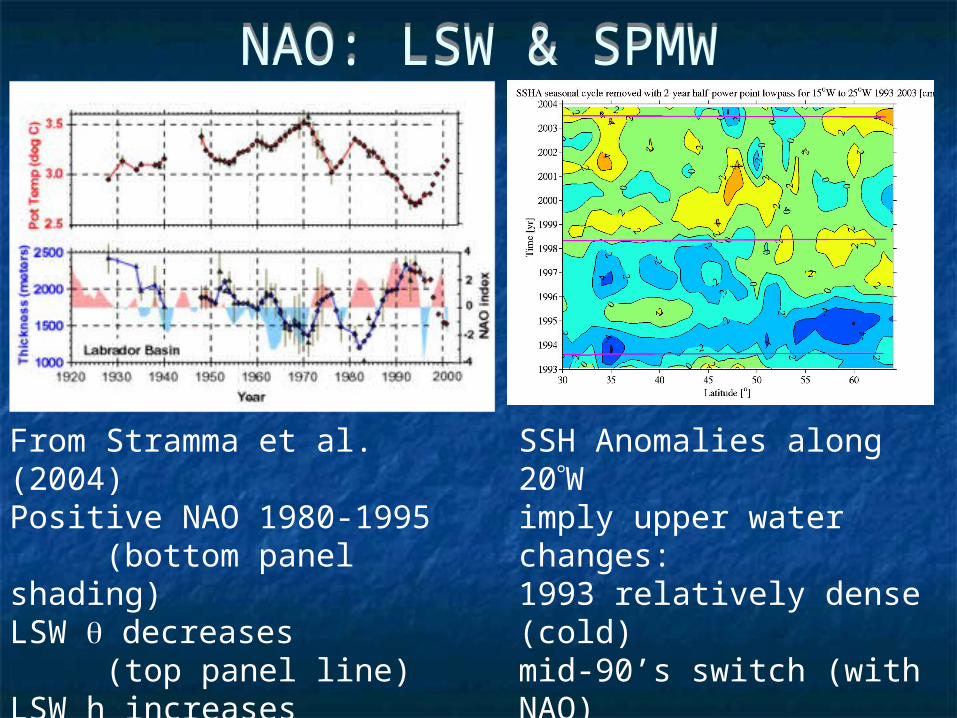
NAO: LSW & SPMWNAO: LSW & SPMW
From Stramma et al. (2004)Positive NAO 1980-1995
(bottom panel shading)LSW decreases
(top panel line)LSW h increases
(bottom panel line)
SSH Anomalies along 20W imply upper water changes:1993 relatively dense (cold)mid-90’s switch (with NAO)1998 light (warm)2003 lighter (and warmer)(1988 not measured)

Mean 20W (C) & S (PSS-78)Mean 20W (C) & S (PSS-78)SPMW
LSW
MOW

AOU (mol kg-1) & PV (10-12 m-1 s-1)
AOU (mol kg-1) & PV (10-12 m-1 s-1)

2003-1988 (C) & S (PSS-78)2003-1988 (C) & S (PSS-78)
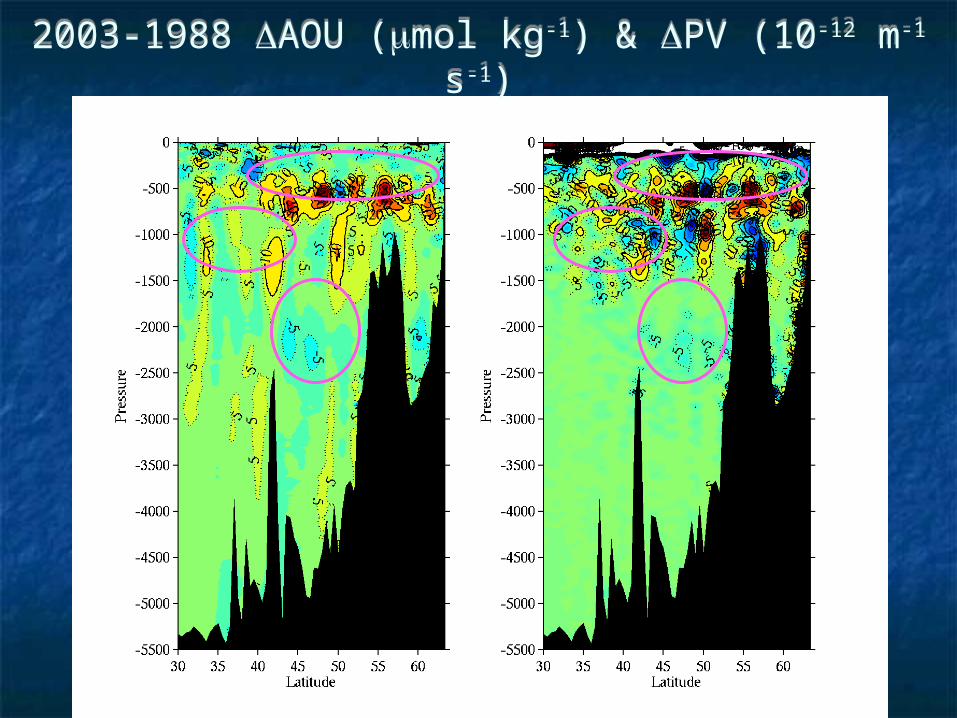
2003-1988 AOU (mol kg-1) & PV (10-12 m-1 s-1)2003-1988 AOU (mol kg-1) & PV (10-12 m-1 s-1)

LSW (43-53N) VariationsLSW (43-53N) Variations

Property Changes vs. Mean (40N to Iceland)
Property Changes vs. Mean (40N to Iceland)
SPWM
SPWM
MOW
MOW
LSW
LSW
NCEP/NCARAnomalies15-25W, 40-63N
SummarySummary4 sections at 20W between 1988 and 2003 reveal:
LSW trends colder, fresher, denser, & deeper.MOW spreads northward 2003 (warmer, saltier, O2-poorer)Oxygen values decrease (AOU increases) just below SPMW
(consistent with lighter and shallower ventilation).
SPMW generally shifts warmer, lighter, shallower (between 1993 & 1998)
These changes are likely related toThe NAO shift to positive in early 1980’s& the NAO shift to negative in mid-90’s
The literature argues thatSPMW & MOW changes are mostly from circulation variations.LSW changes are from ventilation variations.
There are large and related carbon variations . . .
4 sections at 20W between 1988 and 2003 reveal:
LSW trends colder, fresher, denser, & deeper.MOW spreads northward 2003 (warmer, saltier, O2-poorer)Oxygen values decrease (AOU increases) just below SPMW
(consistent with lighter and shallower ventilation).
SPMW generally shifts warmer, lighter, shallower (between 1993 & 1998)
These changes are likely related toThe NAO shift to positive in early 1980’s& the NAO shift to negative in mid-90’s
The literature argues thatSPMW & MOW changes are mostly from circulation variations.LSW changes are from ventilation variations.
There are large and related carbon variations . . .

DiscussionDiscussionThere are large and related carbon variations . . .
Quantifying ocean CO2 storage is a central goal
Ocean processes (circulation, ventilation) vary interannuallyRepeat sections are occupied at decadal intervals at basin scale
Conflict arises between affordability and aliasing.
How to put repeat sections into spatial & temporal context?
PV-AOU variability relation: is it global, useful?What about oxygen sensors on Argo floats?
Costs: sensors, telecom, energy (float equivalents), & data management.
Numerical modeling, data assimilationAre biogeochemical results available/reliable?Should we worry about large perturbations?
There are large and related carbon variations . . .Quantifying ocean CO2 storage is a central goal
Ocean processes (circulation, ventilation) vary interannuallyRepeat sections are occupied at decadal intervals at basin scale
Conflict arises between affordability and aliasing.
How to put repeat sections into spatial & temporal context?
PV-AOU variability relation: is it global, useful?What about oxygen sensors on Argo floats?
Costs: sensors, telecom, energy (float equivalents), & data management.
Numerical modeling, data assimilationAre biogeochemical results available/reliable?Should we worry about large perturbations?
Riser (UW)