Profiling Debugging Freebsd Kernel 321772
32
Document Number: 321772-001 Profiling and Debugging the FreeBSD* Kernel May 2009 White Paper Ray Kinsella Network Software Engineer Intel Corporation
-
Upload
ajjaberd-liebec -
Category
Documents
-
view
231 -
download
1
Transcript of Profiling Debugging Freebsd Kernel 321772
7/29/2019 Profiling Debugging Freebsd Kernel 321772
http://slidepdf.com/reader/full/profiling-debugging-freebsd-kernel-321772 1/32
Document Number: 321772-001
Profiling and
Debugging the
FreeBSD* Kernel
May 2009
White Paper
Ray Kinsella
Network Software Engineer
Intel Corporation
7/29/2019 Profiling Debugging Freebsd Kernel 321772
http://slidepdf.com/reader/full/profiling-debugging-freebsd-kernel-321772 2/32
I n t r o d u c t i o n
Profiling and Debugging the FreeBSD* Kernel
White Paper May 2009
2 Document Number: 321772-001
A b s t r a c t
This paper provides an overview of the Profiling and Debugging tools
available for FreeBSD* 7.0 and later. These tools enable the developer to
demystify the Kernel’s internal workings, identify performance bottlenecks
and determine appropriate parameter tuning. The paper should help
reduce the guesswork involved in tuning the performance of FreeBSD,
promoting actions informed by measurement.
7/29/2019 Profiling Debugging Freebsd Kernel 321772
http://slidepdf.com/reader/full/profiling-debugging-freebsd-kernel-321772 3/32
I n t r o d u c t i o n
Profiling and Debugging the FreeBSD* Kernel
May 2009 White Paper
Document Number: 321772-001 3
C o n t e n t s
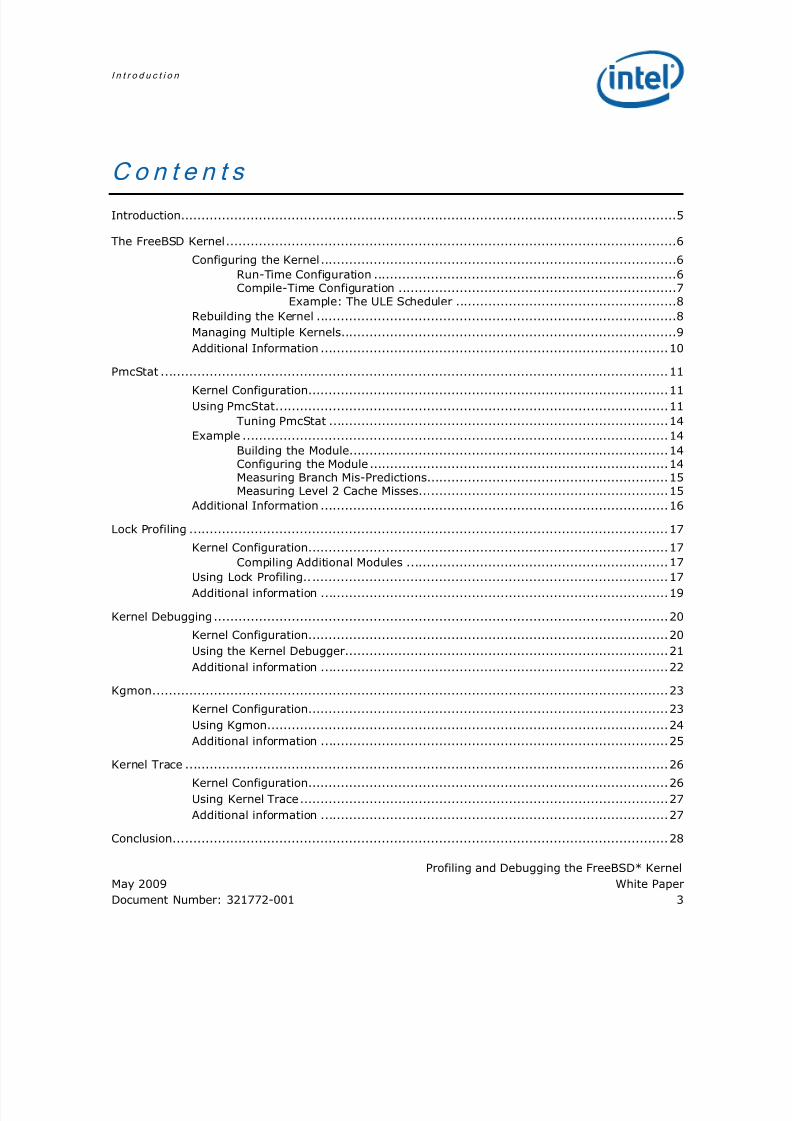
Introduction......................................................................................................................... 5 The FreeBSD Kernel.............................................................................................................. 6
Configuring the Kernel....................................................................................... 6 Run-Time Configuration .......................................................................... 6 Compile-Time Configuration .................................................................... 7
Example: The ULE Scheduler ...................................................... 8 Rebuilding the Kernel ........................................................................................ 8 Managing Multiple Kernels.................................................................................. 9 Additional Information ..................................................................................... 10
PmcStat ............................................................................................................................ 11 Kernel Configuration........................................................................................ 11 Using PmcStat................................................................................................ 11
Tuning PmcStat ................................................................................... 14 Example ........................................................................................................ 14
Building the Module.............................................................................. 14 Configuring the Module ......................................................................... 14 Measuring Branch Mis-Predictions........................................................... 15 Measuring Level 2 Cache Misses............................................................. 15
Additional Information ..................................................................................... 16 Lock Profiling ..................................................................................................................... 17
Kernel Configuration........................................................................................ 17 Compiling Additional Modules ................................................................ 17
Using Lock Profiling......................................................................................... 17 Additional information ..................................................................................... 19
Kernel Debugging............................................................................................................... 20 Kernel Configuration........................................................................................ 20 Using the Kernel Debugger............................................................................... 21 Additional information ..................................................................................... 22
Kgmon.............................................................................................................................. 23 Kernel Configuration........................................................................................ 23 Using Kgmon.................................................................................................. 24 Additional information ..................................................................................... 25
Kernel Trace ...................................................................................................................... 26 Kernel Configuration........................................................................................ 26 Using Kernel Trace.......................................................................................... 27 Additional information ..................................................................................... 27
Conclusion......................................................................................................................... 28
7/29/2019 Profiling Debugging Freebsd Kernel 321772
http://slidepdf.com/reader/full/profiling-debugging-freebsd-kernel-321772 4/32
I n t r o d u c t i o n
Profiling and Debugging the FreeBSD* Kernel
White Paper May 2009
4 Document Number: 321772-001
Reference List .................................................................................................................... 28 Appendix A........................................................................................................................ 29
7/29/2019 Profiling Debugging Freebsd Kernel 321772
http://slidepdf.com/reader/full/profiling-debugging-freebsd-kernel-321772 5/32
I n t r o d u c t i o n
Profiling and Debugging the FreeBSD* Kernel
May 2009 White Paper
Document Number: 321772-001 5
I n t r o d u c t i o n
FreeBSD provides a rich toolset to aid a developer writing Kernel code. This paperdiscusses the tools and techniques that can aid the performance profiling of Kernelcode on FreeBSD 7.0. Kernel debugging and the management of multiple Kernelversions are also discussed.
FreeBSD 7.0 represents a significant improvement for those developing device drivers,and includes a new version of PmcStat, a tool similar in function to the Intel® VTune™Performance Analyzer or OProfile*. PmcStat allows developers to profile FreeBSDKernel and user space applications by sampling a processor’s performance counters.The new version of PmcStat uses these counters to enable the performance profilingof the loadable Kernel modules. For hardware vendors releasing device drivers asloadable Kernel modules, their developers can now profile their code without theburden of instrumentation or building their code into the Kernel.
PmcStat is therefore the key enabling tool discussed in this paper. Other toolsdiscussed include:
• The Lock/Mutex Profiler: This tool enables the developer to identify lockcontention, reporting the average wait times at Kernel locks.
• The Kernel debugger: This tool enables the developer to insert breakpoints intoKernel code, inspect memory address, print stack traces, and so on.
• Kgmon: This tool instruments the Kernel with performance profiling code; this isan alternate method of identifying bottlenecks on processors that don’t provideperformance counters.
• Kernel Tracing: This tool enables the developer to trace Kernel activity. Thedeveloper can exclude parts of the Kernel from the trace and insert trace-points
into their own code. It is a powerful learning aid.
The key to enabling these tools is configuring and building the FreeBSD Kernel. Pleasesee the following section.
7/29/2019 Profiling Debugging Freebsd Kernel 321772
http://slidepdf.com/reader/full/profiling-debugging-freebsd-kernel-321772 6/32
T h e F r e e BSD K e r n e l
Profiling and Debugging the FreeBSD* Kernel
White Paper May 2009
6 Document Number: 321772-001
T h e Fr e e BSD K e r n e l
The default Kernel that FreeBSD installs is optimized for most workloads and supportsthe most commonly used hardware. This is referred to as the GENERIC Kernel. Toquery the Kernel a system is currently using, invoke the “uname –a” command.
bash-2.05b# uname -aFreeBSD abc.intel.com 7.0-RELEASE FreeBSD 7.0-RELEASE #2: Wed Nov 19 10:52:32 GMT [email protected]:/usr/obj/usr/src/sys/ GENERIC i386
In the above example, the GENERIC Kernel is being used.
The built version of the FreeBSD Kernel is kept in the /boot/kernel directory, alongwith any loadable modules that have been built. Typically the Kernel uses two otherloadable Kernel modules: the ACPI module to provide power management support,and the Linux module to provide binary compatibility support with Linux. Thecommand kldstat will list the modules currently in use.
bash-2.05b# kldstatId Refs Address Size Name1 7 0xc0400000 6f6e30 kernel2 1 0xc0af7000 59f20 acpi.ko3 1 0xc4813000 16000 linux.ko
The Kernel’s source code is available in /usr/src , provided it was selected to beinstalled during the installation process. If the Kernel source code is missing, it can beadded later by re-running the sysinstall tool.
Configuring the Kernel
The FreeBSD Kernel is configurable dynamically at run-time and statically at compile-
time by editing the Kernel profile. The same set of parameters may not beconfigurable in each case.
Run-Time Configuration
Kernel parameters can be changed at run-time using the sysctl command.
bash-2.05b# sysctl -a | headkern.ostype: FreeBSDkern.osrelease: 7.0-RELEASEkern.osrevision: 199506kern.version: FreeBSD 7.0-RELEASE #0: Sat Feb 7 16:04:51 UTC 2009
root@:/usr/obj/usr/src/sys/DEBUG
kern.maxvnodes: 17229kern.maxproc: 1956kern.maxfiles: 3912kern.argmax: 262144
The “sysctl -a” command will return a list of available configuration parameters. Theseparameters divide roughly into three categories:
7/29/2019 Profiling Debugging Freebsd Kernel 321772
http://slidepdf.com/reader/full/profiling-debugging-freebsd-kernel-321772 7/32
T h e F r e eBSD Ke r n e l
Profiling and Debugging the FreeBSD* Kernel
May 2009 White Paper
Document Number: 321772-001 7
Category Description
Read-only parameters Parameters that are either intended to report internal Kernel metrics
or parameters that have been configured at compile-time.
An example in this category is the dev.cpu.0.freq_levels parameter.
This parameter reports the ACPI throttling levels available.
or
Another example is the kern.sched.name parameter. This parameter
reports the Kernel scheduler currently in use; this is changeable at
compile time.
Read-write parameters Parameters that can be changed at run-time.
An example in this category is the dev.cpu.0.freq parameter. This
parameter controls the ACPI throttling option currently selected.
Write-at-boot
parameters
Parameters that can only be changed at boot-time. These are
configured in the /boot /loader.conf file (see the man page forloader.conf) or with the kenv command.
An example of parameters in this category is the
kern.hwpmc.nbuffers parameter, which controls the number of
internal buffers available to the PmcStat tool.
Compile-Time Configuration
The most substantial Kernel configuration changes are made at compile-time.Examples of these kinds of changes include: selecting a different process scheduler(i.e., the ULE scheduler), enabling performance sampling support (PmcStat), andenabling Kernel lock profiling support.
To build a new Kernel including a new compile-time enabled feature, a new Kernel profile must be created. The Kernel profile is the compile-time configuration file. Theprofile is kept in the conf directory:
/usr/src/sys/<arch>/conf
Where arch is the architecture of the system, i.e., i386 for Intel architectureprocessors.
bash‐2.05b# ls ‐l /usr/src/sys/i386/conf
total 62
‐rw‐r‐‐r‐‐ 1 root wheel 13 Oct 29 14:26 .cvsignore
‐rw‐r‐‐r‐‐ 1 root wheel 372 Oct 29 14:26 DEFAULTS
‐rw‐r‐‐r‐‐ 1 root wheel 10629 Oct 29 14:26 GENERIC
‐rw‐r‐‐r‐‐ 1 root wheel 1741 Oct 29 14:26 GENERIC.hints
‐
rw‐
r‐‐
r‐‐
1
root
wheel
120
Oct
29
14:26
Makefile
‐rw‐r‐‐r‐‐ 1 root wheel 34813 Oct 29 14:26 NOTES
‐rw‐r‐‐r‐‐ 1 root wheel 2047 Oct 29 14:26 PAE
‐rw‐r‐‐r‐‐ 1 root wheel 322 Oct 29 14:26 SMP
‐rw‐r‐‐r‐‐ 1 root wheel 3389 Oct 29 14:26 XBOX
7/29/2019 Profiling Debugging Freebsd Kernel 321772
http://slidepdf.com/reader/full/profiling-debugging-freebsd-kernel-321772 8/32
T h e F r e eBSD Ke r n e l
Profiling and Debugging the FreeBSD* Kernel
White Paper May 2009
8 Document Number: 321772-001
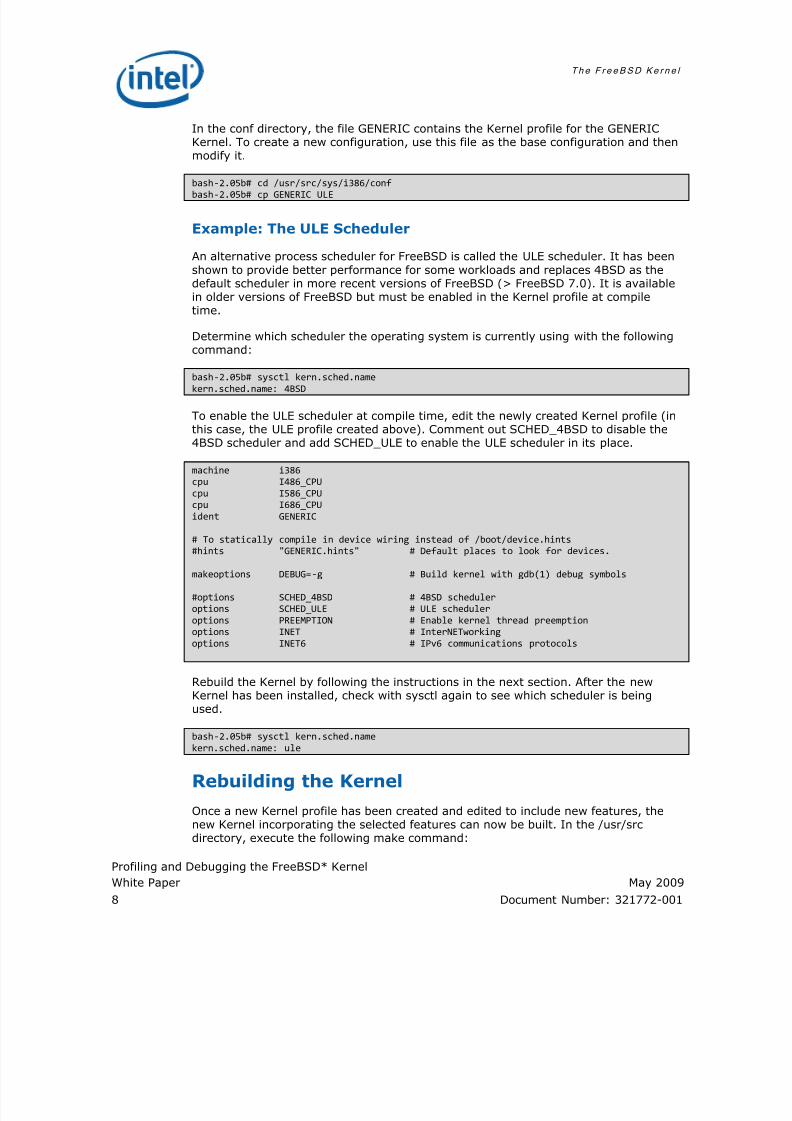
In the conf directory, the file GENERIC contains the Kernel profile for the GENERICKernel. To create a new configuration, use this file as the base configuration and thenmodify it.
bash‐2.05b# cd /usr/src/sys/i386/conf
bash‐2.05b#
cp
GENERIC
ULE
Example: The ULE Scheduler
An alternative process scheduler for FreeBSD is called the ULE scheduler. It has beenshown to provide better performance for some workloads and replaces 4BSD as thedefault scheduler in more recent versions of FreeBSD (> FreeBSD 7.0). It is availablein older versions of FreeBSD but must be enabled in the Kernel profile at compiletime.
Determine which scheduler the operating system is currently using with the followingcommand:
bash‐2.05b#
sysctl
kern.sched.name
kern.sched.name: 4BSD
To enable the ULE scheduler at compile time, edit the newly created Kernel profile (inthis case, the ULE profile created above). Comment out SCHED_4BSD to disable the4BSD scheduler and add SCHED_ULE to enable the ULE scheduler in its place.
machine i386
cpu I486_CPU
cpu I586_CPU
cpu I686_CPU
ident GENERIC
# To statically compile in device wiring instead of /boot/device.hints
#hints "GENERIC.hints" # Default places to look for devices.
makeoptions DEBUG=‐g # Build kernel with gdb(1) debug symbols
#options SCHED_4BSD # 4BSD scheduler
options SCHED_ULE # ULE scheduler
options PREEMPTION # Enable kernel thread preemption
options INET # InterNETworking
options INET6 # IPv6 communications protocols
Rebuild the Kernel by following the instructions in the next section. After the newKernel has been installed, check with sysctl again to see which scheduler is beingused.
bash‐2.05b# sysctl kern.sched.name
kern.sched.name: ule
Rebuilding the Kernel
Once a new Kernel profile has been created and edited to include new features, thenew Kernel incorporating the selected features can now be built. In the /usr/srcdirectory, execute the following make command:
7/29/2019 Profiling Debugging Freebsd Kernel 321772
http://slidepdf.com/reader/full/profiling-debugging-freebsd-kernel-321772 9/32
T h e F r e eBSD Ke r n e l
Profiling and Debugging the FreeBSD* Kernel
May 2009 White Paper
Document Number: 321772-001 9
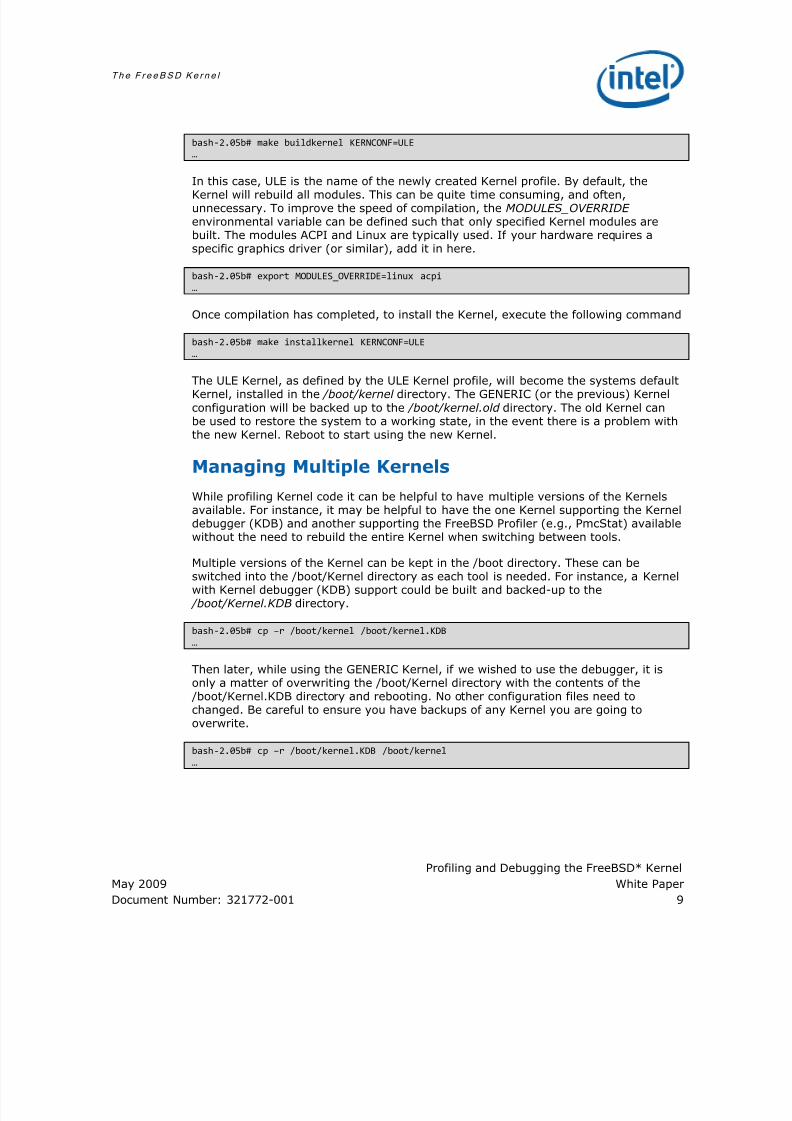
bash‐2.05b# make buildkernel KERNCONF=ULE
…
In this case, ULE is the name of the newly created Kernel profile. By default, theKernel will rebuild all modules. This can be quite time consuming, and often,unnecessary. To improve the speed of compilation, the MODULES_OVERRIDE environmental variable can be defined such that only specified Kernel modules arebuilt. The modules ACPI and Linux are typically used. If your hardware requires aspecific graphics driver (or similar), add it in here.
bash‐2.05b# export MODULES_OVERRIDE=linux acpi
…
Once compilation has completed, to install the Kernel, execute the following command
bash‐2.05b# make installkernel KERNCONF=ULE
…
The ULE Kernel, as defined by the ULE Kernel profile, will become the systems defaultKernel, installed in the /boot/kernel directory. The GENERIC (or the previous) Kernelconfiguration will be backed up to the /boot/kernel.old directory. The old Kernel canbe used to restore the system to a working state, in the event there is a problem withthe new Kernel. Reboot to start using the new Kernel.
Managing Multiple Kernels
While profiling Kernel code it can be helpful to have multiple versions of the Kernelsavailable. For instance, it may be helpful to have the one Kernel supporting the Kerneldebugger (KDB) and another supporting the FreeBSD Profiler (e.g., PmcStat) availablewithout the need to rebuild the entire Kernel when switching between tools.
Multiple versions of the Kernel can be kept in the /boot directory. These can beswitched into the /boot/Kernel directory as each tool is needed. For instance, a Kernelwith Kernel debugger (KDB) support could be built and backed-up to the /boot/Kernel.KDB directory.
bash‐2.05b# cp –r /boot/kernel /boot/kernel.KDB
…
Then later, while using the GENERIC Kernel, if we wished to use the debugger, it isonly a matter of overwriting the /boot/Kernel directory with the contents of the /boot/Kernel.KDB directory and rebooting. No other configuration files need tochanged. Be careful to ensure you have backups of any Kernel you are going tooverwrite.
bash‐2.05b# cp –r /boot/kernel.KDB /boot/kernel
…
7/29/2019 Profiling Debugging Freebsd Kernel 321772
http://slidepdf.com/reader/full/profiling-debugging-freebsd-kernel-321772 10/32
T h e F r e eBSD Ke r n e l
Profiling and Debugging the FreeBSD* Kernel
White Paper May 2009
10 Document Number: 321772-001
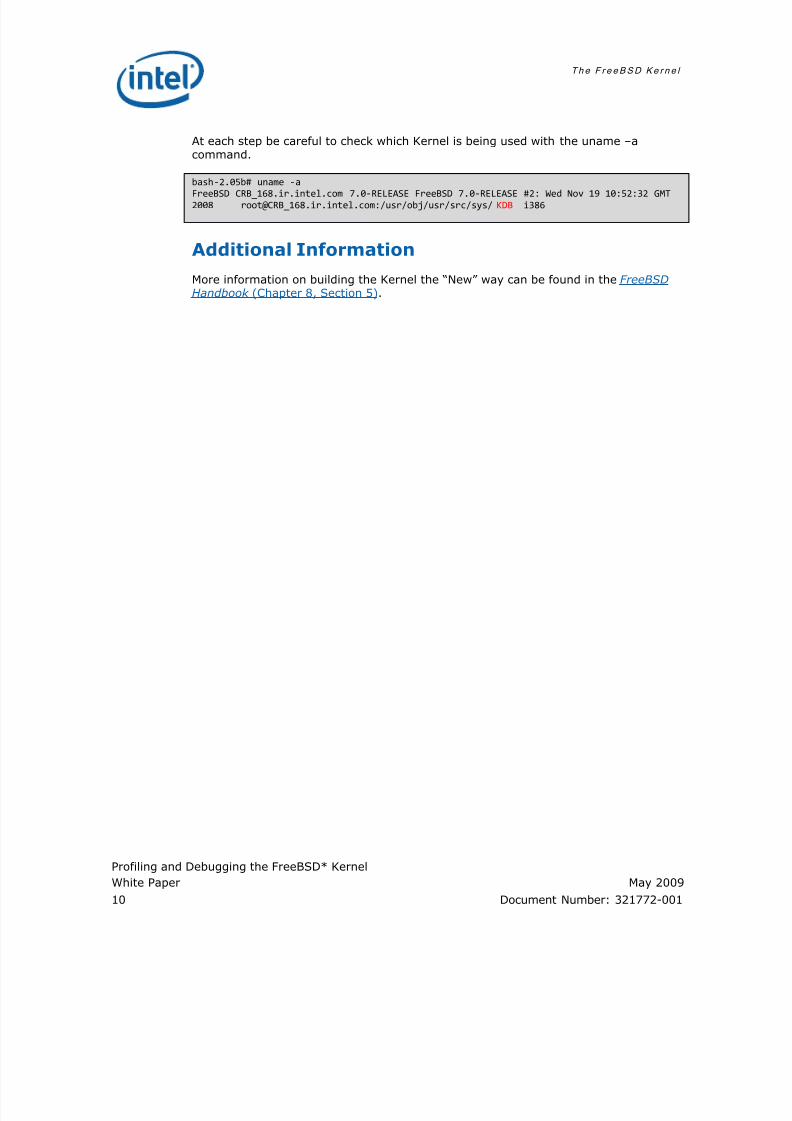
At each step be careful to check which Kernel is being used with the uname –acommand.
bash‐2.05b# uname ‐a
FreeBSD CRB_168.ir.intel.com
7.0
‐RELEASE
FreeBSD
7.0
‐RELEASE
#2:
Wed
Nov
19
10:52:32
GMT
2008 root@CRB_168.ir.intel.com:/usr/obj/usr/src/sys/ KDB i386
Additional Information
More information on building the Kernel the “New” way can be found in the FreeBSDHandbook (Chapter 8, Section 5).
7/29/2019 Profiling Debugging Freebsd Kernel 321772
http://slidepdf.com/reader/full/profiling-debugging-freebsd-kernel-321772 11/32
Pmc S t a t
Profiling and Debugging the FreeBSD* Kernel
May 2009 White Paper
Document Number: 321772-001 11
Pm cSt a t
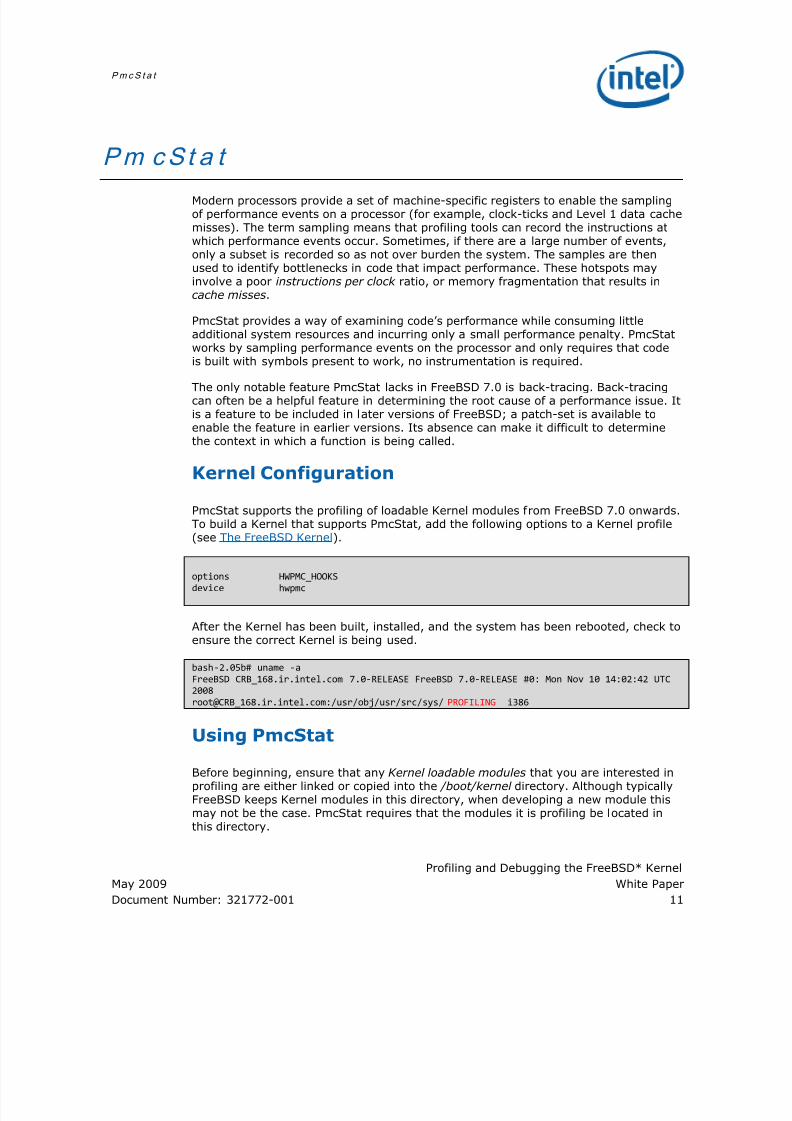
Modern processors provide a set of machine-specific registers to enable the samplingof performance events on a processor (for example, clock-ticks and Level 1 data cachemisses). The term sampling means that profiling tools can record the instructions atwhich performance events occur. Sometimes, if there are a large number of events,only a subset is recorded so as not over burden the system. The samples are thenused to identify bottlenecks in code that impact performance. These hotspots mayinvolve a poor instructions per clock ratio, or memory fragmentation that results incache misses.
PmcStat provides a way of examining code’s performance while consuming littleadditional system resources and incurring only a small performance penalty. PmcStatworks by sampling performance events on the processor and only requires that codeis built with symbols present to work, no instrumentation is required.
The only notable feature PmcStat lacks in FreeBSD 7.0 is back-tracing. Back-tracingcan often be a helpful feature in determining the root cause of a performance issue. Itis a feature to be included in later versions of FreeBSD; a patch-set is available toenable the feature in earlier versions. Its absence can make it difficult to determinethe context in which a function is being called.
Kernel Configuration
PmcStat supports the profiling of loadable Kernel modules from FreeBSD 7.0 onwards.To build a Kernel that supports PmcStat, add the following options to a Kernel profile(see The FreeBSD Kernel).
options HWPMC_HOOKS
device hwpmc
After the Kernel has been built, installed, and the system has been rebooted, check toensure the correct Kernel is being used.
bash‐2.05b# uname ‐a
FreeBSD CRB_168.ir.intel.com 7.0‐RELEASE FreeBSD 7.0‐RELEASE #0: Mon Nov 10 14:02:42 UTC
2008
root@CRB_168.ir.intel.com:/usr/obj/usr/src/sys/ PROFILING i386
Using PmcStat
Before beginning, ensure that any Kernel loadable modules that you are interested inprofiling are either linked or copied into the /boot/kernel directory. Although typicallyFreeBSD keeps Kernel modules in this directory, when developing a new module thismay not be the case. PmcStat requires that the modules it is profiling be located inthis directory.
7/29/2019 Profiling Debugging Freebsd Kernel 321772
http://slidepdf.com/reader/full/profiling-debugging-freebsd-kernel-321772 12/32
Pmc S t a t
Profiling and Debugging the FreeBSD* Kernel
White Paper May 2009
12 Document Number: 321772-001
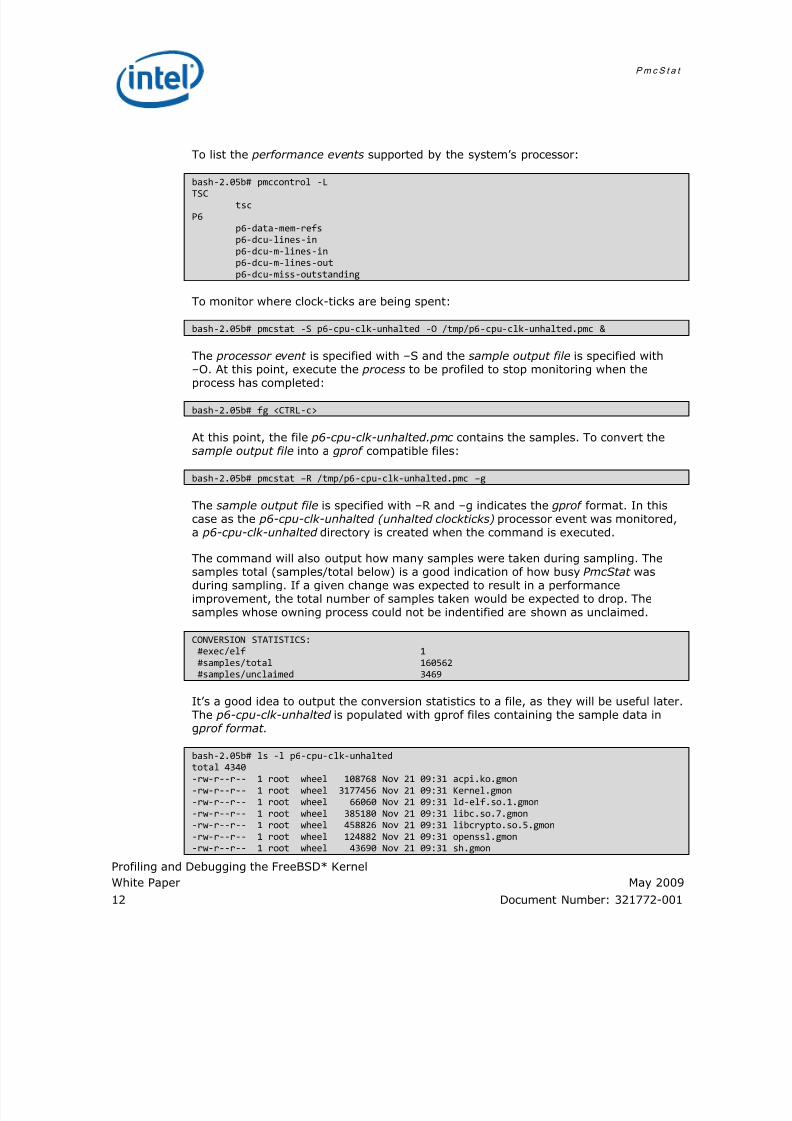
To list the performance events supported by the system’s processor:
bash‐2.05b# pmccontrol ‐L
TSC
tsc
P6
p6‐data‐mem‐refs
p6‐dcu‐lines‐in
p6‐dcu‐m‐lines‐in
p6‐dcu‐m‐lines‐out
p6‐dcu‐miss‐outstanding
To monitor where clock-ticks are being spent:
bash‐2.05b# pmcstat ‐S p6‐cpu‐clk‐unhalted ‐O /tmp/p6‐cpu‐clk‐unhalted.pmc &
The processor event is specified with –S and the sample output file is specified with–O. At this point, execute the process to be profiled to stop monitoring when the
process has completed:
bash‐2.05b# fg <CTRL‐c>
At this point, the file p6-cpu-clk-unhalted.pmc contains the samples. To convert thesample output file into a gprof compatible files:
bash‐2.05b# pmcstat –R /tmp/p6‐cpu‐clk‐unhalted.pmc –g
The sample output file is specified with –R and –g indicates the gprof format. In thiscase as the p6-cpu-clk-unhalted (unhalted clockticks) processor event was monitored,a p6-cpu-clk-unhalted directory is created when the command is executed.
The command will also output how many samples were taken during sampling. The
samples total (samples/total below) is a good indication of how busy PmcStat wasduring sampling. If a given change was expected to result in a performanceimprovement, the total number of samples taken would be expected to drop. Thesamples whose owning process could not be indentified are shown as unclaimed.
CONVERSION STATISTICS:
#exec/elf 1
#samples/total 160562
#samples/unclaimed 3469
It’s a good idea to output the conversion statistics to a file, as they will be useful later.The p6-cpu-clk-unhalted is populated with gprof files containing the sample data ing prof format.
bash‐2.05b#
ls
‐l
p6
‐cpu
‐clk
‐unhalted
total 4340
‐rw‐r‐‐r‐‐ 1 root wheel 108768 Nov 21 09:31 acpi.ko.gmon
‐rw‐r‐‐r‐‐ 1 root wheel 3177456 Nov 21 09:31 Kernel.gmon
‐rw‐r‐‐r‐‐ 1 root wheel 66060 Nov 21 09:31 ld‐elf.so.1.gmon
‐rw‐r‐‐r‐‐ 1 root wheel 385180 Nov 21 09:31 libc.so.7.gmon
‐rw‐r‐‐r‐‐ 1 root wheel 458826 Nov 21 09:31 libcrypto.so.5.gmon
‐rw‐r‐‐r‐‐ 1 root wheel 124882 Nov 21 09:31 openssl.gmon
‐rw‐r‐‐r‐‐ 1 root wheel 43690 Nov 21 09:31 sh.gmon
7/29/2019 Profiling Debugging Freebsd Kernel 321772
http://slidepdf.com/reader/full/profiling-debugging-freebsd-kernel-321772 13/32
Pmc S t a t
Profiling and Debugging the FreeBSD* Kernel
May 2009 White Paper
Document Number: 321772-001 13
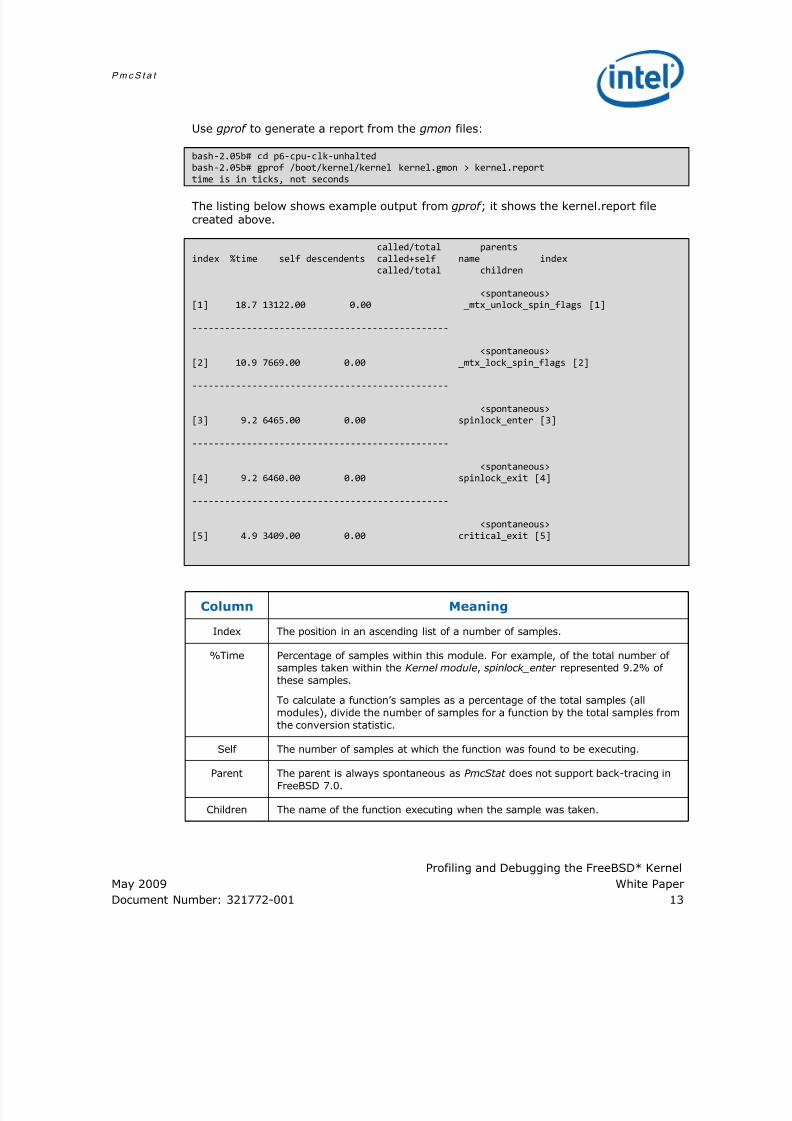
Use gprof to generate a report from the gmon files:
bash‐2.05b# cd p6‐cpu‐clk‐unhalted
bash‐2.05b# gprof /boot/kernel/kernel kernel.gmon > kernel.report
time is in ticks, not seconds
The listing below shows example output from gprof ; it shows the kernel.report filecreated above.
called/total parents
index %time self descendents called+self name index
called/total children
<spontaneous>
[1] 18.7 13122.00 0.00 _mtx_unlock_spin_flags [1]
‐‐‐‐‐‐‐‐‐‐‐‐‐‐‐‐‐‐‐‐‐‐‐‐‐‐‐‐‐‐‐‐‐‐‐‐‐‐‐‐‐‐‐‐‐‐‐
<spontaneous>
[2] 10.9 7669.00 0.00 _mtx_lock_spin_flags [2]
‐‐‐‐‐‐‐‐‐‐‐‐‐‐‐‐‐‐‐‐‐‐‐‐‐‐‐‐‐‐‐‐‐‐‐‐‐‐‐‐‐‐‐‐‐‐‐
<spontaneous>
[3] 9.2 6465.00 0.00 spinlock_enter [3]
‐‐‐‐‐‐‐‐‐‐‐‐‐‐‐‐‐‐‐‐‐‐‐‐‐‐‐‐‐‐‐‐‐‐‐‐‐‐‐‐‐‐‐‐‐‐‐
<spontaneous>
[4] 9.2 6460.00 0.00 spinlock_exit [4]
‐‐‐‐‐‐‐‐‐‐‐‐‐‐‐‐‐‐‐‐‐‐‐‐‐‐‐‐‐‐‐‐‐‐‐‐‐‐‐‐‐‐‐‐‐‐‐
<spontaneous>
[5] 4.9 3409.00 0.00 critical_exit [5]
Column Meaning
Index The position in an ascending list of a number of samples.
%Time Percentage of samples within this module. For example, of the total number of
samples taken within the Kernel module, spinlock_enter represented 9.2% of
these samples.
To calculate a function’s samples as a percentage of the total samples (all
modules), divide the number of samples for a function by the total samples from
the conversion statistic.
Self The number of samples at which the function was found to be executing.
Parent The parent is always spontaneous as PmcStat does not support back-tracing in
FreeBSD 7.0.
Children The name of the function executing when the sample was taken.
7/29/2019 Profiling Debugging Freebsd Kernel 321772
http://slidepdf.com/reader/full/profiling-debugging-freebsd-kernel-321772 14/32
Pmc S t a t
Profiling and Debugging the FreeBSD* Kernel
White Paper May 2009
14 Document Number: 321772-001
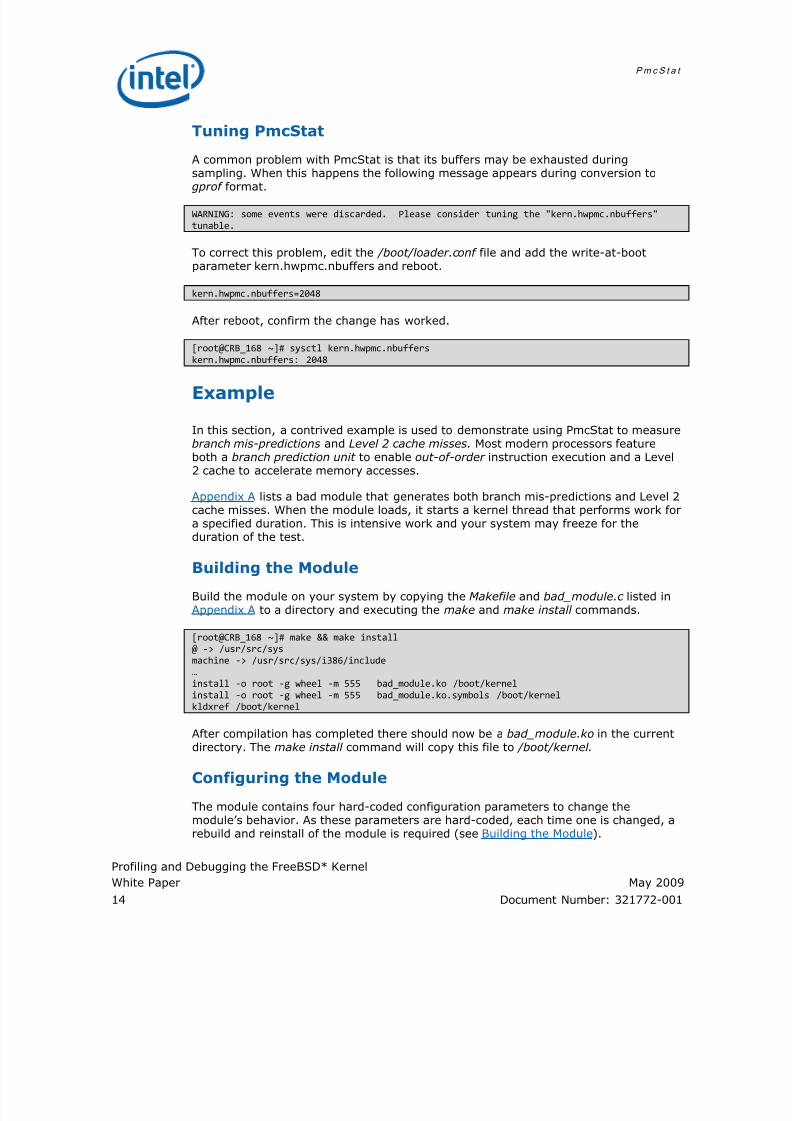
Tuning PmcStat
A common problem with PmcStat is that its buffers may be exhausted duringsampling. When this happens the following message appears during conversion to
gprof format.
WARNING: some events were discarded. Please consider tuning the "kern.hwpmc.nbuffers"
tunable.
To correct this problem, edit the /boot/loader.conf file and add the write-at-bootparameter kern.hwpmc.nbuffers and reboot.
kern.hwpmc.nbuffers=2048
After reboot, confirm the change has worked.
[root@CRB_168 ~]# sysctl kern.hwpmc.nbuffers
kern.hwpmc.nbuffers: 2048
Example
In this section, a contrived example is used to demonstrate using PmcStat to measurebranch mis-predictions and Level 2 cache misses. Most modern processors featureboth a branch prediction unit to enable out-of-order instruction execution and a Level2 cache to accelerate memory accesses.
1Appendix A lists a bad module that generates both branch mis-predictions and Level 2cache misses. When the module loads, it starts a kernel thread that performs work fora specified duration. This is intensive work and your system may freeze for theduration of the test.
Building the Module
Build the module on your system by copying the Makefile and bad_module.c listed in1Appendix A to a directory and executing the make and make install commands.
[root@CRB_168 ~]# make && make install
@ ‐> /usr/src/sys
machine ‐> /usr/src/sys/i386/include
…
install ‐o root ‐g wheel ‐m 555 bad_module.ko /boot/kernel
install ‐o root ‐g wheel ‐m 555 bad_module.ko.symbols /boot/kernel
kldxref /boot/kernel
After compilation has completed there should now be a bad_module.ko in the currentdirectory. The make install command will copy this file to /boot/kernel .
Configuring the Module
The module contains four hard-coded configuration parameters to change themodule’s behavior. As these parameters are hard-coded, each time one is changed, arebuild and reinstall of the module is required (see Building the Module).
7/29/2019 Profiling Debugging Freebsd Kernel 321772
http://slidepdf.com/reader/full/profiling-debugging-freebsd-kernel-321772 15/32
Pmc S t a t
Profiling and Debugging the FreeBSD* Kernel
May 2009 White Paper
Document Number: 321772-001 15
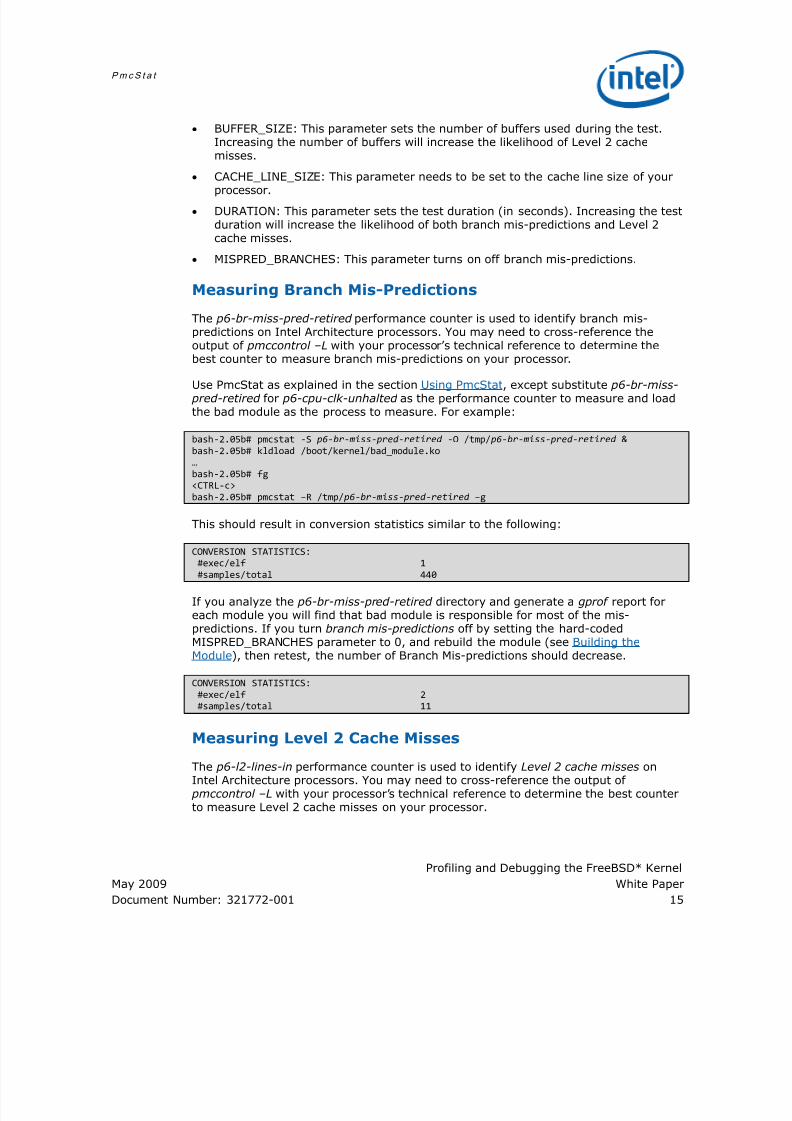
• BUFFER_SIZE: This parameter sets the number of buffers used during the test.Increasing the number of buffers will increase the likelihood of Level 2 cachemisses.
• CACHE_LINE_SIZE: This parameter needs to be set to the cache line size of your
processor.
• DURATION: This parameter sets the test duration (in seconds). Increasing the testduration will increase the likelihood of both branch mis-predictions and Level 2cache misses.
• MISPRED_BRANCHES: This parameter turns on off branch mis-predictions.
Measuring Branch Mis-Predictions
The p6-br-miss-pred-retired performance counter is used to identify branch mis-predictions on Intel Architecture processors. You may need to cross-reference theoutput of pmccontrol –L with your processor’s technical reference to determine thebest counter to measure branch mis-predictions on your processor.
Use PmcStat as explained in the section Using PmcStat, except substitute p6-br-miss- pred-retired for p6-cpu-clk-unhalted as the performance counter to measure and loadthe bad module as the process to measure. For example:
bash‐2.05b# pmcstat ‐S p6‐br‐ miss‐ pred ‐retired ‐O /tmp/ p6‐br‐ miss‐ pred ‐retired &
bash‐2.05b# kldload /boot/kernel/bad_module.ko
…
bash‐2.05b# fg
<CTRL‐c>
bash‐2.05b# pmcstat –R /tmp/ p6‐br‐ miss‐ pred ‐retired –g
This should result in conversion statistics similar to the following:
CONVERSION STATISTICS:
#exec/elf 1
#samples/total 440
If you analyze the p6-br-miss-pred-retired directory and generate a gprof report foreach module you will find that bad module is responsible for most of the mis-predictions. If you turn branch mis-predictions off by setting the hard-codedMISPRED_BRANCHES parameter to 0, and rebuild the module (see Building theModule), then retest, the number of Branch Mis-predictions should decrease.
CONVERSION STATISTICS:
#exec/elf 2
#samples/total 11
Measuring Level 2 Cache Misses
The p6-l2-lines-in performance counter is used to identify Level 2 cache misses onIntel Architecture processors. You may need to cross-reference the output of pmccontrol –L with your processor’s technical reference to determine the best counterto measure Level 2 cache misses on your processor.
7/29/2019 Profiling Debugging Freebsd Kernel 321772
http://slidepdf.com/reader/full/profiling-debugging-freebsd-kernel-321772 16/32
Pmc S t a t
Profiling and Debugging the FreeBSD* Kernel
White Paper May 2009
16 Document Number: 321772-001
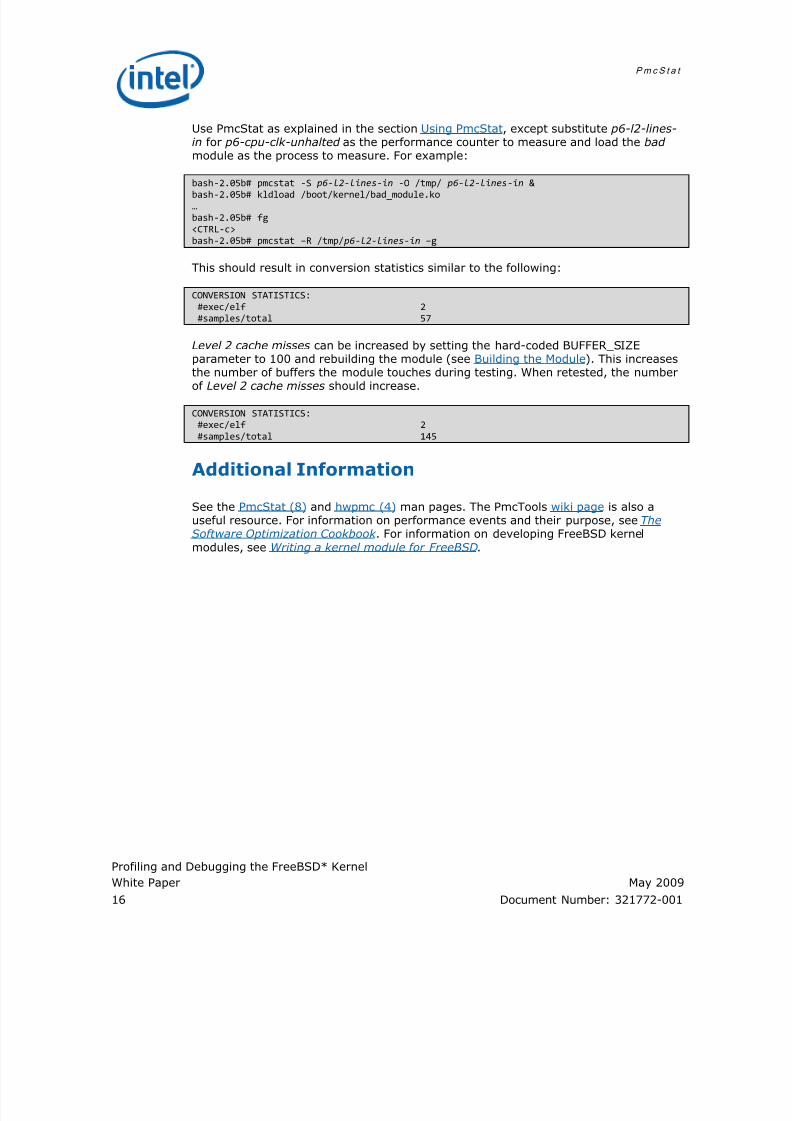
Use PmcStat as explained in the section Using PmcStat, except substitute p6-l2-lines-in for p6-cpu-clk-unhalted as the performance counter to measure and load the bad module as the process to measure. For example:
bash‐2.05b# pmcstat ‐S p6‐l2‐lines‐in ‐O /tmp/ p6‐l2‐lines‐in &
bash‐2.05b#
kldload
/boot/kernel/bad_module.ko
…
bash‐2.05b# fg
<CTRL‐c>
bash‐2.05b# pmcstat –R /tmp/ p6‐l2‐lines‐in –g
This should result in conversion statistics similar to the following:
CONVERSION STATISTICS:
#exec/elf 2
#samples/total 57
Level 2 cache misses can be increased by setting the hard-coded BUFFER_SIZEparameter to 100 and rebuilding the module (see Building the Module). This increasesthe number of buffers the module touches during testing. When retested, the numberof Level 2 cache misses should increase.
CONVERSION STATISTICS:
#exec/elf 2
#samples/total 145
Additional Information
See the PmcStat (8) and hwpmc (4) man pages. The PmcTools wiki page is also auseful resource. For information on performance events and their purpose, see TheSoftware Optimization Cookbook . For information on developing FreeBSD kernelmodules, see Writing a kernel module for FreeBSD.
7/29/2019 Profiling Debugging Freebsd Kernel 321772
http://slidepdf.com/reader/full/profiling-debugging-freebsd-kernel-321772 17/32
L o c k P r o f i l i n g
Profiling and Debugging the FreeBSD* Kernel
May 2009 White Paper
Document Number: 321772-001 17
L o ck P r o f i l i n g
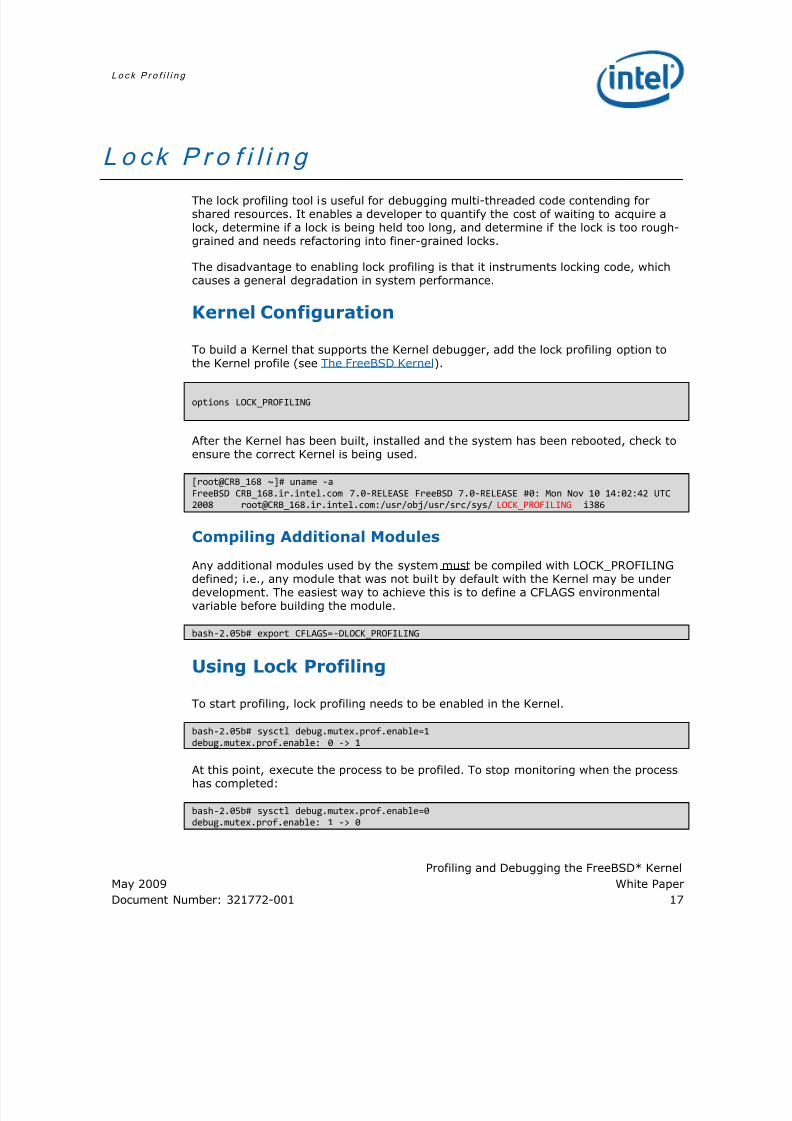
The lock profiling tool is useful for debugging multi-threaded code contending forshared resources. It enables a developer to quantify the cost of waiting to acquire alock, determine if a lock is being held too long, and determine if the lock is too rough-grained and needs refactoring into finer-grained locks.
The disadvantage to enabling lock profiling is that it instruments locking code, whichcauses a general degradation in system performance.
Kernel Configuration
To build a Kernel that supports the Kernel debugger, add the lock profiling option tothe Kernel profile (see The FreeBSD Kernel).
options LOCK_PROFILING
After the Kernel has been built, installed and the system has been rebooted, check toensure the correct Kernel is being used.
[root@CRB_168 ~]# uname ‐a
FreeBSD CRB_168.ir.intel.com 7.0‐RELEASE FreeBSD 7.0‐RELEASE #0: Mon Nov 10 14:02:42 UTC
2008 root@CRB_168.ir.intel.com:/usr/obj/usr/src/sys/ LOCK_PROFILING i386
Compiling Additional Modules
Any additional modules used by the system must be compiled with LOCK_PROFILINGdefined; i.e., any module that was not built by default with the Kernel may be underdevelopment. The easiest way to achieve this is to define a CFLAGS environmentalvariable before building the module.
bash‐2.05b# export CFLAGS=‐DLOCK_PROFILING
Using Lock Profiling
To start profiling, lock profiling needs to be enabled in the Kernel.
bash‐2.05b# sysctl debug.mutex.prof.enable=1
debug.mutex.prof.enable: 0 ‐> 1
At this point, execute the process to be profiled. To stop monitoring when the processhas completed:
bash‐2.05b# sysctl debug.mutex.prof.enable=0
debug.mutex.prof.enable: 1 ‐> 0
7/29/2019 Profiling Debugging Freebsd Kernel 321772
http://slidepdf.com/reader/full/profiling-debugging-freebsd-kernel-321772 18/32
L o c k P r o f i l i n g
Profiling and Debugging the FreeBSD* Kernel
White Paper May 2009
18 Document Number: 321772-001
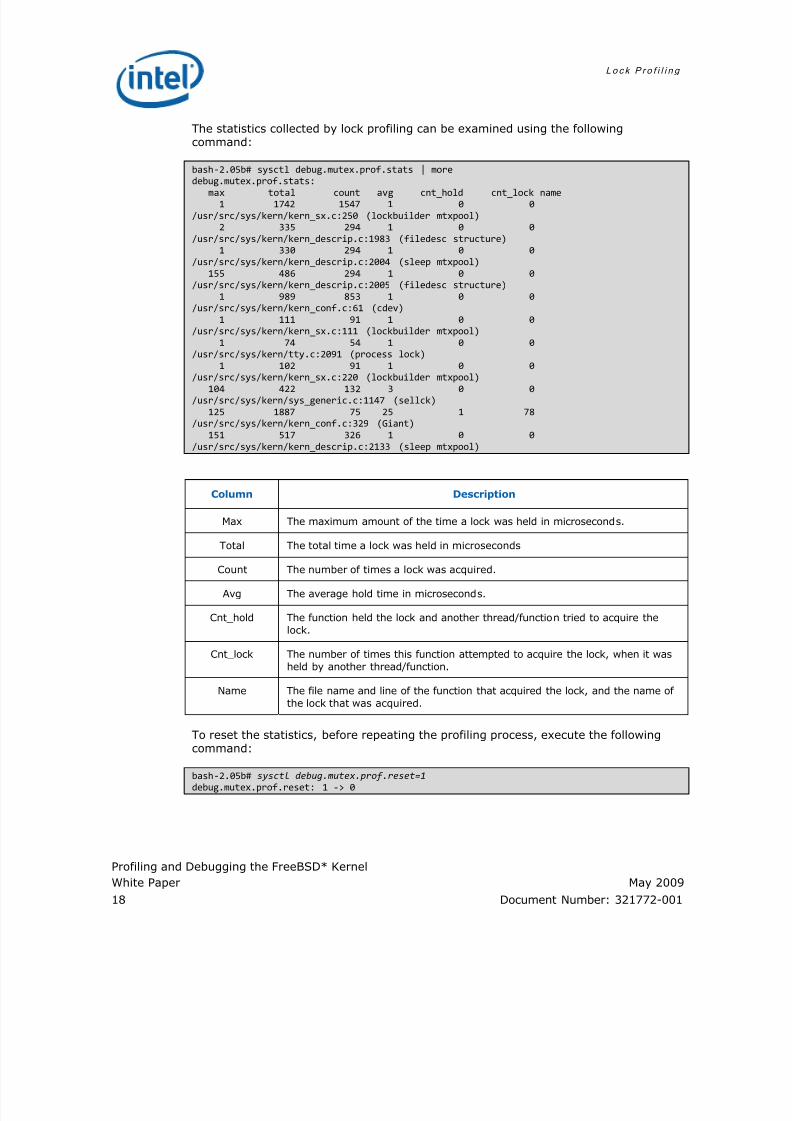
The statistics collected by lock profiling can be examined using the followingcommand:
bash‐2.05b# sysctl debug.mutex.prof.stats | more
debug.mutex.prof.stats:
max
total
count
avg
cnt_hold
cnt_lock name
1 1742 1547 1 0 0
/usr/src/sys/kern/kern_sx.c:250 (lockbuilder mtxpool)
2 335 294 1 0 0
/usr/src/sys/kern/kern_descrip.c:1983 (filedesc structure)
1 330 294 1 0 0
/usr/src/sys/kern/kern_descrip.c:2004 (sleep mtxpool)
155 486 294 1 0 0
/usr/src/sys/kern/kern_descrip.c:2005 (filedesc structure)
1 989 853 1 0 0
/usr/src/sys/kern/kern_conf.c:61 (cdev)
1 111 91 1 0 0
/usr/src/sys/kern/kern_sx.c:111 (lockbuilder mtxpool)
1 74 54 1 0 0
/usr/src/sys/kern/tty.c:2091 (process lock)
1 102 91 1 0 0
/usr/src/sys/kern/kern_sx.c:220 (lockbuilder
mtxpool)
104 422 132 3 0 0
/usr/src/sys/kern/sys_generic.c:1147 (sellck)
125 1887 75 25 1 78
/usr/src/sys/kern/kern_conf.c:329 (Giant)
151 517 326 1 0 0
/usr/src/sys/kern/kern_descrip.c:2133 (sleep mtxpool)
Column Description
Max The maximum amount of the time a lock was held in microseconds.
Total The total time a lock was held in microseconds
Count The number of times a lock was acquired.
Avg The average hold time in microseconds.
Cnt_hold The function held the lock and another thread/function tried to acquire the
lock.
Cnt_lock The number of times this function attempted to acquire the lock, when it was
held by another thread/function.
Name The file name and line of the function that acquired the lock, and the name of
the lock that was acquired.
To reset the statistics, before repeating the profiling process, execute the followingcommand:
bash‐2.05b# sysctl debug.mutex.prof.reset=1
debug.mutex.prof.reset: 1 ‐> 0
7/29/2019 Profiling Debugging Freebsd Kernel 321772
http://slidepdf.com/reader/full/profiling-debugging-freebsd-kernel-321772 19/32
L o c k P r o f i l i n g
Profiling and Debugging the FreeBSD* Kernel
May 2009 White Paper
Document Number: 321772-001 19
Additional information
See the LOCK_PROFILING (9) man page for more information. The paper ReducingLock Contention in a Multi-core system also provides information regarding this tool.
7/29/2019 Profiling Debugging Freebsd Kernel 321772
http://slidepdf.com/reader/full/profiling-debugging-freebsd-kernel-321772 20/32
K e r n e l D e b u g g i n g
Profiling and Debugging the FreeBSD* Kernel
White Paper May 2009
20 Document Number: 321772-001
K e r n e l D e b u g g i n g
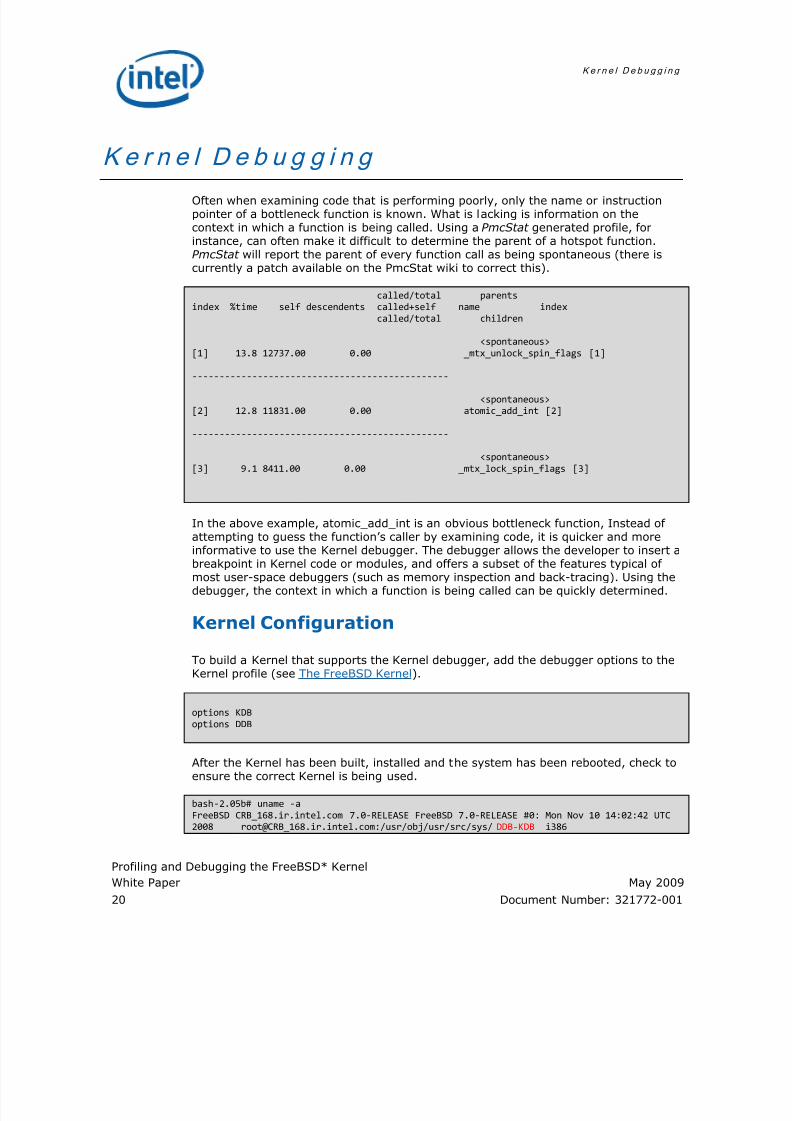
Often when examining code that is performing poorly, only the name or instructionpointer of a bottleneck function is known. What is lacking is information on thecontext in which a function is being called. Using a PmcStat generated profile, forinstance, can often make it difficult to determine the parent of a hotspot function.PmcStat will report the parent of every function call as being spontaneous (there iscurrently a patch available on the PmcStat wiki to correct this).
called/total parents
index %time self descendents called+self name index
called/total children
<spontaneous>
[1] 13.8 12737.00 0.00 _mtx_unlock_spin_flags [1]
‐‐‐‐‐‐‐‐‐‐‐‐‐‐‐‐‐‐‐‐‐‐‐‐‐‐‐‐‐‐‐‐‐‐‐‐‐‐‐‐‐‐‐‐‐‐‐
<spontaneous>
[2] 12.8 11831.00 0.00 atomic_add_int [2]
‐‐‐‐‐‐‐‐‐‐‐‐‐‐‐‐‐‐‐‐‐‐‐‐‐‐‐‐‐‐‐‐‐‐‐‐‐‐‐‐‐‐‐‐‐‐‐
<spontaneous>
[3] 9.1 8411.00 0.00 _mtx_lock_spin_flags [3]
In the above example, atomic_add_int is an obvious bottleneck function, Instead of attempting to guess the function’s caller by examining code, it is quicker and moreinformative to use the Kernel debugger. The debugger allows the developer to insert a
breakpoint in Kernel code or modules, and offers a subset of the features typical of most user-space debuggers (such as memory inspection and back-tracing). Using thedebugger, the context in which a function is being called can be quickly determined.
Kernel Configuration
To build a Kernel that supports the Kernel debugger, add the debugger options to theKernel profile (see The FreeBSD Kernel).
options KDB
options DDB
After the Kernel has been built, installed and the system has been rebooted, check toensure the correct Kernel is being used.
bash‐2.05b# uname ‐a
FreeBSD CRB_168.ir.intel.com 7.0‐RELEASE FreeBSD 7.0‐RELEASE #0: Mon Nov 10 14:02:42 UTC
2008 root@CRB_168.ir.intel.com:/usr/obj/usr/src/sys/ DDB‐KDB i386
7/29/2019 Profiling Debugging Freebsd Kernel 321772
http://slidepdf.com/reader/full/profiling-debugging-freebsd-kernel-321772 21/32
K e r n e l D e b u g g i n g
Profiling and Debugging the FreeBSD* Kernel
May 2009 White Paper
Document Number: 321772-001 21
Using the Kernel Debugger
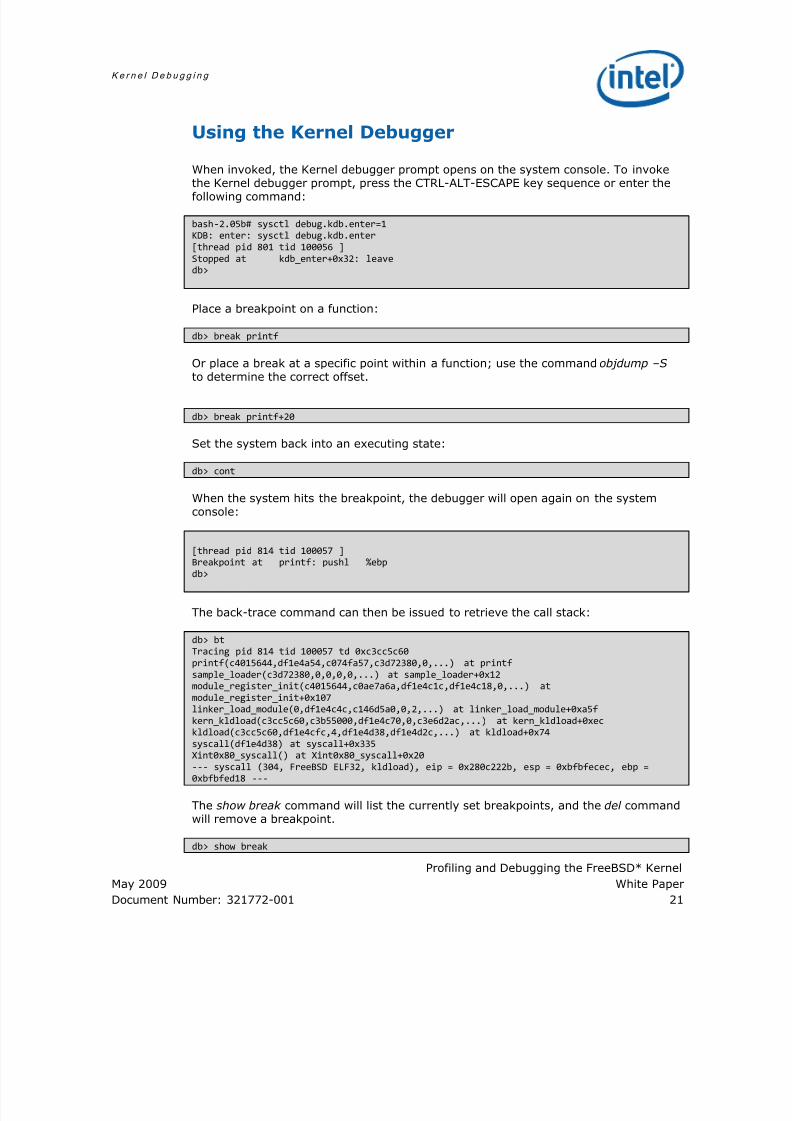
When invoked, the Kernel debugger prompt opens on the system console. To invokethe Kernel debugger prompt, press the CTRL-ALT-ESCAPE key sequence or enter thefollowing command:
bash‐2.05b# sysctl debug.kdb.enter=1
KDB: enter: sysctl debug.kdb.enter
[thread pid 801 tid 100056 ]
Stopped at kdb_enter+0x32: leave
db>
Place a breakpoint on a function:
db> break printf
Or place a break at a specific point within a function; use the command objdump –S
to determine the correct offset.
db> break printf+20
Set the system back into an executing state:
db> cont
When the system hits the breakpoint, the debugger will open again on the systemconsole:
[thread pid 814 tid 100057 ]
Breakpoint at printf: pushl %ebp
db>
The back-trace command can then be issued to retrieve the call stack:
db> bt
Tracing pid 814 tid 100057 td 0xc3cc5c60
printf(c4015644,df1e4a54,c074fa57,c3d72380,0,...) at printf
sample_loader(c3d72380,0,0,0,0,...) at sample_loader+0x12
module_register_init(c4015644,c0ae7a6a,df1e4c1c,df1e4c18,0,...) at
module_register_init+0x107
linker_load_module(0,df1e4c4c,c146d5a0,0,2,...) at linker_load_module+0xa5f
kern_kldload(c3cc5c60,c3b55000,df1e4c70,0,c3e6d2ac,...) at kern_kldload+0xec
kldload(c3cc5c60,df1e4cfc,4,df1e4d38,df1e4d2c,...) at kldload+0x74
syscall(df1e4d38) at syscall+0x335
Xint0x80_syscall()
at
Xint0x80_syscall+0x20
‐‐‐ syscall (304, FreeBSD ELF32, kldload), eip = 0x280c222b, esp = 0xbfbfecec, ebp =
0xbfbfed18 ‐‐‐
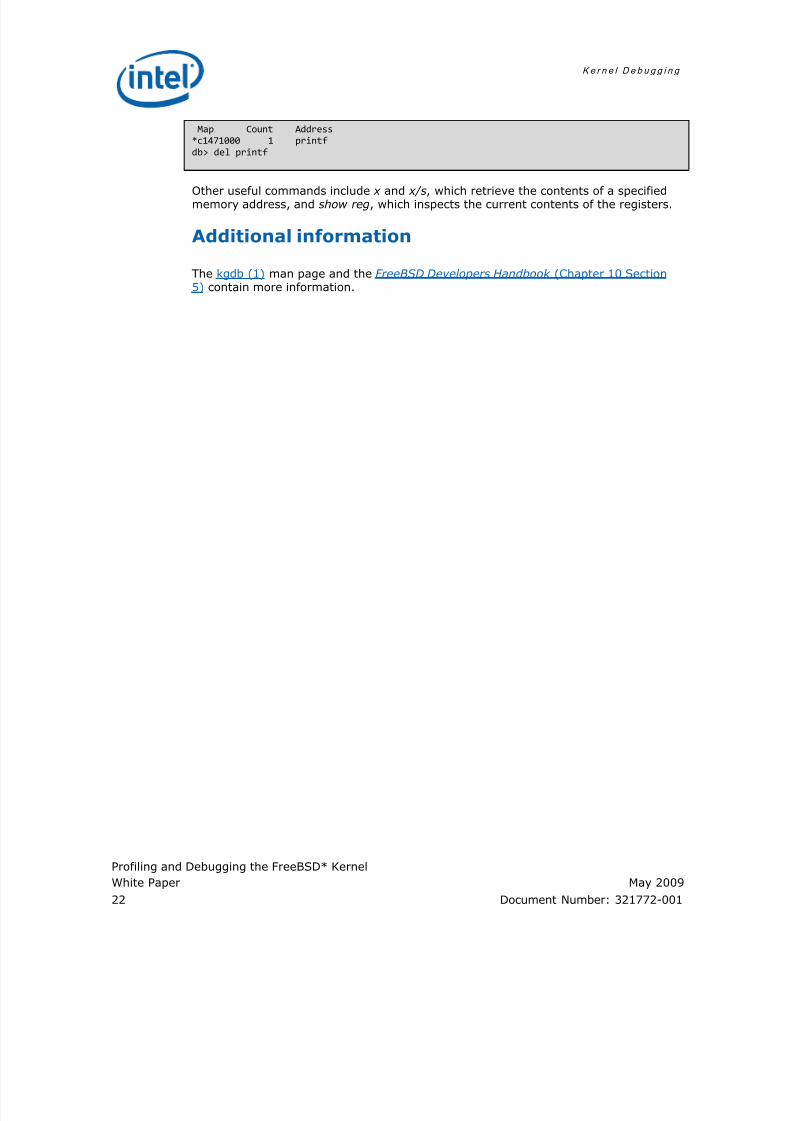
The show break command will list the currently set breakpoints, and the del commandwill remove a breakpoint.
db> show break
7/29/2019 Profiling Debugging Freebsd Kernel 321772
http://slidepdf.com/reader/full/profiling-debugging-freebsd-kernel-321772 22/32
K e r n e l D e b u g g i n g
Profiling and Debugging the FreeBSD* Kernel
White Paper May 2009
22 Document Number: 321772-001
Map Count Address
*c1471000 1 printf
db> del printf
Other useful commands include x and x/s, which retrieve the contents of a specifiedmemory address, and show reg, which inspects the current contents of the registers.
Additional information
The kgdb (1) man page and the FreeBSD Developers Handbook (Chapter 10 Section5) contain more information.
7/29/2019 Profiling Debugging Freebsd Kernel 321772
http://slidepdf.com/reader/full/profiling-debugging-freebsd-kernel-321772 23/32
K g m o n
Profiling and Debugging the FreeBSD* Kernel
May 2009 White Paper
Document Number: 321772-001 23
K g m o n
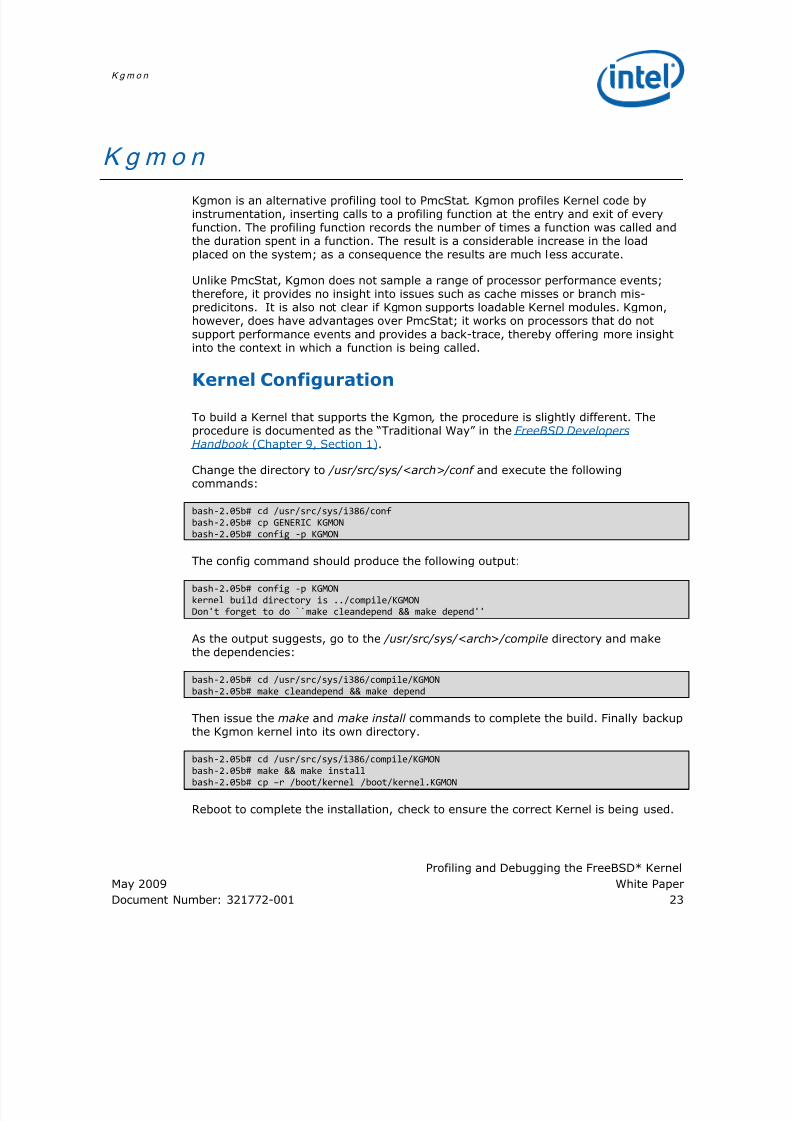
Kgmon is an alternative profiling tool to PmcStat. Kgmon profiles Kernel code byinstrumentation, inserting calls to a profiling function at the entry and exit of everyfunction. The profiling function records the number of times a function was called andthe duration spent in a function. The result is a considerable increase in the loadplaced on the system; as a consequence the results are much less accurate.
Unlike PmcStat, Kgmon does not sample a range of processor performance events;therefore, it provides no insight into issues such as cache misses or branch mis-predicitons. It is also not clear if Kgmon supports loadable Kernel modules. Kgmon,however, does have advantages over PmcStat; it works on processors that do notsupport performance events and provides a back-trace, thereby offering more insightinto the context in which a function is being called.
Kernel Configuration
To build a Kernel that supports the Kgmon , the procedure is slightly different. Theprocedure is documented as the “Traditional Way” in the FreeBSD DevelopersHandbook (Chapter 9, Section 1).
Change the directory to /usr/src/sys/<arch>/conf and execute the followingcommands:
bash‐2.05b# cd /usr/src/sys/i386/conf
bash‐2.05b# cp GENERIC KGMON
bash‐2.05b# config ‐p KGMON
The config command should produce the following output:
bash‐2.05b# config ‐p KGMON
kernel build directory is ../compile/KGMON
Don't forget to do ``make cleandepend && make depend''
As the output suggests, go to the /usr/src/sys/<arch>/compile directory and makethe dependencies:
bash‐2.05b# cd /usr/src/sys/i386/compile/KGMON
bash‐2.05b# make cleandepend && make depend
Then issue the make and make install commands to complete the build. Finally backupthe Kgmon kernel into its own directory.
bash‐2.05b#
cd
/usr/src/sys/i386/compile/KGMON
bash‐2.05b# make && make install
bash‐2.05b# cp –r /boot/kernel /boot/kernel.KGMON
Reboot to complete the installation, check to ensure the correct Kernel is being used.
7/29/2019 Profiling Debugging Freebsd Kernel 321772
http://slidepdf.com/reader/full/profiling-debugging-freebsd-kernel-321772 24/32
K g m o n
Profiling and Debugging the FreeBSD* Kernel
White Paper May 2009
24 Document Number: 321772-001
[root@CRB_168 ~]# uname ‐a
FreeBSD CRB_168.ir.intel.com 7.0‐RELEASE FreeBSD 7.0‐RELEASE #0: Mon Nov 10 14:02:42 UTC
2008
root@CRB_168.ir.intel.com:/usr/obj/usr/src/sys/KGMON i386
Using Kgmon
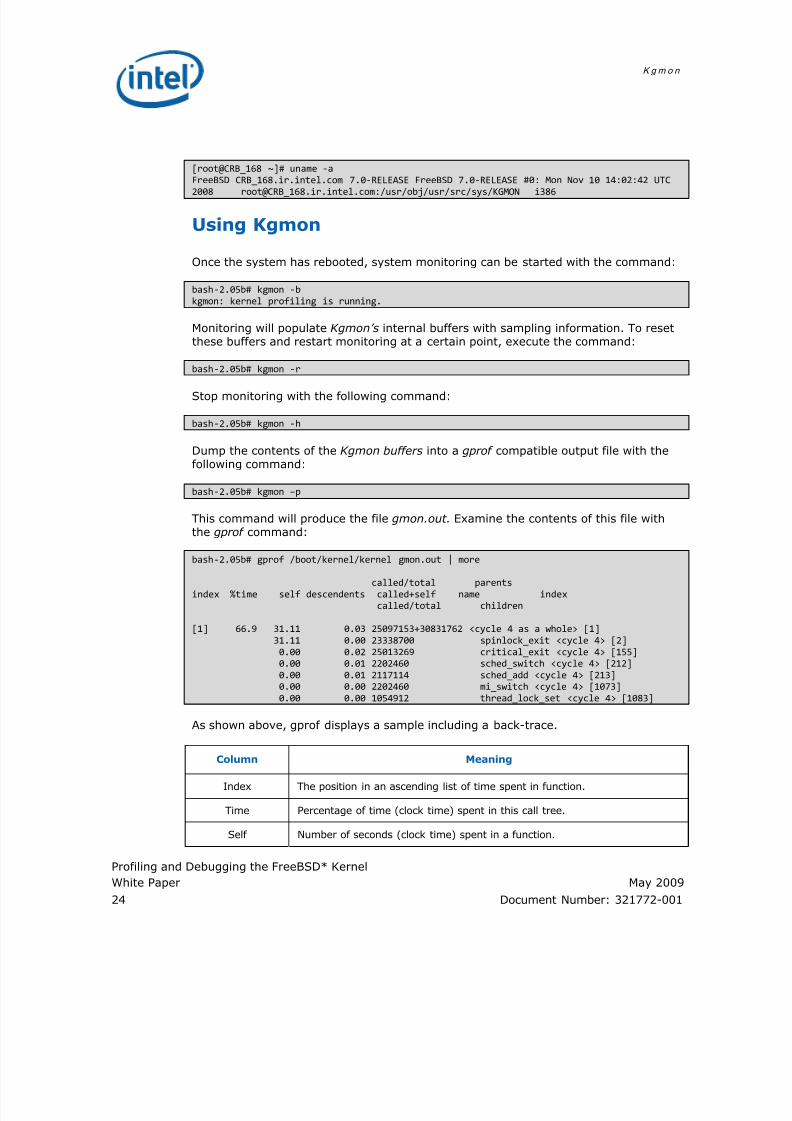
Once the system has rebooted, system monitoring can be started with the command:
bash‐2.05b# kgmon ‐b
kgmon: kernel profiling is running.
Monitoring will populate Kgmon’s internal buffers with sampling information. To resetthese buffers and restart monitoring at a certain point, execute the command:
bash‐2.05b# kgmon ‐r
Stop monitoring with the following command:
bash‐2.05b# kgmon ‐h
Dump the contents of the Kgmon buffers into a gprof compatible output file with thefollowing command:
bash‐2.05b# kgmon –p
This command will produce the file gmon.out. Examine the contents of this file withthe gprof command:
bash‐2.05b# gprof /boot/kernel/kernel gmon.out | more
called/total parents
index %time self descendents called+self name index
called/total children
[1] 66.9 31.11 0.03 25097153+30831762 <cycle 4 as a whole> [1]
31.11 0.00 23338700 spinlock_exit <cycle 4> [2]
0.00 0.02 25013269 critical_exit <cycle 4> [155]
0.00 0.01 2202460 sched_switch <cycle 4> [212]
0.00 0.01 2117114 sched_add <cycle 4> [213]
0.00 0.00 2202460 mi_switch <cycle 4> [1073]
0.00 0.00 1054912 thread_lock_set <cycle 4> [1083]
As shown above, gprof displays a sample including a back-trace.
Column Meaning
Index The position in an ascending list of time spent in function.
Time Percentage of time (clock time) spent in this call tree.
Self Number of seconds (clock time) spent in a function.
7/29/2019 Profiling Debugging Freebsd Kernel 321772
http://slidepdf.com/reader/full/profiling-debugging-freebsd-kernel-321772 25/32
K g m o n
Profiling and Debugging the FreeBSD* Kernel
May 2009 White Paper
Document Number: 321772-001 25
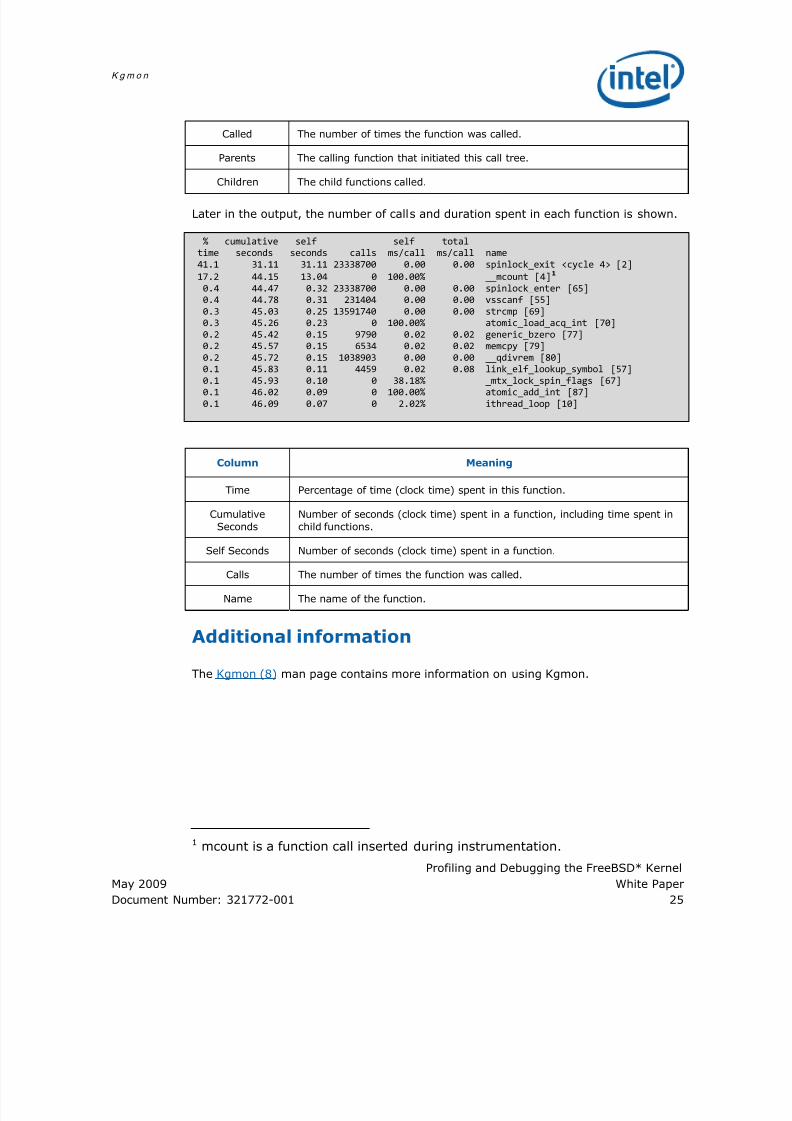
Called The number of times the function was called.
Parents The calling function that initiated this call tree.
Children The child functions called.
Later in the output, the number of calls and duration spent in each function is shown.
% cumulative self self total
time seconds seconds calls ms/call ms/call name
41.1 31.11 31.11 23338700 0.00 0.00 spinlock_exit <cycle 4> [2]
17.2 44.15 13.04 0 100.00% __mcount [4]1
0.4 44.47 0.32 23338700 0.00 0.00 spinlock_enter [65]
0.4 44.78 0.31 231404 0.00 0.00 vsscanf [55]
0.3 45.03 0.25 13591740 0.00 0.00 strcmp [69]
0.3 45.26 0.23 0 100.00% atomic_load_acq_int [70]
0.2 45.42 0.15 9790 0.02 0.02 generic_bzero [77]
0.2 45.57 0.15 6534 0.02 0.02 memcpy [79]
0.2 45.72 0.15 1038903 0.00 0.00 __qdivrem [80]
0.1 45.83 0.11 4459 0.02 0.08 link_elf_lookup_symbol [57]
0.1
45.93
0.10
0
38.18%
_mtx_lock_spin_flags [67]
0.1 46.02 0.09 0 100.00% atomic_add_int [87]
0.1 46.09 0.07 0 2.02% ithread_loop [10]
Column Meaning
Time Percentage of time (clock time) spent in this function.
Cumulative
Seconds
Number of seconds (clock time) spent in a function, including time spent in
child functions.
Self Seconds Number of seconds (clock time) spent in a function.
Calls The number of times the function was called.
Name The name of the function.
Additional information
The Kgmon (8) man page contains more information on using Kgmon.
1 mcount is a function call inserted during instrumentation.
7/29/2019 Profiling Debugging Freebsd Kernel 321772
http://slidepdf.com/reader/full/profiling-debugging-freebsd-kernel-321772 26/32
K e r n e l T r a c e
Profiling and Debugging the FreeBSD* Kernel
White Paper May 2009
26 Document Number: 321772-001
K e r n e l T r a c e
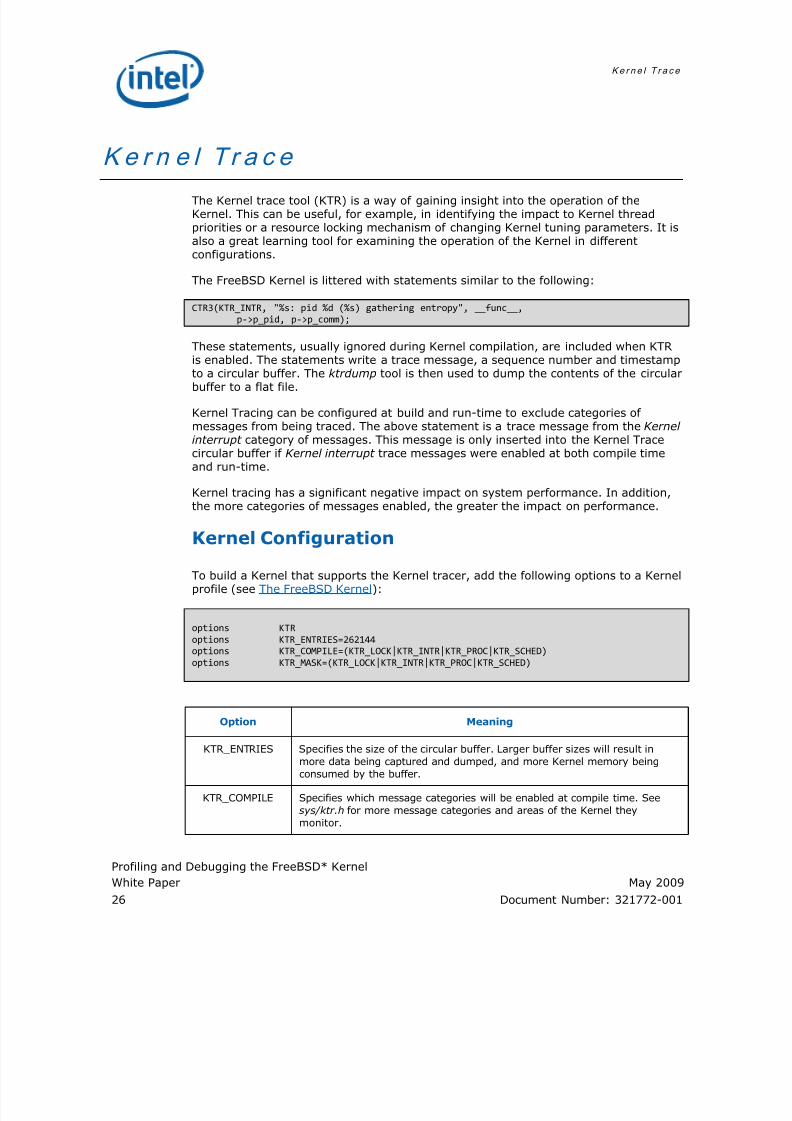
The Kernel trace tool (KTR) is a way of gaining insight into the operation of theKernel. This can be useful, for example, in identifying the impact to Kernel threadpriorities or a resource locking mechanism of changing Kernel tuning parameters. It isalso a great learning tool for examining the operation of the Kernel in differentconfigurations.
The FreeBSD Kernel is littered with statements similar to the following:
CTR3(KTR_INTR, "%s: pid %d (%s) gathering entropy", __func__,
p‐>p_pid, p‐>p_comm);
These statements, usually ignored during Kernel compilation, are included when KTRis enabled. The statements write a trace message, a sequence number and timestamp
to a circular buffer. The ktrdump tool is then used to dump the contents of the circularbuffer to a flat file.
Kernel Tracing can be configured at build and run-time to exclude categories of messages from being traced. The above statement is a trace message from the Kernel interrupt category of messages. This message is only inserted into the Kernel Tracecircular buffer if Kernel interrupt trace messages were enabled at both compile timeand run-time.
Kernel tracing has a significant negative impact on system performance. In addition,the more categories of messages enabled, the greater the impact on performance.
Kernel Configuration
To build a Kernel that supports the Kernel tracer, add the following options to a Kernelprofile (see The FreeBSD Kernel):
options KTR
options KTR_ENTRIES=262144
options KTR_COMPILE=(KTR_LOCK|KTR_INTR|KTR_PROC|KTR_SCHED)
options KTR_MASK=(KTR_LOCK|KTR_INTR|KTR_PROC|KTR_SCHED)
Option Meaning
KTR_ENTRIES Specifies the size of the circular buffer. Larger buffer sizes will result in
more data being captured and dumped, and more Kernel memory beingconsumed by the buffer.
KTR_COMPILE Specifies which message categories will be enabled at compile time. See
sys/ktr.h for more message categories and areas of the Kernel they
monitor.

7/29/2019 Profiling Debugging Freebsd Kernel 321772
http://slidepdf.com/reader/full/profiling-debugging-freebsd-kernel-321772 27/32
K e r n e l T r a c e
Profiling and Debugging the FreeBSD* Kernel
May 2009 White Paper
Document Number: 321772-001 27
KTR_MASK Specifies which message categories will be enabled by default at run-time.
This can be changed at run-time using sysctl.
After the Kernel has been built, installed, and the system has been rebooted, check to
ensure the correct Kernel is being used.
bash‐2.05b# uname ‐a
FreeBSD CRB_168.ir.intel.com 7.0‐RELEASE FreeBSD 7.0‐RELEASE #0: Mon Nov 10 14:02:42 UTC
2008 root@CRB_168.ir.intel.com:/usr/obj/usr/src/sys/ KTR i386
Using Kernel Trace
The current contents of the circular buffer can be cleared using the followingcommand:
bash‐2.05b# sysctl debug.ktr.clear=1
debug.ktr.clear: 0 ‐> 0
The current contents of the circular buffer can be dumped to a flat file using thektrdump command. The sample below show some typical contents of a dump file. Inthis case, we see mutexes being locked and unlocked:
bash‐2.05b# ktrdump ‐t ‐o dump.out
bash‐2.05b# head dump.out
index timestamp trace
‐‐‐‐‐‐ ‐‐‐‐‐‐‐‐‐‐‐‐‐‐‐‐ ‐‐‐‐‐
145114 16131885497864 UNLOCK (sleep mutex) pmap r = 0 at
/usr/src/sys/i386/i386/pmap.c:981
145113 16131885497694 LOCK (sleep mutex) pmap r = 0 at /usr/src/sys/i386/i386/pmap.c:976
145112 16131885497237 UNLOCK (sleep mutex) system map r = 0 at
/usr/src/sys/vm/vm_glue.c:153
145111 16131885496930 LOCK (sleep mutex) system map r = 0 at
/usr/src/sys/vm/vm_glue.c:151
145110
16131885496615 LOCK
(sleep
mutex)
Giant
r
=
0
at
/usr/src/sys/kern/kern_conf.c:360
145109 16131885496332 UNLOCK (sleep mutex) cdev r = 0 at
/usr/src/sys/kern/kern_conf.c:101
145108 16131885496147 LOCK (sleep mutex) cdev r = 0 at /usr/src/sys/kern/kern_conf.c:69
In addition to an index and a timestamp, each trace message in the file is alsoannotated with the source file and line number of the line of code that generated themessage.
The trace mask can be changed at run-time to exclude messages from the trace.
[root@CRB_168 /EP80579/test]# sysctl debug.ktr.mask=20001208
debug.ktr.mask: 20001208 ‐> 20001208
debug.ktr.clear: 0 ‐> 0
Additional information
The ktr (4) and ktrdump (8) man page contains more information.
7/29/2019 Profiling Debugging Freebsd Kernel 321772
http://slidepdf.com/reader/full/profiling-debugging-freebsd-kernel-321772 28/32
Co n c l u s i o n
Profiling and Debugging the FreeBSD* Kernel
White Paper May 2009
28 Document Number: 321772-001
Co n c l u s i o n
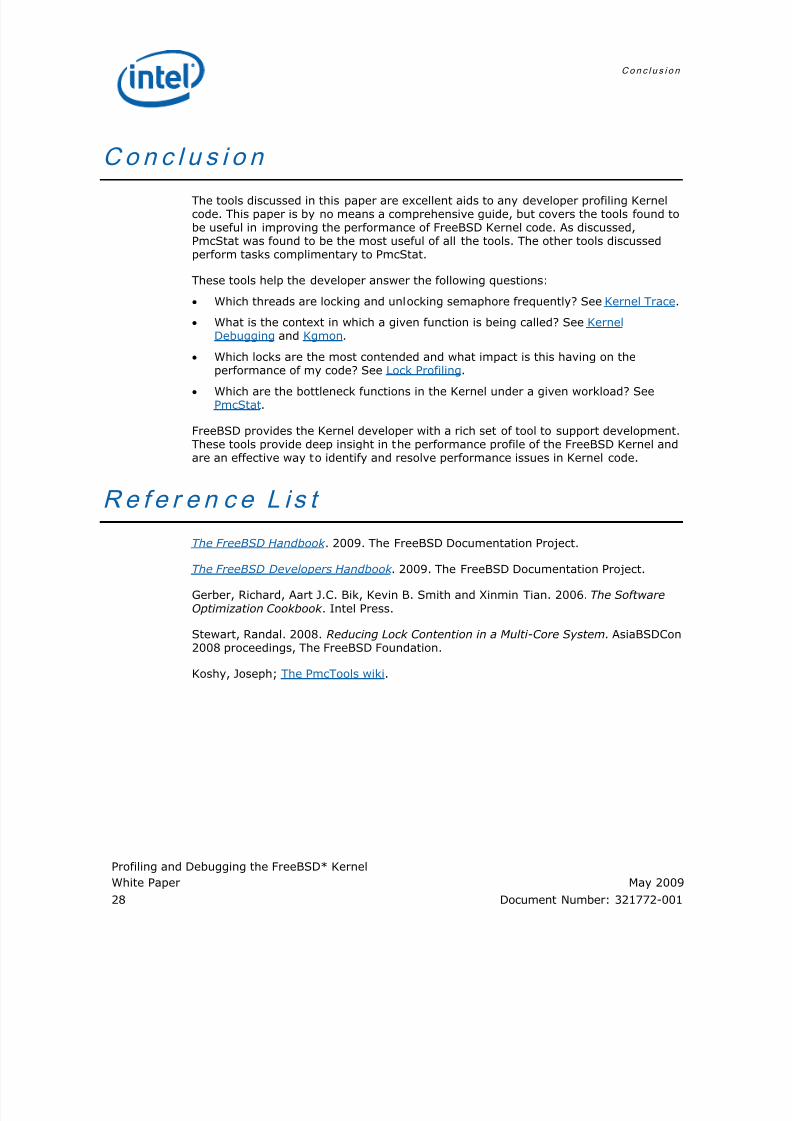
The tools discussed in this paper are excellent aids to any developer profiling Kernelcode. This paper is by no means a comprehensive guide, but covers the tools found tobe useful in improving the performance of FreeBSD Kernel code. As discussed,PmcStat was found to be the most useful of all the tools. The other tools discussedperform tasks complimentary to PmcStat.
These tools help the developer answer the following questions:
• Which threads are locking and unlocking semaphore frequently? See 1Kernel Trace.
• What is the context in which a given function is being called? See 1KernelDebugging and 1Kgmon.
• Which locks are the most contended and what impact is this having on theperformance of my code? See 1Lock Profiling.
• Which are the bottleneck functions in the Kernel under a given workload? See1PmcStat.
FreeBSD provides the Kernel developer with a rich set of tool to support development.These tools provide deep insight in the performance profile of the FreeBSD Kernel andare an effective way to identify and resolve performance issues in Kernel code.
Re f e r e n c e L i s t
The FreeBSD Handbook . 2009. The FreeBSD Documentation Project.
The FreeBSD Developers Handbook . 2009. The FreeBSD Documentation Project.
Gerber, Richard, Aart J.C. Bik, Kevin B. Smith and Xinmin Tian. 2006. The SoftwareOptimization Cookbook . Intel Press.
Stewart, Randal. 2008. Reducing Lock Contention in a Multi-Core System. AsiaBSDCon2008 proceedings, The FreeBSD Foundation.
Koshy, Joseph; The PmcTools wiki.
7/29/2019 Profiling Debugging Freebsd Kernel 321772
http://slidepdf.com/reader/full/profiling-debugging-freebsd-kernel-321772 29/32
A p p e n d i x A
Profiling and Debugging the FreeBSD* Kernel
May 2009 White Paper
Document Number: 321772-001 29
A p p e n d i x A
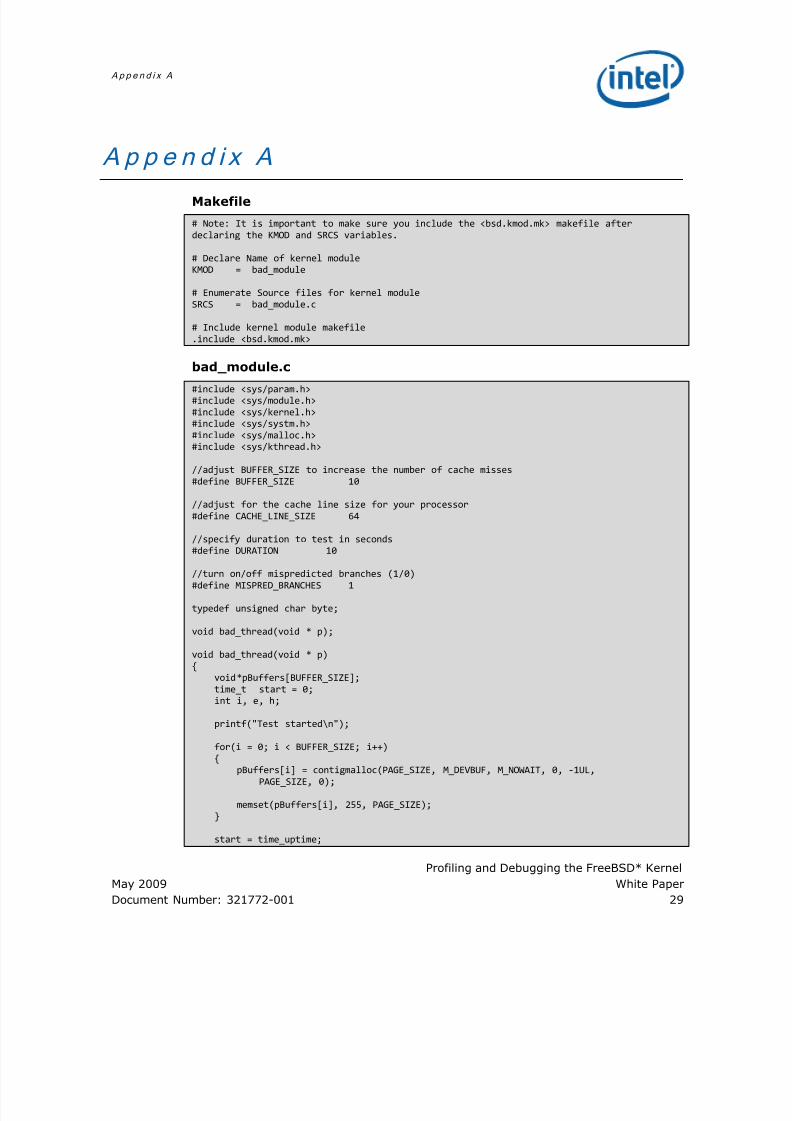
Makefile
# Note: It is important to make sure you include the <bsd.kmod.mk> makefile after
declaring the KMOD and SRCS variables.
# Declare Name of kernel module
KMOD = bad_module
# Enumerate Source files for kernel module
SRCS = bad_module.c
# Include kernel module makefile
.include <bsd.kmod.mk>
bad_module.c
#include <sys/param.h>
#include <sys/module.h>
#include <sys/kernel.h>
#include <sys/systm.h>
#include <sys/malloc.h>
#include <sys/kthread.h>
//adjust BUFFER_SIZE to increase the number of cache misses
#define BUFFER_SIZE 10
//adjust for the cache line size for your processor
#define CACHE_LINE_SIZE 64
//specify duration to test in seconds
#define DURATION 10
//turn on/off
mispredicted
branches
(1/0)
#define MISPRED_BRANCHES 1
typedef unsigned char byte;
void bad_thread(void * p);
void bad_thread(void * p)
{
void *pBuffers[BUFFER_SIZE];
time_t start = 0;
int i, e, h;
printf("Test started\n");
for(i = 0; i < BUFFER_SIZE; i++)
{ pBuffers[i] = contigmalloc(PAGE_SIZE, M_DEVBUF, M_NOWAIT, 0, ‐1UL,
PAGE_SIZE, 0);
memset(pBuffers[i], 255, PAGE_SIZE);
}
start = time_uptime;
7/29/2019 Profiling Debugging Freebsd Kernel 321772
http://slidepdf.com/reader/full/profiling-debugging-freebsd-kernel-321772 30/32
A p p e n d i x A
Profiling and Debugging the FreeBSD* Kernel
White Paper May 2009
30 Document Number: 321772-001
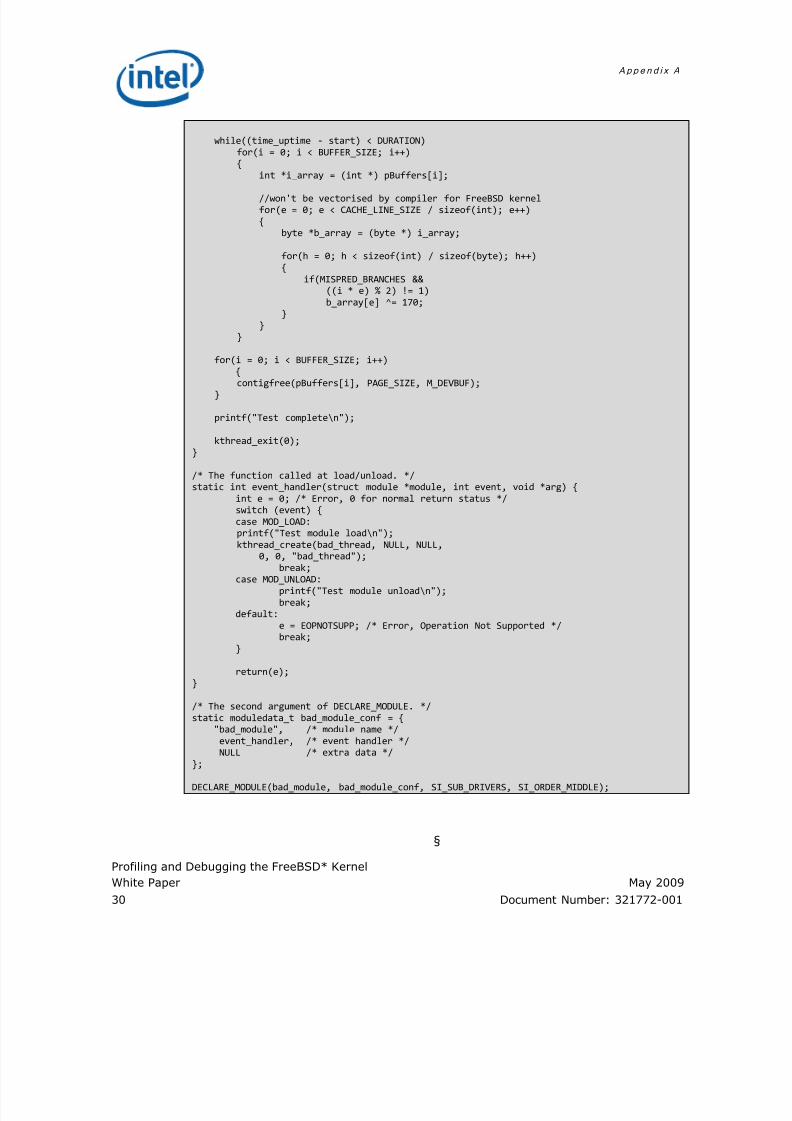
while((time_uptime ‐ start) < DURATION)
for(i = 0; i < BUFFER_SIZE; i++)
{
int *i_array = (int *) pBuffers[i];
//won't be vectorised by compiler for FreeBSD kernel
for(e = 0; e < CACHE_LINE_SIZE / sizeof(int); e++)
{
byte *b_array = (byte *) i_array;
for(h = 0; h < sizeof(int) / sizeof(byte); h++)
{
if(MISPRED_BRANCHES &&
((i * e) % 2) != 1)
b_array[e] ^= 170;
}
}
}
for(i = 0; i < BUFFER_SIZE; i++)
{
contigfree(pBuffers[i], PAGE_SIZE,
M_DEVBUF);
}
printf("Test complete\n");
kthread_exit(0);
}
/* The function called at load/unload. */
static int event_handler(struct module *module, int event, void *arg) {
int e = 0; /* Error, 0 for normal return status */
switch (event) {
case MOD_LOAD:
printf("Test module load\n");
kthread_create(bad_thread, NULL, NULL,
0, 0, "bad_thread");
break; case MOD_UNLOAD:
printf("Test module unload\n");
break;
default:
e = EOPNOTSUPP; /* Error, Operation Not Supported */
break;
}
return(e);
}
/* The second argument of DECLARE_MODULE. */
static moduledata_t bad_module_conf = {
"bad_module", /* module name */
event_handler, /* event handler */
NULL /* extra data */
};
DECLARE_MODULE(bad_module, bad_module_conf, SI_SUB_DRIVERS, SI_ORDER_MIDDLE);
§
7/29/2019 Profiling Debugging Freebsd Kernel 321772
http://slidepdf.com/reader/full/profiling-debugging-freebsd-kernel-321772 31/32
A p p e n d i x A
Profiling and Debugging the FreeBSD* Kernel
May 2009 White Paper Document Number: 321772-001 31
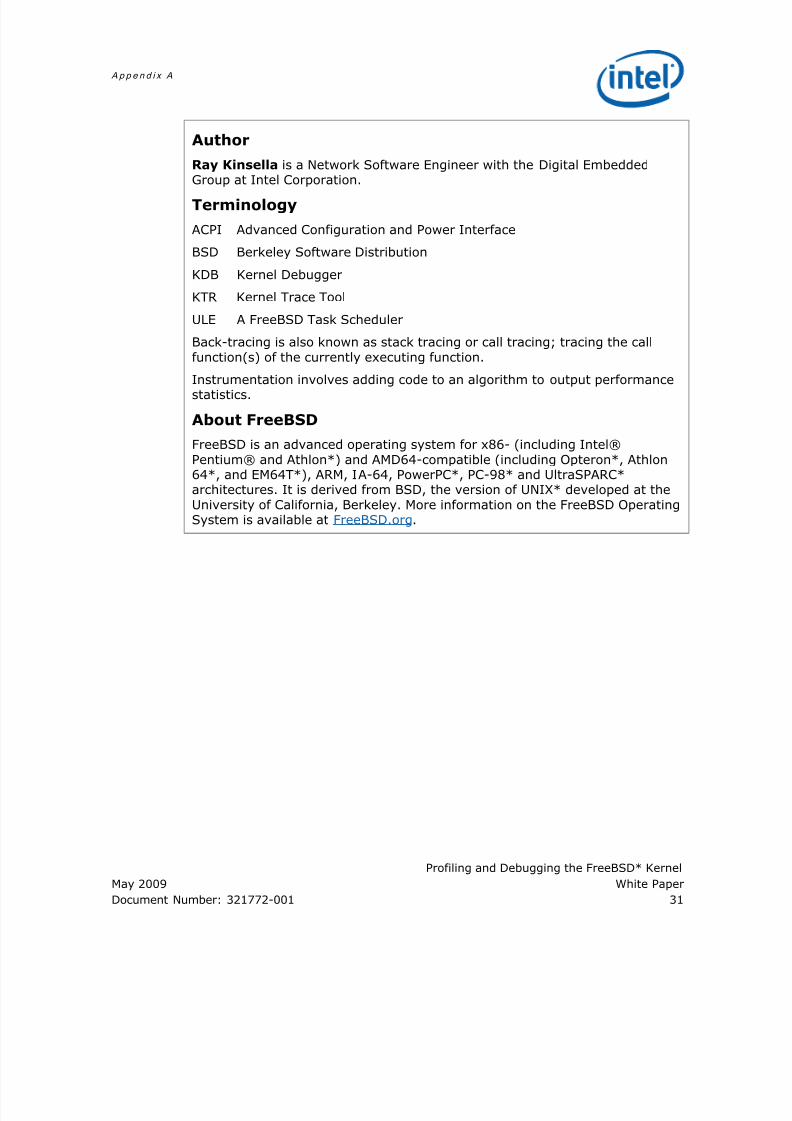
Author
Ray Kinsella is a Network Software Engineer with the Digital EmbeddedGroup at Intel Corporation.
Terminology
ACPI Advanced Configuration and Power Interface
BSD Berkeley Software Distribution
KDB Kernel Debugger
KTR Kernel Trace Tool
ULE A FreeBSD Task Scheduler
Back-tracing is also known as stack tracing or call tracing; tracing the call
function(s) of the currently executing function.
Instrumentation involves adding code to an algorithm to output performancestatistics.
About FreeBSD
FreeBSD is an advanced operating system for x86- (including Intel®
Pentium® and Athlon*) and AMD64-compatible (including Opteron*, Athlon64*, and EM64T*), ARM, IA-64, PowerPC*, PC-98* and UltraSPARC*architectures. It is derived from BSD, the version of UNIX* developed at the
University of California, Berkeley. More information on the FreeBSD OperatingSystem is available at FreeBSD.org.
7/29/2019 Profiling Debugging Freebsd Kernel 321772
http://slidepdf.com/reader/full/profiling-debugging-freebsd-kernel-321772 32/32
A p p e n d i x A
Profiling and Debugging the FreeBSD* Kernel
White Paper May 2009
INFORMATION IN THIS DOCUMENT IS PROVIDED IN CONNECTION WITH INTEL PRODUCTS. NO
LICENSE, EXPRESS OR IMPLIED, BY ESTOPPEL OR OTHERWISE, TO ANY INTELLECTUAL PROPERTY
RIGHTS IS GRANTED BY THIS DOCUMENT. EXCEPT AS PROVIDED IN INTEL'S TERMS AND
CONDITIONS OF SALE FOR SUCH PRODUCTS, INTEL ASSUMES NO LIABILITY WHATSOEVER AND
INTEL DISCLAIMS ANY EXPRESS OR IMPLIED WARRANTY, RELATING TO SALE AND/OR USE OF INTEL
PRODUCTS INCLUDING LIABILITY OR WARRANTIES RELATING TO FITNESS FOR A PARTICULAR
PURPOSE, MERCHANTABILITY, OR INFRINGEMENT OF ANY PATENT, COPYRIGHT OR OTHER
INTELLECTUAL PROPERTY RIGHT.
UNLESS OTHERWISE AGREED IN WRITING BY INTEL, THE INTEL PRODUCTS ARE NOT DESIGNED
NOR INTENDED FOR ANY APPLICATION IN WHICH THE FAILURE OF THE INTEL PRODUCT COULD
CREATE A SITUATION WHERE PERSONAL INJURY OR DEATH MAY OCCUR.
Intel may make changes to specifications and product descriptions at any time, without notice.
Designers must not rely on the absence or characteristics of any features or instructions marked
"reserved" or "undefined." Intel reserves these for future definition and shall have no responsibility
whatsoever for conflicts or incompatibilities arising from future changes to them. The information here
is subject to change without notice. Do not finalize a design with this information.
The products described in this document may contain design defects or errors known as errata which
may cause the product to deviate from published specifications. Current characterized errata are
available on request.
Any software source code reprinted in this document is furnished under a software license and may
only be used or copied in accordance with the terms of that license.
Contact your local Intel sales office or your distributor to obtain the latest specifications and beforeplacing your product order.
Copies of documents which have an order number and are referenced in this document, or other Intel
literature, may be obtained by calling 1-800-548-4725, or by visiting Intel's Web Site
(http://www.intel.com/).
BunnyPeople, Celeron, Celeron Inside, Centrino, Centrino Inside, Core Inside, FlashFile, i960,
InstantIP, Intel, Intel logo, Intel386, Intel486, IntelDX2, IntelDX4, IntelSX2, Intel Atom, Intel Atom
Inside, Intel Core, Intel Inside, Intel Inside logo, Intel NetBurst, Intel NetMerge, Intel NetStructure,
Intel SingleDriver, Intel SpeedStep, Intel StrataFlash, Intel Viiv, Intel vPro, Intel XScale, InTru, InTru
logo, Itanium, Itanium Inside, MCS, MMX, Oplus, PDCharm, Pentium, Pentium Inside, skoool, Sound
Mark, The Journey Inside, Viiv Inside, vPro Inside, VTune, Xeon, and Xeon Inside are trademarks of
Intel Corporation in the U.S. and other countries.
*Other names and brands may be claimed as the property of others
Copyright © 2009, Intel Corporation. All rights reserved.
§