Debugging and Profiling PHP Applications
23
Debugging and Profiling PHP Applications Logan Lindquist @llbbl
-
Upload
logan-lindquist -
Category
Technology
-
view
692 -
download
5
description
Debugging and profiling with xdebug. Learn how to setup xdebug on Ubuntu and OSX. We will also be covering how to get it working with our favorite editor, PHPStorm. A couple different profiling tools will be demonstrated.
Transcript of Debugging and Profiling PHP Applications

Debugging and Profiling PHP ApplicationsLogan Lindquist @llbbl

Debugging vs Profiling
Debugging
Bug fixing
Used during Development to minimize bugs
Profiling
Performance tuning
?????

What Is This Magic?!?

Xdebug is AWESOME
Pretty var_dumps
EnhancedStack Trace
Debugging
Profiling
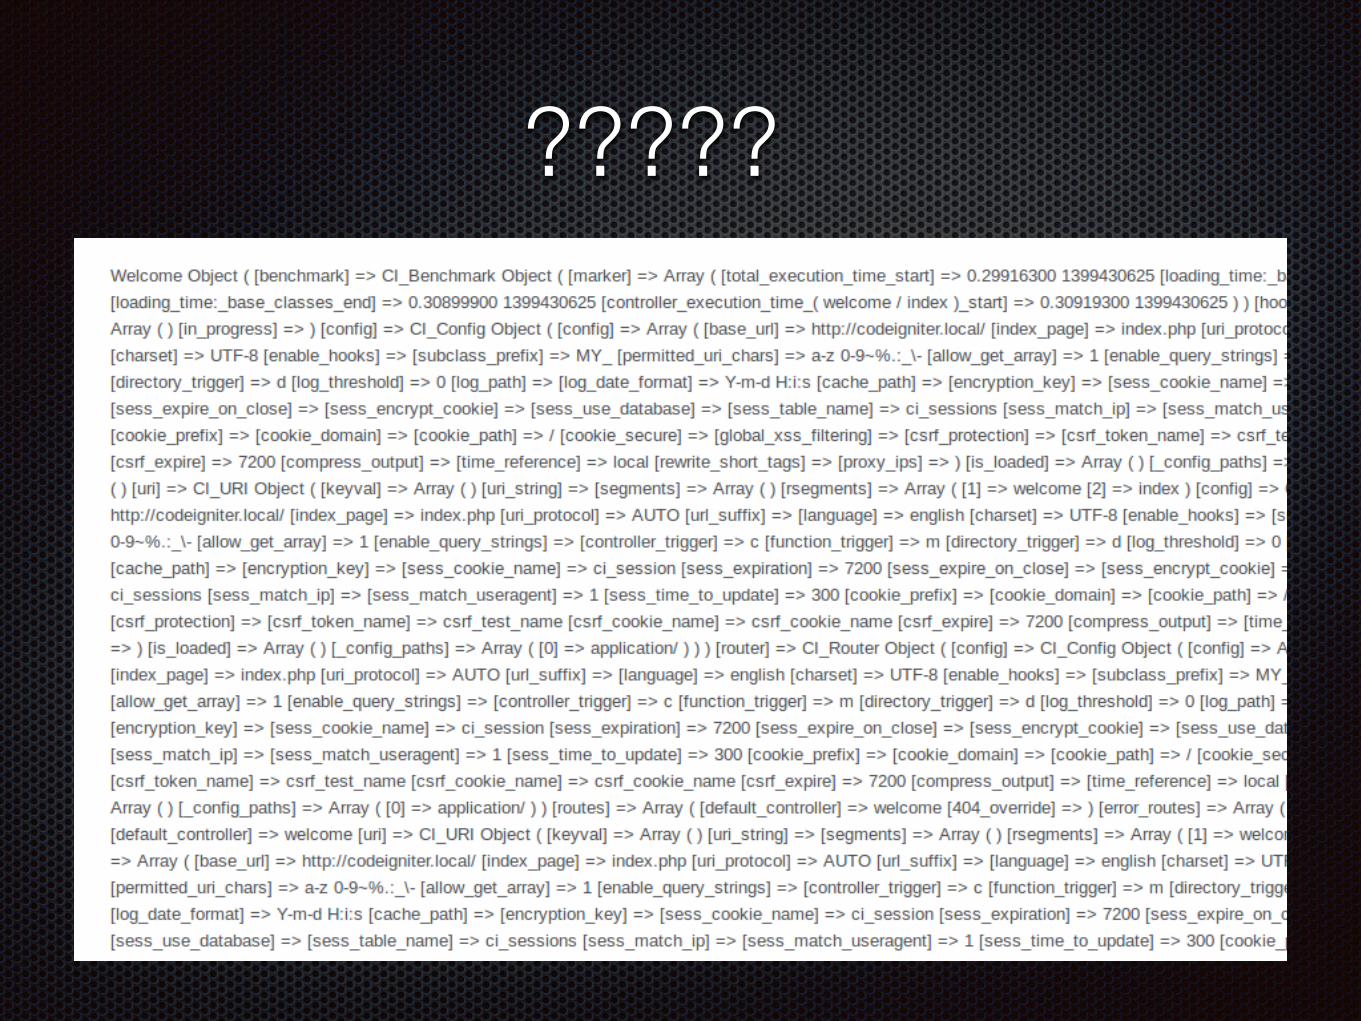
OMGWTFBBQ Install it NOWOSX:
Install homebrew
Follow instructions: https://github.com/Homebrew/homebrew-php#installation
brew install php54-xdebug
Ubuntu:
sudo apt-get install php5 libapache2-mod-php5 php5-mcrypt php5-xdebug
ruby -e "$(curl -fsSL https://raw.github.com/Homebrew/homebrew/go/install)"
Windows: Install Vagrant then follow Ubuntu

Configure Xdebug for DebuggingTurn on remote debugging:
xdebug.remote_enable=1
Configure what port, host, log file ... and more
xdebug.remote_port= 9000
xdebug.remote_log="/var/www/xdebug.log"
xdebug.remote_host="localhost"

Xdebug Profiling
xdebug.profiler_enable = 1
xdebug.profiler_enable_trigger = 1
xdebug.profiler_output_dir = "/var/www/xdebug"
xdebug.profiler_output_name = xdebug.out.%t

Make sure you have the right PHPSettings > PHP > Intrepreters
....you should see xdebug

Here is how to check symlinked or not
Tools > Deployment > Configuration

Gotchas• Make sure profile directory exists and is writeable by
the web server
• Nothing works without xdebug.remote_enable=1
• Make sure port number matches in your ini and phpstorm. Both default 9000
• SOOOOO many steps ... No shutup, stop being lazy and just do it

How to trigger a debug session
• Javascript bookmarklets
• Chrome extension
• Within PhpStorm
• Magic
• Production crashes Let's cover the first three shall we?

Jetbrains Has The Goodies
http://www.jetbrains.com/phpstorm/marklets/
• Start Debugger:
• Goto page
• Hit Start Debugger
• Hit Stop Debugger when done debugging
• Debug this page:
• Goto page
• Hit Debug this page

Chrome ExtensionName: Xdebug Helper
https://chrome.google.com/webstore/detail/xdebug-helper/eadndfjplgieldjbigjakmdgkmoaaaoc?hl=en
PhpStorm

PhpStorm + Xdebug

Profiling with PhpStormTools > Analyze Xdebug Profiler Snapshot

MCG https://itunes.apple.com/us/app/mcg/id799178412?mt=12

Profiling with MCG

XHProf

XHProf

XHProf• Built by Facebook opensourced in 2009
• Xdebug not required
• Way more complicated to setup
• Documentation isn't great
• Requires you to add xhprof methods to your code
• Requires you to configure apache vhost for reporting
• Has callgraph charts (directed graphs) and a couple other nice features
Install isn't too bad with homebrew or apt-get

In Review...
• Installed Xdebug
• Setup Xdebug with PhpStorm
• Configured Xdebug for profiling or debugging


![Debugging Effectively - php[world] 2015](https://static.fdocuments.us/doc/165x107/588a18d91a28ab132f8b6ac5/debugging-effectively-phpworld-2015.jpg)