Profiling, Tracing, Debugging and Monitoring Frameworks
23
Profiling, Tracing, Debugging and Monitoring Frameworks Sathish Vadhiyar Courtesy: Dr. Shirley Moore (University of Tennessee)
-
Upload
isabella-paul -
Category
Documents
-
view
38 -
download
7
description
Profiling, Tracing, Debugging and Monitoring Frameworks. Sathish Vadhiyar. Courtesy: Dr. Shirley Moore (University of Tennessee). Outline. Profiling ,Tracing, Debugging Tools – Main thrust on Vampir and TotalView Debugging – TotalView. Definitions – Profiling and Tracing. - PowerPoint PPT Presentation
Transcript of Profiling, Tracing, Debugging and Monitoring Frameworks
Profiling, Tracing, Debugging and Monitoring Frameworks
Sathish Vadhiyar
Courtesy: Dr. Shirley Moore (University of Tennessee)
Outline
Profiling ,Tracing, Debugging Tools – Main thrust on Vampir and TotalView
Debugging – TotalView
Definitions – Profiling and Tracing Profiling – Summary information about various
statistics - Number of function calls made - Execution times for functions - Number of floating point instructions - FLOP count etc. Tracing –Information about events - Time stamps about entering/exiting calls - Interaction between processes (send and
recv traces)
Vampir For performance analysis of parallel
applications Event-based and trace-based performance
analysis tool Different statistical displays – - timeline displays - profiling statistics (execution times of routines) - communication statistics Can be analyzed at different levels – zoom
in facility Needs VampirTrace for instrumentation
Problems Identified
Excessive communication cost load (im)balance Communication bottle-necks
Shows percentage spent in all MPI procedures and actual applications
Shows percentage time spent for each MPI procedure
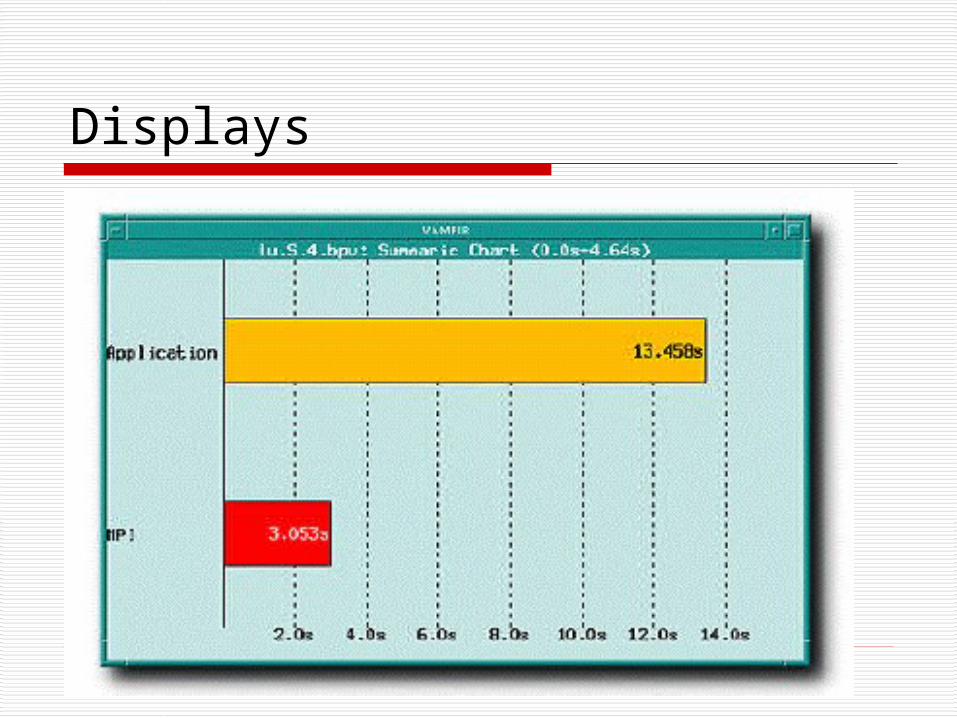
Displays
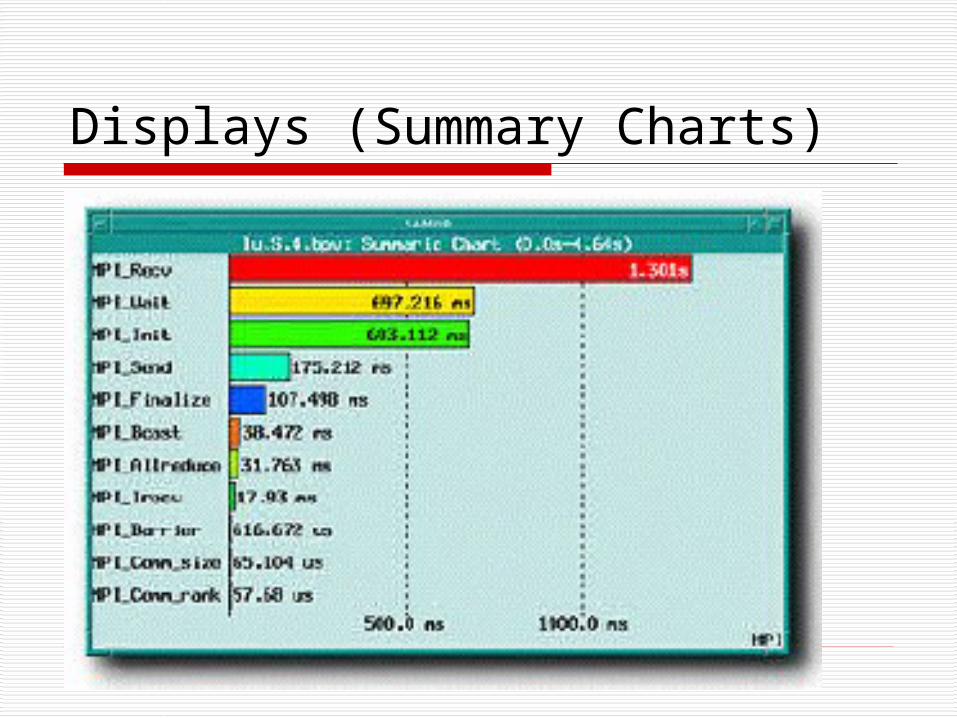
Displays (Summary Charts)
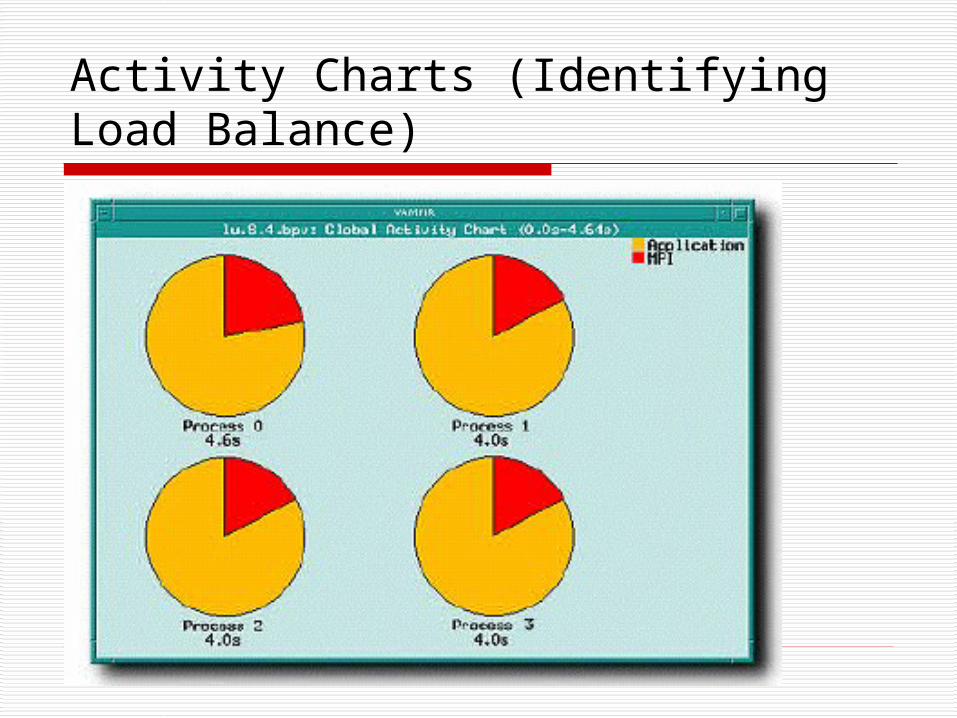
Activity Charts (Identifying Load Balance)
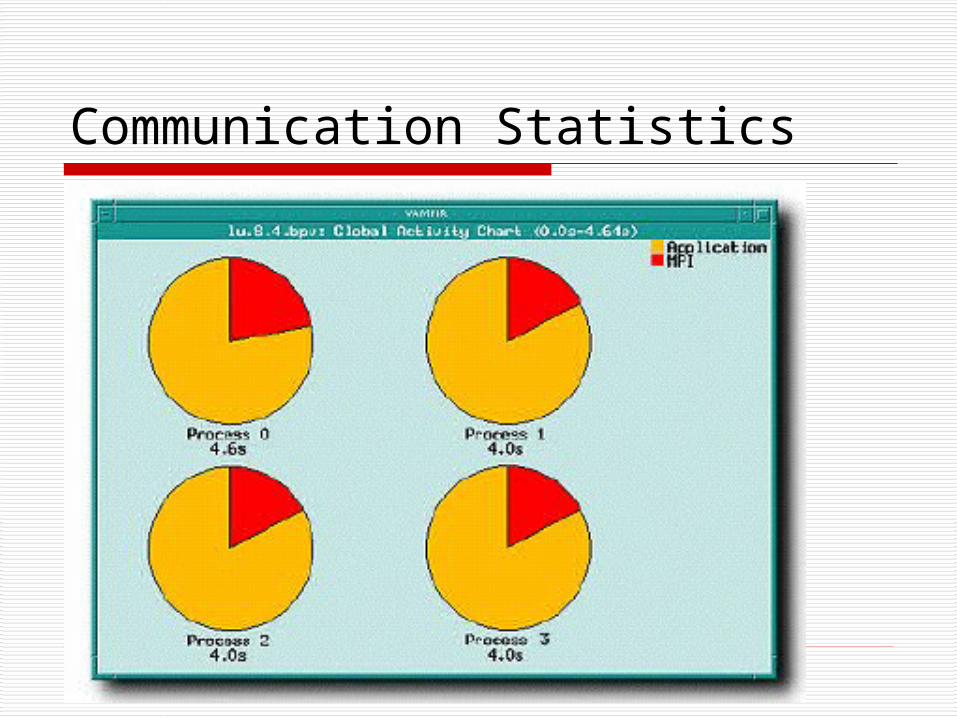
Communication Statistics
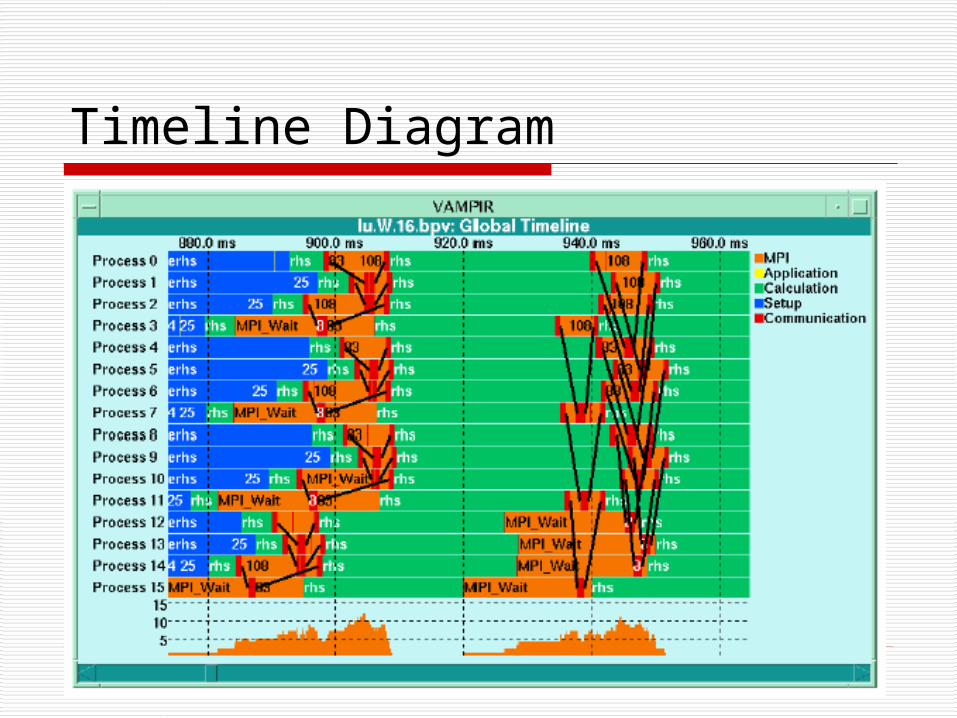
Timeline Diagram
VampirTrace
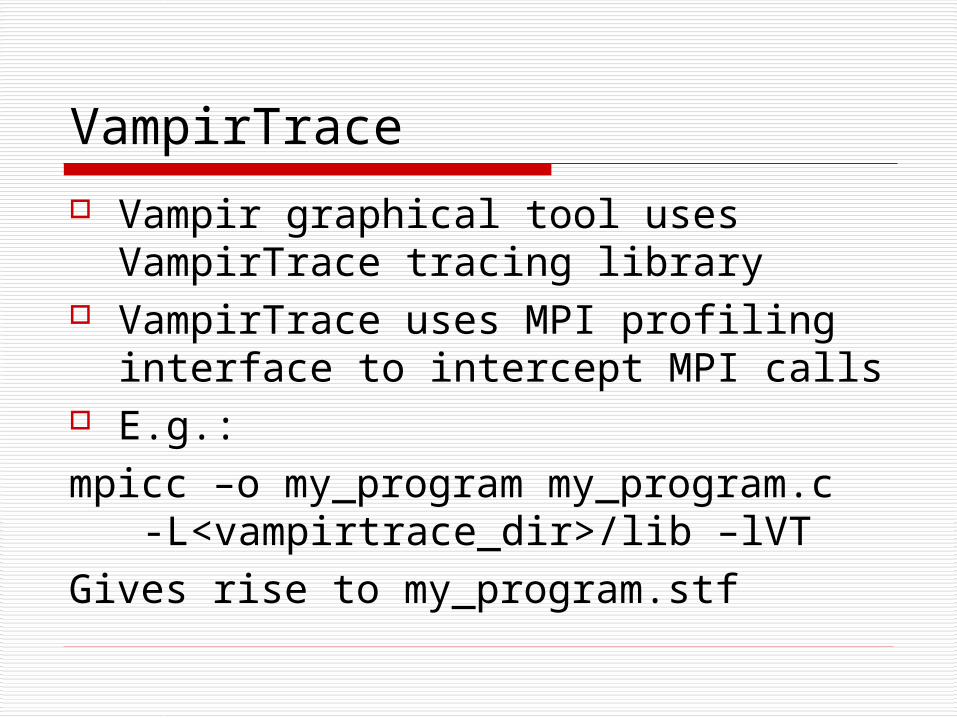
Vampir graphical tool uses VampirTrace tracing library
VampirTrace uses MPI profiling interface to intercept MPI calls
E.g.:mpicc –o my_program my_program.c -
L<vampirtrace_dir>/lib –lVTGives rise to my_program.stf
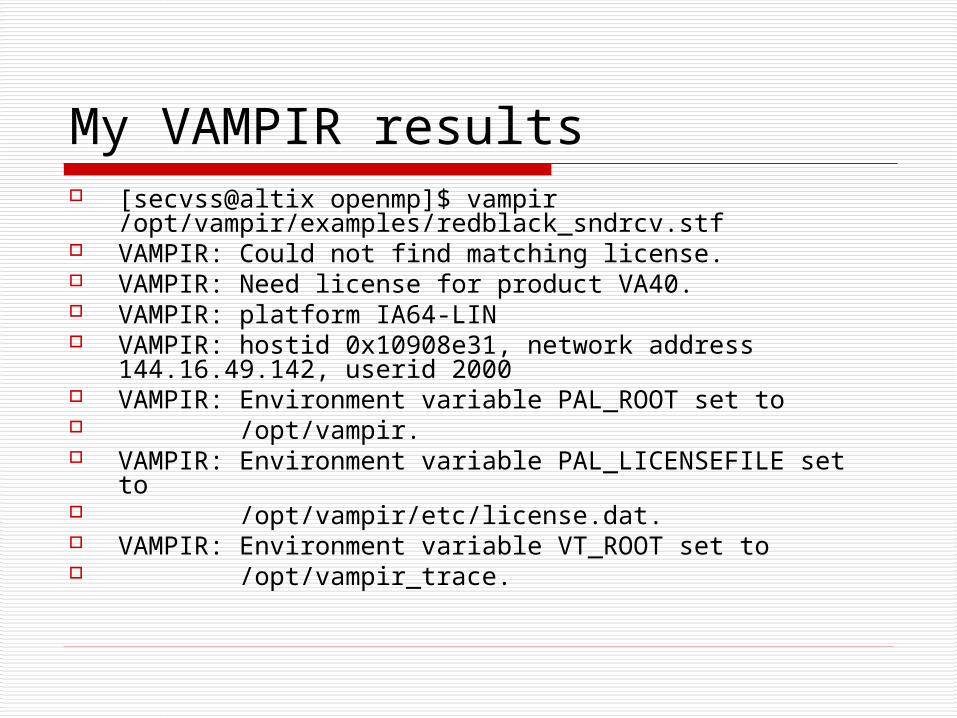
My VAMPIR results [secvss@altix openmp]$ vampir
/opt/vampir/examples/redblack_sndrcv.stf VAMPIR: Could not find matching license. VAMPIR: Need license for product VA40. VAMPIR: platform IA64-LIN VAMPIR: hostid 0x10908e31, network address
144.16.49.142, userid 2000 VAMPIR: Environment variable PAL_ROOT set to /opt/vampir. VAMPIR: Environment variable PAL_LICENSEFILE set to /opt/vampir/etc/license.dat. VAMPIR: Environment variable VT_ROOT set to /opt/vampir_trace.
Some more Parallel Profiling Libraries
GuideView (for OpenMP from Pallas) Upshot / Jumpshot (MPI from Argonne) SvPablo (UIUC for MPI and OpenMP) DynaProf (UT)
Parallel Debugging – TotalView (Etnus)
Source level parallel debugger Multithreaded, multiprogram debugger for
MPI, PVM, OpenMP Examine and change data Can attach to all or some of running
processes Separate window for each process Can change source code while debugging Start/stop execution
TotalView Introduction
Detailed information by diving Computational steering by changing
variable values or by using expressions
Displaying variables across processes/threads
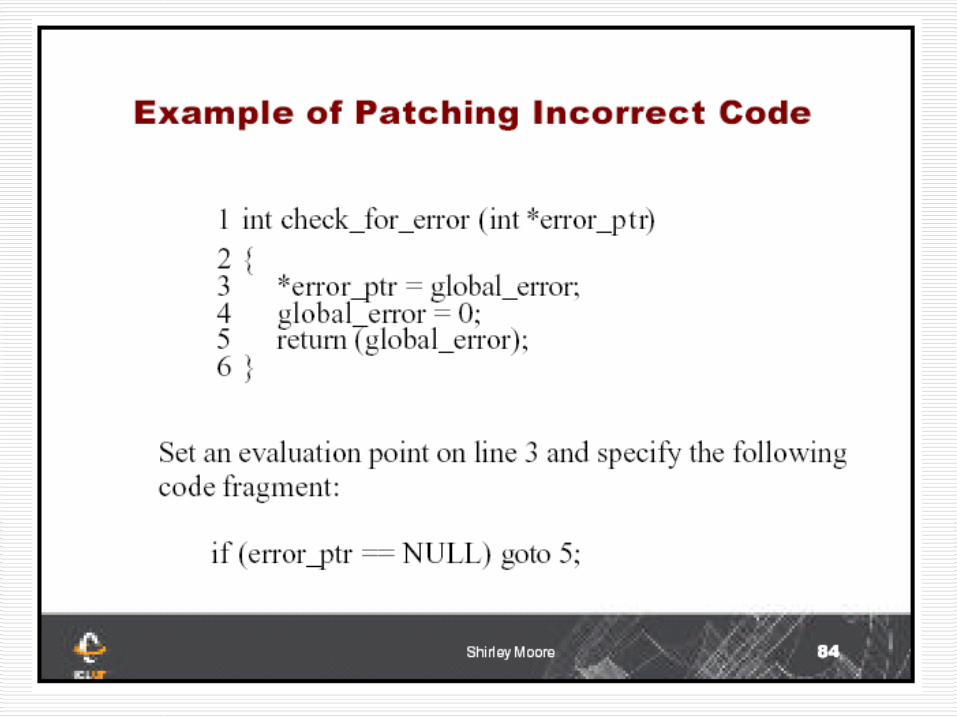
Action Points
Breakpoints Barrier breakpoints Conditional breakpoints Evaluation point Watchpoints
MPI and TotalView
mpirun [ MPICH-arguments ] -tv program [ program-arguments ]
totalview poe -a program [ arguments ] [ PE_arguments ]
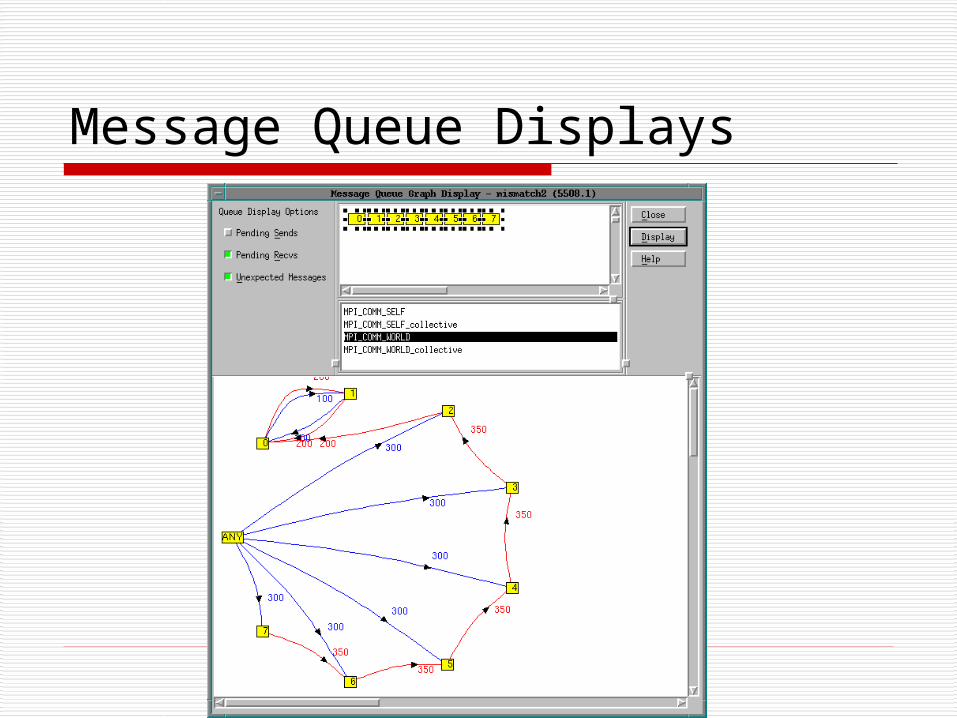
Message Queue Displays
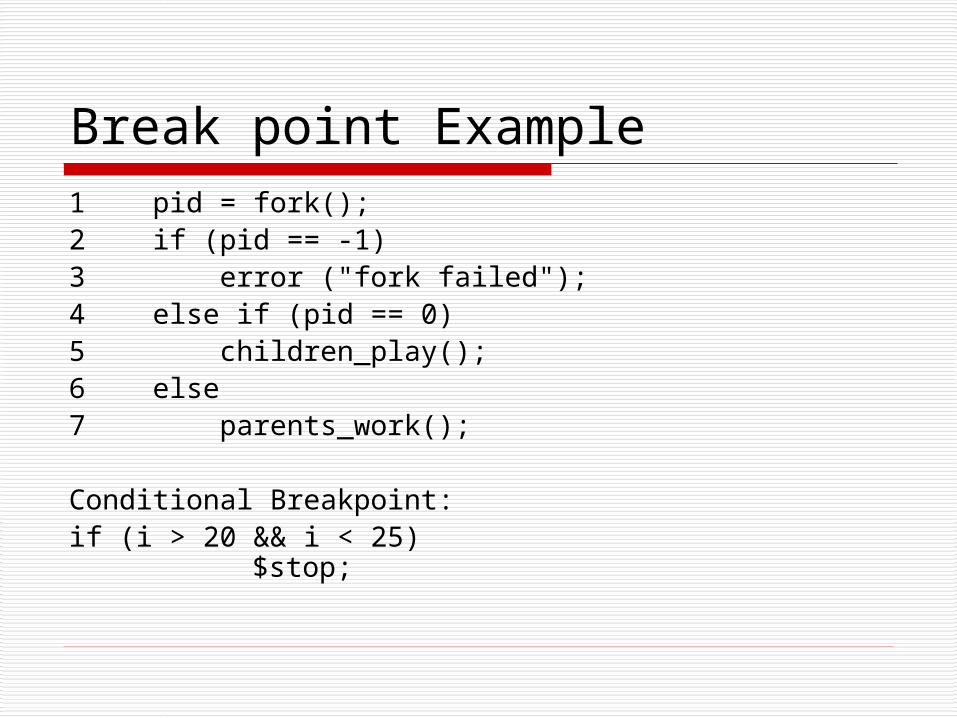
Break point Example1 pid = fork();2 if (pid == -1)3 error ("fork failed");4 else if (pid == 0) 5 children_play();6 else7 parents_work();
Conditional Breakpoint:if (i > 20 && i < 25)
$stop;
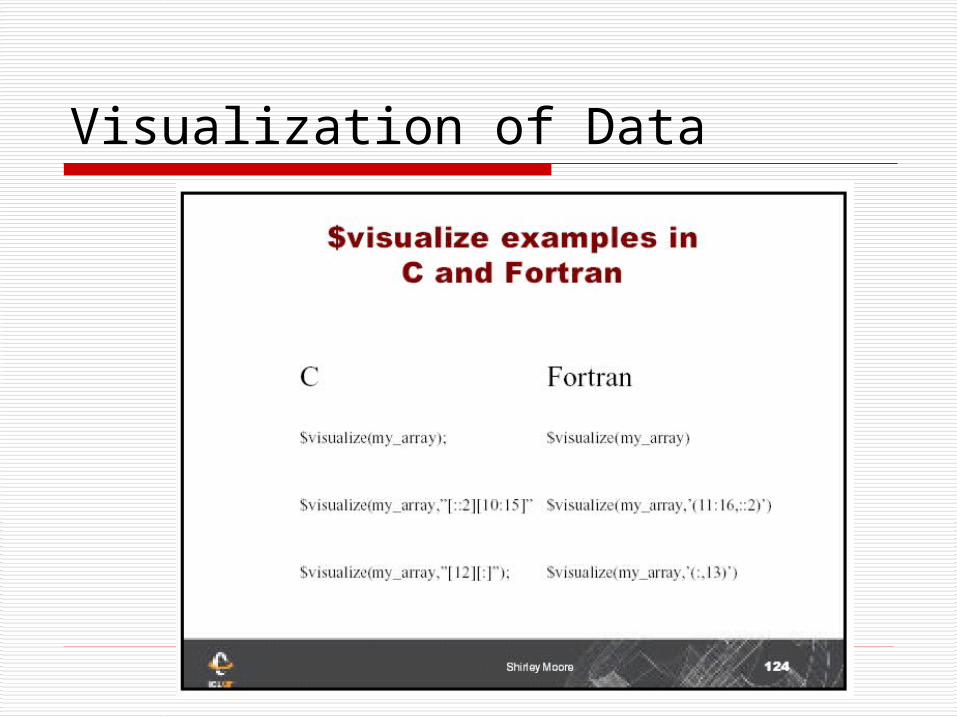
Visualization of Data
Research Areas
Compact representation of trace files Minimize overhead due to tracing
Further Reading
Review of performance analysis tools for MPI programs (www.netlib.org/utk/people/JackDongarra/PAPERS/perftools-review2.pdf)
TotalView Hands-on Exercises(http://www/llnl/gov/computing/tutorials/workshops/workshop/total_view/MAIN.html