
Cost Overruns in Transport Projects - Experiences from - DiVA

SPECIAL ARTICLE
Economic & Political Weekly EPW may 22, 2010 vol xlv no 21 43
Delays and Cost Overruns in Infrastructure Projects: Extent, Causes and Remedies
Ram Singh
I am grateful to T C A Anant, Lee Benham, Neha Jain, J V Meenakshi, Partha Mukhopadhyay, Anusha Nath, Bharat Ramaswami and Rohini Somanathan for their comments and suggestions. Atika Gupta and Nitya Mittal provided excellent research support. Digvijay Negi, Nitin Madan and Pawan Gopalakrishnan provided crucial help in compilation of an extensive dataset. Finally, I thank the Centre for Development Economics for research and institutional support.
Ram Singh ([email protected]) is with the department of economics at the Delhi School of Economics.
This study, based on a large dataset of 894 projects from
17 infrastructure sectors, attempts to answer certain
important questions on time and cost overruns in
publicly-funded infrastructure projects: How common
and how large are the overruns? What are the essential
causes? Are contractual and institutional failures among
the significant causes? What are the policy implications
for planning, development and implementation of
infrastructure projects? Among other results of an
econometric analysis, the study shows that the
contractual and institutional failures are economically
and statistically significant causes behind cost and
time overruns.
1 Introduction
Infrastructure projects in India are infamous for delays and cost overruns. The recently completed Bandra-Worli sea link amply demonstrates the state of project delivery system in
the country. What was planned as a Rs 300 crore project to be completed by 2004 has actually cost Rs 1,600 crore along with a delay of fi ve years. Indeed, very few projects get delivered in time and on cost. The quarterly reports of the Ministry of Statistics and Programme Implementation (MOSPI) stand testimony to a saga of unfettered delays and cost overruns, which have become the hallmark of infrastructure projects in India. Yet, the extent and causes behind these time and cost overruns remain under-studied. As a result, the types of policy interventions required to rectify the malady also remain unidentifi ed.
Delays and cost overruns have signifi cant implications from an economic as well as political point of view. Due to delays in project implementation, people have to wait for the provision of public goods and services longer than is necessary. Services provided by infrastructure projects serve as input for other sectors, and cost overruns in these projects lead to an increase in the capital-output ratio for the entire economy. Simply put, delays and cost overruns reduce the effi ciency of available economic resources, limit the growth potential and reduce the competitiveness of the economy. Moreover, at least as of now, most infrastructure projects in India are funded by taxpayers’ money. Therefore, taxpayers have the right to know how effi ciently their money is being utilised by the offi cials while providing for public goods and services. Indeed, inadequacy of research on the subject is somewhat surprising and refl ects a gross neglect of an important public policy subject.
The absence of comprehensive India centric studies apart, there exists a large body of theoretical and empirical literature on the subject. It suggests that delays and cost overruns are generic to in-frastructure projects and a global phenomenon; India is not an ex-ception. However, the literature also reveals that the underlying causes, and thus the remedies, differ from country to country. There-fore, there is only so much that can be learnt from international experience, further underscoring the need for a systematic India-based study. In any case, as I will demonstrate in Section 3, interna-tional literature is not helpful at all in explaining the nature of de-lays and cost overruns observed in I ndia. In contrast, several works of Indian scholars have made interesting contributions. However, very few of these works are empirical; most of them are case studies. No doubt case studies are very helpful in explaining particular in-stances, but they have a limited capacity to educate us about the intrinsic problems besetting the infrastructure delivery system. In
SPECIAL ARTICLE
may 22, 2010 vol xlv no 21 EPW Economic & Political Weekly44
sum, the main causes behind time and cost overruns in India and their statistical signifi cance have remained unsubstantiated.
Against this backdrop, it is somewhat disquieting that the pri-vatisation of public services is believed to be the only way out. The government machinery is perceived to be incapable of pro-curing and maintaining infrastructure facilities effi ciently. Priva-tisation in the form of public private partnerships (PPPs), in con-trast, is believed to be capable of avoiding delays and cost over-runs. Several commentators and policymakers share this view. It is worth quoting an excerpt of a decision made in a meeting chaired by the prime minister:1
As regards the issue of EPC vs BOT, it was agreed that for ensuring pro-vision of better road services, i e, higher quality of construction and maintenance of roads and completion of projects without cost and time overrun, contracts based on BOT model are inherently superior to the traditional EPC contracts. Accordingly, it was decided that for NHDP Phase-III onwards, all contracts for provisions of road services would be awarded only on BOT basis...
In the above quote the build-operate-transfer (BOT) model i mplies the PPP model. In contrast, publicly-funded projects are executed through engineering, procurement and construction (EPC) contracts, popularly known as item rate contracts. The BOT contracts have been recommended as the preferred means for constructing national highways in various other offi cial reports also.2 In other sectors too there is a tendency to privatise the supply and the management of infrastructure services, ostensibly to overcome the cost and other perceived ineffi ciencies of the public sector, though the nature and extent of privatisation differs from sector to sector.3
This paper, among other things, investigates the underlying causes for time and cost overruns observed in India. The following four features set this study apart. First, it is based on by far the largest dataset on completed projects. The database includes 894 projects completed during April 1992 to March 2009, covering 17 infrastructure sectors. Second, it explores the factors that can t rigger delay and/or cost overruns during the planning, contract-ing and implementation phases of infrastructure projects. Third, it examines the nature of causal relationships regarding time and cost overruns along with their statistical signifi cance. Fourth, it shows that there is simultaneity between delays and cost overruns. Therefore, it uses a simultaneous equations model to study them.
I must hasten to add that despite the above-mentioned distin-guishing features and the generality of the study, it is not meant to be an omniscient account of delays and cost overruns. It has several limitations. For instance, infrastructure sectors are quite different in terms of the project types. Therefore, for each sector there are idiosyncratic factors that can cause delay and cost over-runs. The present study does not explore such factors. This and other limitations are discussed in the following sections. The p aper is organised as follows: Section 2 presents an overview of the delays and cost overruns in infrastructure projects. Section 3 shows that the existing literature is inadequate to explain the time and cost overruns observed in India. Section 4 proposes and analyses various possible factors that can cause delays and cost overruns. The model and regression results are presented in S ection 5. Finally, Section 6 concludes with the fi ndings and p olicy implications.
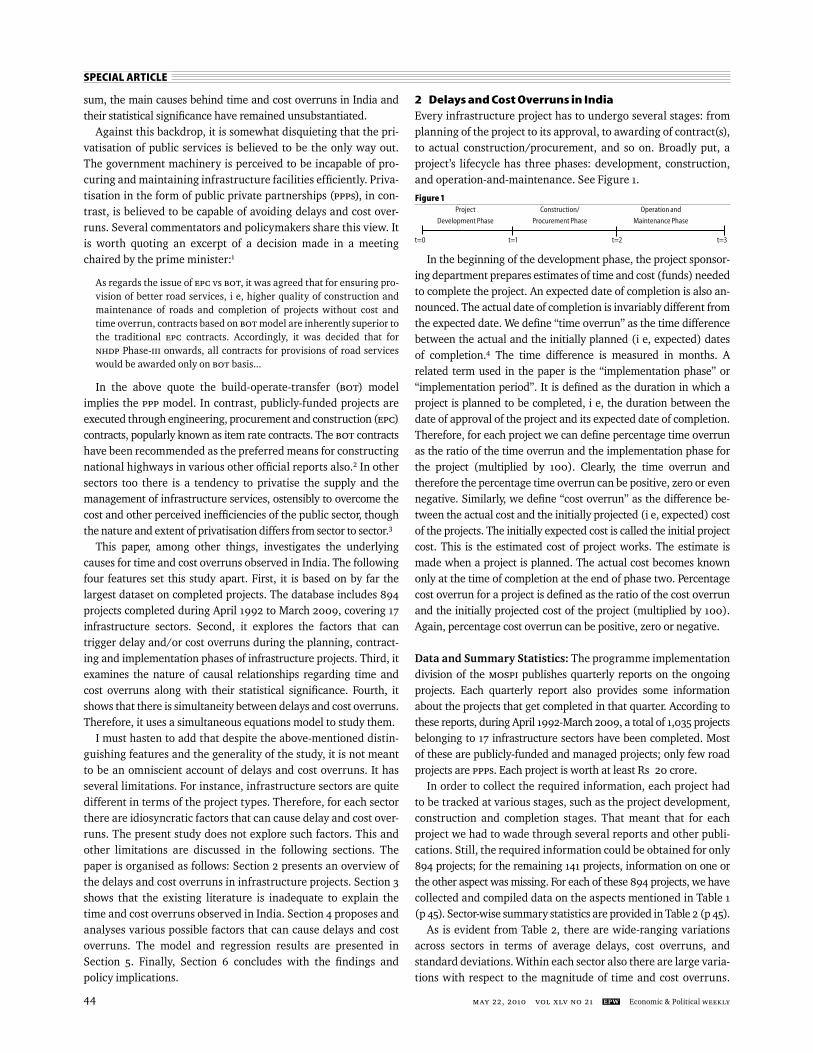
2 Delays and Cost Overruns in IndiaEvery infrastructure project has to undergo several stages: from planning of the project to its approval, to awarding of contract(s), to actual construction/procurement, and so on. Broadly put, a project’s lifecycle has three phases: development, construction, and operation-and-maintenance. See Figure 1.
In the beginning of the development phase, the project sponsor-ing department prepares estimates of time and cost (funds) needed to complete the project. An expected date of completion is also an-nounced. The actual date of completion is invariably different from the expected date. We defi ne “time overrun” as the time difference between the actual and the initially planned (i e, expected) dates of completion.4 The time difference is measured in months. A related term used in the paper is the “implementation phase” or “implementation period”. It is defi ned as the duration in which a project is planned to be completed, i e, the duration between the date of approval of the project and its expected date of completion. Therefore, for each project we can defi ne percentage time overrun as the ratio of the time overrun and the implementation phase for the project (multiplied by 100). Clearly, the time overrun and therefore the percentage time overrun can be positive, zero or even negative. Similarly, we defi ne “cost overrun” as the difference be-tween the actual cost and the initially projected (i e, expected) cost of the projects. The initially expected cost is called the initial project cost. This is the estimated cost of project works. The e stimate is made when a project is planned. The actual cost becomes known only at the time of completion at the end of phase two. Percentage cost overrun for a project is defi ned as the ratio of the cost overrun and the initially projected cost of the project (multiplied by 100). Again, percentage cost overrun can be p ositive, zero or negative.
Data and Summary Statistics: The programme implementation division of the MOSPI publishes quarterly reports on the ongoing projects. Each quarterly report also provides some information about the projects that get completed in that quarter. According to these reports, during April 1992-March 2009, a total of 1,035 projects belonging to 17 infrastructure sectors have been completed. Most of these are publicly-funded and managed projects; only few road projects are PPPs. Each project is worth at least Rs 20 crore.
In order to collect the required information, each project had to be tracked at various stages, such as the project development, construction and completion stages. That meant that for each project we had to wade through several reports and other publi-cations. Still, the required information could be obtained for only 894 projects; for the remaining 141 projects, information on one or the other aspect was missing. For each of these 894 projects, we have c ollected and compiled data on the aspects mentioned in Table 1 (p 45). Sector-wise summary statistics are provided in Table 2 (p 45).
As is evident from Table 2, there are wide-ranging variations across sectors in terms of average delays, cost overruns, and standard deviations. Within each sector also there are large varia-tions with respect to the magnitude of time and cost overruns.
Figure 1 Project Construction/ Operation and
Development Phase Procurement Phase Maintenance Phase
t=0 t=1 t=2 t=3

SPECIAL ARTICLE
Economic & Political Weekly EPW may 22, 2010 vol xlv no 21 45
Similar is the case with respect to the types of activities covered by the projects. Again, projects are quite diverse across as well as within sectors. Yet, projects in road, railways and u rban-develop-ment sectors are more homogeneous – most are construction projects. A majority of projects in civil aviation, shipping and ports, and power sectors also involve construction and related activities. In contrast, in sectors like telecom and atomic energy, a large number of projects are for purchase and/or installation of equip-ment. There are some construction projects too. Similarly, project type in petroleum, petrochemicals and mining, etc, is very hetero-geneous. For analytical convenience, projects have been clubbed in the following fi ve somewhat homogeneous categories: the fi rst category is road, railways and urban development projects, second is civil aviation, shipping and ports, and power projects,
third is telecom and atomic energy, fourth is petroleum and petro-chemicals and fi fth constitutes all other projects. The rationale be-hind this categorisation is provided in Section 4.
Time Pattern of Delays and Cost Overruns: For comparisons to be meaningful it is important to consider d elays and cost over-runs in percentage rather than in absolute terms. Using the above defi nitions, percentage time and cost overruns have been calcu-lated for each project. Graph 1 (p 46) depicts the trend of percent-age time overruns. The percentage time overrun for a project is plotted against the year in which the project started. Similarly, Graph 2 (p 46) shows the movement of percentage cost overruns over the years. Together these graphs show that since the 1980s the offi cial delivery system has somewhat i mproved. The magnitudes
of cost overruns seem to have come down over the years. However, the decline in de-lays is less obvious. Moreover, cost overruns are still too fre-quent and unacceptably large. According to the latest MOSPI report, as on 31 March 2009, more than one-third of the on-going projects are experienc-ing cost overruns. Collectively, cost overruns for these projects are huge at Rs 73,791.51 crore, which is 54.75% of their origi-nal cost and 13.45% of the cost of all projects. From another perspective, the cost overruns in the ongoing projects are larger than the three consecu-tive fi scal packages announced during 2008-09! Similarly, delays are frequent and at
Table 1: Definitions and Data SourcesS No Aspect Description Data Source
1 Date of project start It is the start date of the project MOSPI reports
2 Initial date of commissioning It is the initially planned (i e, expected) date of completion of the project MOSPI reports
3 Actual date of commissioning It is the actual date of completion of the project MOSPI reports
4 Time overrun The time difference (in months) between the actual and the initially planned Our calculations based on the data collected dates of completion from MOSPI reports.
5 Implementation phase The duration in which a project is planned to be completed, i e, the Our calculations based on the data collected from duration between the date of approval of the project and its expected MOSPI reports. date of completion.
6 Pctime overrun (% time overrun) The ratio of the time overrun and the implementation phase for the project Our calculations based on the data collected from (multiplied by 100). MOSPI reports.
7 Initial project cost The initially projected (i e, expected) cost of the project. MOSPI reports
8 Actual project cost The actual cost at the time of completion of the project. MOSPI reports
9 Cost overrun The difference between the actual cost and the initially projected Our calculations based on the data collected from (i e, expected) cost of the project. MOSPI reports.
10 Pccost overrun (% cost overrun) The ratio of the cost overrun and the initially anticipated cost of the project Our calculations based on the data collected from (multiplied by100). MOSPI reports.
11 Timelapse It is the time (in months) that has lapsed since May 1974 to the date of approval Our calculations based on the data collected from of the project. The first project in our dataset was approved in May 1974. MOSPI reports.
12 Sector The infrastructure sector to which the project belongs MOSPI reports
13 State The state in which the project is located. MOSPI reports and publications of the ministry relevant for the sector
Table 2: Summary Statistics: Delays and Cost Overruns in Infrastructure Projects (April 1992-March 2009)
% Cost Overrun % Time Overrun
Sector Number Mean Std Dev % of Projects Mean Std Dev % of Projects Projects with of Projects with Positive with Positive Cost but Not Cost Overrun Time Overrun Time Overrun
Atomic energy 12 15.05 113.12 25.00 301.02 570.48 91.67 8.33
Civil aviation 47 -2.27 40.52 42.55 68.52 58.15 91.49 0.00
Coal 95 -19.90 73.85 22.11 31.05 69.28 61.05 3.16
Fertilisers 16 -12.57 28.92 25.00 26.53 41.80 62.50 12.50
Finance 1 132.91 0 100.00 302.78 0 100.00 0.00
Health and family welfare 2 302.30 92.96 100.00 268.04 208.63 100.00 0.00
I & B 7 14.00 62.97 42.86 206.98 140.57 100.00 0.00
Mines 5 -33.16 20.65 0.00 42.44 36.23 80.00 0.00
Petrochemicals 3 -12.22 25.92 33.33 74.43 3.05 100.00 0.00
Petroleum 123 -16.10 28.96 20.33 37.57 49.60 79.67 2.44
Power 107 51.94 272.50 46.73 33.57 55.15 60.75 5.61
Railways 122 94.84 178.86 82.79 118.08 141.71 98.36 0.00
Road transport and highways 157 15.84 62.46 54.14 50.21 56.86 85.35 6.37
Shipping and ports 61 -1.35 84.35 31.15 118.64 276.79 95.08 1.64
Steel 43 -15.88 47.78 18.60 49.91 60.67 81.40 4.65
Telecommunication 69 -32.09 57.59 15.94 238.24 259.34 91.30 0.00
Urban development 24 12.31 50.27 41.67 66.44 44.58 100.00 0.00
Total 894 15.17 132.27 40.72 79.25 153.51 82.33 3.13I&B stands for Information and Broadcasting.Source: Calculations based on MOSPI data.

SPECIAL ARTICLE
may 22, 2010 vol xlv no 21 EPW Economic & Political Weekly46
times intolerably long. Out of 925 ongoing projects, 445 have al-ready experienced delays.
3 The Literature and the Indian Scenario
The literature on delays and cost overruns is fairly vast. In a s eries of interesting empirical studies covering 20 countries across the fi ve continents, Flyvbjerg, Holm and Buhl (2002, 2003 and 2004) have shown that infrastructure projects often suffer from cost over-runs.5 Merewitz (1973), Kain (1990), Pickrell (1990), Skamris and Flyvbjerg (1997), among others, have also come out with similar fi ndings. In addition, there are numerous case studies depicting the extent and gravity of delays and cost overruns.6 Though these empirical works do not explain why delays and cost overruns occur, the theoretical literature on the subject offers several explanations. For example, Morris and Hough (1987), Arvan and Leite (1990), Gaspar and Leite (1989) and Ganuza (2007) attribute delays and cost overruns to imperfect information and technical constraints. According to these studies, due to imperfect estimation techniques and the lack of data, the estimated and the actual project costs turn out to be different. That is, delays and cost o verruns are claimed to be a manifestation of “honest” mistakes on the part of government offi cials. Another strand of the literature attributes cost escalations to political f actors, i e, to “lying” by politicians (See, for example, Wachs 1989; Kain 1990; Pickrell 1990; Morris 1990; Flyvbjerg, Holm and Buhl 2002; and F lyvbjerg, Holm and Buhl 2004, among others). These studies argue that politicians understate costs and exaggerate b enefi ts in order to make projects saleable.
However, if time and cost overruns are only due to the imper-fect estimation techniques, then one would expect the estimation
errors to be “small” compared to project cost, and unbiased with zero mean, since due to technological constraints, underestima-tion of cost should be as likely as overestimation. As a result, in each sector negative cost overruns should be as frequent as posi-tive cost overruns. Moreover, as more and more projects get im-plemented, the offi cials should be able to learn from past mis-takes and avoid them in future. The e stimation technology should also advance with the passage of time i e, over the years, the institutional capacity of government departments to plan and develop projects should improve, as policymakers move up the learning curve. Therefore, the frequency as well as the magni-tude of delays and cost overruns should come down over time.
As Graphs 1 and 2 show, over the years there has been some decline in the magnitudes of estimation errors only with respect to project cost. To that extent, cost overruns in India seem to have been caused by the technological constraints. Nonetheless, for most sectors the errors for cost estimates are anything but unbiased with zero mean. Moreover, there is no indication of any signifi cant decline in the frequency of delays. Table 2 shows that barring a few sectors, average delays are nowhere close to zero. For most sectors, estima-tion errors for project time have remained biased with large positive mean. Similarly, errors in cost estimates are large and biased. Alto-gether, at least 82% of the projects under study have suffered from either delays or cost overruns. As we discussed earlier, the current situation is no better. Therefore, at least, in the case of India, imper-fect information and technological constraints cannot fully explain the observed delays and cost overruns. Similarly, the theory of “lying” by politicians does not seem to hold the key. In principle, cost overruns do not necessarily imply time overruns; once a project has been approved by the people or their representatives, more funds can be commissioned to ensure timely completion. After all, politi-cians would want to take credit for faster completion of projects.
To sum up, the existing theoretical literature cannot explain the features of delays and cost overruns observed in India. Moreover, it has focused only on the development phase and has totally ignored the relevant factors arising in the implementation phase (Figure 1). As the following section shows, even for the fi rst phase the litera-ture has ignored some crucial underlying causes.
In contrast, several India-focused studies have made limited but interesting contributions. Morris (1990 and 2003), Dalvi (1997), Thomas (2000), Vijayamohanan Pillai and Kannan (2003), Sriraman (2003), Thomsen (2006), Jonston and Santillo (2007), Morris and Pandey (2007) and Raghuram, Bastian and Sundaram (2009), among others, are notable works. According to these studies, delays in land acquisition, shifting of utilities, environmental and inter-ministerial clearances, shortage of funds, litigations over land acquisition and contractual disputes are the major causes behind time and cost overruns in India.7 However, these studies too have some serious limitations. Very few of these are empirical works, and even these have become dated by now. Moreover, rather than studying the completed projects, they have used data for the then ongoing projects (see, for example, Morris 1990, 2003). Therefore, these studies are based on esti-mates, rather than the actual fi gures for the time and cost over-runs. For infrastructure projects, the estimated and the actual fi gures are invariably different; in some cases considerably so.
Graph 1: Patterns of Percentage Time Overruns
2000
1500
1000
500
0
PCTG
TIM
EOVE
RRU
N
1970 1980 1990 2000 2010
Graph 2: Patterns of Percentage Cost Overruns
2500
2000
1500
1000
500
0
1970 1980 1990 2000 2010
PCTG
COST
OVE
RRU
N

SPECIAL ARTICLE
Economic & Political Weekly EPW may 22, 2010 vol xlv no 21 47
4 Possible Causes and Proxies
As has been mentioned before, during the development phase, the project sponsoring department prepares the estimates of project works as well as of the time and the cost (funds) needed to complete the project works. These estimates are approved by the appropri-ate authority in the department. In addition, a project generally requires approval from several other departments.8 In the begin-ning of the next phase, i e, the construction or the implementation phase, a contract is signed between the sponsoring department and a contractor.9 Depending on the context, the contract can be for construction or for procurement of equipment or both. During this second phase, timely completion of the project often requires active cooperation from the sponsoring authority, the contractor(s) and several other departments. Therefore, whether a project can be delivered in time and on cost depends on how well the activities and efforts of the departments involved and the individuals con-cerned are coordinated. In what follows, I discuss what kind of contractual and organisational failures are the major causes of de-lays and cost overruns in India. For the ease of exposition, it is help-ful to divide the set of possible causes into the following subgroups.
4.1 Technical and Natural Factors
The estimation of project time and cost for infrastructure projects is a characteristically complex exercise. Though the e stimation techniques have become better and sophisticated in recent times, they are still imperfect. As work on a project starts, its future un-folds and the authorities along with the contractor become better informed about the specifi c technological and material require-ments of the project works. For example, during the construction phase of a road project, an unexpectedly poor quality of soil may necessitate changes in the engineering, the design and the qual-ity of bitumen required, from what was initially planned. Such changes may require extra time as well as funds. In some cases the actual circumstances, in contrast, may turn out to be favour-able and the parties may fi nd that they had made excessive provi-sions of funds and time. Therefore, due to imperfect estimation and natural factors the actual project time and cost will generally be different from their expected values.
However, one would expect the effects of the technical and natural factors to be random without any bias. Also, due to the above-discussed learning-by-doing among offi cials, both the delay and the cost overrun would be expected to come down over the years. Therefore, if the decline in the delays and cost overruns over the years turns out to be statistically signifi cant, we can at-tribute some of the delays and cost overruns to the technical and natural constraints. To confi rm whether this is the case, for each project we have calculated the TIMELAPSE. It is the time that has lapsed since May 1974 to the date of approval of the project. The fi rst project in our dataset was approved in May 1974. Ceteris paribus, the longer the TIMELAPSE for a project, the lower should be the time and cost overruns. However, as offi cials move up the learning curve, the effects of learning and its effi cacy in reducing delays and cost overruns will come down. By the same account, the effects of policy i nterventions are expected to decline over time. Therefore, starting from the mid-1970s, percentage delays and cost overruns are expected to have come down over time, but
at a “decreasing rate”. Formally, the variable TIMELAPSE is ex-pected to have a quadratic relation with time and cost overruns.
4.2 Contractual Failures
As discussed before, the construction phase of an infrastructure project starts with signing of a construction/procurement con-tract. In terms of Figure 1, the contract is signed between the au-thority (employer) and the contractor at date t=1. It specifi es the works that are to be performed, or the good that is to be delivered by the contractor. The degree of precision in this initial contract has direct implications for cost overruns. Suppose the initial con-tract is contingency-complete in that it fully specifi es all the works that are to be carried out in each possible contingency that may arise during the construction phase. Under such a contract, cost overruns can be avoided altogether. Moreover, the contract price can be fi xed or can be contingency-specifi c. In either case, the parties’ obligations have already been spelt out fully. No “ad-ditional” payment is required to be made by either party. In fact, delays on the part of the contractor can also be avoided with the help of suitable penalty clauses. Therefore, in principle, com-plete-contingent-contracts can ensure that a project is completed in time and within (contingency-specifi c) budget.
In reality, the initial contract can never be complete. Parties cannot predict every possible scenario that may unfold during the construction phase. For example, in a railways project, depending on the local conditions it may become necessary to have more of manned-crossings or railway-over-bridges than were initially in-tended. The bounded rationality of the parties along with imper-fect forecasting techniques makes it impossible to specify every contingency and the relevant tasks to the last details. As a result, the initial contract leaves out several project works. This is espe-cially true of infrastructure projects, which are inherently complex and have a long building phase. Formally speaking, the initial con-tracts for infrastructure projects are intrinsically “incomplete”.
The contractual incompleteness is expected to increase with the project size, since bigger projects involve more works and are generally more complex compared to smaller ones. There-fore, the resulting cost overruns are also expected to grow with the project size. The initially expected project cost (INITIALCOST) is a good measure of project size, its complexity, and hence of the contractual incompleteness.10 So, cost overruns are also ex-pected to swell with the INITIALCOST, at least in absolute terms. But, what can we say about the percentage cost overruns across projects? For a given degree of contractual incompleteness, per-centage cost overruns need not increase with the project size.11
However, if project planning is poor, cost overruns can increase with project size not only in absolute but also in percentage terms. To see why, fi rst of all note that the initial contract can be made more or less incomplete by the parties involved. If the project is poorly planned, estimates of project time and cost will be vague and so will be the initial contract. As a result, many additional works will become necessary later on, leading to high cost over-runs. To sum up, if project planning is sloppy, the greater the project size and its complexity, the higher will be the proportion of project works that gets left out of the initial contract, and the larger will be the cost overruns.

SPECIAL ARTICLE
may 22, 2010 vol xlv no 21 EPW Economic & Political Weekly48
Project planning processes in India are infamous for their ad hoc and shoddy approach. Detailed project reports (DPRs) as well as feasibility reports are sloppy and vague, prepared only for the sake of formality.12 This problem is further exacerbated by the use of unit-price EPC contracts. Under these contracts neither the offi cials nor the contractors fi nd it worth haggling over work details.13 On this count also, contractual incompleteness in-creases with project size.
Yet another aspect of infrastructure projects suggests itself as a proxy for the size. It is the implementation phase or I MPLPHASE
for short, the duration in which the project is initially planned to be completed. Intuitively, the implementation phase should increase with the project size. If so, the initial project cost and the implementation phase should be highly correlated. It is instructive to note that in our dataset these two variables are not correlated at all – correlation coeffi cient is just 0.067! There can be at least two reasons for this lack of correlation. Maybe it is yet another manifestation of poor project planning in India. But, it could well be due to the large heterogeneity in terms of the project types. Many projects in our dataset are for purchase/procurement of machines and equipment. For such projects, there is no reason for IMPLPHASE to increase in proportion to the project cost (i e, with the cost of the equipment). To that extent the I MPLPHASE perhaps is not a very good indicator of the (money) size of the project. So, the weak correlation is not surprising.
Plausibly, any increase in complexity of the project as well as the number of construction works should entail an increase in the IMPLPHASE for the project. That is, the IMPLPHASE appears to be a very good indicator of the complexity and the quantum of project works. Therefore, it is a good proxy for the incomplete-ness of the initial contract. Also, note that the above arguments regarding the implications of poor project planning are more per-tinent for complex projects, such as construction related projects, than for simple procurement projects which involve purchase of standard machines and equipment. It is worth emphasising that the proxy INITIALCOST does not make this crucial distinction. Besides, uncertainties related to the appropriateness of initially planned works naturally increase with time. Therefore, poor planning and undue increase in I MPLPHASE can cause excessive cost overruns by necessitating many more changes during the construction phase. To sum up, between the INITIALCOST and the IMPLPHASE, the latter a ppears to be a better and direct indicator of contractual i ncompleteness as well as of the contractual failures.
But, what is the nature of relationship between the INITIALCOST
and IMPLPHASE, on one hand, and delays, on the other? The above discussion suggests that an increase in IMPLPHASE may lead to longer delays. However, ceteris paribus, projects with longer IMPLPHASE have already got more time to complete project works than projects with shorter duration. Moreover, longer I MPLPHASE
projects have greater fl exibility for accommodating additional works. Therefore, they should show relatively smaller percentage
Non-Tax Sources in India:Issues in Pricing and Delivery of ServicesMahesh C. Purohit, Director, Foundation for Pub Econ & Policy Research.Vishnu Kanta Purohit, Asso. Prof. I P College, Univ. of Delhi, Delhi. Contents: Introduction / Fiscal Signifi cance of States’ Own Non-tax Sources / Pricing Strategy for Non-tax Sources / Revenue Realization from Non-tax Sources / Rationalising Structure of Non-tax Sources / Procedural Reforms and Issues in Delivery of Services/ Issues and Policy Imperatives / Annexure / References / Index First attempt to analyse the structure of non-tax sources of Indian States with emphasis on pricing and delivery of services. Presents a detailed analysis of ten select services drawn from general, social and economic services. The analysis of User Charges and Recovery Rate (RR) at disaggregated level for each of the services in different States for two points of time is based on the data drawn from the State Budget documents. Adopts a normative approach using panel data models. Recommends policy imperatives.
2010 / 221 pages / Rs.700 /US$ 50 /cloth
Health Care System in India:Towards Measuring Effi ciency in Delivery of ServicesBrijesh C Purohit, Professor, Madras School of Economics, Chennai.Contents: The Issues/Measurement of Effi ciency in Health Care / Model for Estimating Effi ciency / Effi ciency in Health Care: Macro Level Analysis/ Effi ciency in Health Care at Sub-National Level / Summary of Conclusions and Policy Imperatives / References / Index The book is a very useful attempt at applying quantitative techniques to measure effi ciency in delivery of health services in India. Using both panel data and cross section data it presents...a comparative analysis of effi ciency at national, state (14 select states), and district level (5 select states). Puts forth policy imperatives for a better health care system in India.…“a comprehensive resource material on availability and scope of statistical and econometric methods that can be applied to secondary datasets which are available to a researcher seeking to apply standard notions of economic effi ciency to the India health care system”. …The discerning reader would gain by obtaining a holistic and richer picture of the health care system in India. (Excerpts of the Review in Business Standard, dated 12th May 2010).
2010 / 187 pages / Rs. 600 / US$ 45 / cloth
Books from Gayatri Books from Gayatri
PLEASE NOTE: No postage would be charged for sending books by registered post for direct orders sent to us. A special discount of 10 percent of the price of the book would be allowed to academic staff and researchers. Please send orders along with bank draft drawn in favour of Gayatri Publications to the address given below:
Gayatri Publications, 13 MIG, Phase Four, Ashok Vihar, Delhi-110052Phone: 27305008 Fax: 27302802 e-mail: [email protected]
website: www.gayatri-publications.com
SPECIAL ARTICLE
Economic & Political Weekly EPW may 22, 2010 vol xlv no 21 49
of time overruns. For instance, between the two same-type and same-cost projects, the one with the longer I MPLPHASE should show lower time overrun. Therefore, ceteris paribus, we expect the percentage time overrun to come down as implementation phase increases. Similarly, it seems plausible to expect the absolute time overrun to increase with initial cost, but, ceteris paribus, there is no reason to expect time overrun to increase in percentage terms.
4.3 Organisational or Institutional Failures
As argued above, execution of infrastructure projects requires active cooperation of several departments within as well as among various ministries. Government departments are hierar-chical organisations. A large body of literature shows that there is a confl ict between the individual and the organisational objec-tives at every stage of the hierarchy. As a result, hierarchical or-ganisations are inherently weak in inducing the desired efforts from the people involved.14 This is especially true of government organisations. Therefore, infrastructure projects have to face the consequences of organisational failures within the sponsoring ministry itself. In India, different departments are responsible for different project activities. For example, project implementation, shifting of power lines, water lines, sewer lines, cutting of trees, environmental clearances and other such activities are performed by different departments. Execution of these activities is highly dependent on joint and timely efforts of the departments involved. However, interdependence of efforts means that it is easy for de-partments to shirk responsibility and pass the blame on to others. So, in addition to intra-organisational f ailures, infrastructure projects in India are vulnerable to inter- organisation failures. Several reports, including the offi cial ones, corroborate our claims.15
But how can we measure the implications of these failures?Since most projects in road, railways and urban development
are construction projects, these generally require environmental clearance from the central as well as the state agencies. Moreover, compared to those in the other sectors, these projects require much more active cooperation of several departments for land/property acquisition, shifting of power lines, water lines, sewer lines, approval of under or over-passes, etc. Laxity on the part of just one department or dereliction of duty by a few offi cials can hold up the entire project. Hence these projects are highly vulnerable to delays caused by all kinds of organisational failures. The same is the case with projects in civil aviation, shipping and ports, and power sectors, though to a lesser extent. A majority of projects in these sectors too involve con-struction or setting up of network points. In several cases, ecologi-cally sensitive land has to be acquired. This means more regula-tions and increased vulnerability to inter-organisational failures.16
However, if organisational failures mentioned here are a major underlying cause for delays, then compared to other sectors, projects in road, railways, urban development, civil aviation, shipping and ports, and power sectors should exhibit longer time overruns. To test this hypothesis, we introduce dummy variables DRRU for road, railways and urban-development projects, and DCSPP for projects in civil aviation, shipping and ports, and power sectors. In view of our arguments, dummy variables DRRU and D CSPP can serve as proxies of organisation failures. As argued earlier, road, railways and urban development sectors are more homogeneous and initial
contracts for projects in these sectors are more incomplete than is the case with projects in civil aviation, shipping and ports, and power sectors. That is why separate dummies have been used.
In what follows, I will show that delays regardless of their source are a major and statistically signifi cant cause of cost overruns. This implies that the organisational failures also cause cost over-runs through delays. They may have a direct effect too. Every department involved in project planning and implementation can suggest changes in project works, and hence can contribute to cost escalations.
Similarly, if a project spans across more than one state, it has to deal with the concerned departments in each state. Therefore, projects spanning across multiple states seem more susceptible to interorganisational failures. To test this hypothesis, we introduce another dummy variable called DSTATES.
To sum up, if organisational failures are a signifi cant cause of delays and cost overruns, then multistate, road, railways and u rban development, civil aviation, shipping and ports, and power sector projects should exhibit relatively long delays and high cost overruns.
One may be tempted to apply the above arguments regarding delays and cost overruns to some other sectors too, like telecom and atomic energy, petroleum and petrochemicals, mines, etc. However, several projects in these sectors involve purchase of machinery and equipment. Such projects do not have to suffer from the above organisational failures. We will use dummies DTA for telecom and atomic energy projects, and DPP for petroleum and petrochemical sector projects, respectively.
4.4 Time Overruns
Logically, any delay in implementation in itself should cause cost overrun for the project. This should happen simply on account of infl ation. In most cases, initial cost estimates are arrived at using the current input prices. If there are delays, inputs will become more expensive and, in turn, will cause an increase in the project cost. Moreover, certain overhead costs have to be met as long as the project remains incomplete. Delays should increase these costs also. Also, a long delay may cause depreciation of project assets, necessitating expenses on repairs or r eplacements. This means that in addition to the above factors, time overrun on account of any other factor is also an underlying cause for cost overruns.
4.5 Economic Factors
Each project is located in some state(s). Several departments of the concerned state government play a rather crucial role in project implementation. After all, activities like land acquisition, shifting of utilities, etc, are performed by the concerned state government. Moreover, economic and geographical features of the state may affect the project time and costs. For example, it is easier to exe-cute projects in a state that has better transport, power and tele-communication infrastructure in place. Generally, richer states are said to possess superior infrastructure. In contrast, due to law and order as well as diffi cult terrain, project implementation is likely to be diffi cult in the north-eastern states and in Jammu and Kashmir. To check the statistical validity of these conjectures, states have been clubbed into four categories. The fi ve richest states, in terms of per capita income, are grouped together.17 These are
SPECIAL ARTICLE
may 22, 2010 vol xlv no 21 EPW Economic & Political Weekly50
Haryana, Punjab, Delhi, Gujarat and M aharashtra. We have used dummy DMRICH for these states. In the next category, we have four southern states: Andhra Pradesh, Karnataka, Kerala and Tamil Nadu. These states have above average per capita gross state domestic product and are considered to be better governed. For these the dummy used is DRICH. In the third c ategory we have the north-eastern states and Jammu and Kashmir with dummy DNE.
5 A Simultaneous Equation Model and Results
The arguments in the previous section show that several factors cause delays and at the same time cost overruns. Such a scenario warrants the use of a simultaneous equation model in which the time and cost overruns are endogenous variables, jointly depend-ent on the explanatory variables introduced in the previous sec-tion. But, the relationship between the time overrun and the cost overrun for a project needs to be discussed further. As argued in Section 4, any delay in implementation in itself will cause cost overrun for the project. This means that “time overrun”, among others, is an explanatory variable for “cost overrun”. In contrast, cost overrun per se does not imply time overrun. Suppose there is an increase in project cost due to infl ation. There is no reason why such a cost overrun per se should lead to a delay in the im-plementation.18 Moreover, time overrun also manifests the un-derlying effect of several factors not considered above, for exam-ple, delays on the part of the contractor, etc. These factors also cause cost overrun through time overrun. So, for our purpose the relevant model is the following simultaneous equation model.
PCTIMEOVERRUNt = 0 + 1TIMELAPSEt + 2TIMELAPSE2
t + 3INITIALCOSTt + 4IMPLPHASEt + 5DRRUt + 6DCSPPt + 7DTAt + 8DPPt + 9 DSTATESt + 10DMRICHt +11DRICHt + 12DNEt + lt ...(1)
PCCOSTOVERRUNt = o + 1TIMELAPSEt + 2TIMELAPSE2t +3
INITIALCOSTt + 4IMPLPPHASE + 5DRRUt + 6DCSPPt + 7DTAt + 8DPPt + 9DSTATESt + 10DMRICHt + 11DRICHt 12DNEt + 13 PCTIMEOVERRUN +2t ...(2)
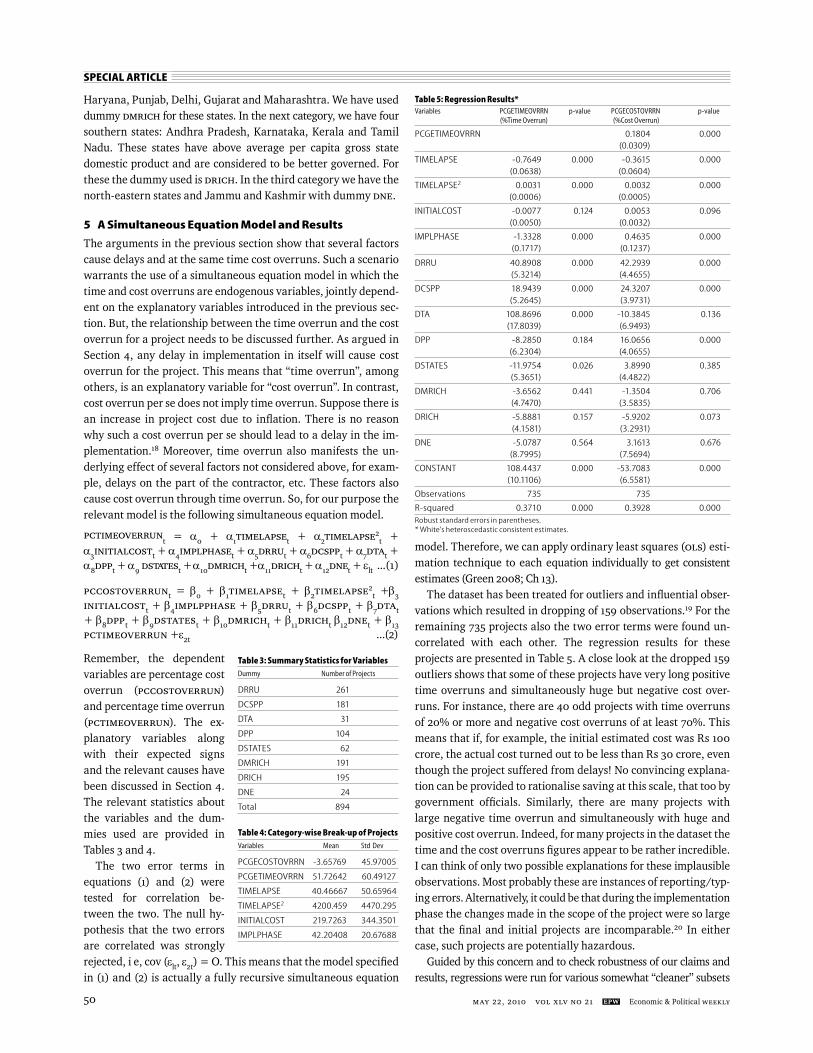
Remember, the dependent variables are percentage cost overrun (PCCOSTOVERRUN) and percentage time overrun (PCTIMEOVERRUN). The ex-planatory variables along with their expected signs and the relevant causes have been discussed in Section 4. The relevant statistics about the variables and the dum-mies used are provided in Tables 3 and 4.
The two error terms in equations (1) and (2) were tested for correlation be-tween the two. The null hy-pothesis that the two errors are correlated was strongly rejected, i e, cov (lt, 2t) = O. This means that the model specifi ed in (1) and (2) is actually a fully recursive s imultaneous equation
model. Therefore, we can apply ordinary least squares (OLS) esti-mation technique to each equation individually to get consistent estimates (Green 2008; Ch 13).
The dataset has been treated for outliers and infl uential obser-vations which resulted in dropping of 159 observations.19 For the remaining 735 projects also the two error terms were found un-correlated with each other. The regression results for these projects are presented in Table 5. A close look at the dropped 159 outliers shows that some of these projects have very long positive time overruns and simultaneously huge but negative cost over-runs. For instance, there are 40 odd projects with time overruns of 20% or more and negative cost overruns of at least 70%. This means that if, for example, the initial estimated cost was Rs 100 crore, the actual cost turned out to be less than Rs 30 crore, even though the project s uffered from delays! No convincing explana-tion can be p rovided to rationalise saving at this scale, that too by g overnment o ffi cials. Similarly, there are many projects with large negative time overrun and simultaneously with huge and p ositive cost overrun. Indeed, for many projects in the dataset the time and the cost overruns fi gures appear to be rather i ncredible. I can think of only two possible explanations for these implausible observations. Most probably these are i nstances of reporting/typ-ing errors. Alternatively, it could be that during the i mplementation phase the changes made in the scope of the project were so large that the fi nal and initial projects are i ncomparable.20 In either case, such projects are potentially hazardous.
Guided by this concern and to check robustness of our claims and results, regressions were run for various somewhat “cleaner” subsets
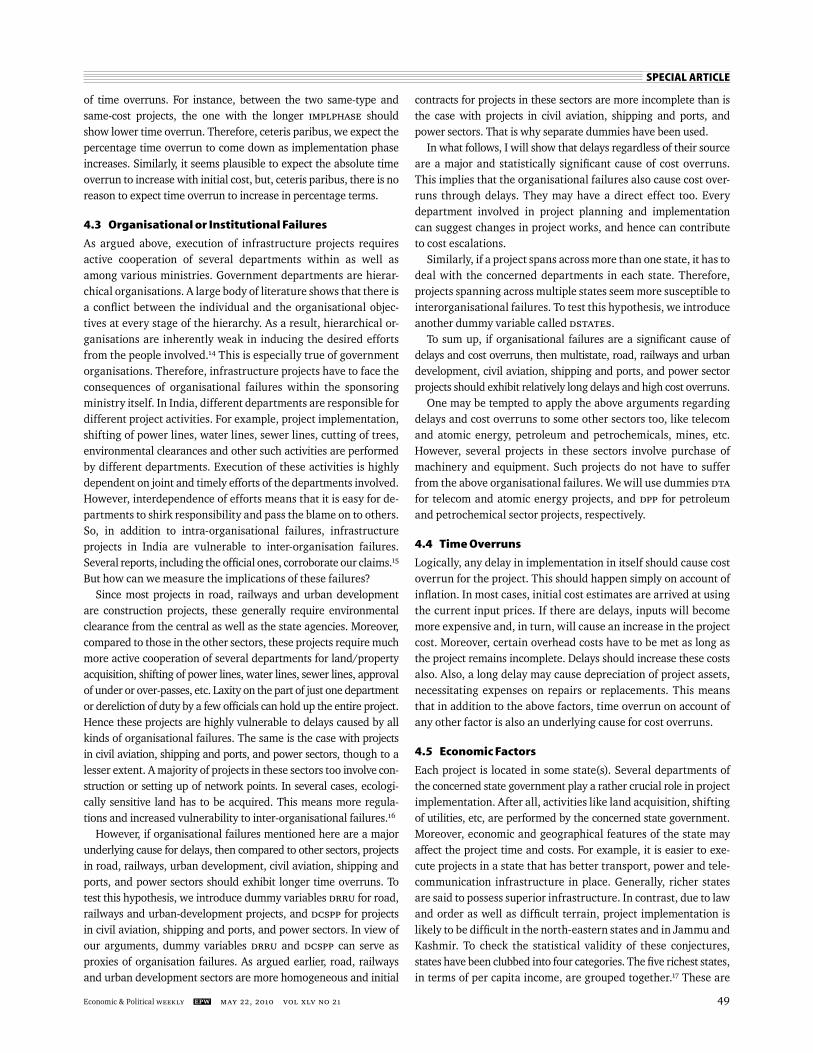
Table 5: Regression Results* Variables PCGETIMEOVRRN p-value PCGECOSTOVRRN p-value (%Time Overrun) (%Cost Overrun)
PCGETIMEOVRRN 0.1804 0.000 (0.0309)
TIMELAPSE -0.7649 0.000 -0.3615 0.000 (0.0638) (0.0604)
TIMELAPSE2 0.0031 0.000 0.0032 0.000 (0.0006) (0.0005)
INITIALCOST -0.0077 0.124 0.0053 0.096 (0.0050) (0.0032)
IMPLPHASE -1.3328 0.000 0.4635 0.000 (0.1717) (0.1237)
DRRU 40.8908 0.000 42.2939 0.000 (5.3214) (4.4655)
DCSPP 18.9439 0.000 24.3207 0.000 (5.2645) (3.9731)
DTA 108.8696 0.000 -10.3845 0.136 (17.8039) (6.9493)
DPP -8.2850 0.184 16.0656 0.000 (6.2304) (4.0655)
DSTATES -11.9754 0.026 3.8990 0.385 (5.3651) (4.4822)
DMRICH -3.6562 0.441 -1.3504 0.706 (4.7470) (3.5835)
DRICH -5.8881 0.157 -5.9202 0.073 (4.1581) (3.2931)
DNE -5.0787 0.564 3.1613 0.676 (8.7995) (7.5694)
CONSTANT 108.4437 0.000 -53.7083 0.000 (10.1106) (6.5581)
Observations 735 735
R-squared 0.3710 0.000 0.3928 0.000Robust standard errors in parentheses.* White’s heteroscedastic consistent estimates.
Table 3: Summary Statistics for VariablesDummy Number of Projects
DRRU 261
DCSPP 181
DTA 31
DPP 104
DSTATES 62
DMRICH 191
DRICH 195
DNE 24
Total 894
Table 4: Category-wise Break-up of ProjectsVariables Mean Std Dev
PCGECOSTOVRRN -3.65769 45.97005
PCGETIMEOVRRN 51.72642 60.49127
TIMELAPSE 40.46667 50.65964
TIMELAPSE2 4200.459 4470.295
INITIALCOST 219.7263 344.3501
IMPLPHASE 42.20408 20.67688

SPECIAL ARTICLE
Economic & Political Weekly EPW may 22, 2010 vol xlv no 21 51
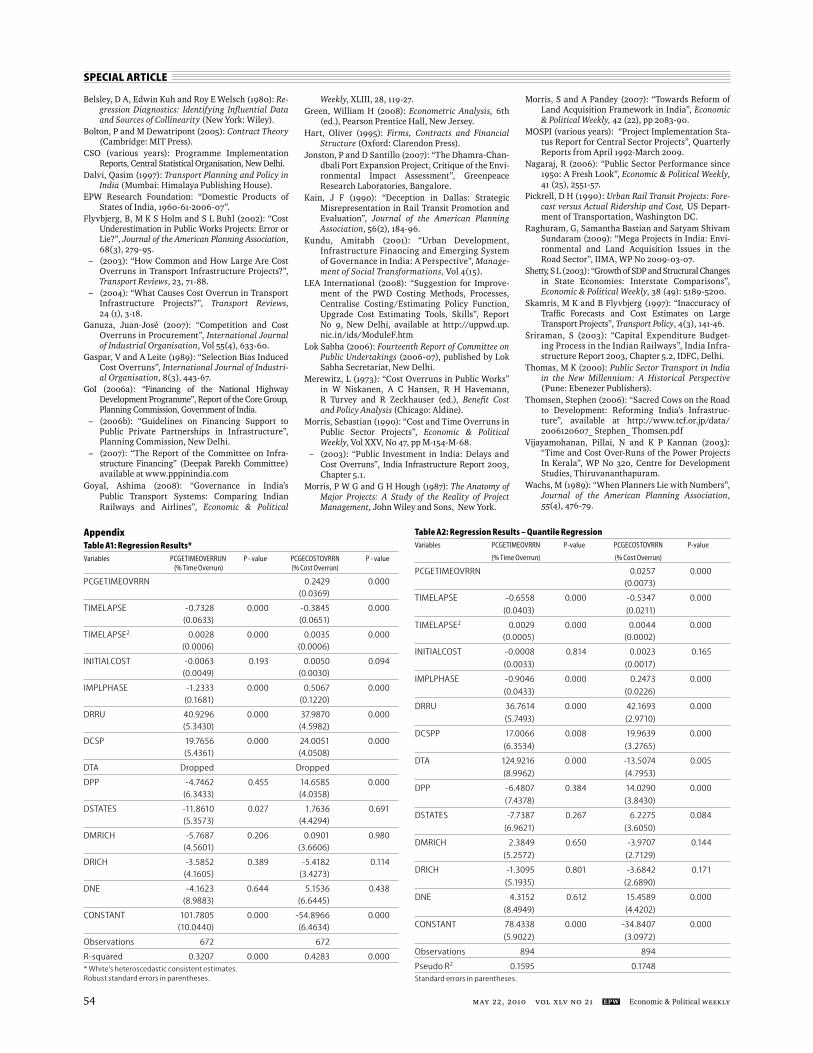
of the entire dataset. Table A1 (p 54) in the Appendix provides the best linear unbiased estimates (BLUE) for the subset reached at by dropping all the projects with time overruns of 40% and more, such as 50%, etc, and at the same time with cost overrun of – 40% and less, such as – 45%, etc.21 Besides, estimates were checked with various thresholds of less than as well as greater than the 40% limits. The results are very similar to those in Table A1.22 Only the signifi -cance level for INITIALCOST shows small variations. This outcome is not surprising since most of the p roblematic projects are outliers and get dropped anyway. Moreover, results for the entire dataset of 894 projects are reported in Table A2 (p 54) in the Appendix. Since the entire set has many outliers, a quantile regression is used for this set. Compared to OLS, the quantile r egression is less vulnerable to the effects of outliers. Results in T able A1 and Table A2 are very similar to those reported in Table 5, with respect to the major hypotheses presented in S ection 4. Also, the coeffi cients of the variables are robust to the presence or absence of the dummies. Therefore, we can afford to be confi dent about the fi ndings.
Most of our hypotheses have turned out to be correct. For all regressions, the trend variable TIMELAPSE has a negative coeffi -cient and is extremely signifi cant at 1% for time as well as cost overrun equations. Besides, in both the equations, the coeffi cient of TIMELAPSE2 is positive and signifi cant at 1%. These results im-ply that the downward trends for percentage time and cost over-runs are statistically signifi cant. Moreover, as predicted, the TIMELAPSE variable has a U-shape effect on d elays and cost over-runs. The coeffi cient of INTIALCOST in equation (2) is positive and signifi cant at 10%, though the signifi cance level is somewhat sen-sitive to the presence/absence of outliers and the “implausible” fi gures discussed above. But, the variable continues to have ex-planatory power. However, the coeffi cient of IMPLPHASE in equa-tion (2) is positive and exceedingly signifi cant at 1%. This means as implementation phase increases, cost overruns soar up not only in absolute terms but also in percentage terms. As predicted in Section 4, IMPLPHASE is a better proxy for contractual failures. These r esults also confi rm our claim that poor project planning and the resulting contractual failures are statistically signifi cant causes behind cost overruns observed in India. For equation (1), as expected, the coeffi cient of IMPLPHASE is negative and highly s ignifi cant at 1%. The coeffi cient of INTIALCOST is negative but insignifi cant. Therefore, as explained in Section 4, the main ef-fect of the sloppy planning and contractual failures is to increase cost overruns; they do not matter that much for time overruns.23
As predicted, time overrun is one of the important factors be-hind cost overruns; the coeffi cient of PCTGTIMEOVERRUN is p ositive and extremely signifi cant at 1% in all the regressions run. In every regression, the proxies for organisational failures – DRRU and DCSPP – have come out to be positive and extremely signifi cant for delays as well as cost overruns. That is, ceteris paribus, the road, railways, urban development projects have ex-perienced relatively high percentage of time and cost overruns. The same is the case with civil aviation, shipping and ports, and power sector projects. The signifi cance level of the dummy DSTATE is not robust to regression techniques and across various datasets used. As expected, dummies DTA and DPP have not shown any consistency regarding the delays. Compared to the
residual category, petroleum and petrochemical sector projects have experienced higher cost overruns. However, given the level of heterogeneity of these sectors, one should not read too much into these results. Indeed, as T able A1 shows, telecom and atomic energy projects are either o utliers or have unreasonable fi gures.
As far as the relative performance of the states is concerned, there are no signifi cant variations across regions. Yet, the s outhern states seem to have performed better than the rest. Projects in these states have experienced slightly smaller cost overruns. The performance of north-eastern states and Jammu and K ashmir is neither signifi cantly nor consistently worse than the other regions.
Before concluding, let me make an observation. As Table 2 shows, most projects suffering from cost overrun have experienced de-lays. In contrast, there are a number of projects with d elays but no cost overruns. In view of our arguments on time overruns versus cost overruns, these fi gures are somewhat puzzling. It ap-pears that these paradoxical fi gures are a result of somewhat dif-ferent procedures used to calculate time and cost overruns. In terms of Figure 1, initial estimates of time and cost are made at time t=0, however the contract is awarded at t=1. Generally there are delays between t=0 and t=1. As a result, input prices at t=1 are signifi cantly higher than at t=0. It appears that only cost estimates get revised upward at t=1, not the time estimates, and these revised cost fi gures are reported in offi cial fi les. This i ndeed has been found to be the case with road projects. Moreover, since cost escalations necessitate additional funds, so cost fi gures get revised to avoid a udit objections; time, in contrast, appears to be a free good in government departments.
6 Conclusions and Policy Implications
The following fi ndings have emerged from the econometric anal-ysis of the MOSPI data: First, delays and cost overruns have de-clined since the 1980s. Cost overruns have systematically de-clined not only in absolute terms but also as a percentage of project cost. Similar is the case with delays. However, the effect is U-shaped. Second, regardless of their source, delays are one of the crucial causes behind the cost overruns. Third, bigger projects have experienced much higher cost overruns compared to smaller ones. Fourth, percentage cost overruns also escalate with the length of the implementation phase – ceteris paribus, the longer the implementation phase, the higher the cost overruns in absolute as well as percentage terms. Fifth, compared to other sectors, projects in road, railways, urban-development sectors, as well as those in civil aviation, shipping and ports, and power sec-tors have experienced much longer delays and signifi cantly higher cost overruns. Sixth, compared to other states, projects located in the southern states of A ndhra Pradesh, Karnataka, Kerala and Tamil Nadu, have experienced somewhat shorter delays and lower cost overruns. The performance of rich states is not signifi cantly better than that of the poorer states.
The fi rst fi ve fi ndings are statistically signifi cant and robust to regression techniques as well as sample sizes. Each result is symp-tomatic of a set of underlying causes. Below I discuss each fi nding and its policy implications in view of the relevant underlying causes.
The fi rst fi nding shows that during the last three decades some learning-by-doing has taken place among government offi cials

SPECIAL ARTICLE
may 22, 2010 vol xlv no 21 EPW Economic & Political Weekly52
involved in project planning and implementation. This along with the technological advances has enabled offi cials to improve estimates of project time and cost.24 However, the fi nding also reveals that the effect of learning and innovations on reducing cost overrun has declined over time. Some policy interventions are urgently called for.
The policy implication of the second result is immediate. Measures are promptly called for to avoid delays at each stage – from project approval to awarding of the contract, and to its implementation. In the following discussion of the remaining fi nd-ings, I will propose some of the steps that can help in this matter.
The third and the fourth fi ndings, along with the analysis show that due to imperfect techniques and contractual incompleteness some delays and cost overruns are inevitable. Besides, some of the cost overruns can be attributed to infl ationary fl uctuations. To that extent delays and cost overruns do not refl ect wastage of resources. However, delays and cost overruns are too frequent and too large to be accounted for by imperfect techniques, con-tractual incompleteness and infl ationary fl uctuations. In view of the discussion in Section 4, these fi ndings indeed imply that the defective planning and contractual failures are largely responsi-ble for cost overruns and consequently for a wastage of public resources. To the extent possible, policymakers should avoid planning for large and big cost projects. Similarly, planning of projects with long implementation phases is problematic. Such projects are vulnerable to future uncertainties, deterioration in project assets and infl ation. Wherever possible the project size as well as the implementation phase should be kept small.
However, the project planning process itself needs a radical overhaul. Rather than paying a higher cost later on, it is worth investing resources to have more precise initial estimates of project time and cost. Moreover, wherever possible, fi xed price rather than unit price EPC contracts should be used. Under the commonly employed item-rate EPC contracts, neither govern-ment offi cials nor the contractors have incentives to take the contracts seriously.
The fi fth fi nding is indicative of the organisational failures that affl ict the project implementation process. Some other results in the study also corroborate this fi nding. In fact, organisational fail-ures frequently trigger yet another form of contractual failure. It is widely known that contract management during the construction phase is very important if delays are to be avoided. At present, con-struction contracts are generally awarded even before the required land for the project is a cquired. Similarly, utilities are shifted dur-ing the construction phase. Invariably, several departments are in-volved in approving and the actual shifting of power, water and sewer lines and other u tilities. Government agencies rarely do what they are required to do, but can use a cobweb of complicated rules and procedures to pass on the blame for delays to one an-other. So much so that even if the delay is caused by the contractor it is almost impossible to punish him, since the contractor can easily prove a contributory negligence on the part of one or the other de-partment. This explains why contracts are rarely terminated, even when contractors cause prolonged delays. Several measures can help on this front too. For example, if activities like land acquisition and shifting of utilities can be completed either before or within a
Committee for Protection of Democratic RightsMumbai
Invites you to a unique lecture on the Indian State’s
War on PeopleBY
the two public intellectuals who have actually visited and stayed with the Maoists in the guerrilla zones of Bastar in Chhattisgarh to study their movement and to understand why the Indian government considers them the biggest threat to the
internal security of India.
Arundhati RoyGautam Navlakha
Venue: Mumbai Marathi Patrakar Sangh’s Terrace Hall (Next to Press Club)Opposite Azad Maidan Police Station, Mahapalika Marg, Mumbai
Date: 02 June 2010Time: 5.30 to 8.30 PM

SPECIAL ARTICLE
Economic & Political Weekly EPW may 22, 2010 vol xlv no 21 53
Notes
1 The meeting regarding fi nancing of the National Highways Development Project (NHDP) was held on 15 March 2005, see GoI (2006a).
2 Report of the Core Group on Financing of NHDP (2006, pp 14 and 18) published by the Secretariat for the Committee on Infrastructure. Als0 see GoI (2006b).
3 See Kundu (2001), Nagaraj (2006), Goyal (2008), ADB (2006) and GoI (2007).
4 In the terminology used by MOSPI, the former is known as the actual date of commissioning and the latter as the original date of commissioning.
5 The authors have studied 258 mega infrastruc-ture projects from 20 countries including devel-oped as well as developing countries. They have shown that 90% of large transport projects suffer from cost overruns.
6 For example, the Suez Canal was constructed at a cost three times of the estimated amount. The cost overrun for the Panama Canal was in the range of 70-200%. Similarly, for the Concorde supersonic airplane project, the actual costs were 12 times the projected costs (Flyvbjerg et al 2002). For more case studies see Pickrell 1990; Skamris and Flyvbjerg 1997; Kain 1990; among o thers.
7 Besides, there are several interesting studies with a focus on the operation-and-maintenance phase of in-frastructure projects. For a comprehensive account of various challenges faced by urban d evelopment projects see Kundu (2001) and Banerjee-Guha (2009). Goyal (2008) provides an enlightening dis-cussion on the problems faced by railways and civil aviation sectors. These works show that privatisa-tion itself has not delivered the expected results in urban development and civil aviation sectors. For a discussion on power sector see Nagaraj (2006).
8 For example, a typical civil aviation project needs clearances from the ministries of civil aviation, fi nance, environment and forest, and the Airports Authority of India.
9 Generally, the contractor is selected through com-petitive bidding.
10 Note that the initially expected project cost, rath-er than the actual cost, is a better indicator of the size and incompleteness of the contract. Due to cost overrun, the fi nal cost can be large even for small projects. The same argument applies to the implementation phase.
11 To take an example, suppose a project is worth Rs 100 crore. But the initial contract misses out on say 10% of relevant work. As a result, there are cost overruns of Rs 10 crore. Take another same-sector project that is worth Rs 200 crore. This bigger project may show higher cost overruns of Rs 20 crore. But, percentage cost overrun for both projects is the same – 10%. Of course, as the complexity of a project increases, it becomes more diffi cult to provide every minute detail in the initial contract. For an accessible account of incomplete contracts see Hart (1995).
12 See Lok Sabha (2006) and LEA International (2008). 13 Under unit-price EPC contracts, the contractor
gets paid based on the quantities of inputs used. Therefore, he does not have to worry too much about details of material requirements.
14 Bolton and Dewatripont (2005). 15 See Lok Sabha (2006), LEA International (2008)
and quarterly reports of MOSPI. 16 For a case study of Dhamra Port expansion project
see Jonston and Santillo (2007). 17 We arrived at this ranking by taking average of
constant price per capita state gross domestic product for three years from 2004-05 to 2006-07. We have used data published by the EPW for this purpose. Shetty (2003) has shown that during the 1980s and 1990s the ranking of states in terms of per capita income did not change much.
18 Cost escalation can cause delays, one may argue, if there are not enough funds available for the project. However, examination of MOSPI reports by the author shows that in most cases the actual expenditures have been less than the project out-lays. Therefore, delays cannot be attributed to the shortage of funds. Moreover, lack of funds seems to be a serious issue only for railway projects. See quarterly MOSPI reports.
19 In order to identify outliers, studentised residuals were predicted and observations having absolute value greater than two were dropped. To identify infl uential points STATA’s in built command for calculating leverage of each observation, DFITS, DFBETA, WELSCH DISTANCE and COVRATIO were used (see Belsley et al 1980).
20 For example, initially a 200 km road was to be built but fi nally it was decided to bring down the length to just 40 km. Clearly, a road project of 200 km is not comparable to the one covering just 40 km.
21 While any threshold is arbitrary, fi gures showing – 40%, – 45%, etc, of cost overruns or time over-runs are rather implausible. Therefore, it appears safe to exclude such projects on account of the reasons provided in the previous paragraph.
22 After dropping the observations with time overruns of – 40% and less, and cost overrun – 40% and less, the remaining observations were treated for outlier as explained above. The same procedure was followed with the other threshold limits.
23 However, note that in equation (1) the dependant variable is percentage time overrun rather than the absolute value of the time overrun. Time over-runs in absolute terms should increase with the project size.
24 This result supplements fi ndings that the per-formance of the public sector as a whole has im-proved since the mid-1980s (see Nagaraj 2006).
Refrences
ADB (2006): “Facilitating Public-Private Partnership for Accelerated Infrastructure Development in India”, Workshop Report, December, GoI and Asian Development Bank.
Arvan, L and Leite (1990): “Cost Overruns in Long-Term Project”, International Journal of Industrial Organisation, 8(3), 443-67.
Banerjee-Guha, Swapna (2009): “Neoliberalising the ‘Urban’: New Geographies of Power and Injustice in Indian Cities”, Economic & Political Weekly, XLIV, 22, pp 95-107.
pre-scheduled time after the award of contract, the contractors can be put on high powered incentives to deliver on time and quality.
Coming to the sixth fi nding, there is a perception that due to superior infrastructure and better governance, the public delivery system is better in richer states. However, contrary to the popular perception this fi nding shows that the performance of richer states is not any better than the rest of the country, though the projects located in the southern states have exhibited marginally lower cost overruns.
Privatisation Is No Panacea
The above conclusions are relevant for the present offi cial policies towards infrastructure. Policymakers seem to be keen to priva-tise the funding, management and ownership of infrastructure facilities. While an outright privatisation has invited strong pro-tests from several quarters, the PPPs have become a politically acceptable channel of transferring management and ownership rights to private fi rms. The Eleventh Five-year Plan crucially de-pends on private sector participation in infrastructure. The prob-lems of delays and cost overruns with the public delivery systems are being used to justify privatisation of public goods and services. However, our results imply that a change in ownership in i tself cannot mitigate all the problems with the supply and administra-tion of infrastructure facilities. After all, even PPP projects have to be initially planned by government offi cials. PPP projects are equally vulnerable to some of the contractual and organisational
failures discussed above. Projects for the upgradation of the Delhi and Mumbai airports, construction of the Bangalore Metro and the Delhi-Gurgaon Expressway are some relevant examples of PPP projects which have experienced major delays and cost overruns. In contrast, the contractual and institutional approach adopted by the Delhi Metro Rail Corporation (DMRC) for the con-struction of the Delhi metro is worth emulating. Most of its projects have been completed on time and within budget. Inter-estingly, the DMRC has adopted some aspects of the approach suggested above.
I would like to conclude with a few remarks on the fi ndings of this paper. The results and conclusions are relevant to all infra-structure projects, regardless of the sector and the project type. However, generality always comes at a cost. Apart from the i ssues discussed here, there are sector-specifi c issues also that impinge on delays and cost overruns. The present study has ignored such issues. For a better understanding of the causes behind delays and cost overruns, it will be useful to supplement this work with sector-specifi c analyses. Sector- specifi c studies may allow for testing of additional hypotheses. For example, it may become feasible to evaluate the comparative performance of different types of contracts, say acquisition versus construction contracts, PPP versus non-PPP contracts, etc. Besides, though the results seem robust enough, it will be useful to explore the reasons behind the doubtful fi gures on delays and cost overruns (such as reporting errors), and rectify them to the extent possible.
SPECIAL ARTICLE
may 22, 2010 vol xlv no 21 EPW Economic & Political Weekly54
Belsley, D A, Edwin Kuh and Roy E Welsch (1980): Re-gression Diagnostics: Identifying Infl uential Data and Sources of Collinearity (New York: Wiley).
Bolton, P and M Dewatripont (2005): Contract Theory (Cambridge: MIT Press).
CSO (various years): Programme Implementation R eports, Central Statistical Organisation, New Delhi.
Dalvi, Qasim (1997): Transport Planning and Policy in India (Mumbai: Himalaya Publishing House).
EPW Research Foundation: “Domestic Products of States of India, 1960-61-2006-07”.
Flyvbjerg, B, M K S Holm and S L Buhl (2002): “Cost Underestimation in Public Works Projects: Error or Lie?”, Journal of the American Planning Association, 68(3), 279-95.
– (2003): “How Common and How Large Are Cost Overruns in Transport Infrastructure Projects?”, Transport Reviews, 23, 71-88.
– (2004): “What Causes Cost Overrun in Transport Infrastructure Projects?”, Transport Reviews, 24 (1), 3-18.
Ganuza, Juan-José (2007): “Competition and Cost Overruns in Procurement”, International Journal of Industrial Organisation, Vol 55(4), 633-60.
Gaspar, V and A Leite (1989): “Selection Bias Induced Cost Overruns”, International Journal of Industri-al Organisation, 8(3), 443-67.
GoI (2006a): “Financing of the National Highway D evelopment Programme”, Report of the Core Group, Planning Commission, Government of I ndia.
– (2006b): “Guidelines on Financing Support to Public Private Partnerships in Infrastructure”, Planning Commission, New Delhi.
– (2007): “The Report of the Committee on Infra-structure Financing” (Deepak Parekh Committee) available at www.pppinindia.com
Goyal, Ashima (2008): “Governance in India’s Public Transport Systems: Comparing Indian Railways and Airlines”, Economic & Political
Weekly, XLIII, 28, 119-27.Green, William H (2008): Econometric Analysis, 6th
(ed.), Pearson Prentice Hall, New Jersey.Hart, Oliver (1995): Firms, Contracts and Financial
Structure (Oxford: Clarendon Press).Jonston, P and D Santillo (2007): “The Dhamra-Chan-
dbali Port Expansion Project, Critique of the Envi-ronmental Impact Assessment”, Greenpeace R esearch Laboratories, Bangalore.
Kain, J F (1990): “Deception in Dallas: Strategic M isrepresentation in Rail Transit Promotion and Evaluation”, Journal of the American Planning A ssociation, 56(2), 184-96.
Kundu, Amitabh (2001): “Urban Development, I nfrastructure Financing and Emerging System of Governance in India: A Perspective”, Manage-ment of Social Transformations, Vol 4(15).
LEA International (2008): “Suggestion for Improve-ment of the PWD Costing Methods, Processes, Centralise Costing/Estimating Policy Function, Upgrade Cost Estimating Tools, Skills”, Report No 9, New Delhi, available at http://uppwd.up.nic.in/ids/ModuleF.htm
Lok Sabha (2006): Fourteenth Report of Committee on Public Undertakings (2006-07), published by Lok Sabha Secretariat, New Delhi.
Merewitz, L (1973): “Cost Overruns in Public Works” in W Niskanen, A C Hansen, R H Havemann, R Turvey and R Zeckhauser (ed.), Benefi t Cost and Policy Analysis (Chicago: Aldine).
Morris, Sebastian (1990): “Cost and Time Overruns in Public Sector Projects”, Economic & Political Weekly, Vol XXV, No 47, pp M-154-M-68.
– (2003): “Public Investment in India: Delays and Cost Overruns”, India Infrastructure Report 2003, Chapter 5.1.
Morris, P W G and G H Hough (1987): The Anatomy of Major Projects: A Study of the Reality of Project Management, John Wiley and Sons, New York.
Morris, S and A Pandey (2007): “Towards Reform of Land Acquisition Framework in India”, Economic & Political Weekly, 42 (22), pp 2083-90.
MOSPI (various years): “Project Implementation Sta-tus Report for Central Sector Projects”, Quarterly Reports from April 1992-March 2009.
Nagaraj, R (2006): “Public Sector Performance since 1950: A Fresh Look”, Economic & Political Weekly, 41 (25), 2551-57.
Pickrell, D H (1990): Urban Rail Transit Projects: Fore-cast versus Actual Ridership and Cost, US Depart-ment of Transportation, Washington DC.
Raghuram, G, Samantha Bastian and Satyam Shivam Sundaram (2009): “Mega Projects in India: Envi-ronmental and Land Acquisition Issues in the Road Sector”, IIMA, WP No 2009-03-07.
Shetty, S L (2003): “Growth of SDP and Structural Changes in State Economies: Interstate C om pari sons”, Economic & Political Weekly, 38 (49): 5189-5200.
Skamris, M K and B Flyvbjerg (1997): “Inaccuracy of Traffi c Forecasts and Cost Estimates on Large Transport Projects”, Transport Policy, 4(3), 141-46.
Sriraman, S (2003): “Capital Expenditure Budget-ing Process in the Indian Railways”, India Infra-structure Report 2003, Chapter 5.2, IDFC, D elhi.
Thomas, M K (2000): Public Sector Transport in India in the New Millennium: A Historical Perspective (Pune: Ebenezer Publishers).
Thomsen, Stephen (2006): “Sacred Cows on the Road to Development: Reforming India’s Infrastruc-ture”, available at http://www.tcf.or.jp/data/ 2006120607_ Stephen_ Thomsen.pdf
Vijayamohanan, Pillai, N and K P Kannan (2003): “Time and Cost Over-Runs of the Power Projects In Kerala”, WP No 320, Centre for Development Studies, Thiruvananthapuram.
Wachs, M (1989): “When Planners Lie with Numbers”, Journal of the American Planning Association, 55(4), 476-79.
AppendixTable A1: Regression Results* Variables PCGETIMEOVERRUN P - value PCGECOSTOVRRN P - value (% Time Overrun) (% Cost Overrun)
PCGETIMEOVRRN 0.2429 0.000 (0.0369)
TIMELAPSE -0.7328 0.000 -0.3845 0.000 (0.0633) (0.0651)
TIMELAPSE2 0.0028 0.000 0.0035 0.000 (0.0006) (0.0006)
INITIALCOST -0.0063 0.193 0.0050 0.094 (0.0049) (0.0030)
IMPLPHASE -1.2333 0.000 0.5067 0.000 (0.1681) (0.1220)
DRRU 40.9296 0.000 37.9870 0.000 (5.3430) (4.5982)
DCSP 19.7656 0.000 24.0051 0.000 (5.4361) (4.0508)
DTA Dropped Dropped
DPP -4.7462 0.455 14.6585 0.000 (6.3433) (4.0358)
DSTATES -11.8610 0.027 1.7636 0.691 (5.3573) (4.4294)
DMRICH -5.7687 0.206 0.0901 0.980 (4.5601) (3.6606)
DRICH -3.5852 0.389 -5.4182 0.114 (4.1605) (3.4273)
DNE -4.1623 0.644 5.1536 0.438 (8.9883) (6.6445)
CONSTANT 101.7805 0.000 -54.8966 0.000 (10.0440) (6.4634)
Observations 672 672
R-squared 0.3207 0.000 0.4283 0.000* White’s heteroscedastic consistent estimates. Robust standard errors in parentheses.
Table A2: Regression Results – Quantile Regression Variables PCGETIMEOVRRN P-value PCGECOSTOVRRN P-value
(% Time Overrun) (% Cost Overrun)
PCGETIMEOVRRN 0.0257 0.000 (0.0073)
TIMELAPSE -0.6558 0.000 -0.5347 0.000
(0.0403) (0.0211)
TIMELAPSE2 0.0029 0.000 0.0044 0.000 (0.0005) (0.0002)
INITIALCOST -0.0008 0.814 0.0023 0.165
(0.0033) (0.0017)
IMPLPHASE -0.9046 0.000 0.2473 0.000
(0.0433) (0.0226)
DRRU 36.7614 0.000 42.1693 0.000
(5.7493) (2.9710)
DCSPP 17.0066 0.008 19.9639 0.000
(6.3534) (3.2765)
DTA 124.9216 0.000 -13.5074 0.005
(8.9962) (4.7953)
DPP -6.4807 0.384 14.0290 0.000
(7.4378) (3.8430)
DSTATES -7.7387 0.267 6.2275 0.084
(6.9621) (3.6050)
DMRICH 2.3849 0.650 -3.9707 0.144
(5.2572) (2.7129)
DRICH -1.3095 0.801 -3.6842 0.171
(5.1935) (2.6890)
DNE 4.3152 0.612 15.4589 0.000
(8.4949) (4.4202)
CONSTANT 78.4338 0.000 -34.8407 0.000
(5.9022) (3.0972)
Observations 894 894
Pseudo R2 0.1595 0.1748 Standard errors in parentheses.