DCvelopmentofR&DPurchasingPowerParitiesdata.nistep.go.jp/dspace/bitstream/11035/563/1/NISTEP-NR031-FullE.pdf ·...
39
㌔_ N ISTEP REPORT N O .31 DCvelopmentofR&DPurchasin (Summary) Mareh1994 TakaoKIBA,ItsuoSAKUMAandJu ThirdPolicy-OrientedResearchGro Na60nalhstituteofScienceandTechnology ‰ienceandTechn0logyAgenCy
Transcript of DCvelopmentofR&DPurchasingPowerParitiesdata.nistep.go.jp/dspace/bitstream/11035/563/1/NISTEP-NR031-FullE.pdf ·...

㌔_
N IST EP R E PO R T N O.31
DCvelopmentofR&DPurchasingPowerParities
(Summary)
Mareh1994
TakaoKIBA,ItsuoSAKUMAandJunichiKIKUCHI
ThirdPolicy-OrientedResearchGroup
Na60nalhstituteofScienceandTechnologyPolicy(NISTEP)
‰ienceandTechn0logyAgenCy

Summ ary and でrans la t⊥on
O f Jap ane se V ersion
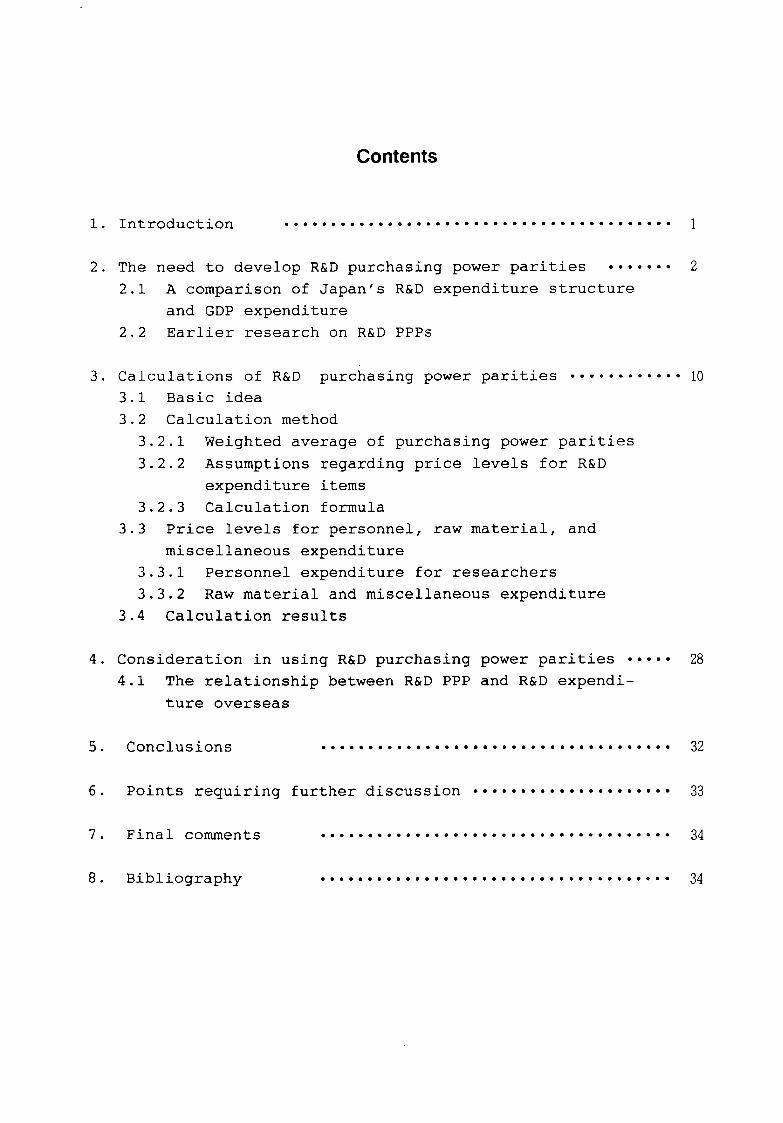
Contents
1.Introduction …………………………………‥ 1
2.The need to develop R&D purchasing power parities ……・2
2.1 A comparison ofJapan,s R&D expenditure structure
and GDP expenditure
2.2 Earlier research on R&D PPPs
3.Calculations of R&D purchasing power parities …………10
3.1 Bas⊥C ⊥dea
3.2 Calculation method
3・2.1 Weighted average of purchasing power parities
3.2.2 Assumptions regarding pricelevels for R&D
expenditureitems
3.2.3 Calculation formula
3.3 Pricelevels for personnel,raW material,and
miscellaneous expenditure
3・3・l Personnel expenditure for researchers
3.3.2 Raw material and miscellaneous expenditure
3.4 Calculation results
4・Considerationin using R&D purchasing power parities …‥ 28
4・1 The relationship between R&D PPP and R&D expendi-
ture overseas
5. Conclusions
6・ Points requiring further discussion ………………… 33
7. F⊥nal comments ………………………………・ 34
8・ B⊥bl⊥ography

1.lntroduCtion
The expanding world-Wide competitionin research and development
is giVing rise to numerous attempts bY a range Of organizations
to compare research and development expenditure among various
COuntries.To make more accurateinternational comparisons of
research and development(R&D)expenditure.anindexis needed
that will allow direct comparisons of the amounts of g00ds and
SerVices that can actuallY be purchased with the R&D expenditure
Of each country・(Notel)We wouldlike to advocate the develop-
ment of purchasing power parities applicable to R&D expenditure
(hereafter,HR&D PPPs”)as a currency conversion rate that can
Perform this function.
Conversion based on currency exchange rates does not show the
actual purchasing power of a particular country′s R&D expendi-
ture′ and OECD and other purchasing power parities(hereafter,
”Znternational Comparison Program(ZCP)PPPs’’)are calculated on
bases that differ from the goods and services usedin R&D.(Note
2)
We have studied R&D expenditureitems and the pricelevels of
theseitems andin this report have pointed out problems with
appIYing =CP PPPs to R&D expenditure′ COmPleting trial calcula-
tions of R&D PPPs for 6 countries,includingJapan.Itis essen-
tialin calculating R&D PPP to analyze R&D expenditureitems and
match PPPs to theseitems;We have attempted here as detailed an
analYSis as possible usinginput-OutPut tables and other sources・
We have also added some comments on the use of R&D PPPs.
(Notel)IncomparingR&Dexpenditure,WeShouldtakenoteofthediffere一ccSamOngCOuntriesinwhattheymeanbyresearchanddevelopmentandwhatitcovers.AndwhencomparlngthemonetaryamountofR&D
expenditureoverasetperiod,WemuStalsoconsiderdifferencesintheprlCeinflationrateamongcountries・WeshallnottouchonthesepolntSinthisreport・
(Note2)OECDandotherPPPsarecalcula[edoneitheranICPbaseandanSNAbase.Thevaluesusedhere
arecalculatedonanICPbase.
OECDPPPsarecalculatedeveryfiveyears,themostrecentcalculationsbeingin1990・Inordertoutilizea
numberofstatisticalnguresbesidesthePPPs,Wehaveusedthe1985calculations(GearyKhamisMethod)thatallowustouseallofthese.

2・Theneedtodevel0PR&DpurchasingPOWerParities
Japan,s l993 white paper on science and techn010gY COntained
graphs showing R&D expenditure bY the ma〕Orindustrialized coun-
tries calculated usingICP PPPs(Figurel)・ Comparing figures
for the United States andJapan,We Can See that between1970 and
1986 R&D expenditure rose much more sharplyin the United States
thaninJapan. On anICP PPP conversion′ R&D expenditure by the
United Statesin1992 was about 2.4 times as great as that bY
Japan(Japan’s R&D expenditureis for the natural sciences only)・
On an exchange rate basis,however,itis only aboutl.6 times as
great・
PPPs have been developed by OECD and such organizations as a
CurrenCY COnVerSion rate that adjusts pricelevel differences
between countries・ These PPPs,however,Were developed for the
PurPOSe Of comparing the GDPs of different countries and hence
are not necessarilY aPPlicablein all other cases.New PPPs that
address the special characteristics of R&D are needed′ then,tO
replace existing PPPs based on overall GDP.
2.1.AcomparisonofJapan’sR&DexpenditurestructureandGDPexpenditure
In the Geary Khamis Method′ the PPP values forindividual GDP
expenditure items impact on the PPP value for overall GDP in
PrOPOrtion to the weight of these items within overall GDP・
[1日2] In1985 final consumption bY the private sector account車
ed for about 60% of GDPin each countrY,and accordinglY,the
Pricelevels of consumption g00ds greatlyinfluence the calcula-
tion of PPPs ag‘ainst GDP.
Itis necessary′in considering the validitY Of applying PPPs to
R&D expenditure′ tO eXamine the correspondence of R&D expenditure
items to GDP expenditureitems. The Report of the SurveY On
Research and Development bY the Management and C00rdination
Agency(hereafter,一一Japan,s R&D statistics”)[3]breaks down R&D
expenditureinJapaninto sixitems,including personnel expendi-
ture′ raW material expenditure′ and expenditure for tangible
fixed assets purchase(PurChase of machinerY,instruments and
equipment;1and and buildings;and other tangible fixed assets)・
We have analYZed the breakdown of these expenditures giVenin
2

Figurel YenConversionofR&DExpenditureinMajorCountriesBasedonExchangeRateandPurchasingPowerParities
IMF Exchange Rate
Trllli.0n yen
二二二二二=二l=-
′一 L
ヽ’
Prance u.K.
1970‾757677737980818283648586875889909192(軋scal Year)
P.p.p.
Trllllon yen35
30
25
20
15
10
5
0
U.S.A.
ェ一㌔廿
.ご㌻ご
1970‾757577787980313283348536875859909192(Piscal Year)
Source:White Paper on Science&TechnologYin1993
3

Japan’s R&D statistics for1985,COmParing their structure to
that of GDP expenditureitems established bY ZCP on which PPP
Calculations are based;the results are shownin Figure 2.
Among the R&D expenditureitems,i.e.,PerSOnnel expenditure′
expenditure for tangible fixed assets,and miscellaneous expendi-
ture′ are SOme that directly correspond to expenditureitemsin
ICP PPPs,though there are some ma]Or differences between R&D
and GDP expenditureitemSin the weight of theseitemsin the
Wh01e・ Conversely′ SOme Of theitemsincludedin calculatingICP
PPPs′ SuCh as manY that fall under the headings,individual final
COnSumPtion,(f00d,Clothing,medical care′ etc.)or,residential
building‘COnStruCtion,and ′civil engineering,,have almost no
equivalent among R&D expenditureitems・R&D expenditureitems and
ICP PPP expenditureitems being so different structurally,the
=CP,s GDP PPPs do not accuratelY reflect international price
levels for R&D expenditure・Individual R&D expenditureitems are
discussed below.
(1)Personnel expenditure
Personnel expenditure accounts for 42% of R&D expenditure・ Only
a few of the GDP final expenditureitems usedin calculatingICP
PPPs,however,are related to personnel expenditure′ e・g・,
governmental and education compensation of employees(including
not only researchers but al10ther occupations)′ and the weight
Of theseitems is small. Hence′ thereis a significant dif
ferencein the rati0 0f personnel expenditure to total expendi-
ture between these two・(Note 3)
(2)Raw material expenditure
Raw material expenditureis defined byJapan,s R&D statistics to
be expenditure for raw materials,PartS,eXPerimental products′
and some tYPeS Of machinery・ Raw material expenditure accounts
for around18% of total R&D expenditure・AsICP PPPs focus pri-
marilY On the prices of final consumption goods andinvested
g00ds,it appears doubtful that they adequately reflect price
levels for raw material expenditure・
(3)Expenditure for tangible fixed assets purchase
Expenditure for tangible fixed assets purchase can be broken down
into machinery′instruments and equipment;1and and buildings;
and other assets.
4

Figure2 BreakdownsofJapan’sR&DExpenditureandGDP
(The rati00f value of eachitem to the amount of
national R&D expenditure and GDP based onICP)
R&Dexpenditures
GDPbreakdowns
Personnel
expendituI℃
鮎uCadαlal
Mi虹cllaneous 関心 C叩山)nandscrvic朗 Ofcmployce
5
Privale丘nd
COnSumptl0n
63.0%
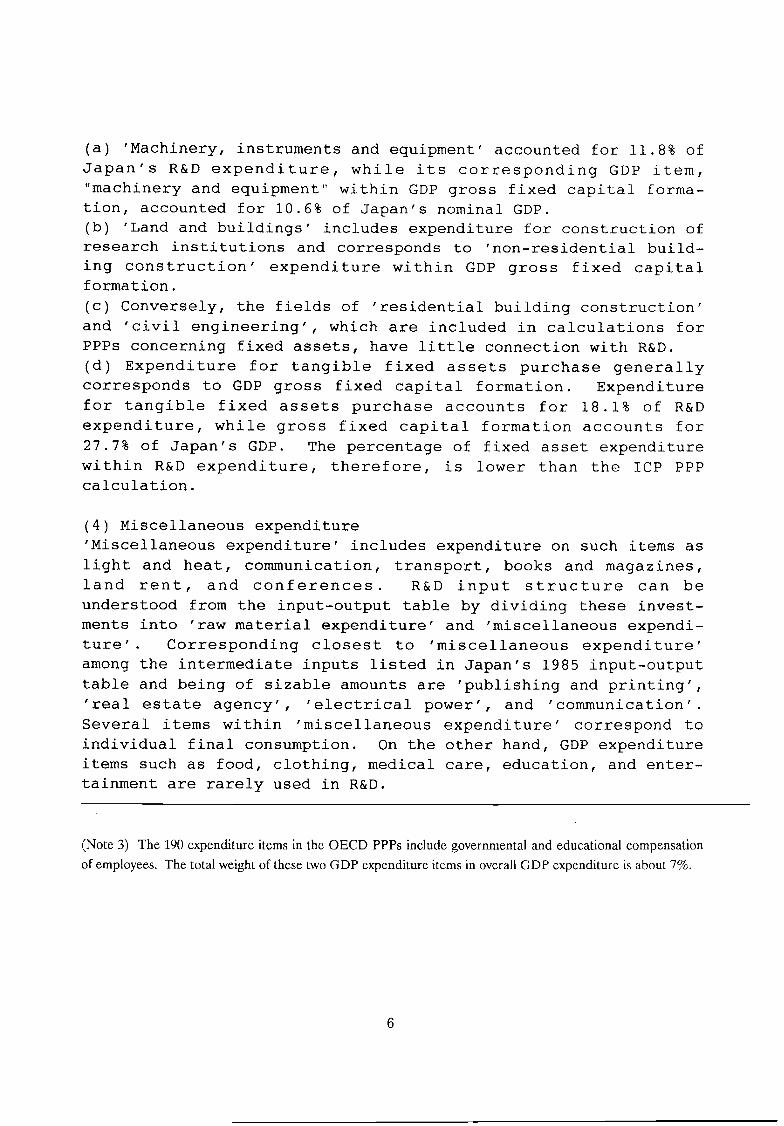
(a)’Machinery′instruments and equipment,accounted for11.8% of
Japan’s R&D expenditure′ Whileits corresponding GDPitem′
HmachinerY and equiPment一一 within GDP gross fixed capital forma-
tionr accounted forlO・6% ofJapan,s nominal GDP・
(b)’Land and buildings,includes expenditure for construction of
researchinstitutions and corresponds to ′non-reSidential build-
ing construction,expenditure within GDP gross fixed capital
format土on.
(C)ConverselY,the fields of,residential building construction,
and’civil engineering,,Which areincludedin calculations for
PPPs concerning fixed assets,havelittle connection with R&D.
(d)Expenditure for tangible fixed assets purchase generallY
COrreSPOnds to GDP gross fixed capital formation・ Expenditure
for tangible fixed assets purchase accounts for18.1% of R&D
expenditure′ While gross fixed capital formation accounts for
27・7% ofJapan,s GDP・ The percentage of fixed asset expenditure
Within R&D expenditure′ therefore′is lower than theICP PPP
Calculat⊥on.
(4)Miscellaneous expenditure
’Ⅱiscellaneous expenditure,includes expenditure on suchitems as
light and heat,COmmunication,tranSPOrt,b00ks and magazines′
land rentr and conferences・ R&D input structure can be
underst00d from theinput一〇utput table by dividing theseinvest-
mentsinto ′raw material expenditure,and ′miscellaneous expendi胃
ture’・ Corresponding closest to,miscellaneous expenditure′
among theintermediateinputslistedinJapan,S1985input-OutPut
table and being of sizable amounts are ′publishing and printing,,
’real estate agency′,′electrical power,,and ′Communication,.
Severalitems within ′miscellaneous expenditure′ correspond to
individual final consumption・ On the other handJ GDP expenditure
items such as f00d.clothing,medical care′ education,and enter-
tainment are rarelY uSedin R&D.
(Note3)The190expenditureitemsintheOECDPPPsincludegovernmentalandeducationalcompensation
Ofemployees・ThetotalweightofthesetwoGDPexpenditureitemsinoverallGDPexpenditureisabou[7%.
6
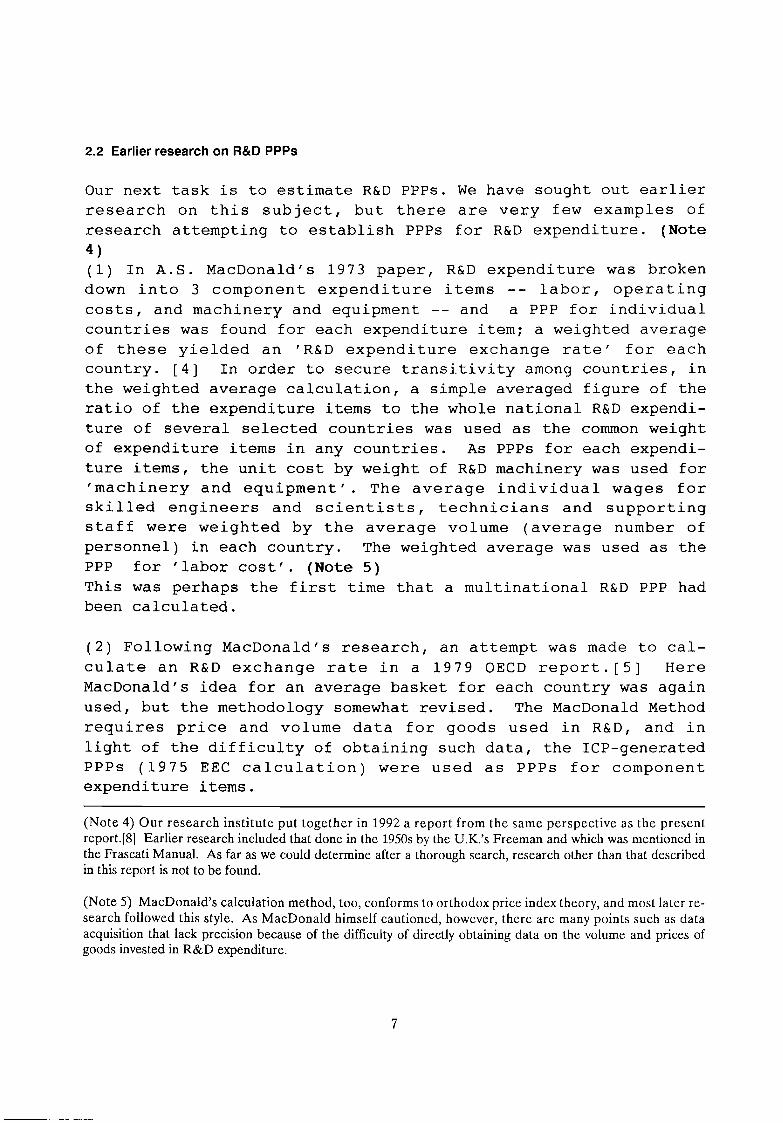
2.2 EarJierresearchonR&D PPPs
Our next taskis to estimate R&D PPPs.We have sought out earlier
research on this subject,but there are verY few examples of
research attempting to establish PPPs for R&D expenditure・(Note
4)
(l)In A・S・MacDonald′S1973 paper,R&D expenditure was broken
downint0 3 component expenditureitems 胃-labor,OPerating
COStS,and machinerY and equiPment … and a PPP forindividual
COuntries was found for each expenditureitem;a Weighted average
Of these Yielded an,R&D expenditure exchange rate,for each
COuntry・[4]In order to secure transitivitY amOng COuntries,in
the weighted average calculation,a Simple averaged figure of the
rati0 0f the expenditureitems to the wh01e national R&D expendi-
ture of several selected countries was used as the common weight
Of expenditureitemsin anY COuntries. As PPPs for each expendi-
tureitems′ the unit cost by weight of R&D machinery was used for
’machinerY and equiPment,.The averageindividual wages for
Skilled engineerS and scientists′ teChnicians and supporting
Staff were weighted by the average v01ume(average number of
PerSOnnel)in each country. The weig‘hted average was used as the
PPP for’labor cost,・(Note5)
This was perhaps the first time that a multinational R&D PPP had
been calculated.
(2)F0110wing MacDonald′s research,an attempt WaS made to cal-
Culate an R&D exchange ratein a1979 0ECD report.[5] Here
MacDonald’sidea for an averag‘e basket for each countrY WaS again
used,but the method010gY SOmeWhat revised. The MacDonald Method
requires price and v01ume data for g‘00ds usedin R&D′ andin
light of the difficultY Of obtaining such data,the 工CP一generated
PPPs(1975 EEC calculation)were used as PPPs for component
expenditureitems.
(Note4)Ourresearchinstituteputtogetherin1992areportfromthesameperSPeCtiveasthepresentreport・[8]Earlierresearchincludedthatdoneinthe1950sbytheU.K.’sFreemanandwhichwasmentionedin
theFrascatiManual・Asfaraswecoulddetermineafterathoroughsearch,reSearChotherthantha[described
in[hisreportisnottobefound.
(Note5)MacDonald’scalculationmethod,tOO,COnfor誓StOOrthodoxpriceindextheory,andmostla[crre-SearChfollowed[hisstyle・AsMacDonaldhimSelfcautlOned,however,therearemanypolntSSuChasda[a
acquisitionthatlackprecisionbecauseofthedifncultyofdirectlyobtainingdataonthevolumeandpricesof
goodsinvestedinR&Dexpenditure.
7

(3)Kention of an,R&D exchange rate′ was madelaterin both the
1980 revised edition and the1992 revised draft of the Frascati
Manual.[6][7] The calculation method described within was for
the most part the same as that usedin the1979 0ECD report・
Difficulties remainedin obtaining uniform and c00rdinated price
and v01ume data for calculating R&D PPPs,and′ for countries for
Which no such data was available′ there was no choice but to use
estimated values;the reSearCh results themselves,therefore′
Were nO mOre than rough estimates.
(4)Points to be considered when developing R&D PPPs are sum-
marized below.
(a)fncreasing necessity for research on R&D PPP
Research being conducted on R&D PPPsin the1970s coincided with
a transition by the ma〕Or COuntries from a managed exchange
SyStem tO a floating market sYStem. This period was als0 0ne Of
COnSiderable activity by theICP,and there was greatinterestin
the relationship between exchange and ppP. Research was later
SuSPended′ but exchange rates of major currencies beganincreas-
ing‘SubstantiallY against the U.S.d011ar from thelatter half of
the1980s and the disparitY between exchange rates and PPPs
Widened.In addition to this,international relations in the
field of science and techn01ogy have g‘ainedinimportance′ Creat-
ing an environment that makes all the more necessary comparisons
Of R&D expenditure through PPPs.
Purchasing power parities are nowin wide use′ but these PPPs are
at times appliedindiscriminatelY tO SPeCific fields・ Attempting
to establish fixed PPPs for R&D expenditureis a significant step
in correcting this error. All of the earlier research described
above held to the premise that conversion of R&D expenditure on
the basis of GDP PPPsisinvalid′ and our report takes the same
pos土t⊥on・
(b)Precise calculations using relevant data
Research on R&D PPPs has to the present onlY PrOduced rough
estimates・ More precise calculations are needed to establish R&D
PPPs that can serve asinternationalindexes. This will require
a detailed analysis of R&Dinput structures and the application
Of relevant price data. An analysis should also be made of the
hithert0 0bscure details of R&D expenditure and an accurate
estimate made of average prices. The sustained endeavors ofICP
8
have allowed more exact calculations of PPP for more countries in
recent YearS′ and the Frascati Manualr t00/has contributed to
the establishment of indexes for science and technologY;GDP
indexes for different countries have also been made to conform
With the revised SNA. Taking full advantage of these,itis now
POSSible to use even more exact methods to calculate R&D PPPs・
(C)An aggregation method suitable for PPPs bY GK method
The method MacDonald used -- Of breaking down R&D expenditu上e
into component expenditureitems and weight averaging the values
Of the PPPs of these component items 胃-is an obvious one・
Variations on this aggregation method for componentitem PPPs are
POSSible′ however. Given the difficultY Of obtaining separate
Price and v01ume data for R&Dinputitems,One feasible approach
WOuld be to useICP PPP data for R&D PPP values,aS WaS donein
OECD′S1979 research・ Doing so makes it possible to use the
Weight of uniform average v01umes for each countryin re胃aggrega-
tion by weight averaging. Due to the nature of the Geary
Khamis Hethod′ though,the natural calculation method when using
ICP PPP valuesis to take a weighted average of each expenditure
item using the structural rati0 0f expenditure amounts for each
expenditureitemin each countrY reValued through PPPsininter胃
national d01lar terms・(Note 6) BY having available theinterna-
tional prices connected with overall GDP and the PPPs of each
COuntrY,the weight of each expenditure itemin a particular
COuntrY Can be derived from the monetarY data on eachitem of
that country,s R&D expenditurelindependent of other countries・
When assigning a uniform weight to each country′ the average
Weight as a matter of course changes with each country added′
necessitating a recalculation for all countriesinv0lved;the
method employed here has the advantage of not producing such
COmPlexities.
(Note6)WhenusingICPPPPdata,OneaCCeptSaSgiventhe、priceandvolumedatatherein.IntheGearyKhamisMethod,therealmonetaryvaluesofeachexpenditureitemandPPPexpressedininternationaldollartermshaveadditiveconsistencyinmatrixform.[9]
UseofthisparticularqualityisthenaturalmeansofapplyingthePPPoftheGearyKhamisMethod・
9

3.CalculationsofR&Dpurchasingpowerparities
For establishing the best estimation method of R&D PPPs,first we
have to analYZe theinputs of R&D,then presume the correspon-
dence ofinputitems of R&D to PPPs of GDPitems. We should make
a full use ofICP PPPs,input-OutPut tables,SCience and techn01胃
Ogy Statistics of several countries・UsingICP PPPs datais a
PraCtical s01ution・For that,We have to suppose that prices of
inputsin R&D can be represented bY those of corresponding things
for general use.Itis natural for us to f0110w the aggregation
method ofICP PPPs when aggregating PPPs for R&Ditems.
3.1.88Sicidea
(1)Using1985 as a standard,We have made some trial calcula-
tions for R&D PPPs betweenJapan,the U・S.,France′ Germany′ the
U.X・′ and South Xorea.The fundamentalideain our approachis
thatICP PPPs as they are presentlY Calculated offer a structure
that can unify the PPPs of individual expenditureitems and
represent PPPs for topiCal groups of these items;uSing this
StruCture′ a PPP for R&D as a wh01e can be calculated by estimat-
ing a PPP for each R&D expenditureitem and taking a weighted
average of these.
OECD PPPs are used for OECD member states and ESCAP PPPs are used
forJapan and South Korea.BecauseJapan belongs to both of these
groups,theJapanese value can serve as a bridge to allow compar-
isons between South Korea and OECD countries.OECD PPPs can
utilize not onlY data on the 55 GDP expenditureitems but also
the PPPs for the more than190 basic headings. This makes possi-
ble ppp calculations more suited to R&D expenditure・
(2)General differences between this report,s method010gy and
that of the earlier research mentionedin the previous chapter
are as f0110WSl
(a)Purchasing power parities for each R&D expenditureitem can
be estimated more accurately by using the ZCP PPPs and the
detailed data provided bYinput- OutPut tables・
(b)Expenditureitems have been broken downinto six basic cate一
gories= PerSOnnel expenditure.misce11aneous expenditure′ raW
material expenditureJ maChinery and equiPment eXPenditure/land
10

and buildings expenditurel and expenditure for other tangible
fixed assets・(Note 7)
(C)For aggregation of overall PPP for individual R&D
expenditureitems′ the aggregation method usedin calculating
OECD PPPs was adopted.
(d)Though this report has focused on OECD countries,ESCAP data
l10]has also been used toinclude South Korea・
(e)Estimated R&D PPPs for YearS before and after1985,uSing
1985 as a standard.
(3)Points to note
We have assumed in our calculations that the ICP PPP values for
each expenditureitem reflect the pricelevels for the corre-
SPOnding R&D expenditureitems.ICP PPPs have been calculated
from the prices of products in each countrY and expenditure
amounts・ Supposing that we would wish to calculate R&D expendi-
ture PPPs between countries in the same manner,We COuld more
fullY emPloY the values produced by MacDonald and base our calcu-
1ation of R&D PPPs on data on the prices and expenditurein each
COuntry for g00ds and services usedin R&D.In realitY,however,
SuCh a studY WOuld be very difficultindeed.In this report,
therefore′ We have taken the PPPs that correspond to the various
R&D expenditureitems to reflect the pricelevels for R&D expen-
diture・ We can expect to achieve more relevant results for R&D
expenditure bY uSing the values for corresponding GDP expenditure
items thanif we use the PPP for GDP as a wh0le,and we have used
here the most reliable price values among those available・
(Note7)Japan’sR&Dstatisticslist6expenditureitems,themostde[ailedbreakdownofal1countriesstudied
here・StatisticsfromGermany,France,andtheU.K.,havingno’othertangiblefixedassets’Classincation,list
Only5expenditureitems.
11

3.2 CalcuIation method
3・2・1WeightedaverageofpurChasingpowerparities
Of the valueslistedin the OECD reference([1]of the bibliogra胃
Phy)′if we take a weighted average of the -1rati0 0f the nominal
Value(national currencY base)to the real value(d01lar base)
(expressed as K;Note 8)’.for any GDPitems,giving weight to the
real value,We Can Obtain a value for K for all GDP items.
Through this method we can obtain K for Japan,s overall R&D
expenditure bY bringing K which corresponds to the R&D expendi-
tureitems to a weighted average′ giVing weight to the real value
Of each ofJapan,s R&D expenditureitems・This weighted averaging
is carried out for both Japan and the United States. We can
Obtain the real conversion rate bY Obtaining the rati0 0f K for
the overall R&D expenditurein Japan andin the United States・
Thisis shown bY the following formulae.
The amount of the R&D expenditureitemsis xl′ Ⅹ2,・・・Ⅹm・
The rati00f R&D expenditureitemsis Wl′ W2,・・・Wm(m=number of
⊥tems)・
The rati0 0f nominal value to real value of the PPP items that
COrreSPOnd to R&D expenditureitemsis Kl,K2,・・・Km・
The rati0 0f nominal value to real value of the overall R&D
expenditureis Ko’.
We bring K toits weighted average by the real value of R&D
expend⊥tuエーe(Ⅹ/K)′ SO;
Kl(Ⅹ1/Kl)+K2(x2/K2)+・・・Km(Xm/Km)
KC =
(Ⅹ1/Kl)十(Ⅹ2/K2)十・‥(Ⅹm/Km)
Ⅹ1十Ⅹ2+・‥Xm
(Ⅹ1/Kl)+(Ⅹ2/K2)+ ‥・(Xm/Km)
Thus far we have represented each R&D expenditureitemin the
form of a percentag・e Of overall R&D expenditure/SO We Shall
Change the formula・ The amount of each expenditureitemis
represented by Xl=∑Xi・Wl;therefore we shallincorporate this
⊥
into the above formula.
12

Wl+W2 + ‥・Wm
Ko. (Formulal)
(Wl/Kl)+(W2/K2)+ ‥・(Wm/Km) ∑(W/K)
Furthermore′if the K forJapan,s overall R&D expenditureis KN,
and the K for the United States′ OVerall R&D expenditureis KA,
then R&DPPP(Yen/d01lar)is obtained bY dividing theJapanese
figure(KN)bY the American figure(KA)・
R&DPPP=KN/KA(Formula2)
(Note8)Thevaluewhichrepresentstheresearchanddevelop一lentpricelevelandwhichisusedincalculatingtherealconversionrateisnotthePPP,buttheratioofthenomlnalvaluetotherealvalue,Whichisclosetothe
PPP(theratioofthenominalvaluetotherealvalueisthePPPexpressedininternationalprices;Wehavere-
ferredtoitastheratioofthenominalvaluetotherealvalueandrepresenteditbytheletterKinthisreportto
distinguishitfromPPPexpressedonaU.S.dollarbase).Iftherealvalue(dollarbase)ofeachGDPi[em=
R,andthenominalvalue(nationalcurrenFybase)ofeachGDPitem=N,thenK=N/R・Thewordsl-real”
and”nominal’1herehaveadifferentmeanlngfrom[hoseusedwhenlookingateconomicindicatorsoveran
extendedperiodoftimeinwhichtherealvalueisfoundbydividingthenominalvaluebytheprlCeinflation
rate・AvalueforKisfoundforeachitem・InthesecalculationsKisapostulate・
13

3・2・2AssumptionsregardingpricelevelsforR&Dexpenditureitems
We have made the f0110wing assumptions regarding pricelevelsin
different countries for personnel expendituresr machinerYlin-
StrumentS,and equiPment eXPenditures,land and buildings expen-
diture′ eXPenditure for other tangible fixed assets purchaser raw
material expenditure′ and miscellaneous expenditure・
The corresponding relationships areillustratedin Figure3.(Note
9)
Assumptionl・ The PPP for ′personnel expenditure′is represent-
ed bY theICP PPP for,governmental and educational personnel
expenditure′.
Assumption 2・ The PPP for,machinerY,instruments,and equip-
ment’is represented by the PPP for the ′machinerY and facili-
ties’fieldincludedin the ′gross fixed capital formation,of
ICP PPPs・In similar fashion,the PPP for,land and buildings’
is the same as that for the ′non胃reSidential building construc-
tion’field of,gross fixed capital formation,. The PPP for
,expenditure for other tangible fixed assets purchase′is that
giVen for,gross fixed capital formation,.
Assumption 3・ A breakdown of’miscellaneous expenditure′ shows
many expenditures that correspond to ′individual consumption′・
Conversely′ the PPPs for,individual consumption,includeitems
that have no connection with R&D expenditure. Ztems such as
food′ medical care,and entertainment that have no connection
With R&D have thus been excluded. We have noted the types of
g00ds and services commonlyinvestedin for research purposes,
and from theinput-OutPut tables of countries have selected the
ICP PPPs for theitems that most closelY COrreSPOnd to these・
SpecificallY,these are such things as,electrical power,,,comm-
unication’,,publishing and printing,,and ′Office supplies’・
The PPPs of theseitems areintegrated to produce a PPP for
’miscellaneous expenditure′.
Assumption 4・ TheICP PPPs foritems that correspond to’machi-
nery repair’and ′research information service′′ fields in which
R&Dinvestments are often made′ Were Selected frominput一〇utPut
tables and usedin calculating the PPP for,raw material expendi-
ture′・ For some basic raw materials such as petrochemical pro-
14

Figure3 CorrespondingTableforR&DExpenditureandPurchasing
PowerParities
The figure shows the corresponding relationship between the
R&D expenditureitems and the purchasing power parityitems
that represent their pricelevels・
ItcmsorR&D
Expcnditurc
Miscellancouse叩Cndilurc
Primaryltcms
orP.p.p.
GD P
PRIVATE FINAL CONSUMPT工ON EXPENDITURE
Expendi血eror
【anのble丘xcd
assclpurchasc
La鴫buildings
Machhery,lnStrumCntS,
cqulPment
O[bcrassels
Personnelexpenditure
RavHnalcrialcxpcndilurc
FOOD,BEVERAGES&TABACCO
CLOTHING&FOOTWモAR
GROSSRENTFUEL&POWER
HOUSEHOLDEQUIPMENT&OPERATION
MEDICAL&HEALTHCARE
TRANSPORT&COMMUNICATION
EDUCATl0N,RECREATlON&CULTURE
RecrcationalcqulPmCnl&repalrS
Recreational&cultuTalservices
Books,magaZincs&ncwspapers
Education
EducationalCoznpcnsationoEEmPloyee
MISCELLANEOUSGOODS&SERVICES
NETPURCHASESABROAD
GOVERNMENTFINALCONSUMPTIONEXPENDITURE
15
Governmen[alCompensationorEmployee
GROSSFIXEDCAPITALFORMATION
CONSTRUCTION
Residentialbuildings
NoかreSidentialbuildin弾
Cidlcnglneerl喝WOrks
MACHINERY&EQUIPMENT
O[hers
Exchangerate
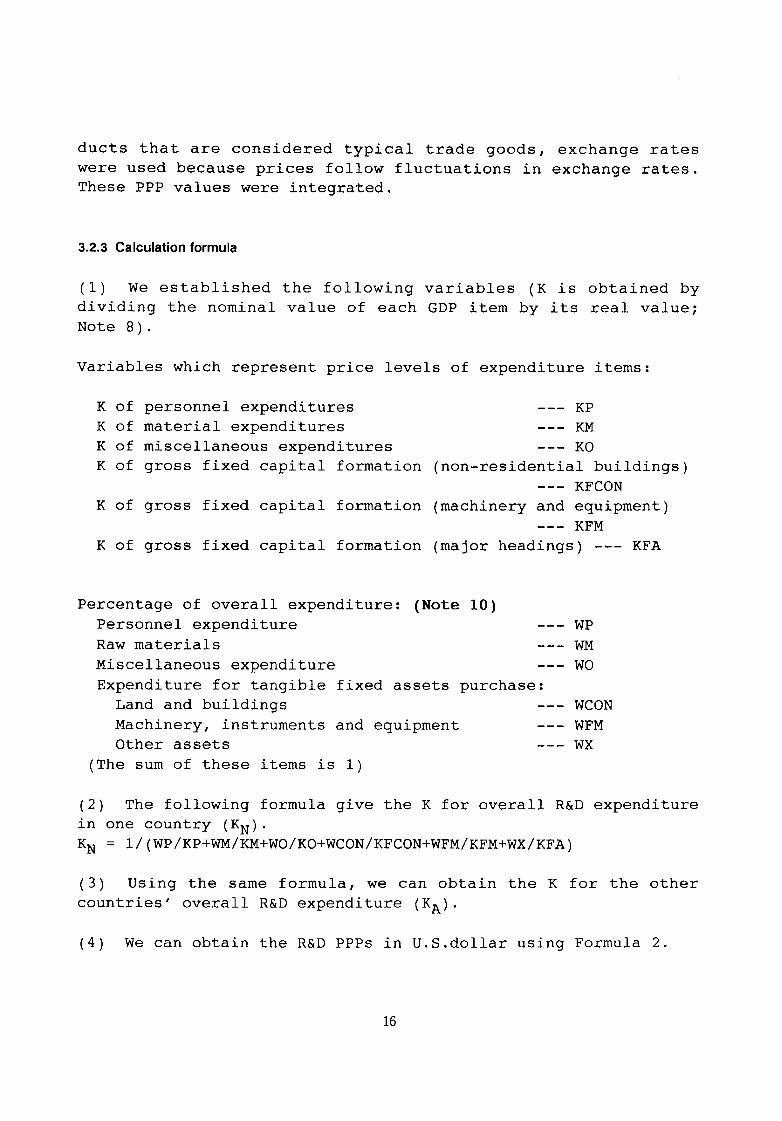
ducts that are considered tYPICal trade g00dsr exchange rates
Were uSed because prices f0110w fluctuationsin exchange rates・
These PPP values wereintegrated・
3.2.3 CalculationformuIa
(1) We established the f0110Wing variables(Kis obtained bY
dividing the nominal value of each GDPitem bYits real value;
Note 8)・
Variables which represent pricelevels of expenditureitems:
K of personnel expenditures
K of material expenditures
K of miscellaneous expenditures 一一一 KO
K of gross fixed capital formation(non胃reSidential buildings)
一一一 KFCON
K of gross fixed capital formation(machinery and equipment)
一一一 KPM
K of gross fixed capital formation(major headings)--- KFA
Percentage of overall expenditure:(NotelO)
Personnel expenditure
Raw materials
Miscellaneous expenditure
胃胃- WP
一一一 WM
一一一 WO
Expenditure for tangible fixed assets purchase:
Land and buildings
MachinerY,instruments and equiPment
Other assets
The sum of theseitemsisl)
(2) The f0110wing formula give the K for overall R&D expenditure
in one countrY(KN)・
KN=1/(WP/KP+WM/KH+WO/KO+WCON/KPCON+WFM/KFH+WX/KPA)
(3) Using the same formula,We Can Obtain the K for the other
COuntries′ OVerall R&D expenditure(KA)・
(4) We can obtain the R&D PPPsin U.S.d01lar using Formula 2・
16

(5) Updating estimation of R&D PPPs
We f0110wed the OECD method of estimating PPPs for the years
after1985・OECD estimates the annual value by multipIYing the
1985 PPP values bY the priceinflation rate of each country・In
this report′ We have multiplied R&D PPPs by the rati0 0f the GDP
deflatorsinJapan and the United States(the rati00f the figure
Obtained after dividing the value of theJapanese deflator based
On1985by that of the United States)・
Pricelevels for g00ds represented bY eXChange rates are consid-
ered to fluctuatein accordance with changesin exchange rates
each year・ The yearly exchange rate and R&D PPPs are broug‘ht to
a weighted average,uSing‘the weight of fields to which exchange
rates appIY aS Wel1as those of the remaining fields・(Note
ll)(Note12)
(Note9)’Personnelexpenditure’wasconsideredtobetheaveragevalueofgovernmentalandeducational
COmPenSation.Under’rawmaterialexpenditure’,theICPPPP’machinery’wasusedfor’machineryrepair’,
’othergoodsandservices’for’researchinformationservices’,andtheexchangeratefor’basicrawmaterials’・
Theweightoftheseitemsineachcountrywerebroughttoaweightedaverage.Under’misceuancousexpendi-
ture’,theICPPPPvaluesfor’electricalpower∵booksandmagazines’,’realestate∵communication∵buiIding
managementandrepalrSerVices’,’petroleumproducts’,’financialservices’,and’Officesupplies’wereused
respeCtivelyfbr’electricalpower∵publishingandprintlng’,’reales[a[eagency’,’[elecommuflications’,’other
Officeservices’,’petroleumproducts’,’finanClng’,and’othermanufacturlngaCtivities’.
(NotelO)Limiteddatameチntthatestimatesofexpenditurebreakdownratiosforseveralcountrieshadtomade.Theexpenditurerat10SOfEuropeancountrleSWerebasicallytakenfrom19850ECDdata・[11]The
breakdownofR&DexpenditureonwhichU.S.calculationsarebasedwasgarneredfromdataathand・[12]
ThisdatadividesU.S.industrialR&Dexpenditureintopersonnelexpenditure,raWmaterialexpenditure,and
indirectexpenditure・Estimatesweremadeofthecomponeptitemsofindirectexpenditure(expenditureforfixedassetspurchase,miscellaneousexpenditure,etc.),uSlngtheratiosofthosesameexpenditureitemsin
JapaIl.
France’sexpenditureratio,withtheexceptlOnOfgovernmenlalexpenditure,uSedthesumofindustrial,higher
educational,andnon-PrOfitresearchorganizations・Germany,sindustrialexpenditureratiodoesnotdivide
tangiblefixedassetsinto’1andandbuildings’and’machines,instruments,andequlPment’,SOeStimateswere
madeuslnggOVernmentalexpenditureratios.FortheoperatlngeXpenSeSOfFrancc,Germany,theU.K・,andSouthKorea,eStimatesweremadeuslngJapaneseratiosforthebreakdownof’misce11aneousexpenditure’and
’rawmaterialexpenditure’.
ESCAPPPPdataaregivemnOtinU.S.doMarsbutininternationaldollartcrms(Asiadollars),SOtheyhavebeenusedasareforthevalueofK.
17
3.3PricelevelsforpersonneI,raWmateriaIIandmisce”aneousexpenditure
3.3,1PersonnelexpenditureforresearcherS
Among OECD PPPsr those corresponding to ′personnel expenditure′
under,government final consumption expenditure′ are,governmen-
tal compensation of employees,and ′educational compensation of
employees,.(Note13)
Weintegrated these two to get a PPP representing pricelevels
for R&D personnel expenditure・ The calculations for personnel
expenditurein these OECD PPPsinclude the salaries of personnel
in various occupationsT While those for R&D personnel expenditure
do not include all of these salaries.
The OECD PPP data for1985 gives exchange rates of ¥143 = US$1=
FFr5.75 = D批2.13 = GBPO.367.The weight of personnel expenditure
in total expenditureis high・ The PPP for,personnel expendi-
ture′ used hereis an average of,governmental compensation of
employees′ and ′educational compensation of emploYeeS’,and
further studyis merited on theissue of whether thisis a valid
Priceindex for R&D personnel expenditure・
Let us draw a comparison of monthly salaries of persons employed
as researchersinJapan and the U.S.As a rule′ SuCh fine points
as social security taxes and allowances must be takeninto ac-
COunt When comparing salarYlevelsin different countries, but
as such considerations are t00 numerOuS for our purposes here′ We
Will content ourselves with a verY general comparison・
(Notell)TheGDPdefla[orisusedforpriceindexesthatusedannualextendedestimates;forcountriesthat
havedevelopedtheirownR&Ddenator,thatvalueisused.
(Note12)Intheannualextendedestimatesforcertainitemsin’rawmaterialexpenditure’,thePPPforapar-
ticularycarisrepresentedbythatyear’Sexchangerate.
Expresslngthisasaformula,Wehavethefollowlng.
RDPPPtistheR&DPPPagainsttheU.S.fortheyeart,theexchangerateisEXRt,andtheratiooftheGDP
deflatoragainsttheU.S.isDt(1985=100).Theratioofeachexpenditureitem,Withthepricelevelratio
beingthe1985exchangerate,isX.
RDPPPt=(RDPPP85-EXR85*X)*Dt+EXR了X
18
The monthlY SalarY ratio forJapanese and U・S・reSearChersin
1985was133Yen/d01lar・The PPP personnel expenditure ratio′
however,WaS143 Yen/d01lar,a difference of 6・8%・(Note14)
Thisis not alarge disparitYr thoughr COmPared to that with the
222 Yen/d011ar PPP of overall GDP・Atleastin the case of a
Japan-U・S・COmParisonT thenr the use of the PPP for governmental
and educational compensation of emploYeeS aS the PPP for person-
nel expenditure for researchersis not such a ma〕Or tranSgreS-
SIC)n.
No ESCAP data of,personnel expenditure′ for South Koreain the
basic headinglevel was available/SO We uSed the -raverage annual
personnel expenditure ratio per researcherHindexinstead・ An
estimate was made by calculating the ratio betweenJapan and
South Korea andlinking this value with the personnel expenditure
PPP values forJapan,the U.S.,and Europe・[13]
Developing SuCh anindex hasits problemsr aS SuCh factors as
national differences in the distribution of researchers among
SOCial classes and the question of whether the number of research
assistants should be included in the denominator must be consid-
ered. HomogeneitYin data must be carefully maintained′ and
applying thisindex between several countriesis verY Cha11eng-
ing.Consequently,itis perhaps more practical to use the value
Of PPP personnel expenditure between multiple countries・
(Note13)PersonnelexpenditurethroughoutJapanroughlyequa[estoemployeeincomeonthedistribu[ion
SideinGDP.Ontheotherhand,PPPbasesprlCeCalculationontheexpenditureside.ThereforetheprlCelevelofperSOnnelexpenditureisnotdirectlyrepresentedbyPPP.
IfwerepresenttheprlCeratioofperSOnnelexpenditureontheanalogyof[hevariousPPPitems,thePPPof
individualconsumptionindicatestheprlCelevelofresearchers’costofliving.Thatis,WeCanthinkofitas
indicatlngtheprlCelevelofpersonnelexpenditureforresearchers.However,WemuStbecarefulwhentaking
thisview.TheprlCelevelofpersonnelexpenditurewearediscussinghereistheprlCelevelofexpenditurethat
ariseswhencompaniesanduniversitiesemployresearchers,andnottheprlCelevelofgeneralspendingby
researchers.Researchersarelikelytoreceivedifferentstandardsoftreatmentindifferentcountries.Thisidea
holdstrueonlywhenresearchersineverycountryspendtheentireamountoftheirwages,andthespendinglS
Of[hesamequalityandquantlty.Inreality,however,thelifestylesandlivingstandardsofresearchersinthe
Variouscountriesdiffer,SOthequalityandquantityofspendingisdifferent.Thehouseholdsavingsrateisalso
different・WehavethereforeavoidedusingPPPsofindividualconsumptl0nforpersonnelexpenditure・
(Note14)Wecomparedthe1989SalarydataofresearchersinJapanandtheU.S.[181[19]Whiletheaverage
monthlysalaryofresearchersemployedinprivatesectorresearchinstitutesinJapanwas¥472,300(bonuses
dividedupintornonthlyaverages),thoseresearchersemployedbyU.S.industryearnedanaverage$4,026per
month・Calculatingtheconversionra[eofpersonnelexpenditurebetweenJapanandtheU.S.yieldsarateof
l17.3yen/dollar,andtheestimated1985Valueis133.4yen/dollar.Thisrepresentsayen6.8%strongerthanthe
143yen/dollarPPPpersonnelexpenditurcratio.
19
3・3・2RawmateriaIandmisce‖aneousexpenditure
Theinput data to R&D sections of theinput-OutPut tables allow
us to assess which expenditures correspond to ′raw material
expenditure′ and ′miscellaneous expenditure′・[14][15][16][17]
Using nationalinput-OutPut tables for1985,We have studied R&D
input structure・Inputitems of R&D canr depending on their par-
ticular nature′ be dividedinto ′raw material expenditure′ and
,miscellaneous expenditure′・We have selected thoseitems repre-
Sentinglarge amounts ofinput from among theinputitems that
COrreSPOnd to these two expenditureitems. A PPP can be assigned
each of theseinputitems according to eachitem,s PPP valuein
OECDinternational d01lar terms・ As a result of our analYSis of
input-OutPut tables,We haveincluded ′electrical power,,,commu-
nication’,’publishing and printing,,and ′Office supplies’in
’miscellaneous expenditure′・
Many such items as,research information service,,,machines
(repair/parts),,and ′petrochemical/inorganic chemical products,
fall under,raw material expenditure,. Of the 55 0ECD PPPitems,
the prices for ,other g00ds and services,are used for’research
information service,and those for,machinery′ are used for
′machines(repair/parts), Exchange rates are used for some
basic raw materialsin view of the fact that domestic prices are
adjusted rapidlyin response to changesin exchange rates・(Note
15) These PPP values are brought to a weighted average of these
Values,uSing the weight of each of theitems corresponding to
,miscellaneous expenditure,in relation to the monetary sum of
theseitems・(Note16)
In the1985input-OutPut tables,OnlyJapan has a separatelist-
ing forindustrialin-house research(business-related research
conducted by corporations).Other countrieslist onlY reSearCh
done bY gOVernmental agenciesr educationalinstitutionsl and some
(Note15)Priceratiosforaportionofthegoodsincludedin,rawmaterialexpenditure’arerepresentedby
exchangeratesinthebeliefthatthelargevolumeoftradebetweenindustrializedcountriesmeansthatchanges
inexchangeratesarequicklyrenectedinprlCeS・
(Note16)ESCAPonlyreleasesdataon550ftheGDPexpenditureitems・Therefore,PPPbetweenJapan
andSouthKoreaiscalculatedusing55correspondingPPPvaluesfromamongtheOECDPPPexpenditure
items.
20

industries(independent research organizations:Organizations
engaged exclusivelyin research)・Estimates forindustrialin-
house researchin countries other thanJapan have been based on
theinput structure ofJapan,sin-house research・(Note17)
3.4 CalcuIationresults
Figurel shows the rati0 0f each R&D expenditureitem by country
as well asits PPP value・ Figure 4illustrates the relationship
between exchange ratest R&D PPPsl and general PPPs・
(1)The relationship of R&D PPPs toICP PPPs
For all maコOr CurrenCiesI R&D PPPs against the U・S・d011arr
COmPared with TCP,s GDP PPPs′ are Characterized by a weaker
d01lar and a strongerlocal currency・The cause of thisrl00king
at various R&D expenditureitems,liesin the fact that the other
ma]Or CurrenCies have grown strongerin personnel expenditure
PPPs thaninICP,s GDP PPPs.In1992,the R&D PPP was marked by
an approximatelY17% stronger yen versus the GDP PPP・
(2)The relationship between exchange rates and R&D PPPs
In1985 exchange rates overa11showed a strong d01lar,but rates
later put the d01lar on a downward trend. The currencies of
developed countries,COnSequently.have seen a turnaroundin the
relationship between R&D PPPsin U.S.d01lar and exchange rates・
R&D PPPsin U・S・d01lar forJapan,s yen have been climbing higher
than exchange rates since1986. With the exception of the period
1973-1975,this divergence between the exchange rate and R&D
PPPs,With the exchange rate reflecting a even stronger Yen,is
the first time that such a phenomenon has been observed;in1992
the exchange rate was127 Yen/d01lar,While R&D PPP was162
Yen/d01lar・ This exchange rate represents a Yen 22% stronger
than that of R&D PPP.
(3)Results of U・S・d011ar conversion of R&D expenditure
Conversion of the R&D expenditure ofindividual countries to U.S・
d01lars,uSing the R&D PPP developed here,is shown bY the s01id
linein Figure 5・ Figure 6 shows the conversion of each coun-
trY’s R&D expenditureinto U.S.d01lars based on this R&D PPP.
21

Figure4TrendsinR&DPPP,ExchangeRate,GDPPPPinMajorCountries
一組脚 …kCb咽0紬te ‥・G脚
22
Yen/USS
1m 1975
1
9
8
7
(
O
nU 臼 l凹l l田
臥5
8.4
8.3
も.2
砂.1
日
9鋤
8聞
7閲
688
5関
41旭
3勘
2t旧
刊独
白
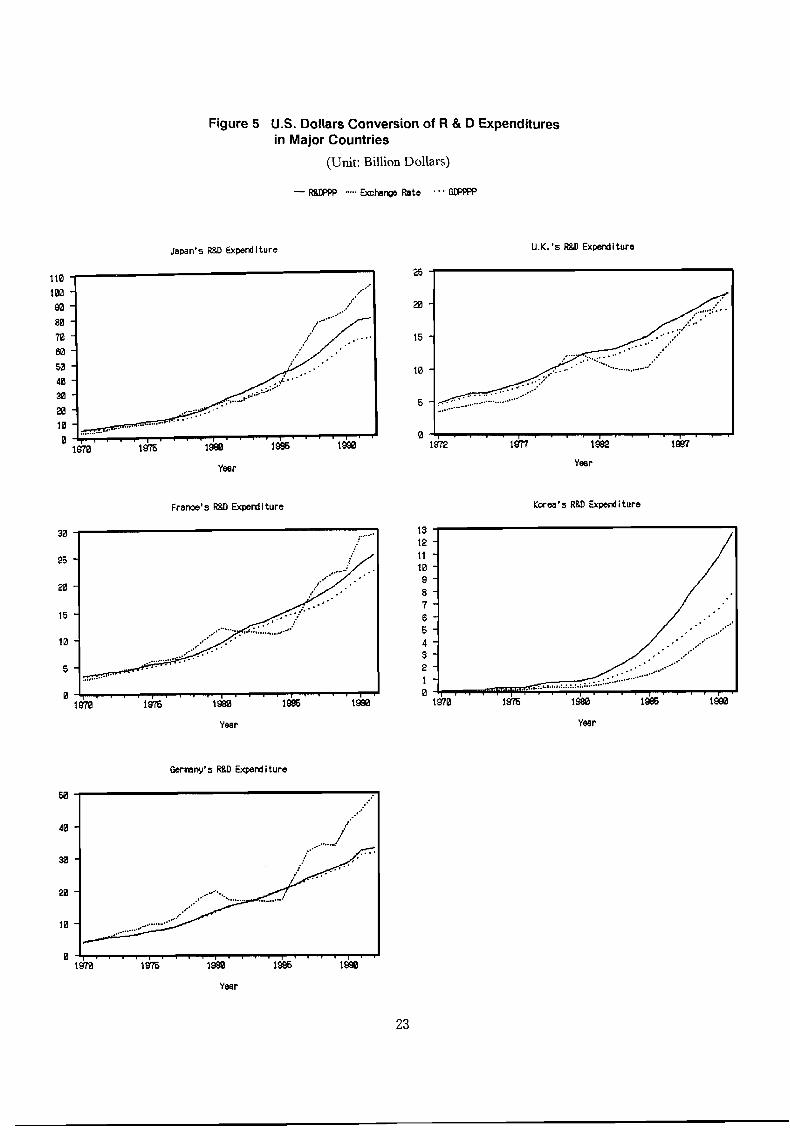
Figure5 U.S.DoItarsConversionofR&DExpenditureS
inMajorCountries
(Unit:BillionDollars)
一礼脚・・…kcbr聯紬te …G脚
Ja関バ5払D Ex関mHture
Fran治.S関心Ex脚価ture
飴「mnジS闇D ExpemHtu「e
58
4日
38
2も
18
日
25
28
15
柑
5
0
13
12
11
日叫
9
8
7
6
5
4
3
2
1
9
U.K..S R8D[x画ituro
Kore8-S R鋸日払割的引tu「e

Figure6 U・S・DoHarsConversionofR&DExpenditures
inMajorCountriesbyR&DPPP
ly70 1割2 1,74 1ダ75 1978 1980 け82 1,84 は86 11邦8 1期 1!秒2
19711973 1卵5 1餅汀 197,19811!樗3 1発5 1郷7 1,8, 相,l
24
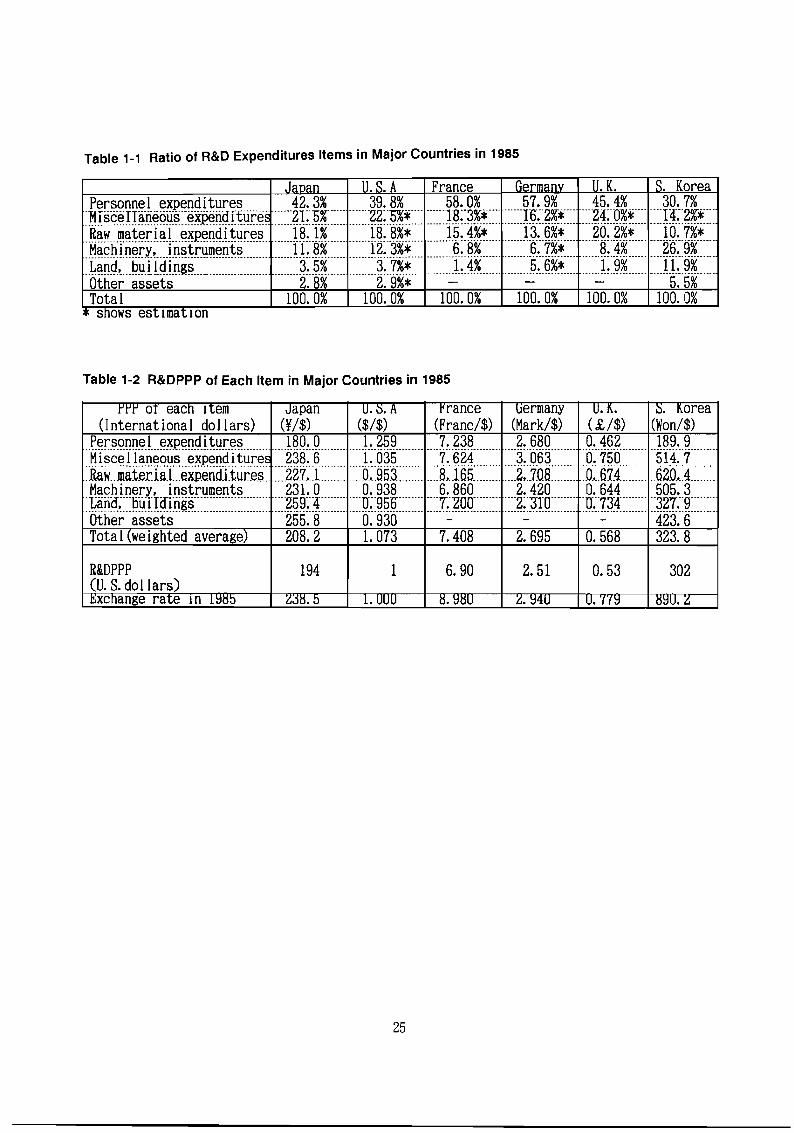
Tablel_1RatioofR&DExpendituresltemsinM8jorCountrieSin1985
JaDan U.S.A France Germany U.K. S.Korea
Personnelexpenditures‾附岳元日aneousexpend‾i-t前弯-
Rawmaterialexpenditures
42.3%‾…‾21‾-ち%……
39.8%…‖‘‾22:-1猪来‥‘
58.0% 57.9%‖…一説-2隊…
45.4% 30.7%
. * 24.0%* 1尋.2獅18.1% 18.8%* 15.4%* 13.6%* 20.2%* 10.7%*
Machinery,instrunentS 11.8% 12.3%* 6.8% 6.7%* 8.4% 26.9%
Land,buildings 3.5% 3.7%* 1.4% 5.6%* 1.9% 11.9%
Otherassets 2.8% 2.9%* - - - 5.5%
Total 100.0% 100.0% 100.0% 100.0% 100.0% 100.0%
* snows estlmatlOn
Table1-2R&DPPPo=:aChlteminMajorCountriesin1985
rlJr oT eaCn ltem Japan 〕.b.A rrance uermany U.K. b.KOrea(Intern at iona l do llars) (¥/$) ($/$) (Franc/$) (Mark/$) (£/$) (Won/$)
Personne l expenditures 180.0 1.259 7.238 2.680 0.462 189.9
Miscellaneous expenditure 238.6 1.035 7.624 3.063 0.750 514.7
Raw ateria l ex end itures 227 1 1 5 2. 674 2 .4Machinery instru nentS 23 1.0 0.938 6.860 2.420 0.644 505.3
an , ul lngS 5 . .…lr 956.‾’‾…‾-…7 200‾…‖……‾2∴汀0‾……’‾町73グ…‖’‖327!9..-日.‖
Other assets 255.8 0.930 - - - 423.6
Tota l(weighted average) 208.2 1.073 7.408 2.695 0.568 323.8
R&DPPP(U.S.dollars)
194 1 6.90 2.51 0.53 302
Excnange rate ln 用的 Z調.b 1.UUU 8.測U Z.94U U..!用 削U.Z
25

T8ble2UpdatingEstimationofR&DPPP
(Each Countr’e’C\凸aCn LOuntrleS LurrenCy Unlt/U.b.$)JapanU.S.AFranceGermanU.K..Kore
1970 224 14.563.360.27 941971 223 14.593.410.28 10119’化ZZZ 14.643.41U.ZU 1131973 233 14.663.370.29 1191974 256 14.813.310.31 136
1975 251 14.883.180.35 157
1976 255 15.133.110.38 1741977 252 15.253.010.41 18619.用Z44 1b.34Z.91U.4Z ZU.!1979 231 15.382.770.43 224
1980 223 15.482.660.47 259
1981 211 15.672.570.48 279
1982 204 16.032.540.49 285
1983 199 16.422.540.51 291
1測4 1Ub 1b.’′ZZ.bZU.bZ ZU41985 194 16.902.510.53 302
1986 188 16.892.470.53 303
1987 182 16.792.420.53 299
1988 176 16.762.370.54 297
1989 173 16.752.350.56 295
1男U HU 16.bU乙JZU.5./3141991 165 16.482.290.58 331
1992 162 16.422.340.59 343
26
U‘t/U S$)

(Note17)Weselectedmajorinputitemsfrom[heinput-OutPuttablesofJapan,theU・S・,France,andSouth
Koreainanexaminationofinputstructure・Theitcrnslntheinput-OutPuttablesVarybycountry,SOthatmaJOr
itemsusedass[andardsalsodiffer・Anyslngleitemthataccountsfor2-4%ormoreorthetotalintermediate
lnPutamOuntinR&DwasregardedasamaJOritem・Whenthereareseveralinputitemsfromtheinput-Out
[ablesthatapplytoaslnglePPPitem,WehavetakentheaveragevalueoftheselnPutitemst
Inthepublicsector,theU.S.1ists’educationalresearch’amongthe144itemsoftheJapan-U・S・input-OutPut
table.Francelists86itemsintheJapan-FrancelnPuトOutputtable,including’governmentandpublic-SuppOrト
edresearch’and’educationalresearch’.SouthKorealists274itemsintheJapan-SouthKorealnPut-OutPut
table,including’na[ionalandpublic-SuppOrtedresearch’and’non-prO丘tresearch’.Thereis,however,nO’in-
houseresearch’itemin[heinpuトOutputtablesofthesethreecountries,andtheirindustrialinpu[struc-
turehas,therefore,beenestimatedbasedonJapan,sinputstructure・Eachcountry}sindustrialinput
StruCtureismultipliedbytheratioofindustrialR&Dexpenditureinthatcountry,andtothisisaddedthe
PrOductofthepublicsectorresearchinputstructureofthatcountryandtheratioofpublicR&Dexpen-
diture・ThisyieldsanlnPutStruCtureforeachcollntry.
TherebeingnoitemscorrespondingtoR&DintheinputTOutputtablesofGermanyandtheU.K.,eXpedient
estimatesweremadeuslngaSimpleaveragevalueofcommonitemsinwhichinvestmentsbyJapan,theU.S.,andFrancewerenumerous.
27
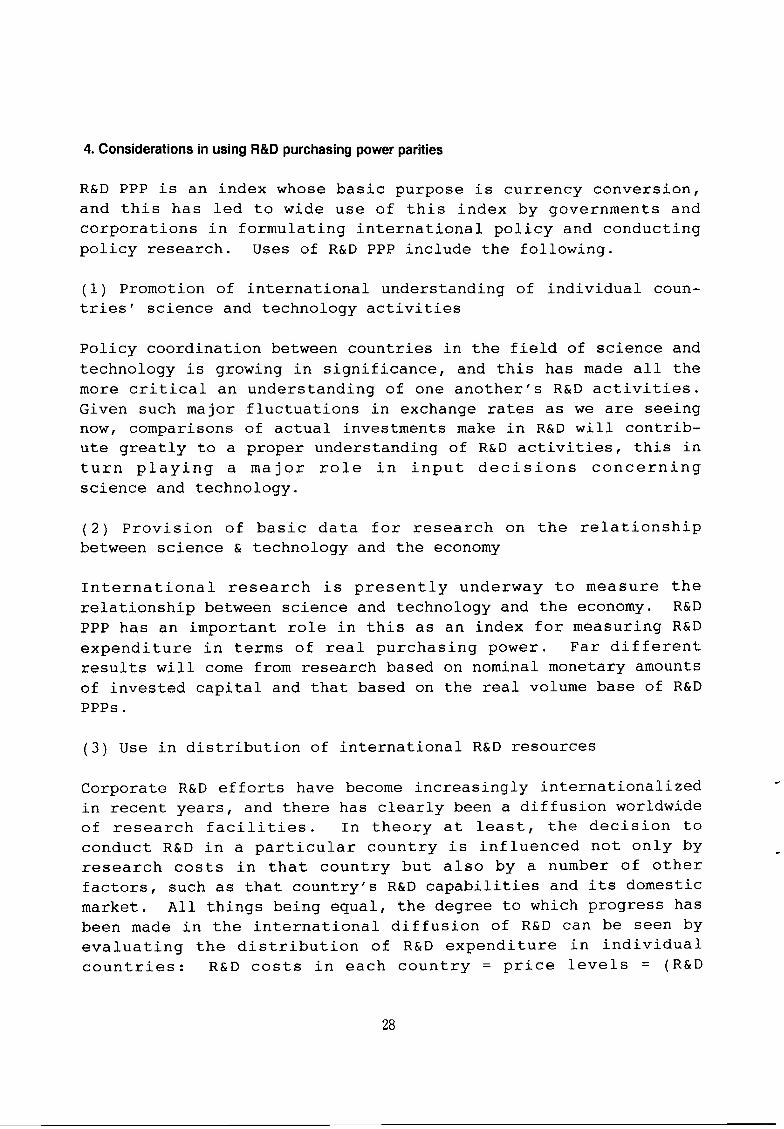
4・ConsiderationsinusingR&Dpurchasingpowerparities
R&D PPPis anindex whose basic purposeis currencY COnVerSion,
and this hasled to wide use of thisindex by governments and
COrPOrationsin formulatinginternational p01icY and conducting
P01icY reSearCh・ Uses of R&D PPPinclude the f01lowing・
(1)Promotion ofinternational understanding ofindividual coun-
tries′ science and techn010gY aCtivities
PolicY C00rdination between countriesin the field of science and
techn010gyis growingin significance,and this has made all the
more critical an understanding of one another,s R&D activities・
Given such ma]Or fluctuationsin exchange rates as we are seeing
now′ COmParisons of actualinvestments makein R&D will contrib-
ute greatlY tO a PrOPer understanding of R&D activities,thisin
turn playing a major r01e in input decisions concerning
SCience and techn0logy・
(2)Provision of basic data for research on the relationship
between science & teChn010gy and the economy
Znternational researchis presently underwaY tO meaSure the
relationship between science and techn010gy and the economy・ R&D
PPP has animportant r01ein this as anindex for measuring R&D
expenditurein terms of real purchasing power・ Far different
results will come from research based on nominal monetarY amOuntS
ofinvested capital and that based on the real volume base of R&D
PPPs.
(3)Usein distribution ofinternational R&D resources
Corporate R&D efforts have becomeincreasinglyinternationalized
in recent YearS/and there has clearlY been a diffusion worldwide
of research facilities・ Tn theory atleastr the decision to
conduct R&Din a particular countryisinfluenced not onlY by
research costsin that country but also bY a number of other
factors,SuCh as that countrY,s R&D capabilities andits domestic
market・All things being equall the degree to which progress has
been madein theinternational diffusion of R&D can be seen bY
evaluating the distribution of R&D expenditureinindividual
countries: R&D costsin each countrY = Pricelevels =(R&D
28

PPP/exchange rate). For example′ for a certain corporation that
has research centersin bothJapan and the U・S・l Figure 7 shows
the distribution of research v01ume between the U.S.andJapan′
assuming that the productivity of each unit of g00dsinvestedis
the same and that research results are substitutional.In this
CaSe,an analogy can be drawn from the micro economic model for
maximizing the utility of two g00ds・ The horizontal axis in
Figure 7 represents the distribution v01ume of researchinJapan,
While the vertical axis represents the distribution v01ume of
researchin the U.S. The budgetlineJ-Ais for an exchange rate
Of130 yen/d01lar.When R&D PPPis at160 Yen/d01lar,the budget
line should l00k like line J-A,in terms of actual investment
V01ume,nOtlike thelineJ-AH reflecting a GDP PPP of 200
Yen/d01lar・The exchange rateinJapan has since1986 continual-
1y been characterized bY a StrOnger yen against R&D PPP;thisis
the first time since1970 that the exchange rate yen value has
COnSistentlY been higher than that of R&D PPP. This will verY
likelYlead toincreased awareness bYJapanese corporations of
theinternational costs associated with R&D and to even possibly
to greater expansion of R&D efforts overseas. Zn the section 4.1
We Will provide a corroborating example of this.
J130 R&D distribution
in quantity toJapan
29

(4)Clarifying R&Dinvestment price structure
We have also calculated PPPs for R&D breakdowns bYindividual
COuntries and these will be able to clarify the differencesin
COSt between different fields・High costsin a giVen field result
in suppIY PrOblemsin this fieldJ neCeSSitating p01icies that
Will correct these problems・Such p01icy measures couldinclude
training additional research personnelrinviting foreign re-
SearChers,relaxingimport dutiesr and decreasing tax rates onfixed assets.
4・1ThereIationshipbetweenR&DPPPandR&Dexpenditureoverseas
R&D expenditure bYJapanese corporationsin foreign COuntries
(hereafter,’.foreign R&D expenditures一.)is on the rise.(Figure
8)We have studied the relationship between this rise and R&D
PPP・Turning back the ′rati00f exchange rates to R&D PPP,(Note
18)by 3 years and examining the relationship between this ratio
and foreign R&D expenditure over the period1977-1992,We nOted
that this relationshipis a negative-Phase one・(Note19)
We can see from this that a 3-Year timelag separates this rise
and the divergence of the exchange rate and R&D PPP,and we can
See the connection of theincreasein foreign R&D expenditure・
Theinterval between R&D planning and actual R&Dinvestmentsis
measuredin YearS′ and decisions to make newinvestments abroad
Often require more time;We have estimated from the movements of
exchange rates a timelag of up to three YearS. L00king at
Sequential relationships and the timelag・′itis undeniable that
the divergence of the exchange rate from R&D PPPis aninfluen-
tial factorin foreign R&D expenditure・
(Note18)SubtractinglfromthequotientoftheexchangerateandtheR&DPPPgivesusapercen[agefigure.
(Note19)Thecorrelationcoefficientofthe3-yearmOVingaverageof,theexchangeratetoR&DPPPratio’
Witha3-yeartimelagovertheperiod1977-1992andforeignR&Dexpenditure(1985fixedprices)is-0.82.
Making’theexchangeratetoR&DPPPratio’thedescrlPtlVeVariableXandforeignR&Dexpenditure[he
SPeCinedvariableY,aSimpleregressioncalculationcanbedone:
Y=一122932.85X+34188.98 R2=0.672
(testt) (-5・4) (10.1)
30

Figure8-1JapaneseCompanies,R&DExpendituresto
ForeignCountries
88
78
68
58
48
削
28
18
8
Fjgure8-2 RatioofExchangeRatetoR&DPPPand
R&DExpenditurestoForei9nCountries
ノ.
′ヽ-.、._
′
・.一一.‾.一、-..ヽノー-.一、
\ 、 / ド .・・
ド
l l l l l l l l l l l l l l l l l l l l l19 7 1 19 7 3 19 7 5 19 7 7 19 7 9 1!姶I l∞ 1⊆給5 1≦拾7 19 甜 1⑬ l
1972 1974 1976 1978 19掬 lS吟2 1984 1986 1988 1998
Ra[ioofexchangc
ratetoR&DPPP
31
R&Dexpenditures
toforelgnCOllntries
(Rateofincrease
topreviousyear)

5.ConcJusions
(1)Caution against usingICP PPP for R&D expenditure
ICP PPP assumes a final demand structure for the entire economy,
While R&D expenditureis primarily composed of research personnel
expenditure and expenditure for the purchase of fixed assets for
research・ ConsequentlY,the calculation basis of such a PPP
makesit unsuited for application to R&D.
(2)Calculations of R&D PPPs
Our R&D PPPs were calculated on the basis of R&D expenditure
StruCture・ These are estimated figures,aPPiying the method01ogY
Of =CP PPPs to R&D and making g00d use ofICP PPPs data as well
as statistics from the countries under study. According to these
Calculations,1992 R&D PPP against the U.S.dollarindicates a
17% stronger yen than that Yielded by theICP,s GDP PPP・ R&D PPP
makes comparisons of actual purchasing powerin the research
field possible・(Note 20)
Research conductedin1992 by our researchinstitute[10]also
developed values for R&D PPPs,and this research has beenim-
PrOVed onin a number of ways to produce the present report・
Aslong as thereis a clear correspondence between the expendi-
ture breakdown of a particular field andICP PPPs′ Our Calcula-
tion method can be used to measure the PPPs of fields other than
research.
(3)P01icyimplications of R&D PPPs
R&D PPPs reveal the real v0lume of g00ds and services being
investedin R&Dinindividual countries,and comparisons between
real and nominal v01umes should prove especially useful to coun-
tries and corporations at a time when exchange rates are subject
to such fluctuation.
By sheddinglight on the realinvestments being madein science
and techn010gy around the worldr the application of R&D PPPsis
Of great benefitin decisions concerning science and techn010gY
investments・Thisindex provides basic data forinternational
(Note20)Inthisreport,Wehaveusedthe1985calculationsofICPPPPs・Seenotel・
32

research measuring the relationship between science and techn010-
gy and the economyJ andit can even be used to explain theinter-
nationalization of corporate R&D・Furthermorel R&D PPPs can be
appliedininternational comparative analyses of the costs of
manpower and g00dsinvestedin R&D・
(4)Promotion of R&D PPPs calculation worldwide
R&D PPPis anindexinv01ving multiple countries′ andits calcu-
1ation requires a variety of economic statistics on prices and
production.Regardless of the exact method01ogY adopted′ Calcula-
tions of R&D PPPs byinternational organizations would be wel-
COme′ and we hope that our research will serve as a reference for
OECD and otherinternational organizationsin developing these
indexes.
Statistical data from even more countries of the type usedin our
researchis neededin calculating R&D PPPs・ We hope that more
COmPlete statistics wil1be compiled on economic society and
SCience and techn010gy so that concurrent and standardized data
for countries worldwide can be made available.
6.Pointsrequlrlngfurtherdiscussion
(1) Examination of statistical values
Zn this report we have calculated the R&D PPPs assuming certain
R&D expenditure characteristics on the basis of ZCP PPPs. A more
accurate calculation would require detailed data on R&D expendi
ture and analYSis of eachitem′s pricelevelinJapan and
OVerSeaS・The f0110wing are the keY POints requiring examination・
(a) A breakdown of R&D expenditure;PerSOnnel expenditure for
researchers,Whichis thelargest expenditureitem;and especial-
1y the precise number of researchers and people engagedin re-
SearCh and their wagelevelsin several countries
(b)The capabilitY胃 Or SenioritY-based wage structure coverinq
researchersin each countrYr and a calculation of theinterna-
tional average personnel expenditure・
(2)Analysis of expenditure byindividual data
In addition to the examination of statistical values at(l)
33

above′ We Can COnSider analyses of expenditure atindividual
researchinstitutions or of theinternational price marginin
research-related equiPment and material.
(3) Use ofICP PPPs for1990
(4) Calculation of R&D PPPs for eachindustries
7.Finalcomments
Though GDP PPPs arein wide use now/Our rePOrt reCOmmends that a
SeParate and more relevant pPP be calculated for R&D expenditure・
The difficultY Of obtaining sufficient data presents a fundamen-
tal problemin developing R&D PPPs・ We have adopted some new
ideasin this reportr such as employinginput一OutPut tables′ tO
enhance statistical understanding of R&D.and we hope that R&D
PPP will play animportant r01ein formulating both national
P01icY and corporate R&D strateg‘Y・Indexes such as this are
usually developed through a process of trial and error. We would
like to think that our research will proveinstructive for future
research on R&D PPPs・ As more science and techn010gyindexes are
established,We hope that OECD and otherinternational organiza-
tions will again take up the task of developing R&D PPPs・
8.Bibliography
[1]OECD,Department of Economics and Statistics,,Purchasing
Power Parities and Real Expendituresin the OECD 1985’,
OECD′1987
[2]Michael ward′ ′Purchasing Power Parities and Real Expen-
dituresin the OECD,,OECD.1985
[3]Statistics Bureau,Hanag‘ement and C00rdination Agency′Japan,
,Report on the SurveY Of Research and Development’,1985
[4]A.S.MacDonald′ ′Exchange Rates for National Expenditure on
Research and Development,,,The EconomicsJournal’,June
′1973
[5]OECD,,TrendsinIndustrial R&D1967-1975,,Annex =I,工I,1979
[6]OECD′ ′The Measurement of Scientific and Technical Activities
-.Frascati Manual 1980日′
34
Japanese translation:Statistics BureauT Prime Hinister,s
Office′ ′Frascati Manua11980′′ March1983
[7]OECD,1992 Frascati Manual Draft,Januaryl993
[8]K=BA Takao′ WATANABE Yuhei,,Use of Purchasing Power Parities
in Znternational Comparisons of R&D Expenditure′′ National
Institute of Science and Techn010gY PolicY
Research Paper No.27,December1992
[9]SAKUm=tsuo′ ′The Present State of and =ssuesin Purchasing
Power Parity Measurement′/JapanInstitute of Labor Magazine′
July1989 ed土t⊥on
l10]ESCAP,,Purchasing Power ParitY and QuantitY Comparison for
the ESCAP RegiOn,,1985
[11]OECD,,Basic Science and Techn010gY Statistics’
[12]NSF,,Research and DevelopmentinIndustryin1983(NSF85-
325)’,United States,1984
[13]Korean =ndustry& Techn010gy Promotion Council,,Survey of
Hajor Zndustry and Techn010gY Statistics,,South Korea
l14]Manag‘ement and C00rdination AgencY,Japan,’=nput胃 Output
Tables′
[15]HinistrY Of =nternational Trade and ZndustrY,Japan,’Japan-
U・S・Znput-Output Tables’
[16]Ministry of Tnternational Trade and =ndustrY′Japan,’Japan-
France fnput胃Output Tables,
[17]Asia Economic Research 工nstitute′ ′Japan-South Korea Input-
Output Tables,
[18]Japan:National Personnel AuthoritY,,Fact-finding Survey on
Private Sector Salaries,
[19]U・S・Commission on Professionalsin Science and Techn01ogY,
’Salaries of Scientists,EngineerS,and Technicians,,USA
35

ー:二二_-∵ィ.t. .‾一一/
冊胴紺冊11011°10435◎