DCE-MRI for Oncology in R
22
DCE-MRI for Oncology in R Summary DCE-MRI T1 Estimation Kinetic Parameters End Bibliography Dynamic Contrast-Enhanced Magnetic Resonance Imaging for Oncology in R Brandon Whitcher PhD CStat Mango Solutions London, United Kingdom www.mango-solutions.com [email protected] @MangoImaging 12 June 2012 – useR!2012 Tutorial
-
Upload
brandon-whitcher -
Category
Software
-
view
120 -
download
0
Transcript of DCE-MRI for Oncology in R
DCE-MRI forOncology in R
Summary
DCE-MRI
T1 Estimation
KineticParameters
End
Bibliography
Dynamic Contrast-Enhanced MagneticResonance Imaging for Oncology
in R
Brandon Whitcher PhD CStat
Mango SolutionsLondon, United Kingdom
@MangoImaging
12 June 2012 – useR!2012 Tutorial

DCE-MRI forOncology in R
Summary
DCE-MRI
T1 Estimation
KineticParameters
End
Bibliography
Outline
1 Summary
2 Dynamic Contrast-Enhanced MRI
3 T1 Estimation and Contrast Agent Concentration
4 Kinetic Parameter Estimation
5 Conclusions
DCE-MRI forOncology in R
Summary
DCE-MRI
T1 Estimation
KineticParameters
End
Bibliography
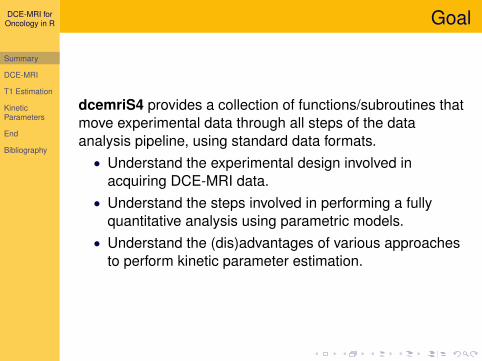
Goal
dcemriS4 provides a collection of functions/subroutines thatmove experimental data through all steps of the dataanalysis pipeline, using standard data formats.• Understand the experimental design involved in
acquiring DCE-MRI data.• Understand the steps involved in performing a fully
quantitative analysis using parametric models.• Understand the (dis)advantages of various approaches
to perform kinetic parameter estimation.
DCE-MRI forOncology in R
Summary
DCE-MRI
T1 Estimation
KineticParameters
End
Bibliography
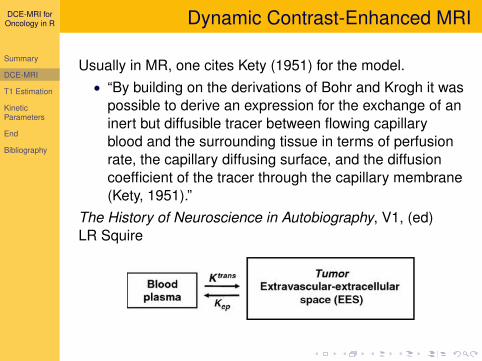
Dynamic Contrast-Enhanced MRI
Usually in MR, one cites Kety (1951) for the model.• “By building on the derivations of Bohr and Krogh it was
possible to derive an expression for the exchange of aninert but diffusible tracer between flowing capillaryblood and the surrounding tissue in terms of perfusionrate, the capillary diffusing surface, and the diffusioncoefficient of the tracer through the capillary membrane(Kety, 1951).”
The History of Neuroscience in Autobiography, V1, (ed)LR Squire

DCE-MRI forOncology in R
Summary
DCE-MRI
T1 Estimation
KineticParameters
End
Bibliography
Data Analysis Pipeline
The quantitative analysis of DCE-MRI data in dcemriS4consists of the following steps
1 Pre-processing of the T1 signal (e.g., motion correction,co-registration, correction of the B1 field)
2 Estimation of voxel-wise contrast agent concentrationtime curves
3 Determination of the arterial input function (AIF), eitherfrom the literature or by data-driven methods
4 Parameter estimation for a given compartmental model5 Statistical inference on kinetic parameters for
differences between scans of a single patient orbetween distinct patients
DCE-MRI forOncology in R
Summary
DCE-MRI
T1 Estimation
KineticParameters
End
Bibliography
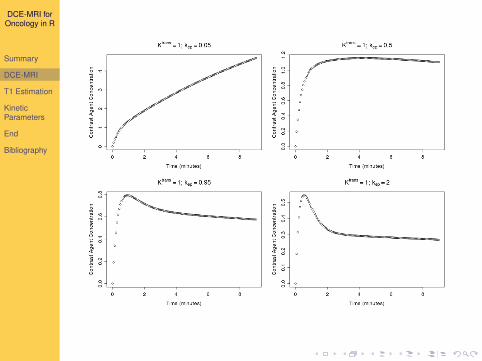
Parametric Models
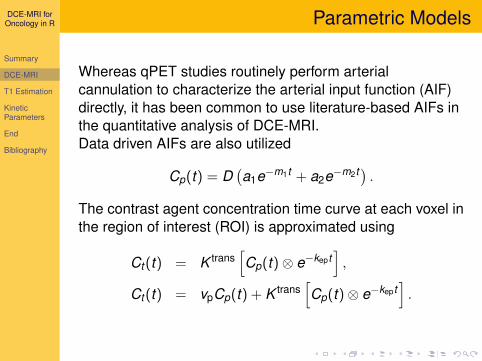
Whereas qPET studies routinely perform arterialcannulation to characterize the arterial input function (AIF)directly, it has been common to use literature-based AIFs inthe quantitative analysis of DCE-MRI.Data driven AIFs are also utilized
Cp(t) = D(a1e−m1t + a2e−m2t) .
The contrast agent concentration time curve at each voxel inthe region of interest (ROI) is approximated using
Ct(t) = K trans[Cp(t)⊗ e−kept
],
Ct(t) = vpCp(t) + K trans[Cp(t)⊗ e−kept
].
DCE-MRI forOncology in R
Summary
DCE-MRI
T1 Estimation
KineticParameters
End
Bibliography
DCE-MRI forOncology in R
Summary
DCE-MRI
T1 Estimation
KineticParameters
End
Bibliography
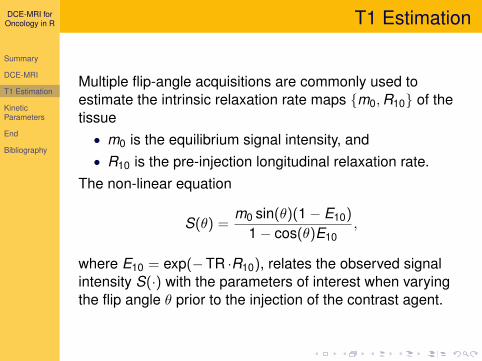
T1 Estimation
Multiple flip-angle acquisitions are commonly used toestimate the intrinsic relaxation rate maps {m0,R10} of thetissue• m0 is the equilibrium signal intensity, and• R10 is the pre-injection longitudinal relaxation rate.
The non-linear equation
S(θ) =m0 sin(θ)(1− E10)
1− cos(θ)E10,
where E10 = exp(−TR ·R10), relates the observed signalintensity S(·) with the parameters of interest when varyingthe flip angle θ prior to the injection of the contrast agent.
DCE-MRI forOncology in R
Summary
DCE-MRI
T1 Estimation
KineticParameters
End
Bibliography
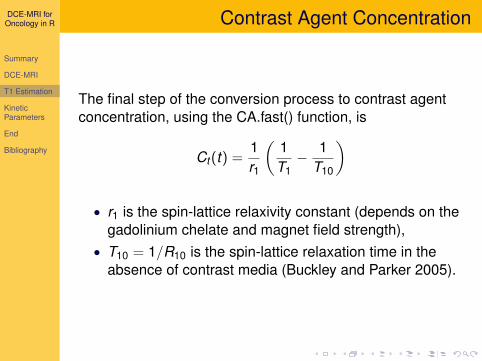
Contrast Agent Concentration
The final step of the conversion process to contrast agentconcentration, using the CA.fast() function, is
Ct(t) =1r1
(1T1− 1
T10
)
• r1 is the spin-lattice relaxivity constant (depends on thegadolinium chelate and magnet field strength),
• T10 = 1/R10 is the spin-lattice relaxation time in theabsence of contrast media (Buckley and Parker 2005).
DCE-MRI forOncology in R
Summary
DCE-MRI
T1 Estimation
KineticParameters
End
Bibliography
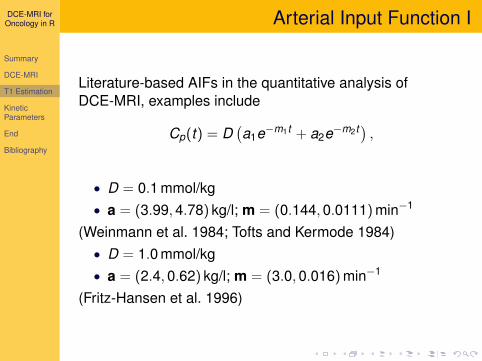
Arterial Input Function I
Literature-based AIFs in the quantitative analysis ofDCE-MRI, examples include
Cp(t) = D(a1e−m1t + a2e−m2t) ,
• D = 0.1 mmol/kg• a = (3.99,4.78) kg/l; m = (0.144,0.0111)min−1
(Weinmann et al. 1984; Tofts and Kermode 1984)• D = 1.0 mmol/kg• a = (2.4,0.62) kg/l; m = (3.0,0.016)min−1
(Fritz-Hansen et al. 1996)
DCE-MRI forOncology in R
Summary
DCE-MRI
T1 Estimation
KineticParameters
End
Bibliography
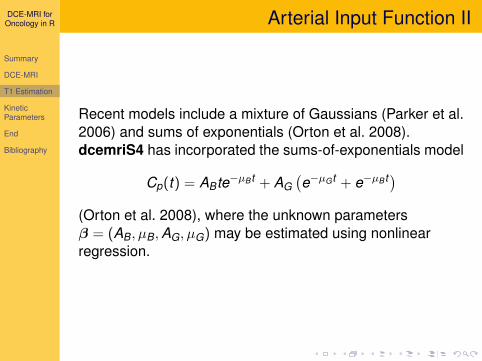
Arterial Input Function II
Recent models include a mixture of Gaussians (Parker et al.2006) and sums of exponentials (Orton et al. 2008).dcemriS4 has incorporated the sums-of-exponentials model
Cp(t) = ABte−µB t + AG(e−µGt + e−µB t)
(Orton et al. 2008), where the unknown parametersβ = (AB, µB,AG, µG) may be estimated using nonlinearregression.

DCE-MRI forOncology in R
Summary
DCE-MRI
T1 Estimation
KineticParameters
End
Bibliography
Kinetic Parameter Estimation
Parameter estimation in decmriS4 may be performed usingone of four options:
1 dcemri.lm(): Non-linear regression using non-linearleast squares (Levenberg-Marquardt optimization),
2 dcemri.map(): Bayesian maximum a posteriori (MAP)estimation (Nelder-Mead algorithm)
3 dcemri.bayes(): Fully Bayesian inference using Markovchain Monte Carlo (MCMC) (Schmid et al. 2006),
4 dcemri.spline(): Deconvolution via non-parametriccurve fitting using Bayesian penalized splines (withMCMC) (Schmid et al. 2009).
DCE-MRI forOncology in R
Summary
DCE-MRI
T1 Estimation
KineticParameters
End
Bibliography
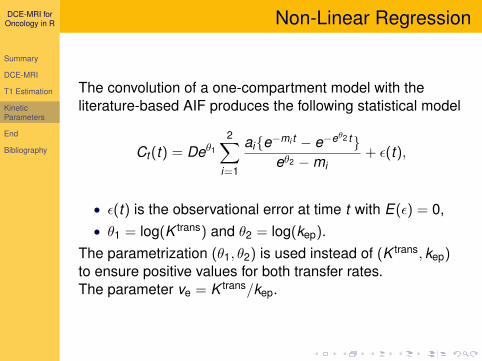
Non-Linear Regression
The convolution of a one-compartment model with theliterature-based AIF produces the following statistical model
Ct(t) = Deθ1
2∑i=1
ai{e−mi t − e−eθ2 t}eθ2 −mi
+ ε(t),
• ε(t) is the observational error at time t with E(ε) = 0,• θ1 = log(K trans) and θ2 = log(kep).
The parametrization (θ1, θ2) is used instead of (K trans, kep)to ensure positive values for both transfer rates.The parameter ve = K trans/kep.

DCE-MRI forOncology in R
Summary
DCE-MRI
T1 Estimation
KineticParameters
End
Bibliography
Non-Linear Regression Function
dcemri.lm()
Voxel-wise nonlinear regression model is applied to thecontrast agent concentration time curves.• Estimation, along with asymptotic standard errors,
obtained via Levenberg-Marquardt algorithm inminpack.lm.
• For the typical number of time points used in DCE-MRI,the estimation procedure is not well-behavedasymptotically and, thus, the asymptotic standarderrors may not be accurate.

DCE-MRI forOncology in R
Summary
DCE-MRI
T1 Estimation
KineticParameters
End
Bibliography
Bayesian Model
• Data model: we assume a signal-plus-noise model
Ct(t) ∼ N(f (K trans, kep, t), σ2).
• Process model: we use the single-compartment
f (K trans, kep, t) = DK trans2∑
i=1
ai(e−mi t − e−kept)
kep −mi.
• log(K trans) ∼ N(a(K trans),b(K trans)),• log(kep) ∼ N(a(kep),b(kep)),• a(K trans) = a(kep) = 0, and• b(K trans) = b(kep) = 1.
• Prior parameters: σ2 ∼ IG(a(σ2),b(σ2)), with defaultparameters a(σ2) = 1 and b(σ2) = 0.001.
DCE-MRI forOncology in R
Summary
DCE-MRI
T1 Estimation
KineticParameters
End
Bibliography
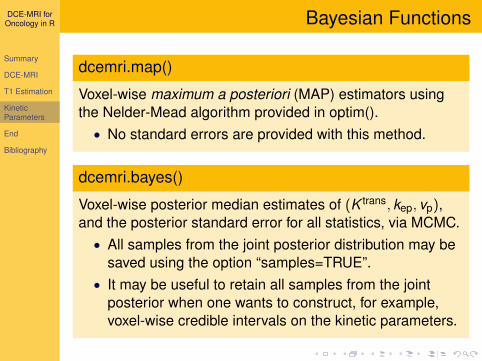
Bayesian Functions
dcemri.map()
Voxel-wise maximum a posteriori (MAP) estimators usingthe Nelder-Mead algorithm provided in optim().• No standard errors are provided with this method.
dcemri.bayes()
Voxel-wise posterior median estimates of (K trans, kep, vp),and the posterior standard error for all statistics, via MCMC.• All samples from the joint posterior distribution may be
saved using the option “samples=TRUE”.• It may be useful to retain all samples from the joint
posterior when one wants to construct, for example,voxel-wise credible intervals on the kinetic parameters.
DCE-MRI forOncology in R
Summary
DCE-MRI
T1 Estimation
KineticParameters
End
Bibliography
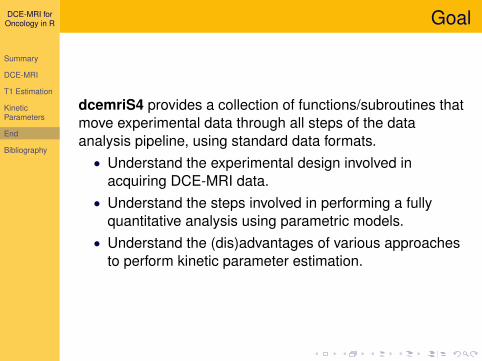
Goal
dcemriS4 provides a collection of functions/subroutines thatmove experimental data through all steps of the dataanalysis pipeline, using standard data formats.• Understand the experimental design involved in
acquiring DCE-MRI data.• Understand the steps involved in performing a fully
quantitative analysis using parametric models.• Understand the (dis)advantages of various approaches
to perform kinetic parameter estimation.
DCE-MRI forOncology in R
Summary
DCE-MRI
T1 Estimation
KineticParameters
End
Bibliography
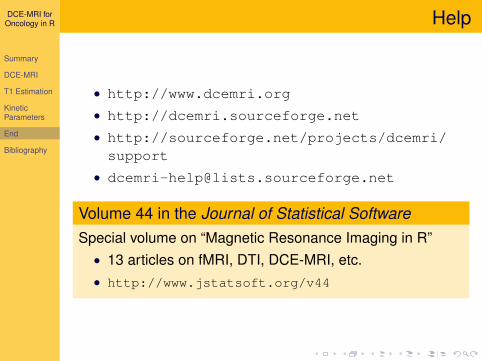
Help
• http://www.dcemri.org• http://dcemri.sourceforge.net• http://sourceforge.net/projects/dcemri/support
Volume 44 in the Journal of Statistical SoftwareSpecial volume on “Magnetic Resonance Imaging in R”• 13 articles on fMRI, DTI, DCE-MRI, etc.• http://www.jstatsoft.org/v44
DCE-MRI forOncology in R
Summary
DCE-MRI
T1 Estimation
KineticParameters
End
Bibliography
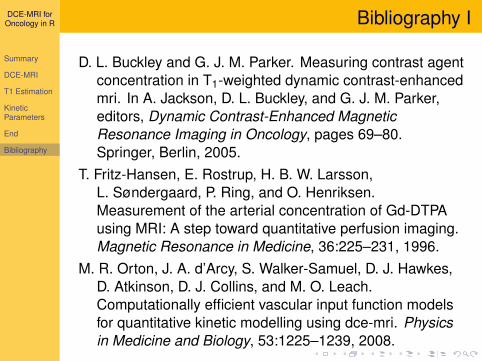
Bibliography I
D. L. Buckley and G. J. M. Parker. Measuring contrast agentconcentration in T1-weighted dynamic contrast-enhancedmri. In A. Jackson, D. L. Buckley, and G. J. M. Parker,editors, Dynamic Contrast-Enhanced MagneticResonance Imaging in Oncology, pages 69–80.Springer, Berlin, 2005.
T. Fritz-Hansen, E. Rostrup, H. B. W. Larsson,L. Søndergaard, P. Ring, and O. Henriksen.Measurement of the arterial concentration of Gd-DTPAusing MRI: A step toward quantitative perfusion imaging.Magnetic Resonance in Medicine, 36:225–231, 1996.
M. R. Orton, J. A. d’Arcy, S. Walker-Samuel, D. J. Hawkes,D. Atkinson, D. J. Collins, and M. O. Leach.Computationally efficient vascular input function modelsfor quantitative kinetic modelling using dce-mri. Physicsin Medicine and Biology, 53:1225–1239, 2008.
DCE-MRI forOncology in R
Summary
DCE-MRI
T1 Estimation
KineticParameters
End
Bibliography
Bibliography II
G. J. M. Parker, C. Roberts, A. Macdonald, G. A.Buonaccorsi, S. Cheung, D. L. Buckley, A. Jackson,Y. Watson, K. Davies, and G. C. Jayson.Experimentally-derived functional form for apopulation-averaged high-temporal-resolution arterialinput function for dynamic contrast-enhanced mri.Magnetic Resonance in Medicine, 56:993–1000, 2006.
V. Schmid, B. Whitcher, A. R. Padhani, N. J. Taylor, andG.-Z. Yang. Bayesian methods for pharmacokineticmodels in dynamic contrast-enhanced magneticresonance imaging. IEEE Transactions on MedicalImaging, 25(12):1627–1636, 2006.
V. J. Schmid, B. Whitcher, A. R. Padhani, and G.-Z. Yang.Quantitative analysis of dynamic contrast-enhanced mrimages based on bayesian p-splines. IEEE Transactionson Medical Imaging, 28(6):789–798, 2009.
DCE-MRI forOncology in R
Summary
DCE-MRI
T1 Estimation
KineticParameters
End
Bibliography
Bibliography III
P. S. Tofts and A. G. Kermode. Measurement of theblood-brain barrier permeability and leakage space usingdynamic mr imaging. 1. fundamental concepts. MagneticResonance in Medicine, 17(2):357–367, 1984.
H. J. Weinmann, M. Laniado, and W. Mutzel.Pharmacokinetics of gd-dtpa/dimeglumine afterintraveneous injection into healthy volunteers.Physiological Chemistry and Physics and Medical NMR,16:167–172, 1984.
DCE-MRI forOncology in R
Appendix
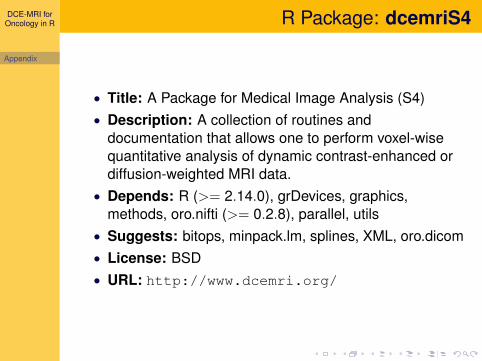
R Package: dcemriS4
• Title: A Package for Medical Image Analysis (S4)• Description: A collection of routines and
documentation that allows one to perform voxel-wisequantitative analysis of dynamic contrast-enhanced ordiffusion-weighted MRI data.
• Depends: R (>= 2.14.0), grDevices, graphics,methods, oro.nifti (>= 0.2.8), parallel, utils
• Suggests: bitops, minpack.lm, splines, XML, oro.dicom• License: BSD• URL: http://www.dcemri.org/