David Parsons WWRP and THORPEX International...
23
1 1 CAS MG3 October 2008 WWRP David Parsons WWRP and THORPEX International Programme Office (WMO) www.wmo.int/thorpex 2 CAS MG3 October 2008 WWRP Global Interactive Forecasting System – THORPEX Interactive Grand Global Ensemble Working Group Zoltan Toth and Philippe Bougeault GIFS-TIGGE WG Data Assimilation and Observing Strategies Working Group Florence Rabier and Pierre Gauthier DAOS WG Predictability and Dynamical Processes Working Group Heini Wernli and Istvan Szunyogh PDP WG Regional Committees Africa Asia Europe North America Southern Hemisphere International Project Office International Core Steering Committee Executive Committee THORPEX Organisational Structure Links to the WWRP SERA and the Joint Verification WGs Six weeks ago the Working Groups and the co-chairs of The Regional Committees met in Geneva to complete a strategic plan of work for the next few years
Transcript of David Parsons WWRP and THORPEX International...

1
1CAS MG3 October 2008
WW
RP
David Parsons
WWRP and THORPEX International Programme Office
(WMO)www.wmo.int/thorpex
2CAS MG3 October 2008
WW
RP
Global Interactive Forecasting System –THORPEX Interactive Grand Global Ensemble Working Group
Zoltan Toth and Philippe Bougeault
GIFS-TIGGE WG
Data Assimilation and Observing Strategies Working Group
Florence Rabier and Pierre Gauthier
DAOS WG
Predictability and Dynamical Processes Working Group
Heini Wernli and Istvan Szunyogh
PDP WG
Regional CommitteesAfricaAsiaEuropeNorth AmericaSouthern Hemisphere
International Project Office
International Core Steering Committee
Executive Committee
THORPEX Organisational Structure
Links to the WWRP SERA and the Joint Verification WGs
Six weeks ago the Working Groups and the co-chairs ofThe Regional Committees met in Geneva to complete astrategic plan of work for the next few years

2
3CAS MG3 October 2008
WW
RP
Predictability ANd Dynamics Of Weather Systems in the Atlantic-European Sector
SevereConvection
European Windstorms
MediterraneanCyclonesTropical
Cyclones
DFG funded Research Group PANDOWAE
4CAS MG3 October 2008
WW
RP
THORPEX Highlights for WGNE THORPEX Interactive Grand Global Ensemble (TIGGE)
THORPEX Cluster under the International Polar Year
THORPEX Africa and the developing world
THORPEX covered elsewhere
T-PARC (next presentation -- D. Parsons)
Report from Data Assimilation and Observation System Working Group including targeting (Florence Rabier)
Year of Tropical Convection (WGNE Co-chairs)
Weather-climate interface and THORPEX’s role in seamless prediction (Gilbert Brunet)
Some aspects of TIGGE in Ensemble Forecasting presentation (Tom Hamill)

3
5CAS MG3 October 2008
WW
RP
TIGGE partners and data flow
CAS MG3 October 2008
Slide 6
Slide 6
TIGGE objectives (agreed in March 2005)
Enhance international collaboration on ensemble prediction for severe weather
Collaboration between operational centres and universities
Develop theory and practice of multi-model ensembles
Examine the feasibility of interactive ensembles responding dynamically to changing uncertainty
Develop the concept of a Global Interactive Forecasting System (GIFS)
4
CAS MG3 October 2008
Slide 7
Slide 7
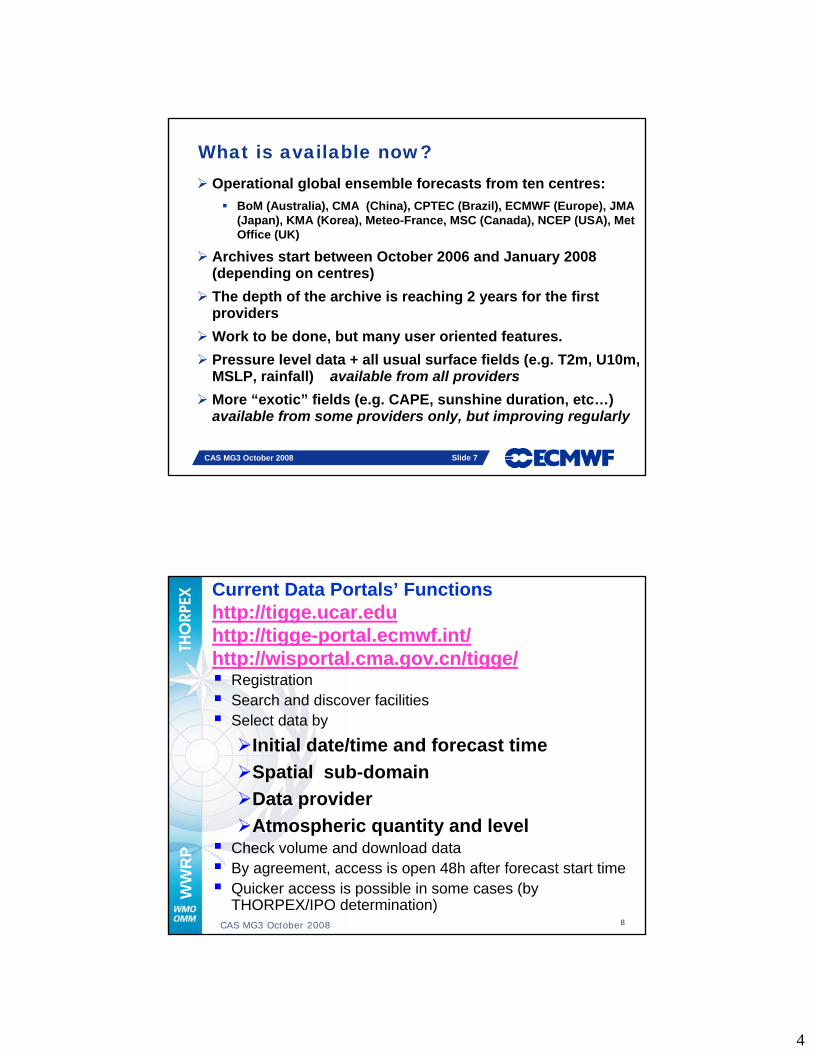
What is available now? Operational global ensemble forecasts from ten centres:
BoM (Australia), CMA (China), CPTEC (Brazil), ECMWF (Europe), JMA (Japan), KMA (Korea), Meteo-France, MSC (Canada), NCEP (USA), Met Office (UK)
Archives start between October 2006 and January 2008 (depending on centres)
The depth of the archive is reaching 2 years for the first providers
Work to be done, but many user oriented features.
Pressure level data + all usual surface fields (e.g. T2m, U10m, MSLP, rainfall) available from all providers
More “exotic” fields (e.g. CAPE, sunshine duration, etc…) available from some providers only, but improving regularly
8CAS MG3 October 2008
WW
RP
Current Data Portals’ Functionshttp://tigge.ucar.eduhttp://tigge-portal.ecmwf.int/http://wisportal.cma.gov.cn/tigge/ Registration Search and discover facilities Select data by
Initial date/time and forecast time
Spatial sub-domain
Data provider
Atmospheric quantity and level Check volume and download data By agreement, access is open 48h after forecast start time Quicker access is possible in some cases (by
THORPEX/IPO determination)

5
9CAS MG3 October 2008
WW
RP
Can MCGE Outperform the ECMWF Ensemble?
M. Matsueda and H. L. Tanaka -- SOLA, 2008.
Multi-Center Grand Ensembles (MCGEs) were constructed by combining five operational medium-range ensemble forecasts: CMC, ECMWF, JMA, NCEP, and UKMO with equal weights and no bias correction and compared to the ECMWF ensemble.
Seasonal Root Mean Square Error (RMSE) and the Ranked Probability Score (RPS) were derived for 500 hPa geopotential height over the Northern Hemisphere (20°N-90°N) from December 2006 to November 2007.
Deterministic and probabilistic verifications that the MCGEs generally outperformed the ECMWF ensemble at least in the medium forecast range (day 6-9) for all seasons.
The improvements in the RMSE and the RPS are several percentage points. These are almost comparable with the rate of improvement in a single-center ensemble forecast during the latest few years.
CAS MG3 October 2008
Slide 10
Slide 10
Recent research results based on TIGGE
Acknowledgments to
Young-Youn Park, KMA
Renate Hagedorn, ECMWF
Florian Pappenberger, ECMWF
Richard Swinbank et al., UK Met Office

6
Upper air variables
Significant differences in quality between the systems Up to 3 days differences in probabilistic forecast skill
Agreement between spread and skill is the most variable aspect and has a strong impact on probabilistic skill scores
In the Tropics the spread is underestimated by almost all systems
Impact of the verification analysis Relatively little impact in the extra-Tropics (as long as the analysis comes
from one of the best systems)
Large impact in the Tropics (and difficult to decide which is the best analysis)
Skill of multi-model system versus single-model systems Only marginal improvement in the extra-Tropics
Significant improvement in the Tropics (subject to significant bias corrections)
CAS MG3 October 2008
Slide 12
Slide 12
How about the surface weather?
Recently Johnson and Swinbank found that multi-model forecasts of T2m outperform significantly any single model EPS
Interpreted as a proof that the variety of physics (soil, vegetation, PBL) between the models captures better the uncertainty in surface parameters
Renate Hagedorn is currently trying to reproduce these results at ECMWF
Results depend strongly from the verification analysis (at variance from upper air variables)
Comparison with actual observations is necessary for T2m
Incidentally: T2m from TIGGE database at Fcst time=0 is NOT an analysis of T2m temperature (it is an “intelligent”vertical interpolation) - do not use it for verification!
7
CAS MG3 October 2008
Slide 13
Slide 13
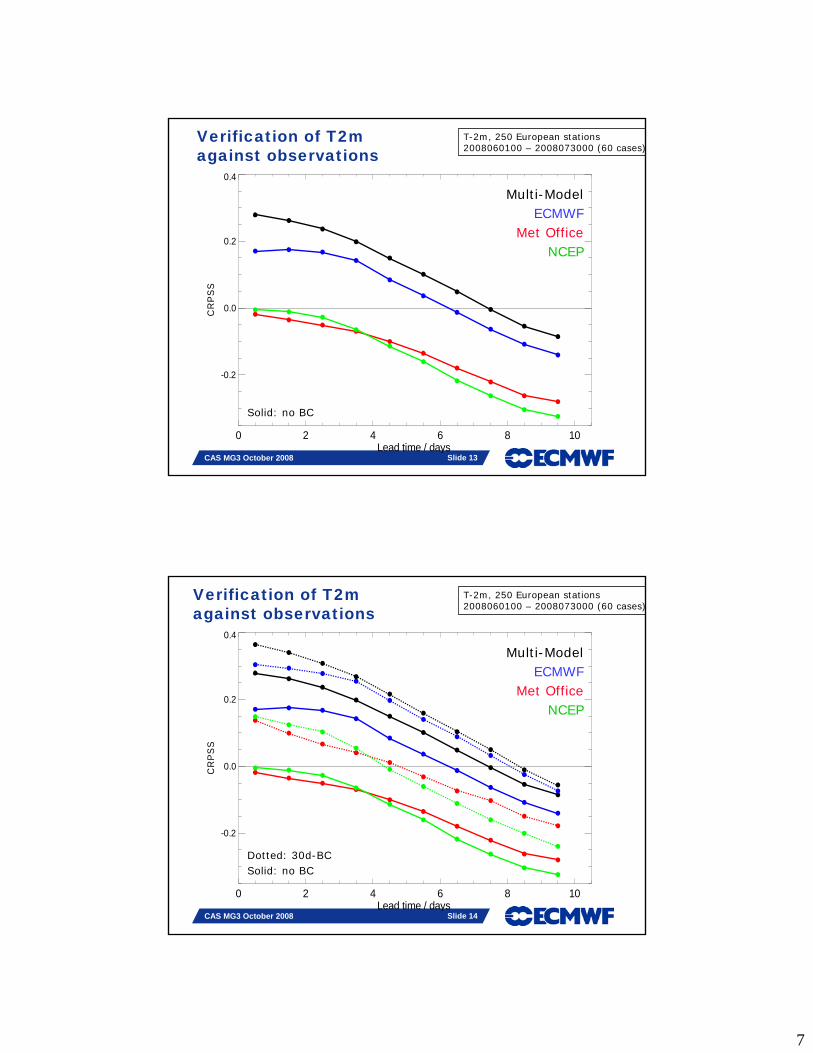
Verification of T2m against observations
0 2 4 6 8 10Lead time / days
-0.2
0.0
0.2
0.4
CR
PS
S
Multi-ModelECMWF
Met OfficeNCEP
Solid: no BC
T-2m, 250 European stations2008060100 – 2008073000 (60 cases)
CAS MG3 October 2008
Slide 14
Slide 14
0 2 4 6 8 10Lead time / days
-0.2
0.0
0.2
0.4
CR
PS
S
Verification of T2magainst observations
Multi-ModelECMWF
Met OfficeNCEP
Dotted: 30d-BCSolid: no BC
T-2m, 250 European stations2008060100 – 2008073000 (60 cases)
8
CAS MG3 October 2008
Slide 15
Slide 15
0 2 4 6 8 10Lead time / days
-0.2
0.0
0.2
0.4
CR
PS
S
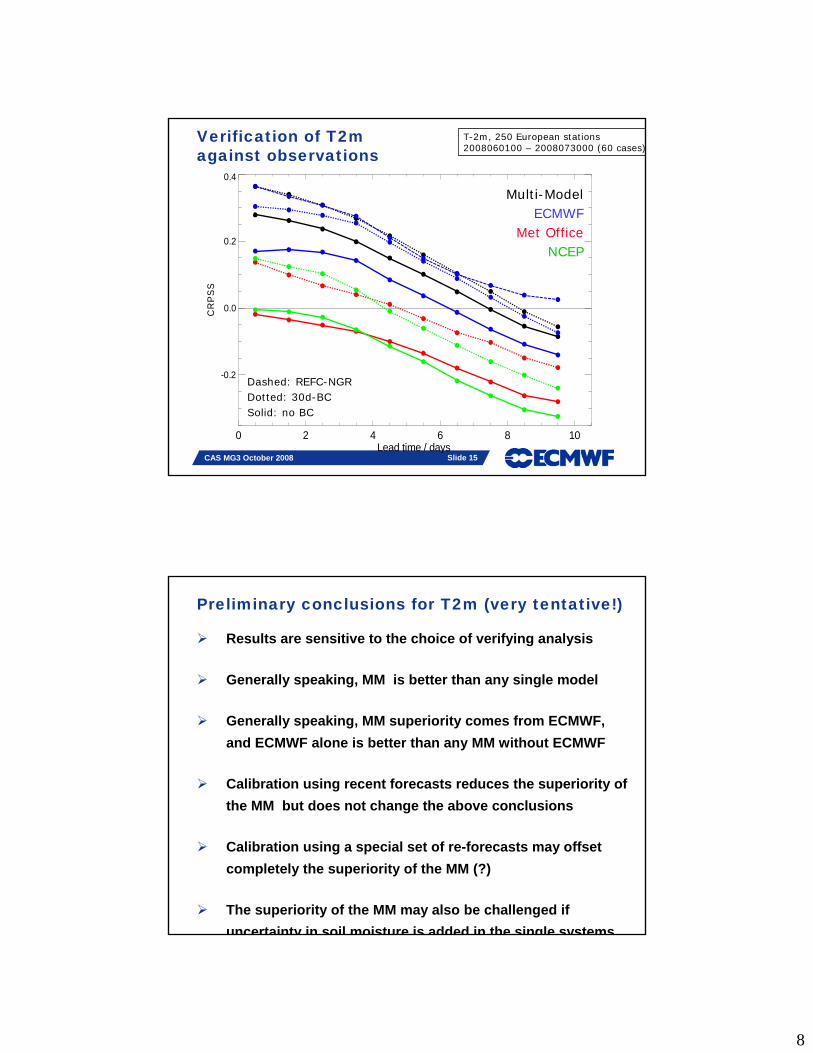
Verification of T2magainst observations
Multi-ModelECMWF
Met OfficeNCEP
Dashed: REFC-NGRDotted: 30d-BCSolid: no BC
T-2m, 250 European stations2008060100 – 2008073000 (60 cases)
Preliminary conclusions for T2m (very tentative!)
Results are sensitive to the choice of verifying analysis
Generally speaking, MM is better than any single model
Generally speaking, MM superiority comes from ECMWF,
and ECMWF alone is better than any MM without ECMWF
Calibration using recent forecasts reduces the superiority of
the MM but does not change the above conclusions
Calibration using a special set of re-forecasts may offset
completely the superiority of the MM (?)
The superiority of the MM may also be challenged if
uncertainty in soil moisture is added in the single systems

9
CAS MG3 October 2008
Slide 17
Slide 17
Additional work
Confirm results on longer time series, with more observations
Examine other weather parameters
Rainfall, 10m wind, clouds, etc….
Examine impact of multi-model on applications (end-to-end forecast systems)
Obvious example is with ensemble hydrological forecasts forced by TIGGE, and initial results are supporting superiority of MM
Use TIGGE MM as a benchmark to improve single-model systems
Real scientific progress would be to encapsulate all aspects of uncertainty in a single, optimal system: TIGGE can help us to locate and repair the deficiencies of existing operational EPSs
18
Multimodel Superensemble using TIGGE data over China
T. N. Krishnamurti, Anitha D. Sagadevan, Arindam Chakraborty & A. K. Mishra
Department of Meteorology, Florida State UniversityTallahassee, Florida USA

10
19
Multimodel Superensemble Experiment with TIGGE Data
Details of TIGGE Models:
for FSU multimodel suite only 5 members of TIGGE archive were used : ECMWF, UKMO, CMA, NCEP and BOM
Center Ensemble
Members
Model
Resolution
Forecast
Length
ECMWF 51 N200
(Reduced
Gaussian)
10 day
ECMWF 51 N128
(Reduced Gaussian)
10-15 day
UKMO 24 1.25 x 0.83 Deg 15 day
JMA 51 1.25 x 1.25 Deg 9 day
NCEP 21 1.00 x 1.00 Deg 16 day
CMA 15 0.56 x 0.56 Deg 10 day
CMC 21 1.00 x 1.00 Deg 16 day
BOM 33 1.50 x 1.50 Deg 10 day
MF 11 1.50 x 1.50 Deg 2.5 day
KMA 17 1.00 x 1.00 Deg 10 day
CPTEC 15 1.00 x 1.00 Deg 15 day
Forecast Period: May 2008 July 2008Training Period: February 2008 to April 2008
20
Model 3
Model 1
Model 4
Model N
Model 2
Train
ing T
ime S
eries
2)1( i
train
i ON
iSG
Multiple Linear Regression:
Training Phase
N
i
iii OFFaS1
)(
Foreca
sts
a1
a2
a3
a4
aN
Forecast Phase
Minimization of error term G.
Foreca
st Tim
e Series
Weights
Statistical weights obtained in the training phase are passed on to the forecast phase.
Superensemble Forecasts:
F => Forecasts O=>Observations ai => Weights. Overbar represents climatology.
In addition to removing the bias, the superensemble scales the individual model forecasts contributions according to their relative performance in the training period in a way that, mathematically, is equivalent to weighting them.

11
21
Influence of Asian Monsoon (in Eastern side) and Tropical System Frank (Fengshen) in
Western side on 26th Jun 2008
22
RMS Errors and Spatial Correlations of Day 1 and Day 2 Precipitation Forecastsvalid on 26th Jun 2008
Tropical System Frank (Fengshen)
Day 1 Day 2

12
23
Onset of South China Sea Monsoon 2008
24
RMS Errors and Spatial Correlations of Day 3 and Day 5 Precipitation forecasts valid on May 3rd 2008
Onset of South China Sea Monsoon
Day 3 Day 5
13
25CAS MG3 October 2008
WW
RP
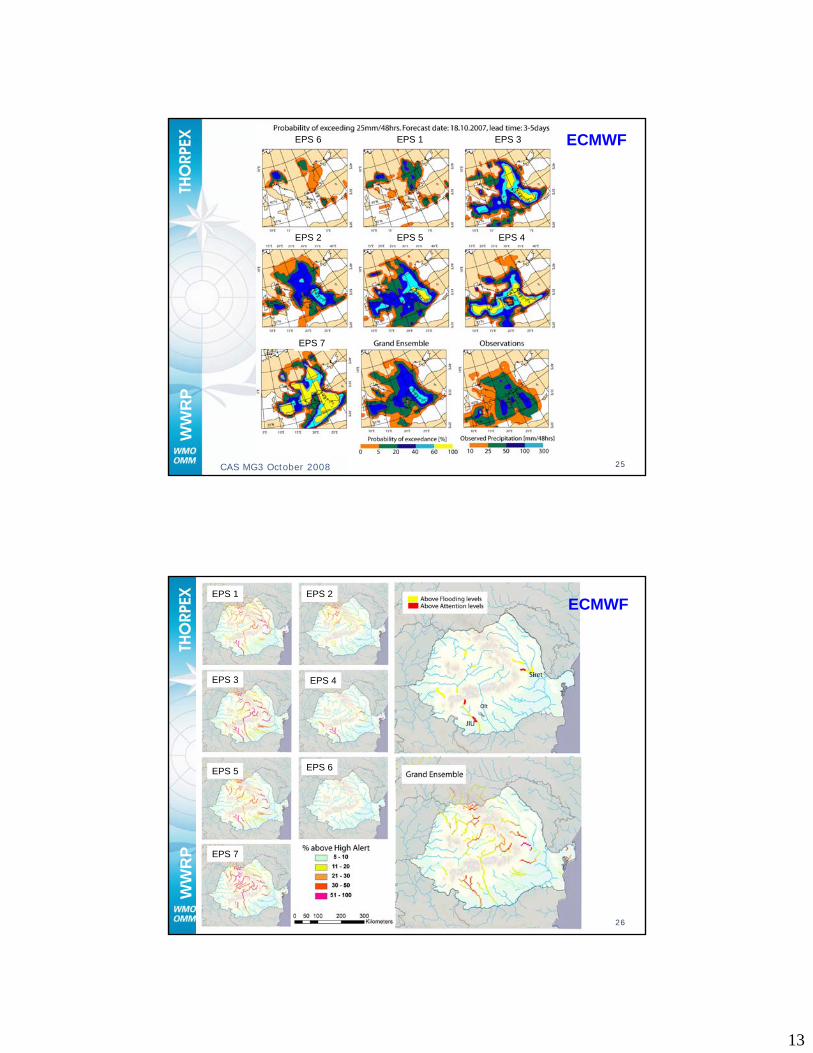
EPS 2
EPS 6 EPS 1 EPS 3
EPS 5 EPS 4
EPS 7
ECMWF
26CAS MG3 October 2008
WW
RP
EPS 1 EPS 2
EPS 3 EPS 4
EPS 5 EPS 6
EPS 7
ECMWF
14
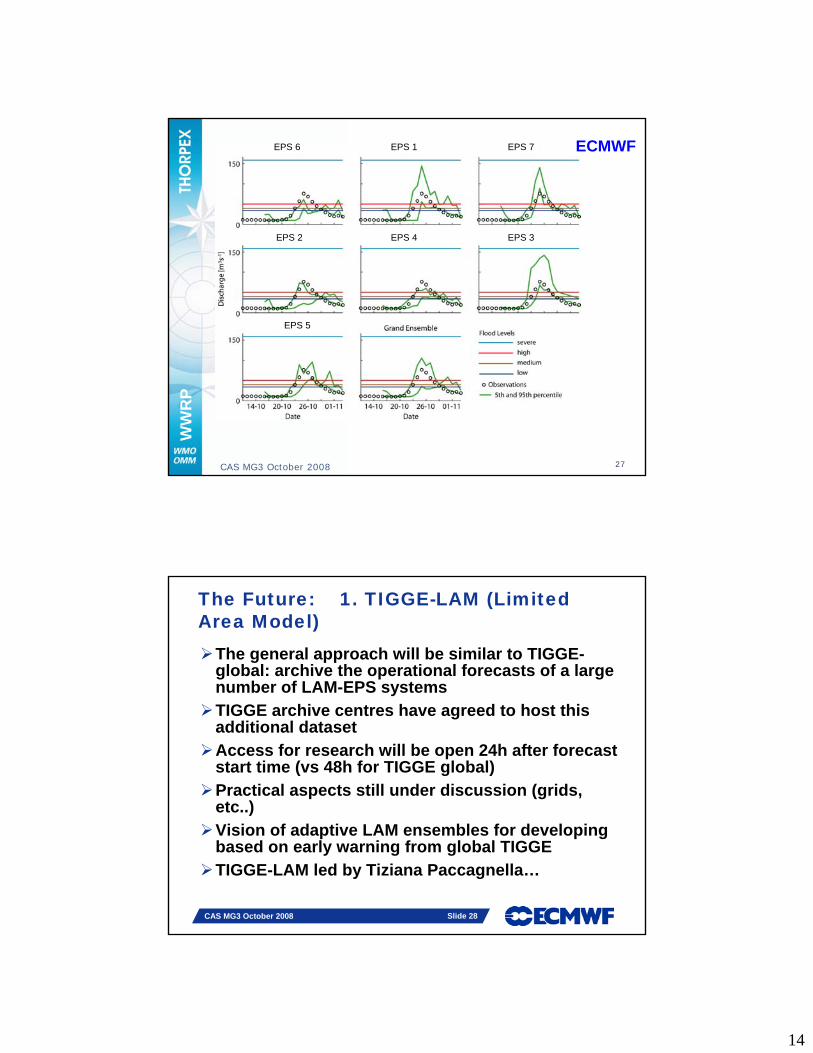
27CAS MG3 October 2008
WW
RP
EPS 6 EPS 1 EPS 7
EPS 2 EPS 4 EPS 3
EPS 5
ECMWF
CAS MG3 October 2008
Slide 28
Slide 28
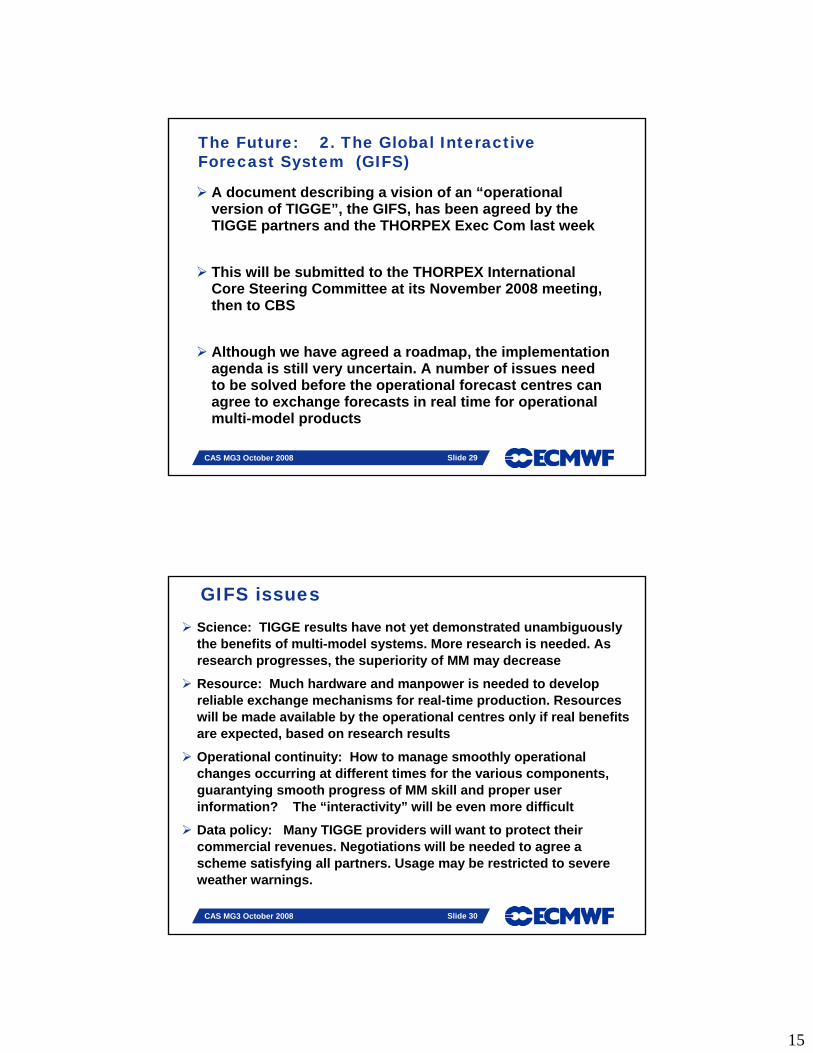
The Future: 1. TIGGE-LAM (Limited Area Model)The general approach will be similar to TIGGE-
global: archive the operational forecasts of a large number of LAM-EPS systems
TIGGE archive centres have agreed to host this additional dataset
Access for research will be open 24h after forecast start time (vs 48h for TIGGE global)
Practical aspects still under discussion (grids, etc..)
Vision of adaptive LAM ensembles for developing based on early warning from global TIGGE
TIGGE-LAM led by Tiziana Paccagnella…
15
CAS MG3 October 2008
Slide 29
Slide 29
The Future: 2. The Global Interactive Forecast System (GIFS)
A document describing a vision of an “operational version of TIGGE”, the GIFS, has been agreed by the TIGGE partners and the THORPEX Exec Com last week
This will be submitted to the THORPEX International Core Steering Committee at its November 2008 meeting, then to CBS
Although we have agreed a roadmap, the implementation agenda is still very uncertain. A number of issues need to be solved before the operational forecast centres can agree to exchange forecasts in real time for operational multi-model products
CAS MG3 October 2008
Slide 30
Slide 30
GIFS issues Science: TIGGE results have not yet demonstrated unambiguously
the benefits of multi-model systems. More research is needed. As research progresses, the superiority of MM may decrease
Resource: Much hardware and manpower is needed to develop reliable exchange mechanisms for real-time production. Resources will be made available by the operational centres only if real benefits are expected, based on research results
Operational continuity: How to manage smoothly operational changes occurring at different times for the various components,guarantying smooth progress of MM skill and proper user information? The “interactivity” will be even more difficult
Data policy: Many TIGGE providers will want to protect their commercial revenues. Negotiations will be needed to agree a scheme satisfying all partners. Usage may be restricted to severe weather warnings.

16
CAS MG3 October 2008
Slide 31
Slide 31
A symbolic initial step towards the GIFS
Starting with severe weather products is a good idea!
Most TIGGE partners have agreed to exchange data on tropical cyclone tracks in real-time, for the whole duration of the T-PARC experiment (June 2008 - March 2009)
A special format (CXML) has been developed to make these data more easy to interpret and use by the academic community
Data are available in real time from providers or from NCAR archive at http://dss.ucar.edu/datasets/ds330.3/
More information on CXML project web site http://www.bom.gov.au/bmrc/projects/THORPEX/CXML/index.html
CAS MG3 October 2008
Slide 32
Slide 32
Key Message for WGNE TIGGE is a major research infrastructure and every effort has been made to make it user-
friendly -- However, efforts to develop software tools are underfunded at some archive
centres.
About 100 “serious” users currently: THIS IS NOT ENOUGH -- Any action that WGNE can
undertake to increase research usage and answering the research questions posed by
TIGGE would be appreciated.
Demonstration project based on TIGGE Tropical Cyclones tracks
A TIGGE Users’ Meeting will take place in the frame of the next THORPEX Conference
(Monterey, 4-8 May 2009)
Will include tutorials and discussions with users to get feedback and decide about priorities for service improvements
17
CAS MG3 October 2008
Slide 33
Slide 33
Acknowledgments
BoM: Beth Ebert
CMA: Shi Peiliang, Yang Xin, Lang Honglian, Tian Hao
ECMWF: Baudouin Raoult, Manuel Fuentes, Joerg Urban
JMA: Shintaro Yokoi, Yoshiaki Takeuchi
KMA: Young-Youn Park
NCEP: Zoltan Toth, Gordon Brent
NCAR: Doug Schuster, Dave Stepaniak, Nathan Wilhelmi, Luca Cinquini, Steve Worley
UKMO: Richard Swinbank, Simon Thompson
UNIDATA: Steve Chiswell, Tom Yoksas
FSU: T. N. Krishnamurti et al
Meteorologisk Institutt met.noMeteorologisk Institutt met.no
The IPY-THORPEX Cluster10 individual projects
(see WMO Bulletin Oct. 2007)
The objectives of the IPY-THORPEX Cluster proposal are:
– Explore use of satellite data and optimised observations to improve high impact weather forecasts (form a Polar Trec and/or provide additional observations in real time to the WMO GTS)
– Better understand physical/dynamical processes in polar regions
– Achieve a better understanding of small scale weather phenomena
– Utilise improved forecasts to the benefit of society, the economy and the environment
– Utilise of TIGGE for polar prediction
18
Meteorologisk Institutt met.noMeteorologisk Institutt met.no
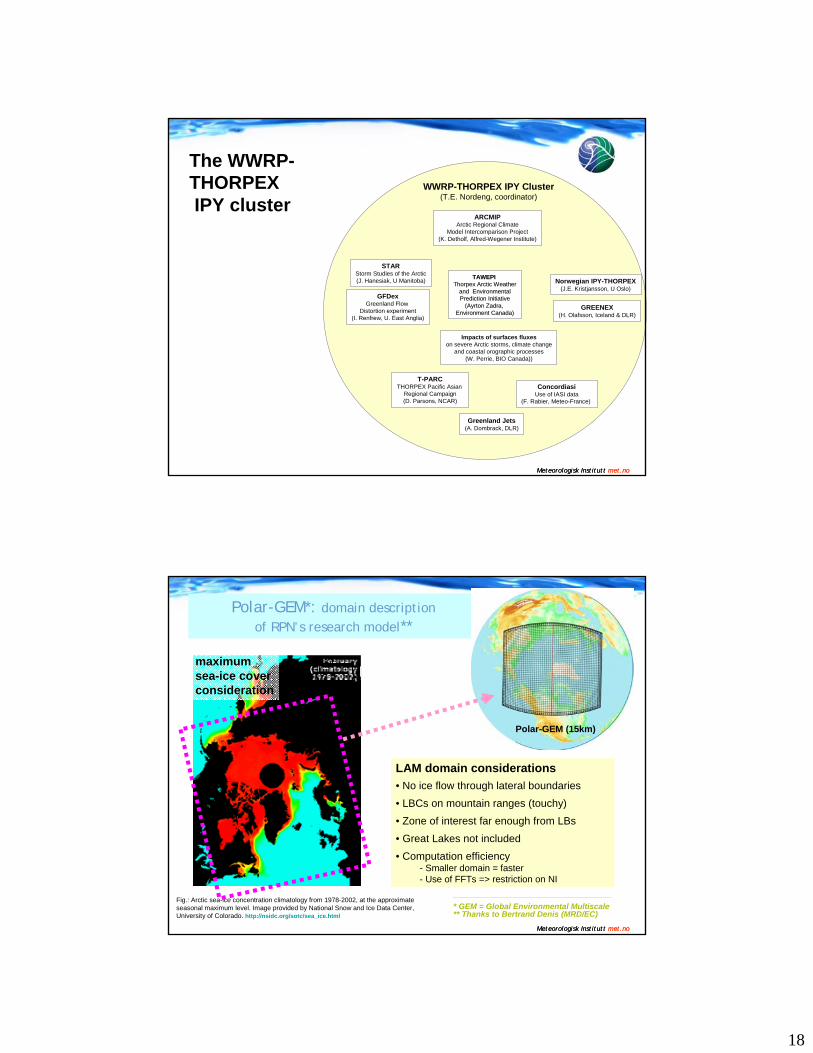
The WWRP-THORPEXIPY cluster
WWRP-THORPEX IPY Cluster(T.E. Nordeng, coordinator)
GFDexGreenland Flow
Distortion experiment(I. Renfrew, U. East Anglia)
STARStorm Studies of the Arctic(J. Hanesiak, U Manitoba)
ConcordiasiUse of IASI data
(F. Rabier, Meteo-France)
Norwegian IPY-THORPEX(J.E. Kristjansson, U Oslo)
Greenland Jets(A. Dombrack, DLR)
GREENEX(H. Olafsson, Iceland & DLR)
ARCMIPArctic Regional Climate
Model Intercomparison Project(K. Detholf, Alfred-Wegener Institute)
Impacts of surfaces fluxeson severe Arctic storms, climate change
and coastal orographic processes(W. Perrie, BIO Canada))
T-PARCTHORPEX Pacific Asian
Regional Campaign(D. Parsons, NCAR)
TAWEPITAWEPIThorpexThorpex Arctic WeatherArctic Weather
and Environmental and Environmental Prediction InitiativePrediction Initiative
((AyrtonAyrton ZadraZadra, , Environment Canada)Environment Canada)
Meteorologisk Institutt met.noMeteorologisk Institutt met.no
Polar-GEM*: domain descriptionof RPN’s research model**
Fig.: Arctic sea-ice concentration climatology from 1978-2002, at the approximate seasonal maximum level. Image provided by National Snow and Ice Data Center, University of Colorado. http://nsidc.org/sotc/sea_ice.html
____________________________________
* GEM = Global Environmental Multiscale** Thanks to Bertrand Denis (MRD/EC)
LAM domain considerations
• No ice flow through lateral boundaries
• LBCs on mountain ranges (touchy)
• Zone of interest far enough from LBs
• Great Lakes not included
• Computation efficiency- Smaller domain = faster- Use of FFTs => restriction on NI
Polar-GEM (15km)
maximum sea-ice cover consideration

19
Meteorologisk Institutt met.noMeteorologisk Institutt met.no
Meteorologisk Institutt met.noMeteorologisk Institutt met.no

20
Meteorologisk Institutt met.noMeteorologisk Institutt met.no
-38 -36 -34 -32 -30 -28 -26 -24 -22 -20 -18
temperature
1000
900
800
700
600
500
pres
sure
[hP
a]
total_HIRHAM
total_ARCSyM
total_COAMPS
total_RCA
total_REMO
total_RegCM
total_CRCM
ensemblemean
ecmwf
Temperature, winter, total
0.5 0.55 0.6 0.65 0.7 0.75 0.8 0.85
specific humidity [g/kg]
1000
950
900
850
800
750
700
pres
sure
[hP
a]
total_HIRHAM
total_ARCSyM
total_COAMPS
total_RCA
total_REMO
total_RegCM
ensemblemean
ecmwf
Specific humidity, winter
Remarkable scatter between model temperature and humidity profiles
(due to different radiation, cloud, PBL, and soil schemes)
Wrong surface fluxes, influence cloud formation and cloud properties
Temperature scatter in the order of 3°C (the range of climate scenarios) Key processes to be improved:
clouds, land surface- and boundary layer processes, coupling to ice-ocean
Intercomparison of temperature and humidity profiles for SHEBA domain, winter (Rinke, Dethloff et al., Climate Dyn., 2006)
40CAS MG3 October 2008
WW
RP
African Regional CommitteeActivities
THORPEX Workshop and meetings of the Working groups,Geneva, 22-26 September
Aïda Diongue Niang and Andre Kamga

21
41CAS MG3 October 2008
WW
RP
T-NAWDEXTHORPEX-
North Atlantic Waveguide and Downstream Impact Experiment
To be performed in 2011/2012 in conjunction with HYMEX
address the triggering of waveguide disturbances by different processes and the disturbances’ subsequent downstream evolution
study of the downstream impacts of the waveguide disturbances over Europe, the Mediterranean, and northern Africa
42CAS MG3 October 2008
WW
RP
HYMEX: Main Scientific Topics
Better understanding of the intense events: processes and contribution to the trend

22
43CAS MG3 October 2008
WW
RP
T-NAWDEX Planning
(1) Use HALO-Demonstration Mission HALO-THORPEXas nucleus for field phase
44CAS MG3 October 2008
WW
RP
T-NAWDEX Planning
Planning Workshop Spring 2009
Formulation of the Science Plan scientific aims and questions methods to address the questions (theoretical,
numerical, experimental) responsible persons
Implementation Plan
National/International Cooperation and fund raising
23
45CAS MG3 October 2008
WW
RP
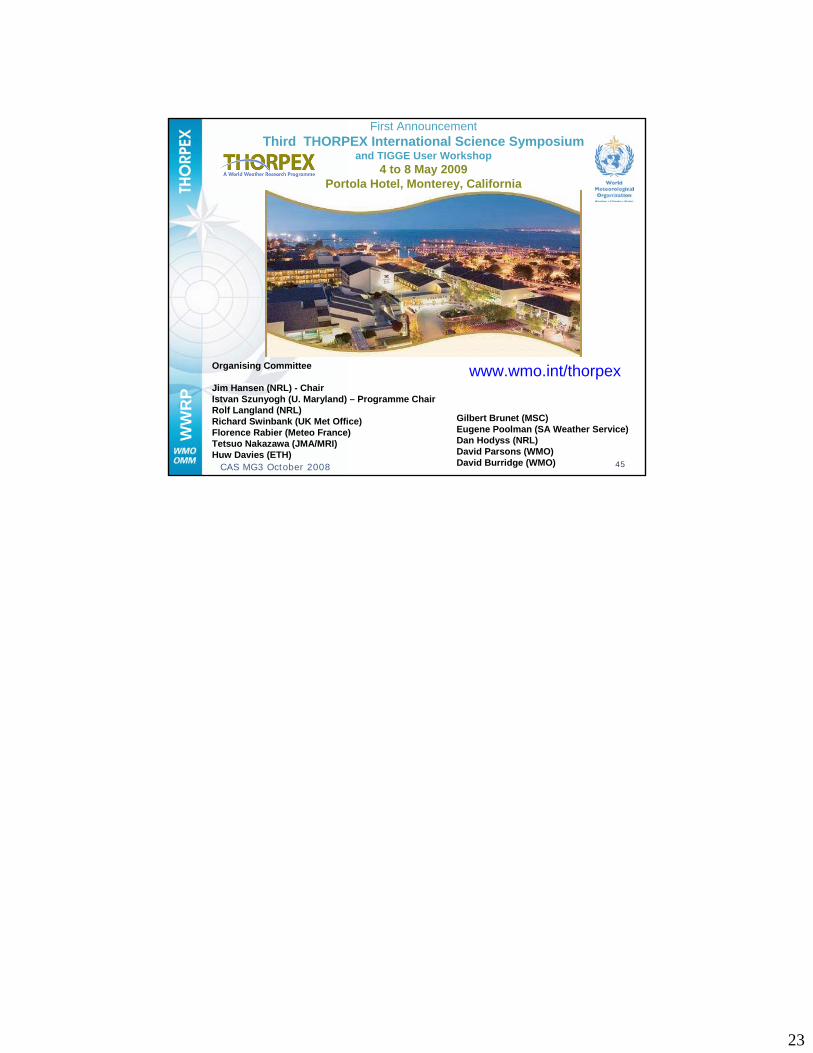
First AnnouncementThird THORPEX International Science Symposium
and TIGGE User Workshop4 to 8 May 2009
Portola Hotel, Monterey, California
Organising Committee
Jim Hansen (NRL) - ChairIstvan Szunyogh (U. Maryland) – Programme ChairRolf Langland (NRL)Richard Swinbank (UK Met Office)Florence Rabier (Meteo France)Tetsuo Nakazawa (JMA/MRI)Huw Davies (ETH)
Gilbert Brunet (MSC)Eugene Poolman (SA Weather Service)Dan Hodyss (NRL)David Parsons (WMO)David Burridge (WMO)
www.wmo.int/thorpex