Datacracy Demonstration
11
Congressional District 6 Data Review in Maps & Visualizations
-
Upload
greg-schundler -
Category
Data & Analytics
-
view
155 -
download
0
Transcript of Datacracy Demonstration
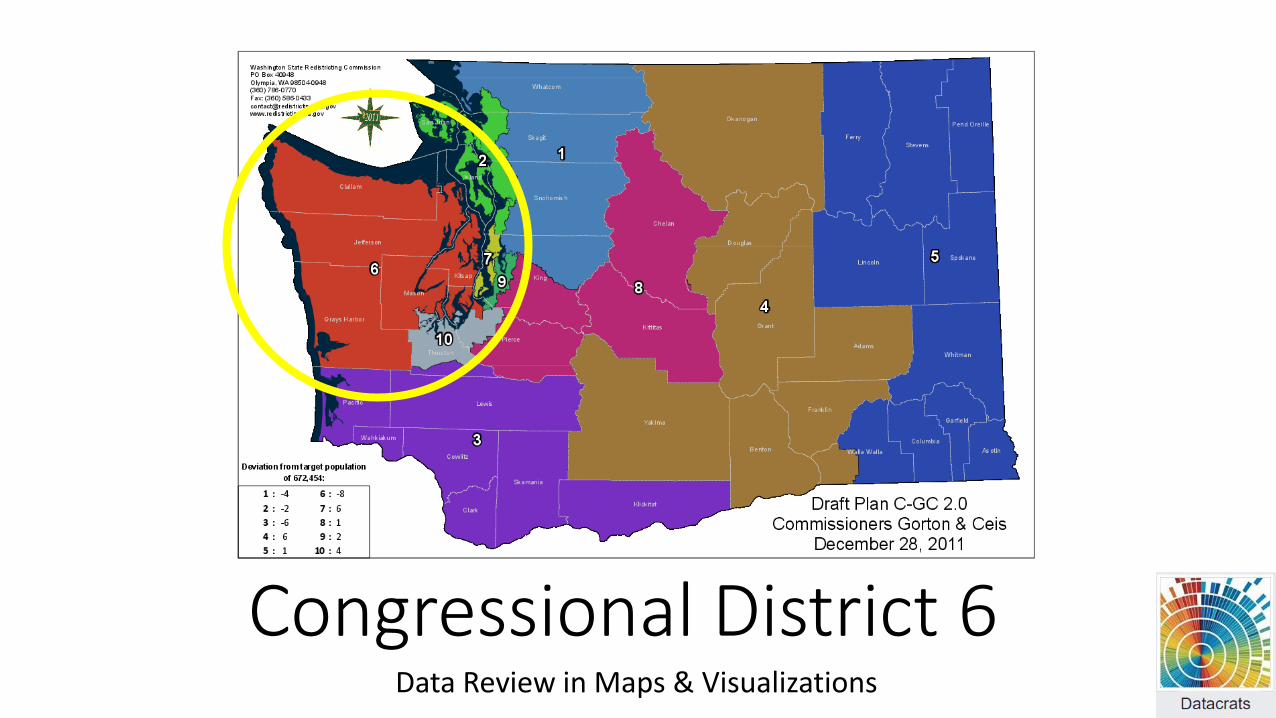
Congressional District 6Data Review in Maps & Visualizations


Male51%
Female49%
District 6 Gender Ratios
District 6 Demographics

Mexican6%
Puerto Rican1%
Cuban0%
Other Hispanic or Latino
1%
Not Hispanic or Latino92%
Native Hawaiian and Other Pacific
Islander0%
Some other race2%
American Indian and
Alaska Native2%
Black or African
American4%
Asian4% Two or more
races6%
White82%
District 6 Race & Ethnicity

West Indian (excluding Hispanic
origin groups)0%
Slovak0%
Lithuanian0%
Arab0%
Ukrainian0%
Portuguese1%
Hungarian1%
Greek1%
Subsaharan African
1%
Czech1% Swiss
1%
Russian1%
French Canadian1%Danish
1%
Welsh1%
Scotch-Irish2%Dutch
2%Polish
3%Italian
4%
French (except Basque)4%
Scottish4%
Swedish5%
American5%
Norwegian8%
English14%
Irish16%
German22%
District 6 Heritage
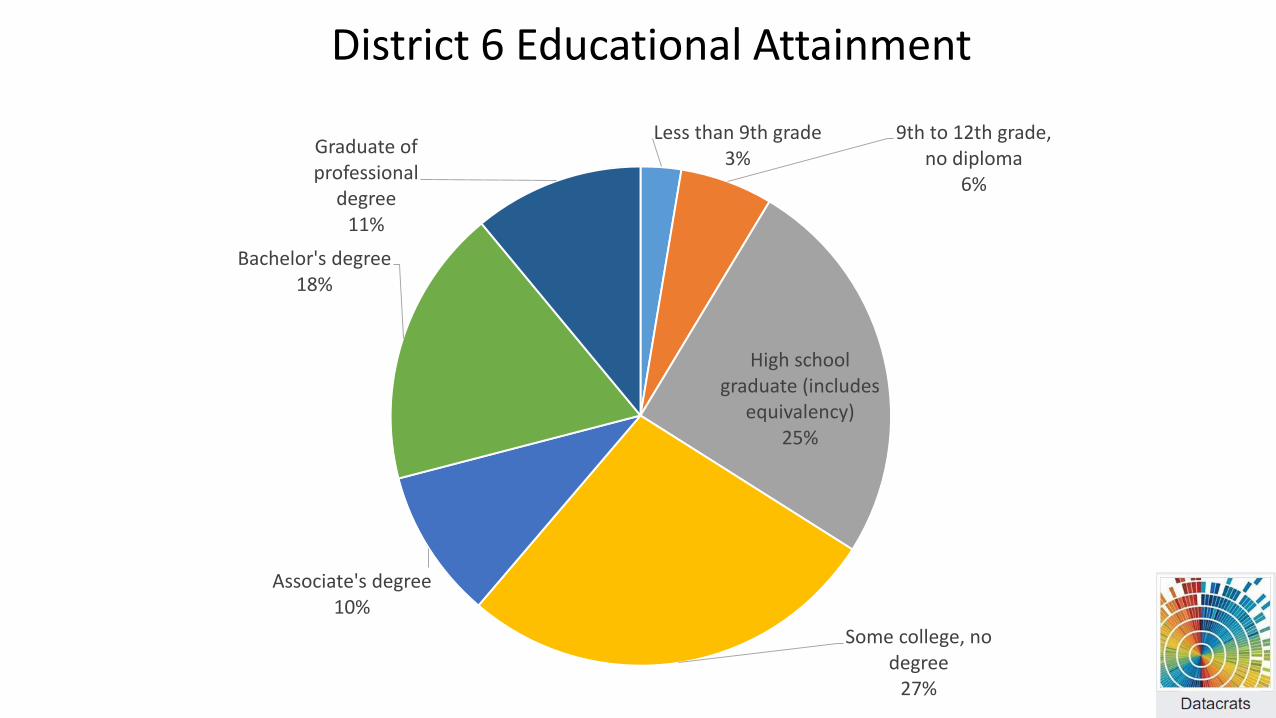
Less than 9th grade3%
9th to 12th grade, no diploma
6%
High school graduate (includes
equivalency)25%
Some college, no degree
27%
Associate's degree10%
Bachelor's degree18%
Graduate of professional
degree11%
District 6 Educational Attainment

Utilities0%
Agriculture, forestry, fishing and hunting
1%
Information1%
Transportation and warehousing
2%
Real estate and rental and
leasing2%Educational
services2%
Wholesale trade2%
Arts, entertainment, and recreation
2%
Management of companies and enterprises
3%Finance and insurance4%
Administrative and support and waste management and
remediation services5%Manufacturing
5%
Professional, scientific, and technical services
5%
Construction5%
Other services (except public administration)
6%
Accommodation and food services
12%
Retail trade17%
Health care and social assistance
26%
District 6 Employment (Jobs)

Industries not classified
0%
Mining, quarrying, and oil and gas
extraction0%
Utilities
1%
Agriculture, forestry, fishing and hunting
1% Arts, entertainment, and recreation
1%
Educational services2%
Transportation and warehousing
2%Real estate and rental and
leasing2%
Information2%
Wholesale trade3%
Management of companies and enterprises
3%
Other services (except public administration)
4%
Administrative and support and waste management and
remediation services4%
Accommodation and food services
6%
Manufacturing6%
Finance and insurance6%
Construction7%
Professional, scientific, and technical services
7%
Retail trade12%
Health care and social assistance
31%
District 6 Employment (Wages)

Mining, quarrying, and oil and gas extraction
0%
Utilities0%
Industries not classified0%
Management of companies and
enterprises0%
Educational services
1%
Agriculture, forestry, fishing and hunting
1%
Information1%
Arts, entertainment, and recreation
2%Transportation
and warehousing
2% Wholesale trade
3%Manufacturing3%
Administrative and support and waste management and
remediation services5%
Finance and insurance5%
Real estate and rental and leasing6%
Accommodation and food services10%
Other services (except public administration)
10%
Professional, scientific, and technical services
10%
Construction12%
Health care and social assistance12%
Retail trade14%
District 6 Employment (Establishments)

State-level Results for Outdoor Recreation

County-level results for Outdoor Recreation