DATA SERIES Safety performance indicators Process safety ...
48
REPORT 2014p NOVEMBER 2015 DATA SERIES Safety performance indicators – Process safety events – 2014 data
Transcript of DATA SERIES Safety performance indicators Process safety ...
REPORT
2014pNOVEMBER2015
DATA SERIES
Safety performance indicators –Process safety events – 2014 data
Disclaimer
Whilst every effort has been made to ensure the accuracy of the information contained in this publication, neither IOGP nor any of its Members past present or future warrants its accuracy or will, regardless of its or their negligence, assume liability for any foreseeable or unforeseeable use made thereof, which liability is hereby excluded. Consequently, such use is at the recipient’s own risk on the basis that any use by the recipient constitutes agreement to the terms of this disclaimer. The recipient is obliged to inform any subsequent recipient of such terms.
This publication is made available for information purposes and solely for the private use of the user. IOGP will not directly or indirectly endorse, approve or accredit the content of any course, event or otherwise where this publication will be reproduced.
Copyright notice
The contents of these pages are © International Association of Oil & Gas Producers. Permission is given to reproduce this report in whole or in part provided (i) that the copyright of IOGP and (ii) the sources are acknowledged. All other rights are reserved. Any other use requires the prior written permission of IOGP.
These Terms and Conditions shall be governed by and construed in accordance with the laws of England and Wales. Disputes arising here from shall be exclusively subject to the jurisdiction of the courts of England and Wales.
AcknowledgementsSafety Committee
Photography used with permission courtesy of ©psphotograph/iStockphoto (Back cover)
DATA SERIES
Safety performance indicators –Process safety events – 2014 data
Revision history
VERSION DATE AMENDMENTS
1.0 November 2015 First release
REPORT
2014pOCTOBER2015
4Process safety events – 2014 data
Contents
Contributing IOGP member companies 5
Executive summary 6
1. Introduction 8Data collection 9Narrative event descriptions 10Normalization 12Database dimensions 12
2. Overall results 15Sabotage/wilful damage 17Overall results onshore and offshore 18
3. Results by work function 20Drilling 20Production 22
4. Production results by activity 25Production Tier 1 25Production Tier 2 26
5. Results by consequence 27Tier 1 27Tier 2 29Injury as consequence 30Fire or explosion as consequence 31
6. Results by material released 32Tier 1 32Tier 2 33
Appendix A: Data tables 34
Appendix B: Company results 42
Appendix C: Report forms (for reference only) 44
5Executive summary
Contributing IOGP member companies
The 2014 statistics were derived from data provided by the following companies:
ADNOC
BASHNEFT
BG GROUP
BHP BILLITON
BP
CAIRN ENERGY
CAIRN INDIA
CHEVRON
CNOOC
CONOCOPHILLIPS
DOLPHIN ENERGY
DONG E&P
E.ON
EXXONMOBIL
GALP
GDF SUEZ E&P INTERNATIONAL
GENEL
HESS CORPORATION
HUSKY
INPEX
KUWAIT OIL COMPANY
MAERSK OIL
MARATHON OIL COMPANY
MOL
OMV
ORIGIN
PAN AMERICAN ENERGY
PAPUAN OIL SEARCH
PEMEX
PERENCO
PLUSPETROL
PREMIER OIL
PTTEP
RASGAS
REPSOL
SASOL
SHELL COMPANIES
STATOIL
SUNCOR
TALISMAN ENERGY
TOTAL
TULLOW OIL
WINTERSHALL
WOODSIDE
6Process safety events – 2014 data
Executive summary
IOGP published Report 456, Process Safety – Recommended Practice on Key Performance Indicators in November 2011 to provide guidance on Key Performance Indicators (KPI) to upstream companies for managing process safety hazards and risks and to prevent unplanned and uncontrolled loss of containment of materials.
2014p, Process safety events – 2014 data, is a further step towards making Process Safety Event (PSE) data and associated KPIs available to all stakeholders. The PSE data presented in this report are based on voluntary submissions from participating IOGP member companies and are not representative of the entire upstream oil and gas industry. Since the collation and reporting of these data is still relatively new, readers are cautioned not to attempt to identify trends at this point.
IOGP started a pilot process of data collection in 2010. Data for the years 2011-2013 have been previously published in Report 2013p.
Participating companies were asked to provide descriptive information for Tier 1 PSE reported for the first time for the year 2014. These, as well as the fatal incident and high potential event reports, were used by the data subgroup of the IOGP Process Safety Subcommittee as the basis for a new, extensive validation exercise to verify that the Tier 1 PSE, fatal incidents and high potential events PSE submitted were correctly categorized. As a result of this process clarification was sought from the submitting companies on a number of the data reports. A need was also identified to make changes to the reporting form which will simplify the validation process in the future. Tier 1 descriptions are at present only for the participating companies and quality assurance/verification of consistency.
The collection of PSE data has progressed, with the number of companies reporting increasing from 26 in 2011 to 32 in 2012, 39 in 2013 and 44 in 2014.
In this report, 2014 data are published together with 2011, 2012 and 2013 data.
A summary of 2011-2014 data can be found in Appendix A.
The Process Safety Events (PSE) data presented are based on the numbers of Tier 1 and Tier 2 PSE reported by participating IOGP member companies, separately for:
• onshore and offshore• drilling and production• activities• consequences• material released
Tier 3 and Tier 4 process safety KPIs are not included in this report but they are being considered for future data requests.
The Tier 1 and Tier 2 data presented have been normalized against work hours associated with drilling and production activities to provide PSE rates.
7Executive summary
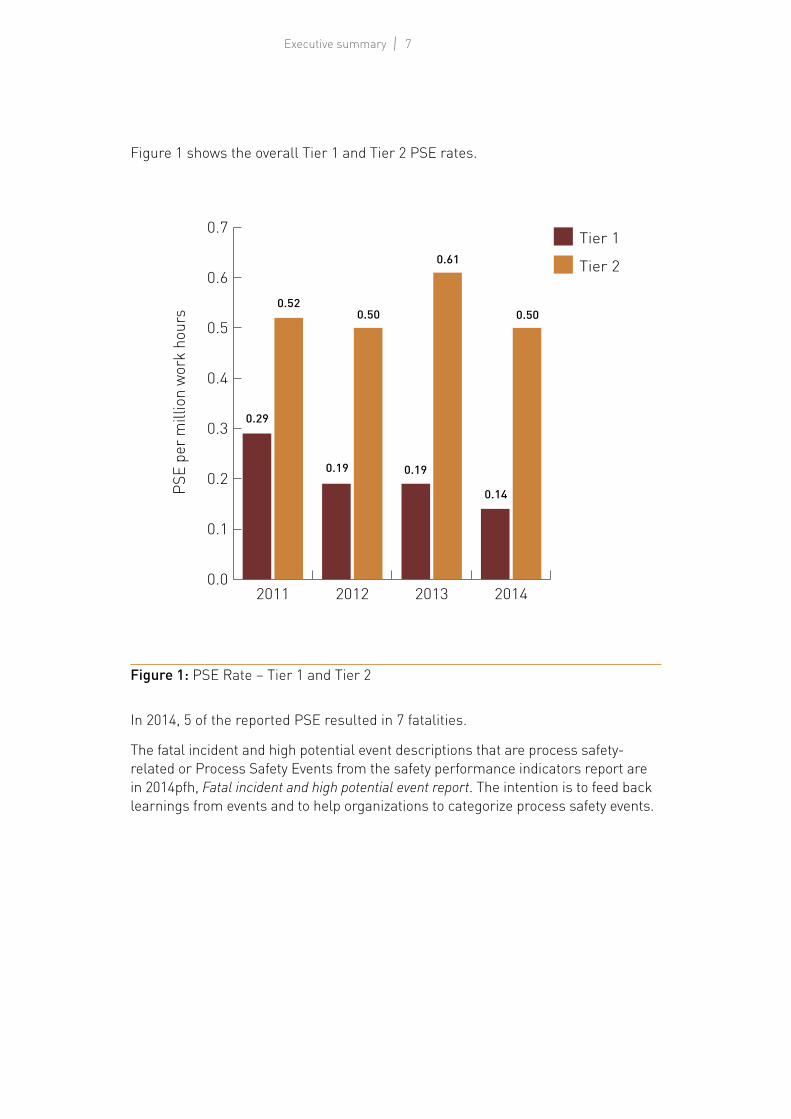
Figure 1: PSE Rate – Tier 1 and Tier 2
In 2014, 5 of the reported PSE resulted in 7 fatalities.
The fatal incident and high potential event descriptions that are process safety-related or Process Safety Events from the safety performance indicators report are in 2014pfh, Fatal incident and high potential event report. The intention is to feed back learnings from events and to help organizations to categorize process safety events.
0.0
0.1
0.2
0.3
0.4
0.5
0.6
0.7
2014201320122011
Tier 2
Tier 1
PSE
per m
illio
n wo
rk h
ours
0.29
0.52
0.19
0.50
0.19
0.61
0.50
0.14
Figure 1 shows the overall Tier 1 and Tier 2 PSE rates.
8Process safety events – 2014 data
In response to a number of Major Incidents, the oil and gas industry has identified opportunities to improve Key Performance Indicators (KPIs) for monitoring and review within management systems in order to more proactively identify and address weaknesses in risk controls (barriers).
IOGP published Report 456, Process Safety – Recommended Practice on Key Performance Indicators in November 2011. This IOGP report builds on the framework and definitions included in the API Recommended Practice (RP) 754, Process Safety Indicators for the Refining and Petrochemical Industries on process safety indicators, with specific emphasis on their application to upstream oil and gas activities.
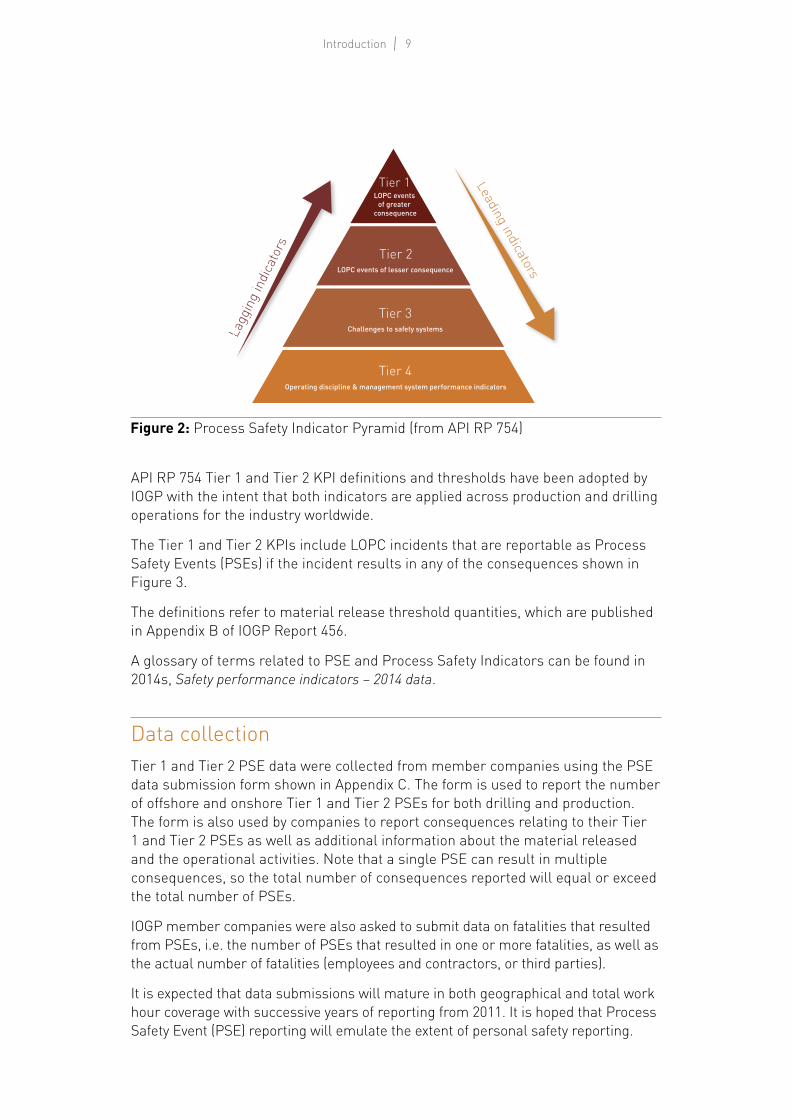
IOGP report number 456 and API RP 754 adopt a four-tier framework of KPIs which is illustrated in Figure 2.
Tiers 1 and 2 are predominantly lagging indicators related to Loss of Primary Containment (LOPC) referred to as a Process Safety Event (PSE).
The Tier 1 KPI records events with greater consequence within the four-tier approach.
The Tier 2 KPI records incidents with a lesser consequence.
Key Definitions
Process SafetyProcess safety is a disciplined framework for managing the integrity of operating systems and processes handling hazardous substances. It is achieved by applying good design principles, engineering, and operating and maintenance practices. It deals with the prevention and control of events that have the potential to release hazardous materials and energy. Such incidents can result in toxic effects, fires or explosions, and could ultimately result in serious incidents including fatalities, injuries, property damage, lost production or environmental damage.
Major IncidentAn incident that has resulted in multiple fatalities and/or serious damage, possibly beyond the asset itself. Typically initiated by a hazardous release, but may also result from major structural failure or loss of stability that has caused serious damage to an asset (note this is intended to incorporate terms such as ‘Major Accident’ as defined by UK HSE1).
1 HMSO. 1999. The control of Major Accident Hazards (COMAH) Regulations Statutory Instrument 1999 No. 743. See UK HSE http://www.hse.gov.uk/comah/background/index.htm and available from Her Majesty’s Stationery Office, London, at http://www.legislation.gov.uk/uksi/1999/743/regulation/2/mode.
1. Introduction
9Introduction
Figure 2: Process Safety Indicator Pyramid (from API RP 754)
Leading indicators
Lagg
ing
indi
cato
rs
Leading indicators
Lagg
ing
indi
cato
rs
Tier 1LOPC events
of greater consequence
LOPC events of lesser consequence
Challenges to safety systems
Operating discipline & management system performance indicators
Tier 2
Tier 3
Tier 4
API RP 754 Tier 1 and Tier 2 KPI definitions and thresholds have been adopted by IOGP with the intent that both indicators are applied across production and drilling operations for the industry worldwide.
The Tier 1 and Tier 2 KPIs include LOPC incidents that are reportable as Process Safety Events (PSEs) if the incident results in any of the consequences shown in Figure 3.
The definitions refer to material release threshold quantities, which are published in Appendix B of IOGP Report 456.
A glossary of terms related to PSE and Process Safety Indicators can be found in 2014s, Safety performance indicators – 2014 data.
Data collectionTier 1 and Tier 2 PSE data were collected from member companies using the PSE data submission form shown in Appendix C. The form is used to report the number of offshore and onshore Tier 1 and Tier 2 PSEs for both drilling and production. The form is also used by companies to report consequences relating to their Tier 1 and Tier 2 PSEs as well as additional information about the material released and the operational activities. Note that a single PSE can result in multiple consequences, so the total number of consequences reported will equal or exceed the total number of PSEs.
IOGP member companies were also asked to submit data on fatalities that resulted from PSEs, i.e. the number of PSEs that resulted in one or more fatalities, as well as the actual number of fatalities (employees and contractors, or third parties).
It is expected that data submissions will mature in both geographical and total work hour coverage with successive years of reporting from 2011. It is hoped that Process Safety Event (PSE) reporting will emulate the extent of personal safety reporting.
10Process safety events – 2014 data
Narrative event descriptionsDescriptions and lessons learned for events that had fatal consequences for company or contractor employees are published as IOGP report 2014sf, Safety performance indicators – Fatal incident reports. The narrative descriptions of fatal incidents and high potential events are submitted separately to the process safety event data published in this report, and therefore there can be no direct correlation between them and the data published in this report.
The fatal incident and high potential event reports that are process safety related or process safety events have been taken from reports 2014sf and 2014sh and are published as 2014pfh, Fatal incident and high potential event report. These are narratives of process safety events and of process safety related events where there are significant learnings but the criteria for PSE is not met, e.g. equipment not connected to the process. The intention is to feed back learnings from events and to help organizations to categorize process safety events.
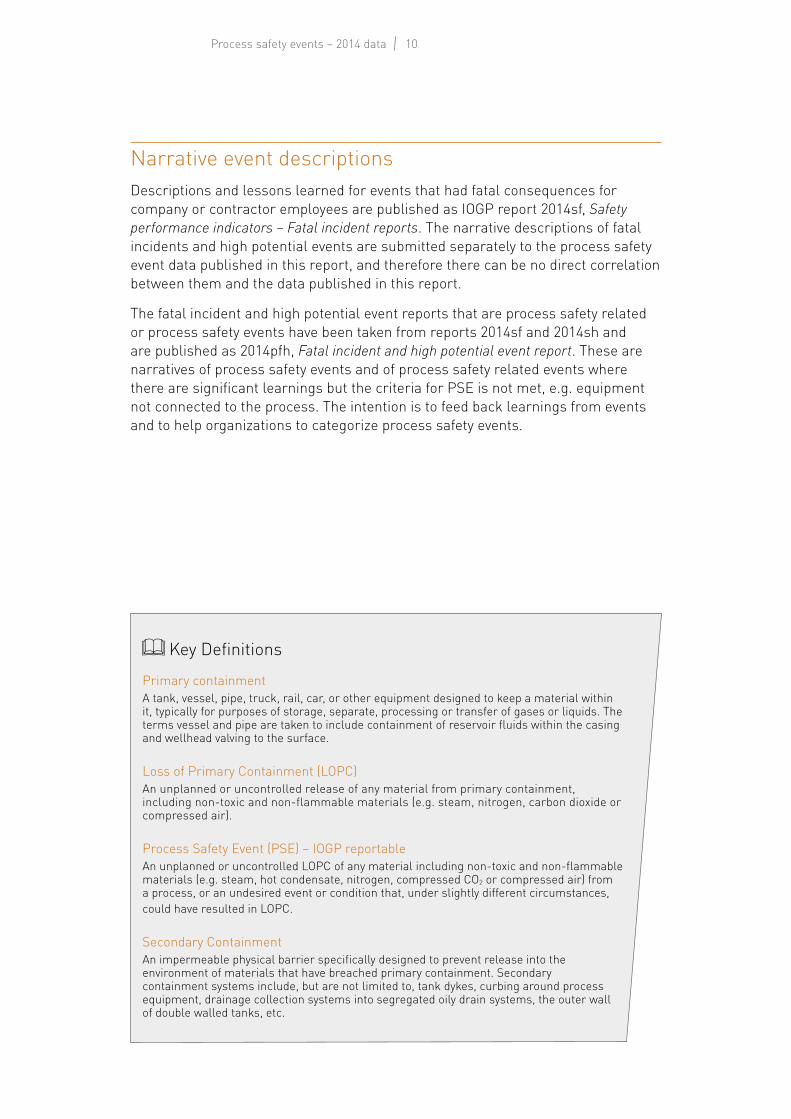
Key Definitions
Primary containmentA tank, vessel, pipe, truck, rail, car, or other equipment designed to keep a material within it, typically for purposes of storage, separate, processing or transfer of gases or liquids. The terms vessel and pipe are taken to include containment of reservoir fluids within the casing and wellhead valving to the surface.
Loss of Primary Containment (LOPC)An unplanned or uncontrolled release of any material from primary containment, including non-toxic and non-flammable materials (e.g. steam, nitrogen, carbon dioxide or compressed air).
Process Safety Event (PSE) – IOGP reportableAn unplanned or uncontrolled LOPC of any material including non-toxic and non-flammable materials (e.g. steam, hot condensate, nitrogen, compressed CO2 or compressed air) from a process, or an undesired event or condition that, under slightly different circumstances, could have resulted in LOPC.
Secondary ContainmentAn impermeable physical barrier specifically designed to prevent release into the environment of materials that have breached primary containment. Secondary containment systems include, but are not limited to, tank dykes, curbing around process equipment, drainage collection systems into segregated oily drain systems, the outer wall of double walled tanks, etc.
11Introduction
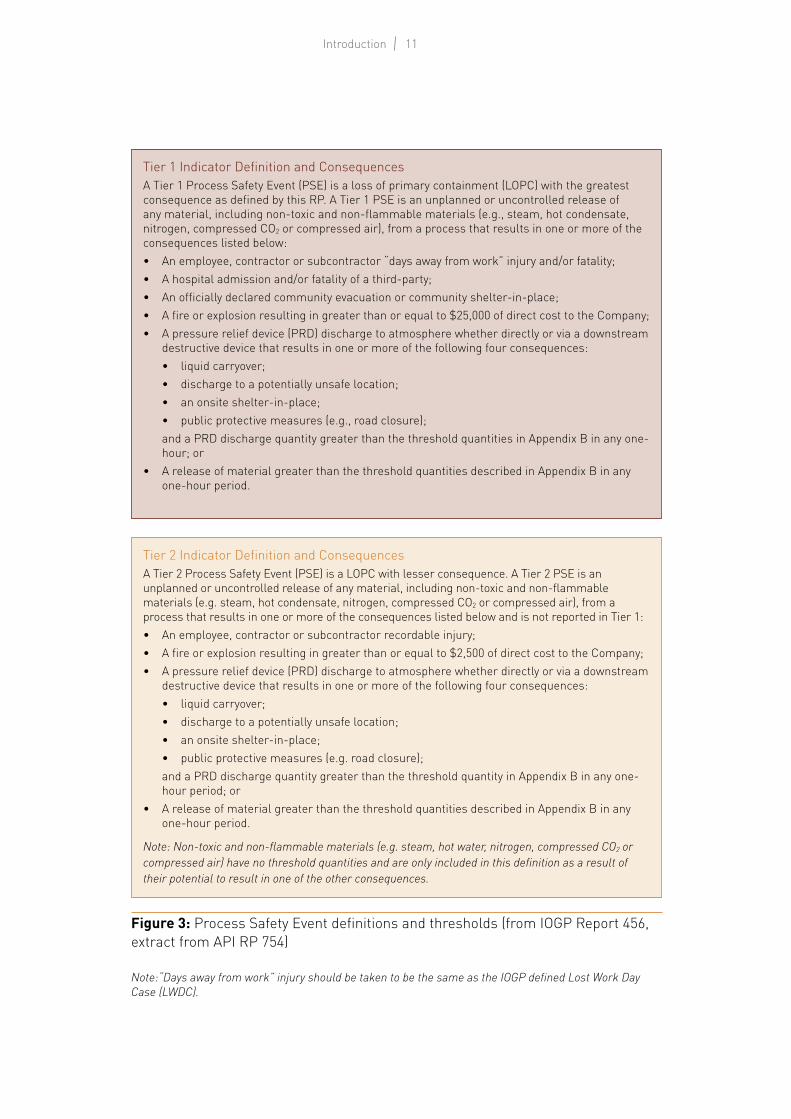
Tier 1 Indicator Definition and ConsequencesA Tier 1 Process Safety Event (PSE) is a loss of primary containment (LOPC) with the greatest consequence as defined by this RP. A Tier 1 PSE is an unplanned or uncontrolled release of any material, including non-toxic and non-flammable materials (e.g., steam, hot condensate, nitrogen, compressed CO2 or compressed air), from a process that results in one or more of the consequences listed below:• An employee, contractor or subcontractor “days away from work” injury and/or fatality;• A hospital admission and/or fatality of a third-party;• An officially declared community evacuation or community shelter-in-place;• A fire or explosion resulting in greater than or equal to $25,000 of direct cost to the Company; • A pressure relief device (PRD) discharge to atmosphere whether directly or via a downstream
destructive device that results in one or more of the following four consequences:• liquid carryover;• discharge to a potentially unsafe location;• an onsite shelter-in-place;• public protective measures (e.g., road closure);and a PRD discharge quantity greater than the threshold quantities in Appendix B in any one-hour; or
• A release of material greater than the threshold quantities described in Appendix B in any one-hour period.
Tier 2 Indicator Definition and ConsequencesA Tier 2 Process Safety Event (PSE) is a LOPC with lesser consequence. A Tier 2 PSE is an unplanned or uncontrolled release of any material, including non-toxic and non-flammable materials (e.g. steam, hot condensate, nitrogen, compressed CO2 or compressed air), from a process that results in one or more of the consequences listed below and is not reported in Tier 1:• An employee, contractor or subcontractor recordable injury;• A fire or explosion resulting in greater than or equal to $2,500 of direct cost to the Company;• A pressure relief device (PRD) discharge to atmosphere whether directly or via a downstream
destructive device that results in one or more of the following four consequences:• liquid carryover; • discharge to a potentially unsafe location; • an onsite shelter-in-place; • public protective measures (e.g. road closure); and a PRD discharge quantity greater than the threshold quantity in Appendix B in any one-hour period; or
• A release of material greater than the threshold quantities described in Appendix B in any one-hour period.
Note: Non-toxic and non-flammable materials (e.g. steam, hot water, nitrogen, compressed CO2 or compressed air) have no threshold quantities and are only included in this definition as a result of their potential to result in one of the other consequences.
Note:“Days away from work” injury should be taken to be the same as the IOGP defined Lost Work Day Case (LWDC).
Figure 3: Process Safety Event definitions and thresholds (from IOGP Report 456, extract from API RP 754)
12Process safety events – 2014 data
Normalization Tier 1 and Tier 2 PSE have been normalized against work hours associated with process safety events using the following formula for the PSE Rate. Refer to IOGP Report 456, 3.3, for further information.
Data are only included for normalized results where both work hours and process safety event data are reported for the data set and work function.
Database dimensionsThe PSE data collected by IOGP are based on the numbers of Tier 1 and Tier 2 PSE reported by companies, separately for drilling and production activities and subdivided into offshore and onshore data.
PSE relating to sabotage or willful damage are reported separately and are presented in section 2 of this report. They are not included in the results presented in sections 1–7.
The entire IOGP safety performance database, which is used to produce the annual safety performance indicators report (IOGP report 2014s), contains work hours which are split into offshore and onshore work hours and five function categories (defined in the glossary of terms in 2014s, Safety performance indicators – 2014 data as work functions):
• exploration• drilling• production• construction• unspecified
For the purposes of the process safety event database, the only applicable functional categories from the entire IOGP safety performance database are drilling and production, onshore and offshore. The work hours associated with PSE reported in 2011-2014 for drilling and production, onshore and offshore, are shown in Table 1.
PSER = × 1 000 000Total PSE Count
Total Hours Worked (for drilling and production activities)
13Introduction
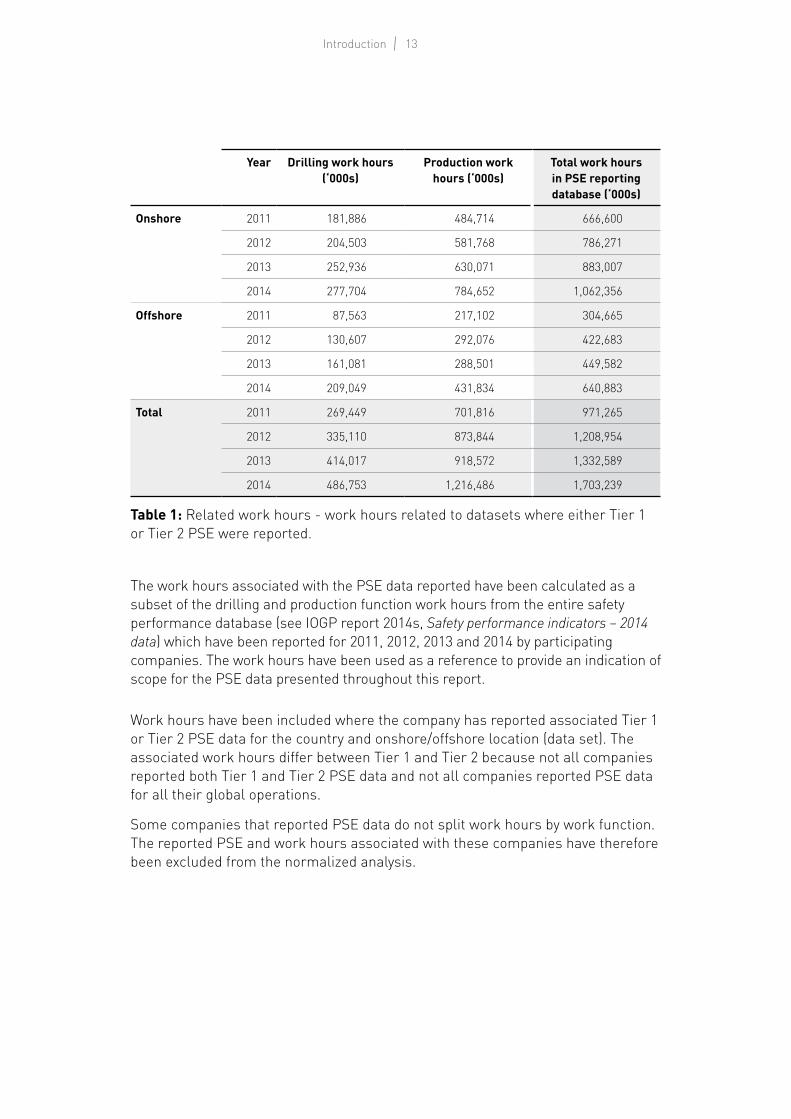
Year Drilling work hours (‘000s)
Production work hours (‘000s)
Total work hours in PSE reporting database (‘000s)
Onshore 2011 181,886 484,714 666,600
2012 204,503 581,768 786,271
2013 252,936 630,071 883,007
2014 277,704 784,652 1,062,356
Offshore 2011 87,563 217,102 304,665
2012 130,607 292,076 422,683
2013 161,081 288,501 449,582
2014 209,049 431,834 640,883
Total 2011 269,449 701,816 971,265
2012 335,110 873,844 1,208,954
2013 414,017 918,572 1,332,589
2014 486,753 1,216,486 1,703,239
Table 1: Related work hours - work hours related to datasets where either Tier 1 or Tier 2 PSE were reported.
The work hours associated with the PSE data reported have been calculated as a subset of the drilling and production function work hours from the entire safety performance database (see IOGP report 2014s, Safety performance indicators – 2014 data) which have been reported for 2011, 2012, 2013 and 2014 by participating companies. The work hours have been used as a reference to provide an indication of scope for the PSE data presented throughout this report.
Work hours have been included where the company has reported associated Tier 1 or Tier 2 PSE data for the country and onshore/offshore location (data set). The associated work hours differ between Tier 1 and Tier 2 because not all companies reported both Tier 1 and Tier 2 PSE data and not all companies reported PSE data for all their global operations.
Some companies that reported PSE data do not split work hours by work function. The reported PSE and work hours associated with these companies have therefore been excluded from the normalized analysis.
14Process safety events – 2014 data
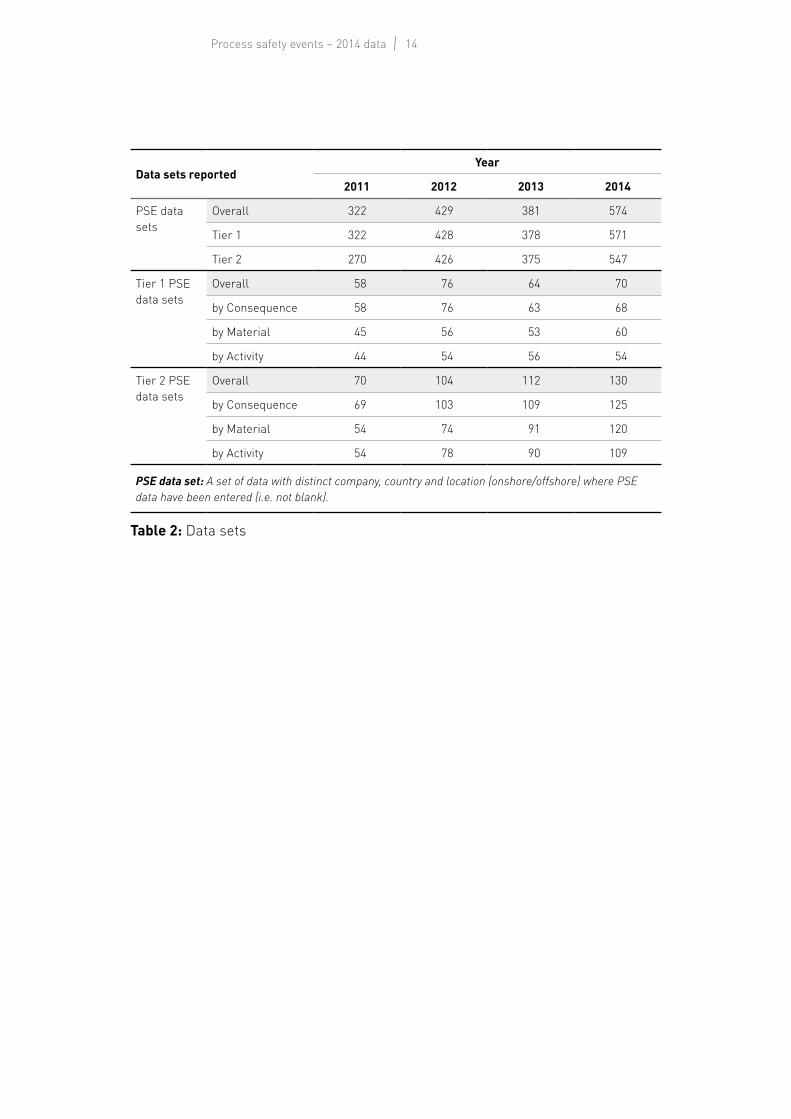
Data sets reportedYear
2011 2012 2013 2014
PSE data sets
Overall 322 429 381 574
Tier 1 322 428 378 571
Tier 2 270 426 375 547
Tier 1 PSE data sets
Overall 58 76 64 70
by Consequence 58 76 63 68
by Material 45 56 53 60
by Activity 44 54 56 54
Tier 2 PSE data sets
Overall 70 104 112 130
by Consequence 69 103 109 125
by Material 54 74 91 120
by Activity 54 78 90 109
PSE data set: A set of data with distinct company, country and location (onshore/offshore) where PSE data have been entered (i.e. not blank).
Table 2: Data sets
15Overall results
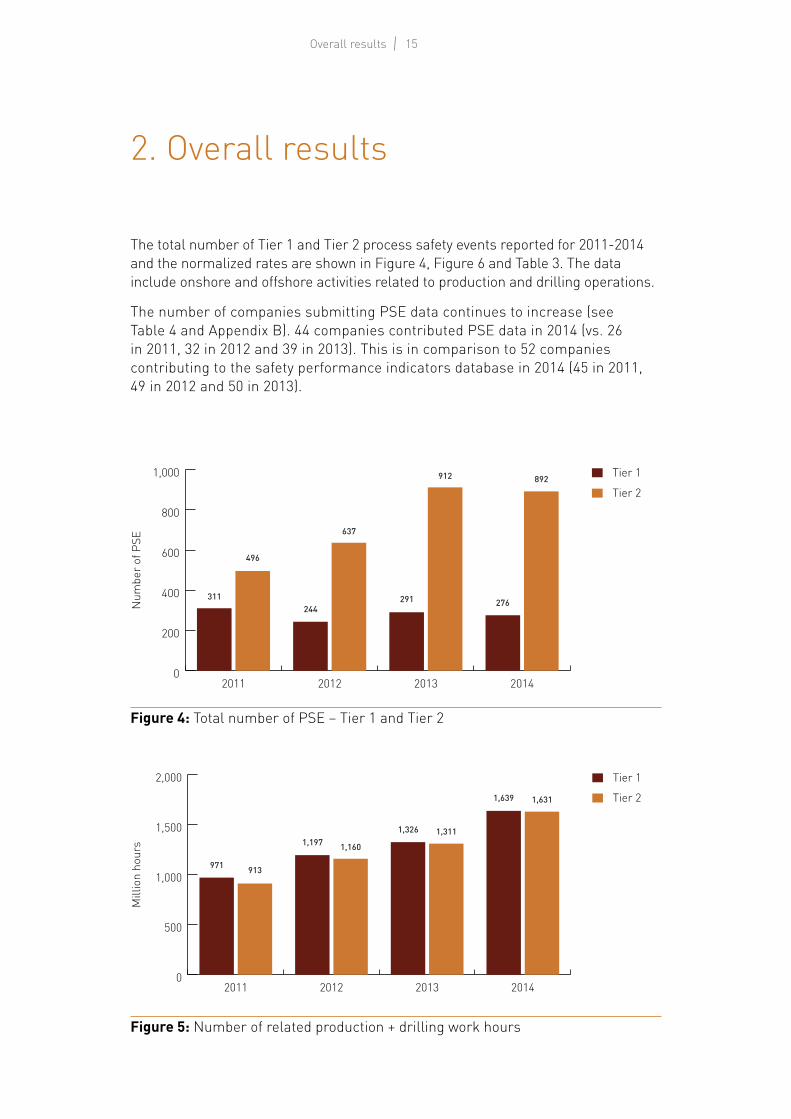
The total number of Tier 1 and Tier 2 process safety events reported for 2011-2014 and the normalized rates are shown in Figure 4, Figure 6 and Table 3. The data include onshore and offshore activities related to production and drilling operations.
The number of companies submitting PSE data continues to increase (see Table 4 and Appendix B). 44 companies contributed PSE data in 2014 (vs. 26 in 2011, 32 in 2012 and 39 in 2013). This is in comparison to 52 companies contributing to the safety performance indicators database in 2014 (45 in 2011, 49 in 2012 and 50 in 2013).
2. Overall results
Figure 4: Total number of PSE – Tier 1 and Tier 2
Figure 5: Number of related production + drilling work hours
0
500
1,000
1,500
2,000
2014201320122011
Mill
ion
hour
s
Tier 1
971
1,1971,326
1,639
913
1,160
1,311
1,631 Tier 2
0
200
400
600
800
1,000
2014201320122011
Num
ber o
f PSE
Tier 1
311244
291 276
496
637
912 892Tier 2
16Process safety events – 2014 data
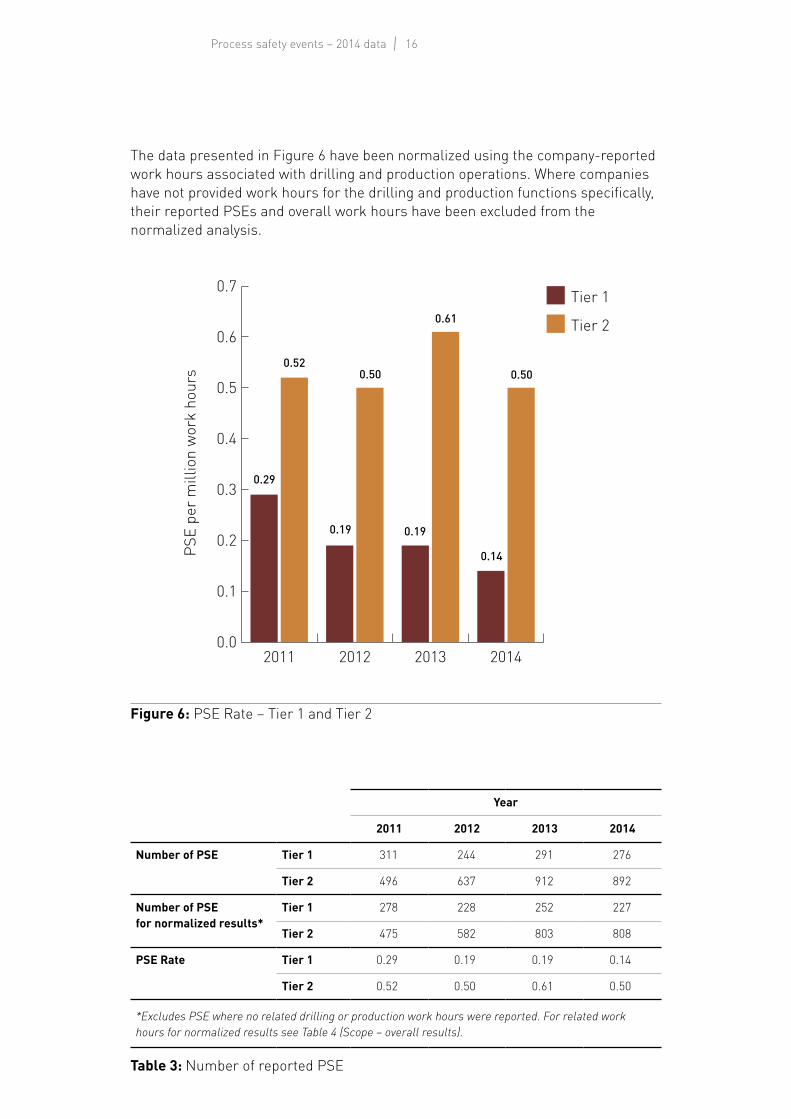
Figure 6: PSE Rate – Tier 1 and Tier 2
0.0
0.1
0.2
0.3
0.4
0.5
0.6
0.7
2014201320122011
Tier 2
Tier 1
PSE
per m
illio
n w
ork
hour
s
0.29
0.52
0.19
0.50
0.19
0.61
0.50
0.14
Year
2011 2012 2013 2014
Number of PSE Tier 1 311 244 291 276
Tier 2 496 637 912 892
Number of PSE for normalized results*
Tier 1 278 228 252 227
Tier 2 475 582 803 808
PSE Rate Tier 1 0.29 0.19 0.19 0.14
Tier 2 0.52 0.50 0.61 0.50
*Excludes PSE where no related drilling or production work hours were reported. For related work hours for normalized results see Table 4 (Scope – overall results).
Table 3: Number of reported PSE
The data presented in Figure 6 have been normalized using the company-reported work hours associated with drilling and production operations. Where companies have not provided work hours for the drilling and production functions specifically, their reported PSEs and overall work hours have been excluded from the normalized analysis.
17Overall results
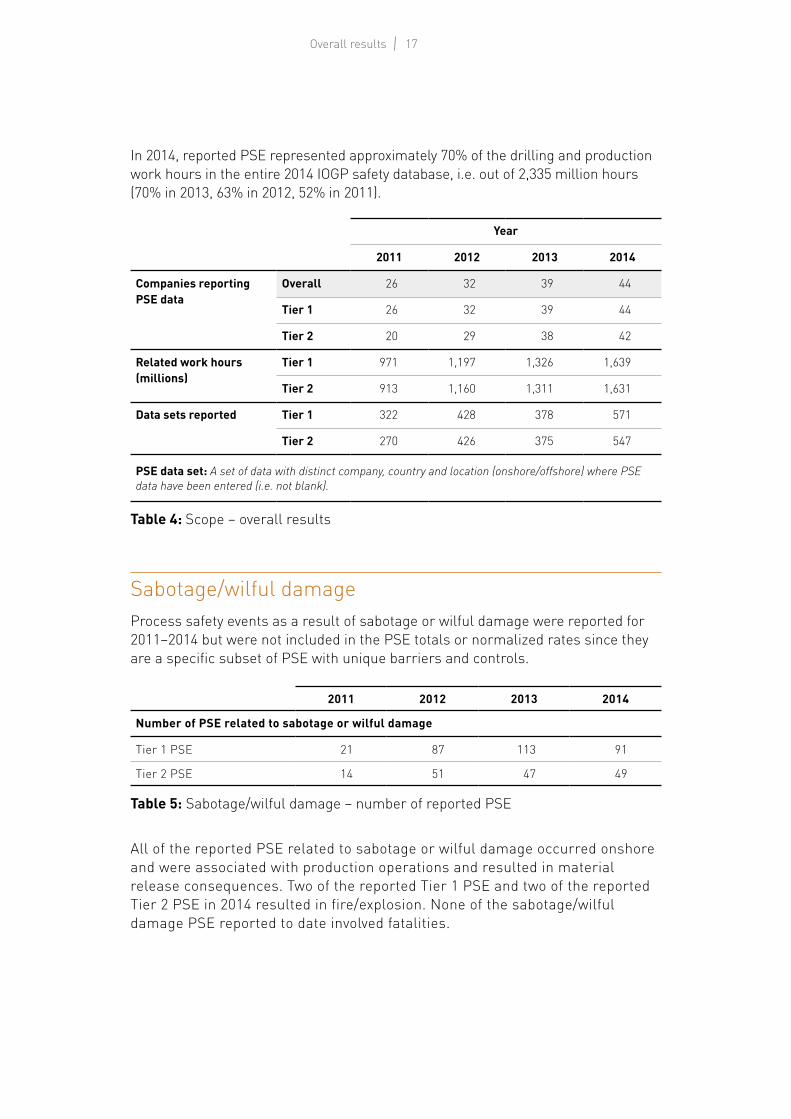
In 2014, reported PSE represented approximately 70% of the drilling and production work hours in the entire 2014 IOGP safety database, i.e. out of 2,335 million hours (70% in 2013, 63% in 2012, 52% in 2011).
Year
2011 2012 2013 2014
Companies reporting PSE data
Overall 26 32 39 44
Tier 1 26 32 39 44
Tier 2 20 29 38 42
Related work hours (millions)
Tier 1 971 1,197 1,326 1,639
Tier 2 913 1,160 1,311 1,631
Data sets reported Tier 1 322 428 378 571
Tier 2 270 426 375 547
PSE data set: A set of data with distinct company, country and location (onshore/offshore) where PSE data have been entered (i.e. not blank).
Table 4: Scope – overall results
Sabotage/wilful damageProcess safety events as a result of sabotage or wilful damage were reported for 2011–2014 but were not included in the PSE totals or normalized rates since they are a specific subset of PSE with unique barriers and controls.
2011 2012 2013 2014
Number of PSE related to sabotage or wilful damage
Tier 1 PSE 21 87 113 91
Tier 2 PSE 14 51 47 49
Table 5: Sabotage/wilful damage – number of reported PSE
All of the reported PSE related to sabotage or wilful damage occurred onshore and were associated with production operations and resulted in material release consequences. Two of the reported Tier 1 PSE and two of the reported Tier 2 PSE in 2014 resulted in fire/explosion. None of the sabotage/wilful damage PSE reported to date involved fatalities.
18Process safety events – 2014 data
0
100
200
300
400
500
600
700
800Total Tier 2 PSE
Total Tier 1 PSE
Offshore 2014
Onshore 2014
Offshore 2013
Onshore 2013
Offshore 2012
Onshore 2012
Offshore 2011
Onshore 2011
Tier 2
Tier 1
Num
ber o
f PSE
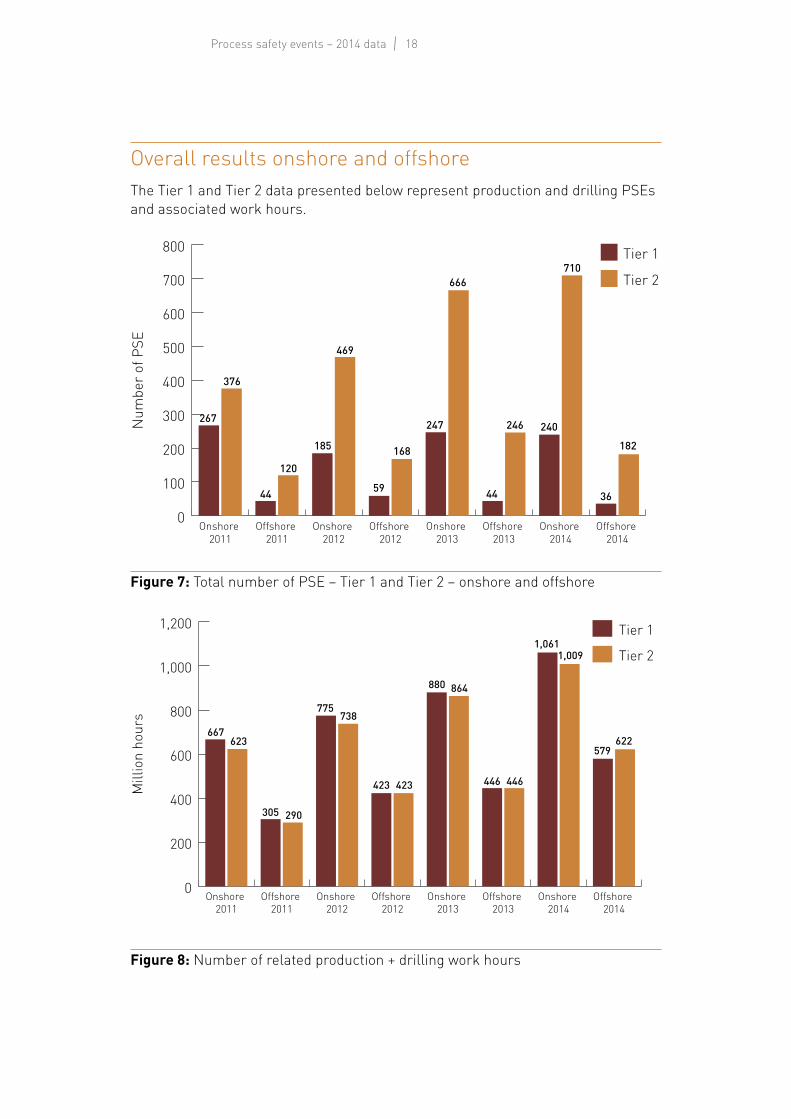
267
376
44
120
185
469
59
168
247
666
44
246 240
710
36
182
Figure 7: Total number of PSE – Tier 1 and Tier 2 – onshore and offshore
Figure 8: Number of related production + drilling work hours
Overall results onshore and offshoreThe Tier 1 and Tier 2 data presented below represent production and drilling PSEs and associated work hours.
0
200
400
600
800
1,000
1,200
Offshore 2014
Onshore 2014
Offshore 2013
Onshore 2013
Offshore 2012
Onshore 2012
Offshore 2011
Onshore 2011
Tier 2
Tier 1
Mill
ion
hour
s
667623
305 290
775738
423 423
880 864
446 446
1,0611,009
579622
19Overall results
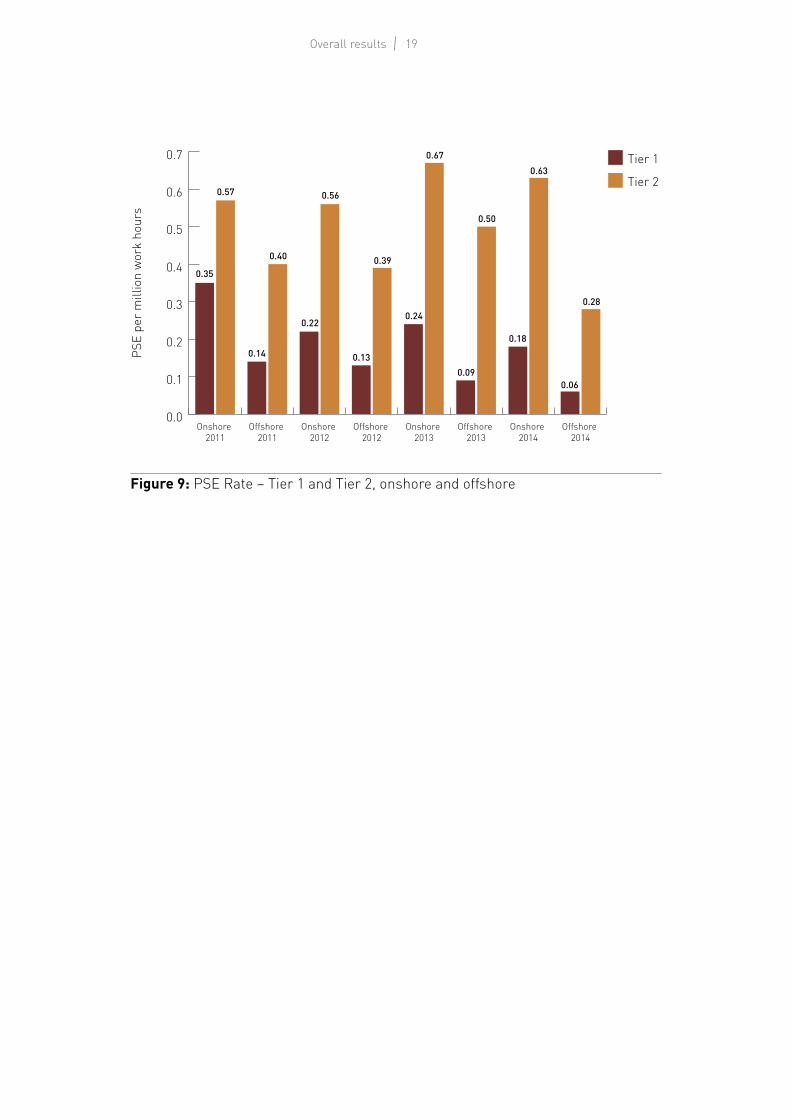
Figure 9: PSE Rate – Tier 1 and Tier 2, onshore and offshore
0.0
0.1
0.2
0.3
0.4
0.5
0.6
0.7
Offshore 2014
Onshore 2014
Offshore 2013
Onshore 2013
Offshore 2012
Onshore 2012
Offshore 2011
Onshore 2011
PSE
per m
illio
n w
ork
hour
s
0.35
0.57
0.14
0.40
0.22
0.56
0.13
0.39
0.24
0.67
0.09
0.50
0.63
0.06
0.28
0.18
Tier 2
Tier 1
20Process safety events – 2014 data
3. Results by work function
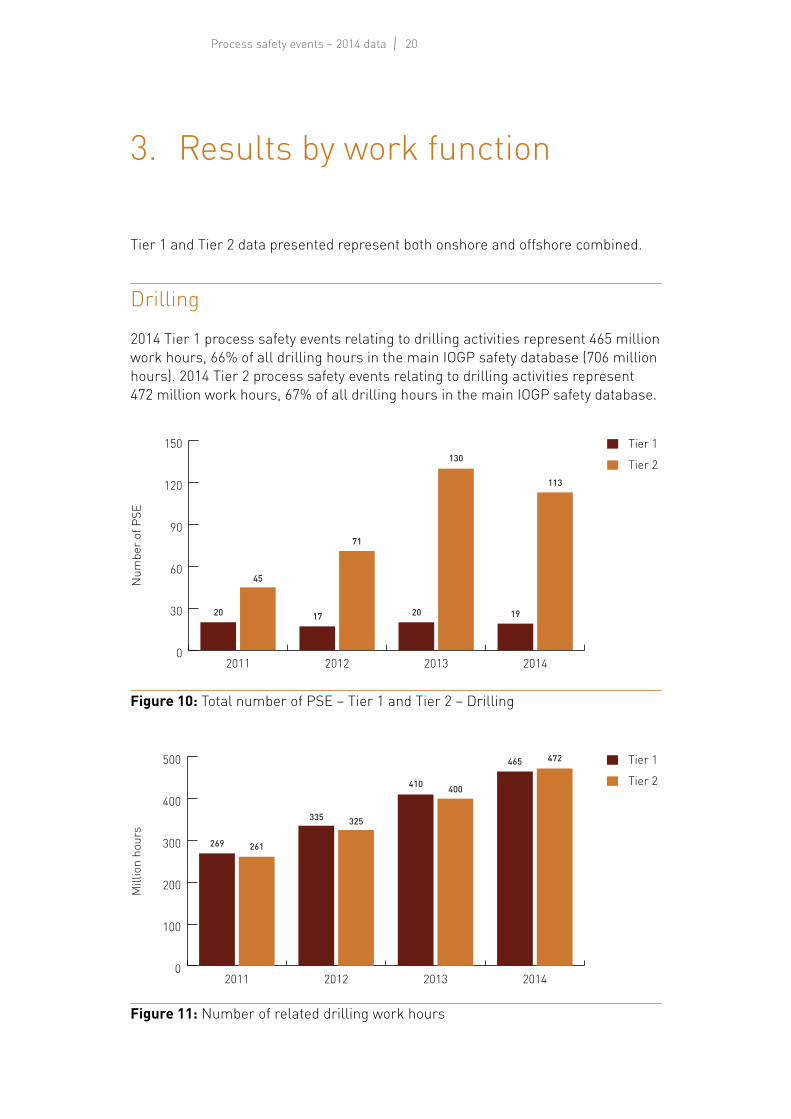
Figure 10: Total number of PSE – Tier 1 and Tier 2 – Drilling
Figure 11: Number of related drilling work hours
0
30
60
90
120
150
2014201320122011
Num
ber o
f PSE
Tier 1
20 17 20 19
45
71
130
113
Tier 2
0
100
200
300
400
500
2014201320122011
Mill
ion
hour
s
Tier 1
269
335
410
465
261
325
400
472
Tier 2
Tier 1 and Tier 2 data presented represent both onshore and offshore combined.
Drilling
2014 Tier 1 process safety events relating to drilling activities represent 465 million work hours, 66% of all drilling hours in the main IOGP safety database (706 million hours). 2014 Tier 2 process safety events relating to drilling activities represent 472 million work hours, 67% of all drilling hours in the main IOGP safety database.
21Results by function
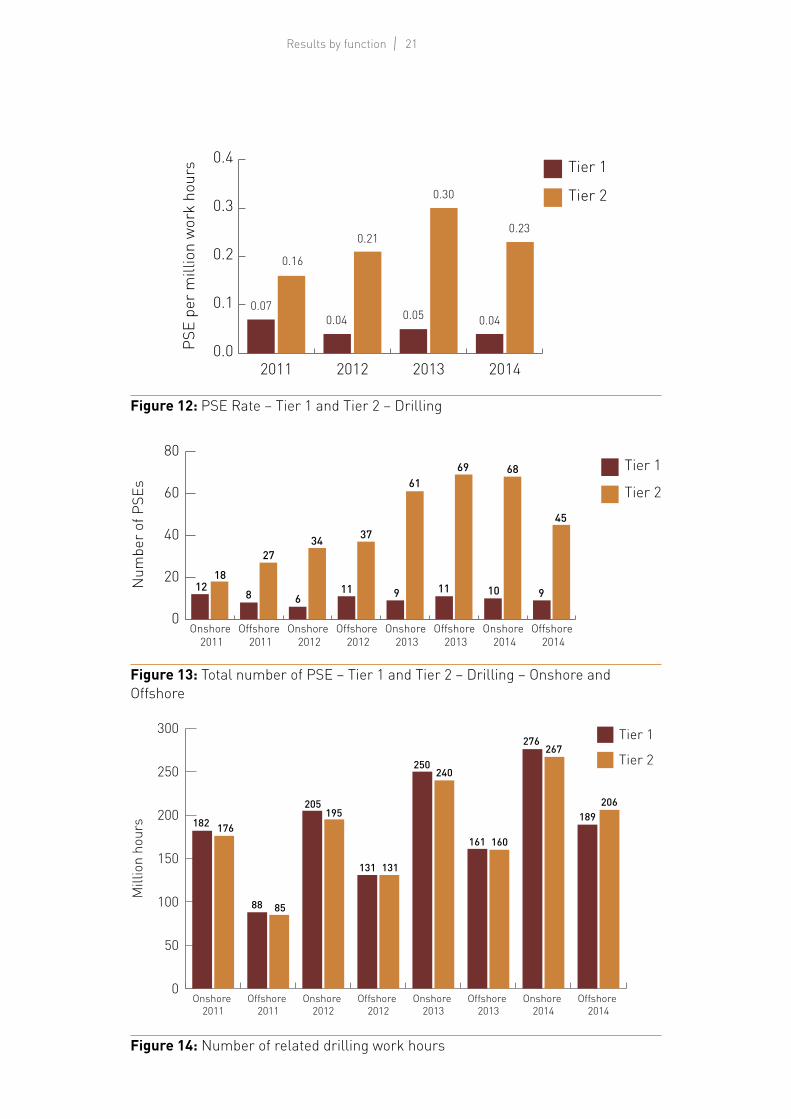
Figure 12: PSE Rate – Tier 1 and Tier 2 – Drilling
0.0
0.1
0.2
0.3
0.4
2014201320122011
Tier 2
Tier 1PS
E pe
r mill
ion
wor
k ho
urs
0.07
0.16
0.04
0.21
0.05
0.30
0.04
0.23
0
20
40
60
80
Offshore 2014
Onshore 2014
Offshore 2013
Onshore 2013
Offshore 2012
Onshore 2012
Offshore 2011
Onshore 2011
Tier 2
Tier 1
Num
ber o
f PSE
s
1218
8
27
6
34
11
37
9
61
11
69 68
45
910
Figure 13: Total number of PSE – Tier 1 and Tier 2 – Drilling – Onshore and Offshore
Figure 14: Number of related drilling work hours
0
50
100
150
200
250
300
Offshore 2014
Onshore 2014
Offshore 2013
Onshore 2013
Offshore 2012
Onshore 2012
Offshore 2011
Onshore 2011
Tier 2
Tier 1
Mill
ion
hour
s 182 176
88 85
205195
131 131
250240
161 160
276267
189206
22Process safety events – 2014 data
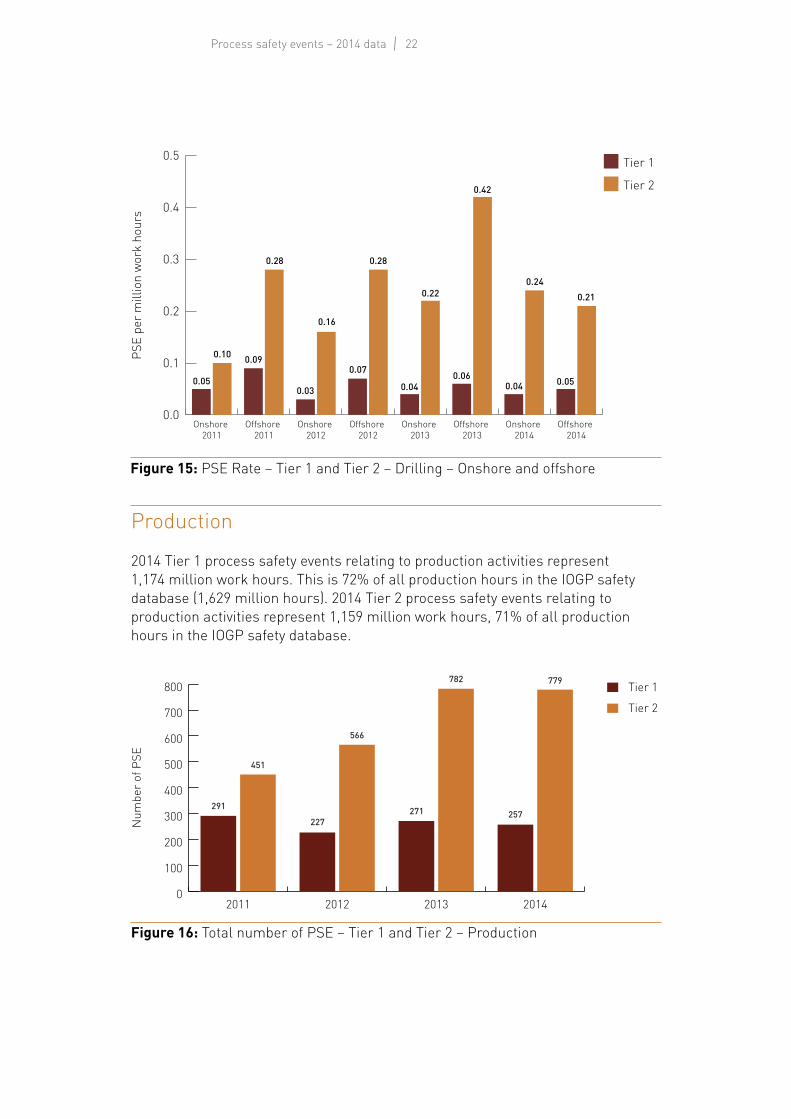
Figure 15: PSE Rate – Tier 1 and Tier 2 – Drilling – Onshore and offshore
0.0
0.1
0.2
0.3
0.4
0.5
Offshore 2014
Onshore 2014
Offshore 2013
Onshore 2013
Offshore 2012
Onshore 2012
Offshore 2011
Onshore 2011
PSE
per m
illio
n w
ork
hour
s
0.05
0.10 0.09
0.28
0.03
0.16
0.07
0.28
0.04
0.22
0.060.04
0.24
0.05
0.21
0.42 Tier 2
Tier 1
Figure 16: Total number of PSE – Tier 1 and Tier 2 – Production
0
100
200
300
400
500
600
700
800
2014201320122011
Num
ber o
f PSE
Tier 1
291
227271 257
451
566
782 779
Tier 2
Production
2014 Tier 1 process safety events relating to production activities represent 1,174 million work hours. This is 72% of all production hours in the IOGP safety database (1,629 million hours). 2014 Tier 2 process safety events relating to production activities represent 1,159 million work hours, 71% of all production hours in the IOGP safety database.
23Results by function
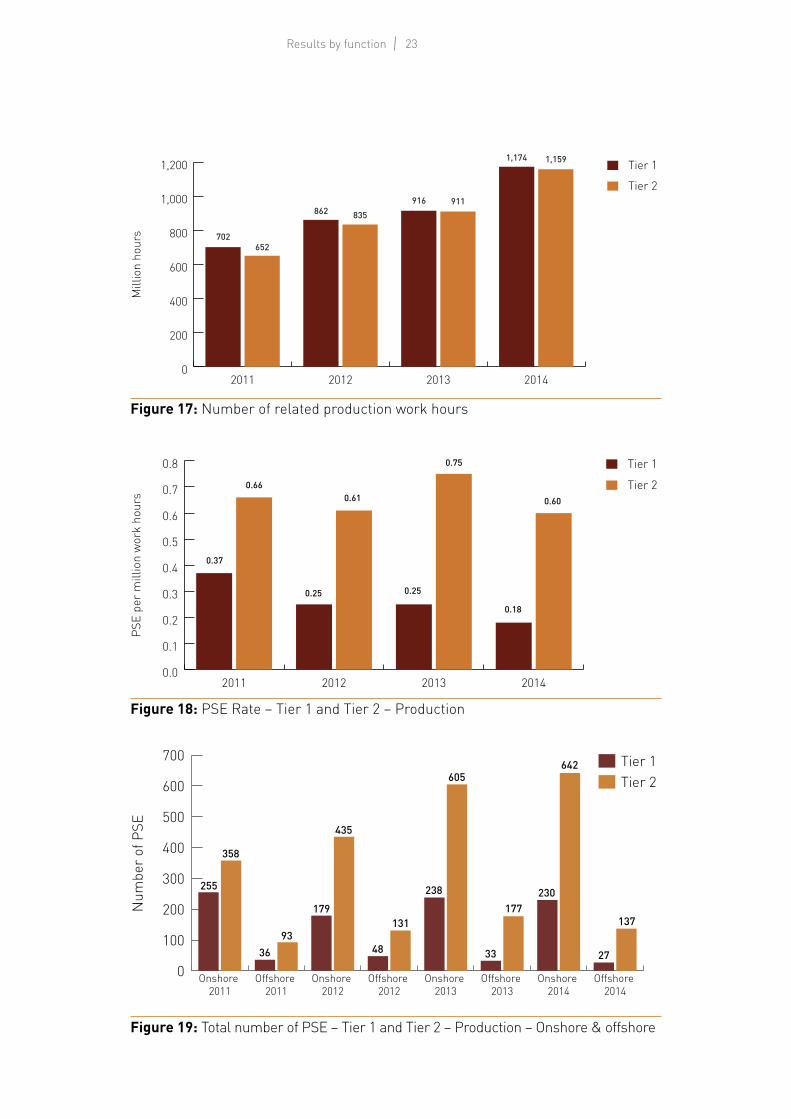
Figure 17: Number of related production work hours
0
200
400
600
800
1,000
1,200
2014201320122011
Mill
ion
hour
s
Tier 1
702
862916
1,174
652
835911
1,159
Tier 2
Figure 18: PSE Rate – Tier 1 and Tier 2 – Production
0.0
0.1
0.2
0.3
0.4
0.5
0.6
0.7
0.8
2014201320122011
PSE
per m
illio
n w
ork
hour
s
Tier 1
0.37
0.25 0.25
0.18
0.660.61
0.75
0.60Tier 2
Figure 19: Total number of PSE – Tier 1 and Tier 2 – Production – Onshore & offshore
0
100
200
300
400
500
600
700
Offshore 2014
Onshore 2014
Offshore 2013
Onshore 2013
Offshore 2012
Onshore 2012
Offshore 2011
Onshore 2011
Tier 2Tier 1
Num
ber o
f PSE
255
358
3693
179
435
48
131
238
605
33
177230
642
27
137
24Process safety events – 2014 data
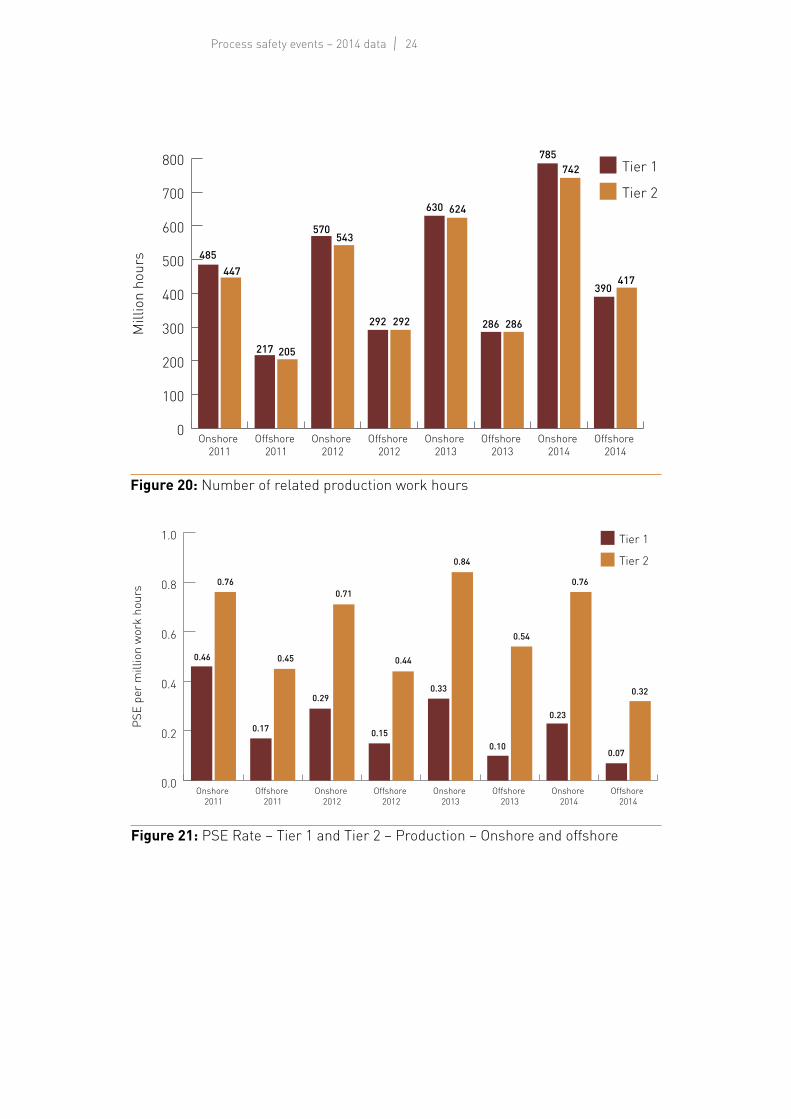
Figure 20: Number of related production work hours
0
100
200
300
400
500
600
700
800
Offshore 2014
Onshore 2014
Offshore 2013
Onshore 2013
Offshore 2012
Onshore 2012
Offshore 2011
Onshore 2011
Tier 2
Tier 1
Mill
ion
hour
s 485447
217 205
570543
292 292
630 624
286 286
785742
390417
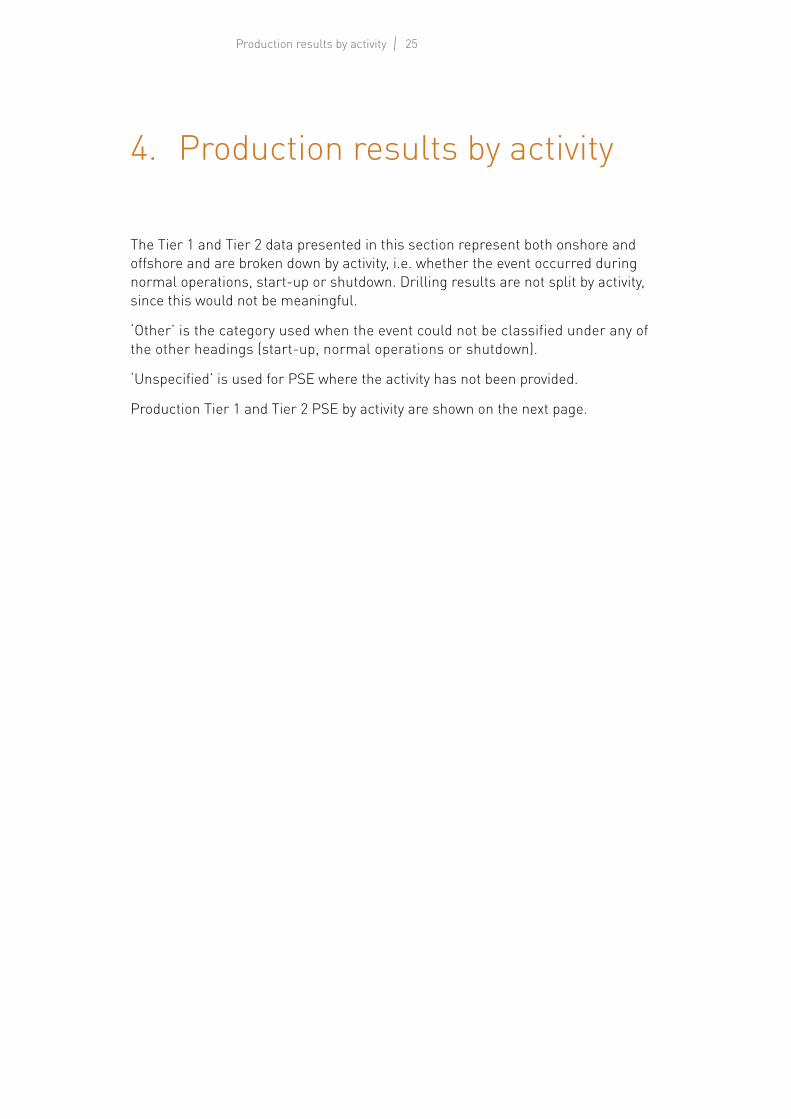
Figure 21: PSE Rate – Tier 1 and Tier 2 – Production – Onshore and offshore
0.0
0.2
0.4
0.6
0.8
1.0
Offshore 2014
Onshore 2014
Offshore 2013
Onshore 2013
Offshore 2012
Onshore 2012
Offshore 2011
Onshore 2011
PSE
per m
illio
n w
ork
hour
s
0.46
0.76
0.17
0.45
0.29
0.71
0.15
0.44
0.33
0.84
0.10
0.54
0.23
0.76
0.07
0.32
Tier 2
Tier 1
25Production results by activity
The Tier 1 and Tier 2 data presented in this section represent both onshore and offshore and are broken down by activity, i.e. whether the event occurred during normal operations, start-up or shutdown. Drilling results are not split by activity, since this would not be meaningful.
‘Other’ is the category used when the event could not be classified under any of the other headings (start-up, normal operations or shutdown).
‘Unspecified’ is used for PSE where the activity has not been provided.
Production Tier 1 and Tier 2 PSE by activity are shown on the next page.
4. Production results by activity
26Process safety events – 2014 data
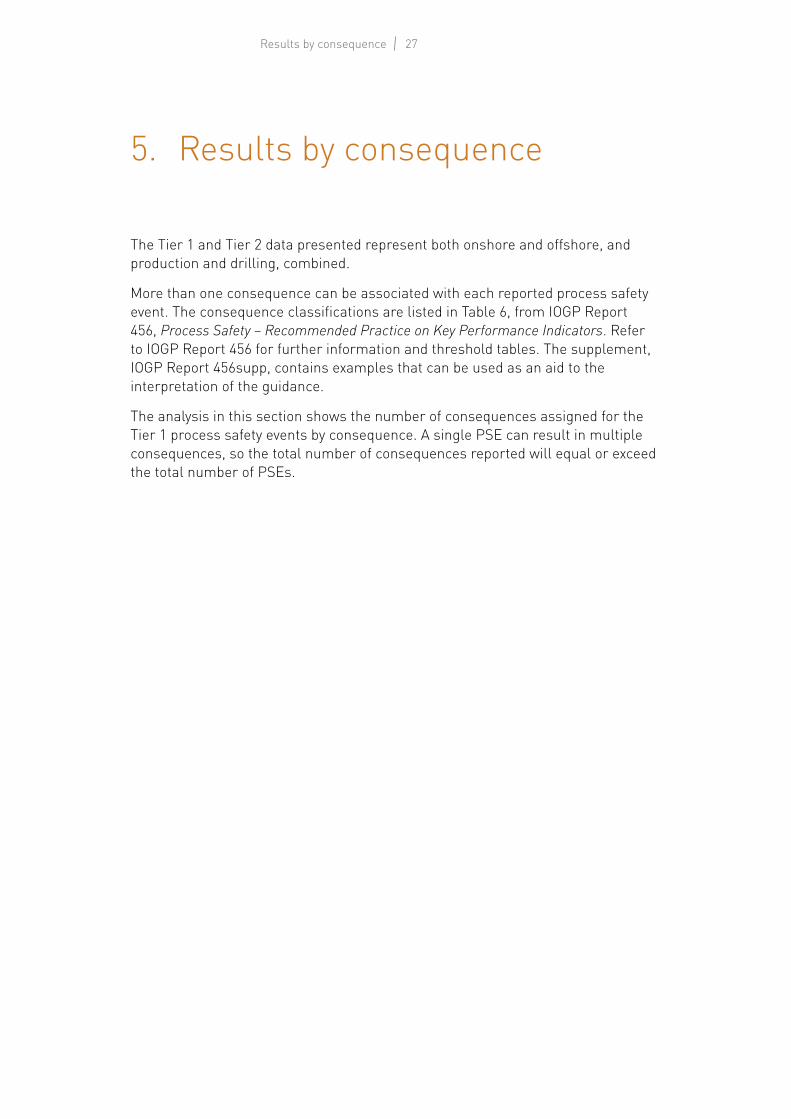
Production Tier 2In 2014, 30 of the companies that reported more than one production PSE provided a breakdown by activity for Tier 2 PSE. The breakdown by activity for 2014 PSE is similar to the breakdown for 2013, 2012 and 2011.
Figure 23: Production PSE by activity 2014 – Tier 2
Normal operations71%
Start up 2%
Shut down 2%
Unspecified 21%
Other 4%
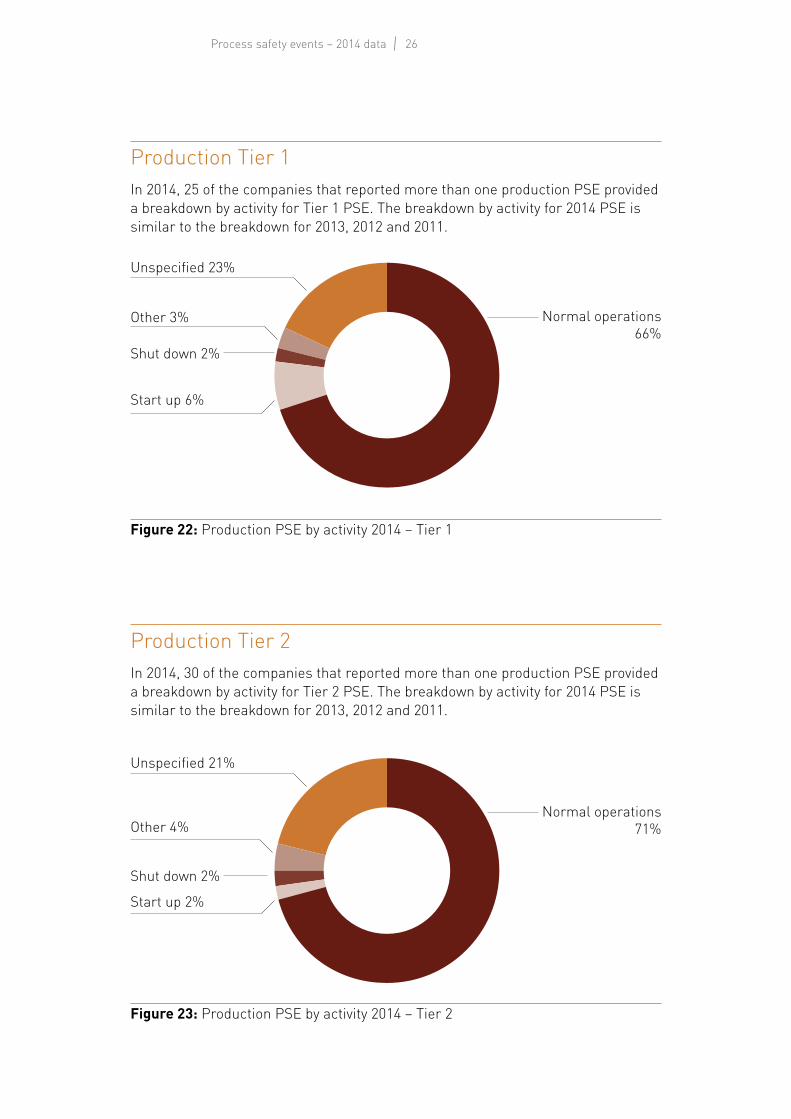
Production Tier 1 In 2014, 25 of the companies that reported more than one production PSE provided a breakdown by activity for Tier 1 PSE. The breakdown by activity for 2014 PSE is similar to the breakdown for 2013, 2012 and 2011.
Figure 22: Production PSE by activity 2014 – Tier 1
Normal operations66%
Start up 6%
Shut down 2%
Unspecified 23%
Other 3%
27Results by consequence
5. Results by consequence
The Tier 1 and Tier 2 data presented represent both onshore and offshore, and production and drilling, combined.
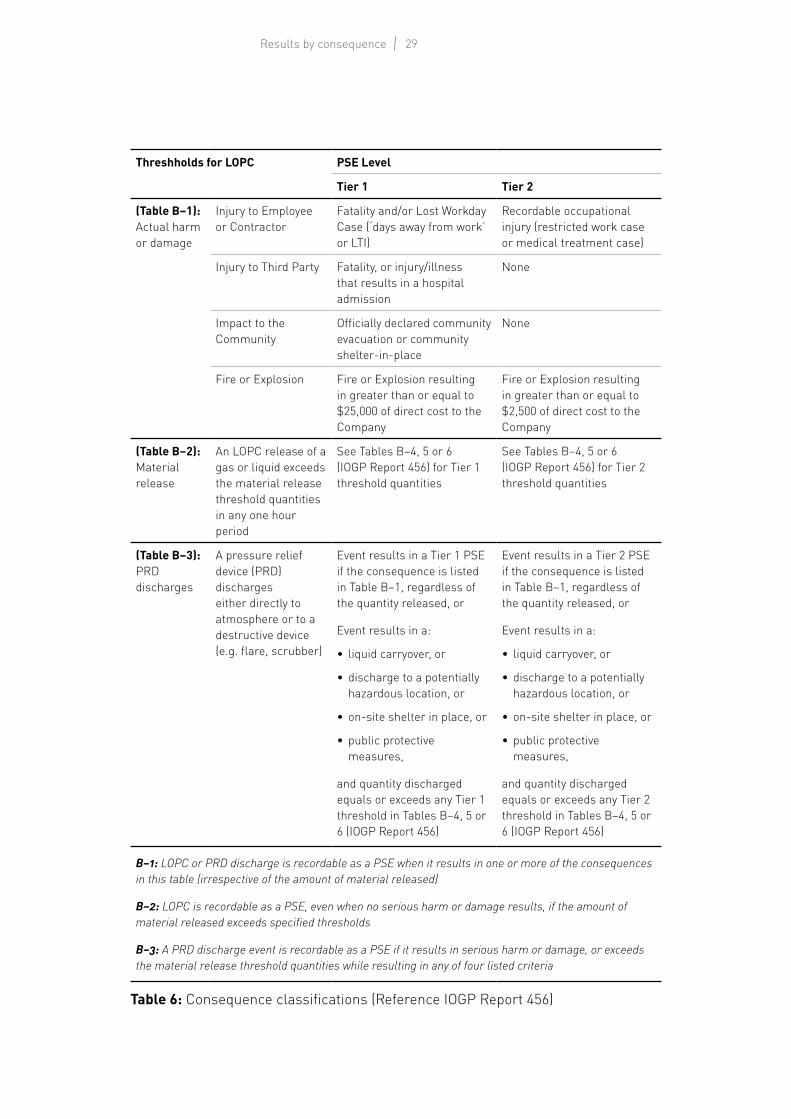
More than one consequence can be associated with each reported process safety event. The consequence classifications are listed in Table 6, from IOGP Report 456, Process Safety – Recommended Practice on Key Performance Indicators. Refer to IOGP Report 456 for further information and threshold tables. The supplement, IOGP Report 456supp, contains examples that can be used as an aid to the interpretation of the guidance.
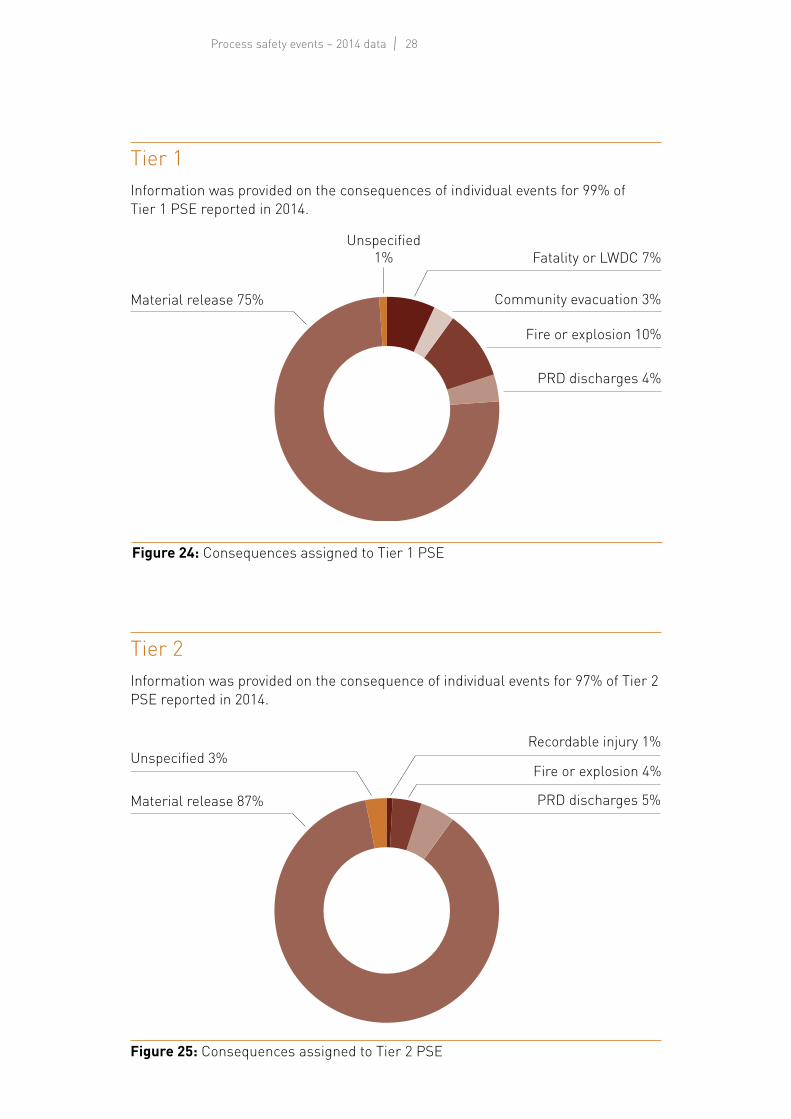
The analysis in this section shows the number of consequences assigned for the Tier 1 process safety events by consequence. A single PSE can result in multiple consequences, so the total number of consequences reported will equal or exceed the total number of PSEs.
28Process safety events – 2014 data
Tier 2Information was provided on the consequence of individual events for 97% of Tier 2 PSE reported in 2014.
Figure 25: Consequences assigned to Tier 2 PSE
Recordable injury 1%
Fire or explosion 4%
PRD discharges 5%
Unspecified 3%
Material release 87%
Tier 1Information was provided on the consequences of individual events for 99% of Tier 1 PSE reported in 2014.
Figure 24: Consequences assigned to Tier 1 PSE
Fatality or LWDC 7%
Community evacuation 3%
Fire or explosion 10%
PRD discharges 4%
Material release 75%
Unspecified 1%
29Results by consequence
Threshholds for LOPC PSE Level
Tier 1 Tier 2
(Table B–1): Actual harm or damage
Injury to Employee or Contractor
Fatality and/or Lost Workday Case (‘days away from work’ or LTI)
Recordable occupational injury (restricted work case or medical treatment case)
Injury to Third Party Fatality, or injury/illness that results in a hospital admission
None
Impact to the Community
Officially declared community evacuation or community shelter-in-place
None
Fire or Explosion Fire or Explosion resulting in greater than or equal to $25,000 of direct cost to the Company
Fire or Explosion resulting in greater than or equal to $2,500 of direct cost to the Company
(Table B–2): Material release
An LOPC release of a gas or liquid exceeds the material release threshold quantities in any one hour period
See Tables B–4, 5 or 6 (IOGP Report 456) for Tier 1 threshold quantities
See Tables B–4, 5 or 6 (IOGP Report 456) for Tier 2 threshold quantities
(Table B–3): PRD discharges
A pressure relief device (PRD) discharges either directly to atmosphere or to a destructive device (e.g. flare, scrubber)
Event results in a Tier 1 PSE if the consequence is listed in Table B–1, regardless of the quantity released, or
Event results in a:
• liquid carryover, or
• discharge to a potentially hazardous location, or
• on-site shelter in place, or
• public protective measures,
and quantity discharged equals or exceeds any Tier 1 threshold in Tables B–4, 5 or 6 (IOGP Report 456)
Event results in a Tier 2 PSE if the consequence is listed in Table B–1, regardless of the quantity released, or
Event results in a:
• liquid carryover, or
• discharge to a potentially hazardous location, or
• on-site shelter in place, or
• public protective measures,
and quantity discharged equals or exceeds any Tier 2 threshold in Tables B–4, 5 or 6 (IOGP Report 456)
B–1: LOPC or PRD discharge is recordable as a PSE when it results in one or more of the consequences in this table (irrespective of the amount of material released)
B–2: LOPC is recordable as a PSE, even when no serious harm or damage results, if the amount of material released exceeds specified thresholds
B–3: A PRD discharge event is recordable as a PSE if it results in serious harm or damage, or exceeds the material release threshold quantities while resulting in any of four listed criteria
Table 6: Consequence classifications (Reference IOGP Report 456)
30Process safety events – 2014 data
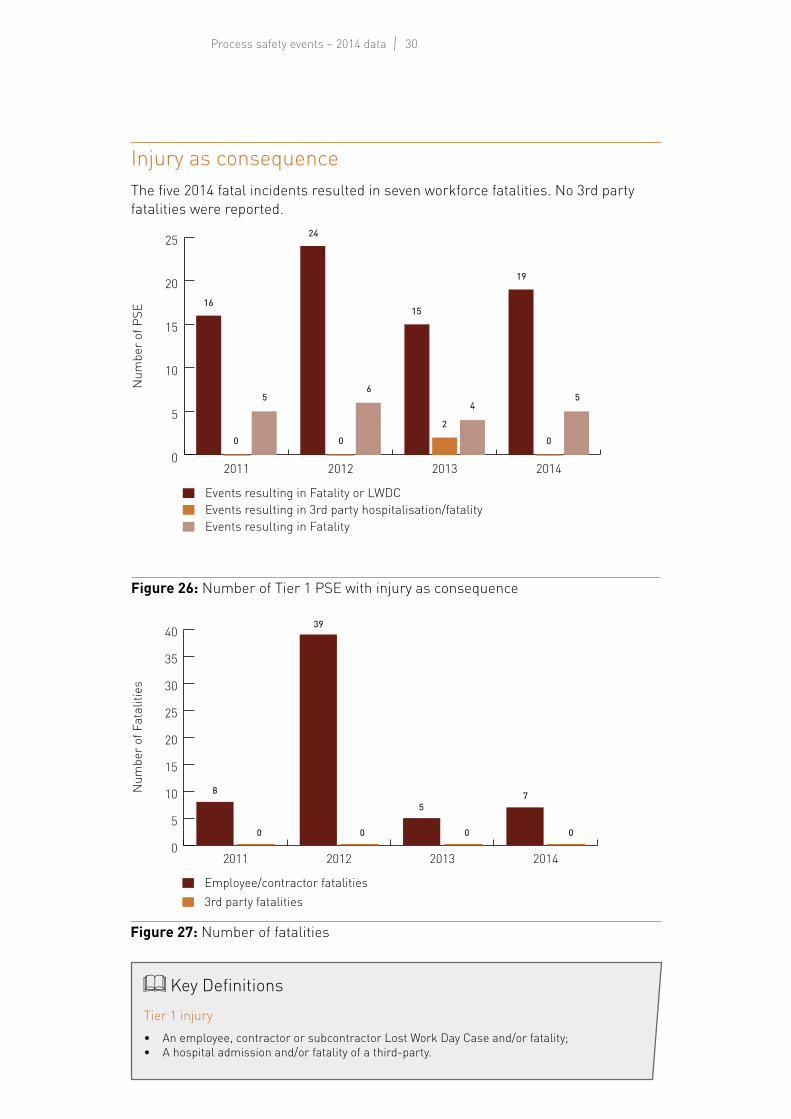
Figure 26: Number of Tier 1 PSE with injury as consequence
0
5
10
15
20
25
2014201320122011
Num
ber o
f PSE
Events resulting in Fatality or LWDC
16
0
5
24
0
6
15
2
4
19
0
5
Events resulting in 3rd party hospitalisation/fatalityEvents resulting in Fatality
Figure 27: Number of fatalities
0
5
10
15
20
25
30
35
40
2014201320122011
Num
ber o
f Fat
aliti
es
Employee/contractor fatalities3rd party fatalities
8
0 0 0 0
39
57
Key DefinitionsTier 1 injury• An employee, contractor or subcontractor Lost Work Day Case and/or fatality; • A hospital admission and/or fatality of a third-party.
Injury as consequenceThe five 2014 fatal incidents resulted in seven workforce fatalities. No 3rd party fatalities were reported.
31Results by consequence
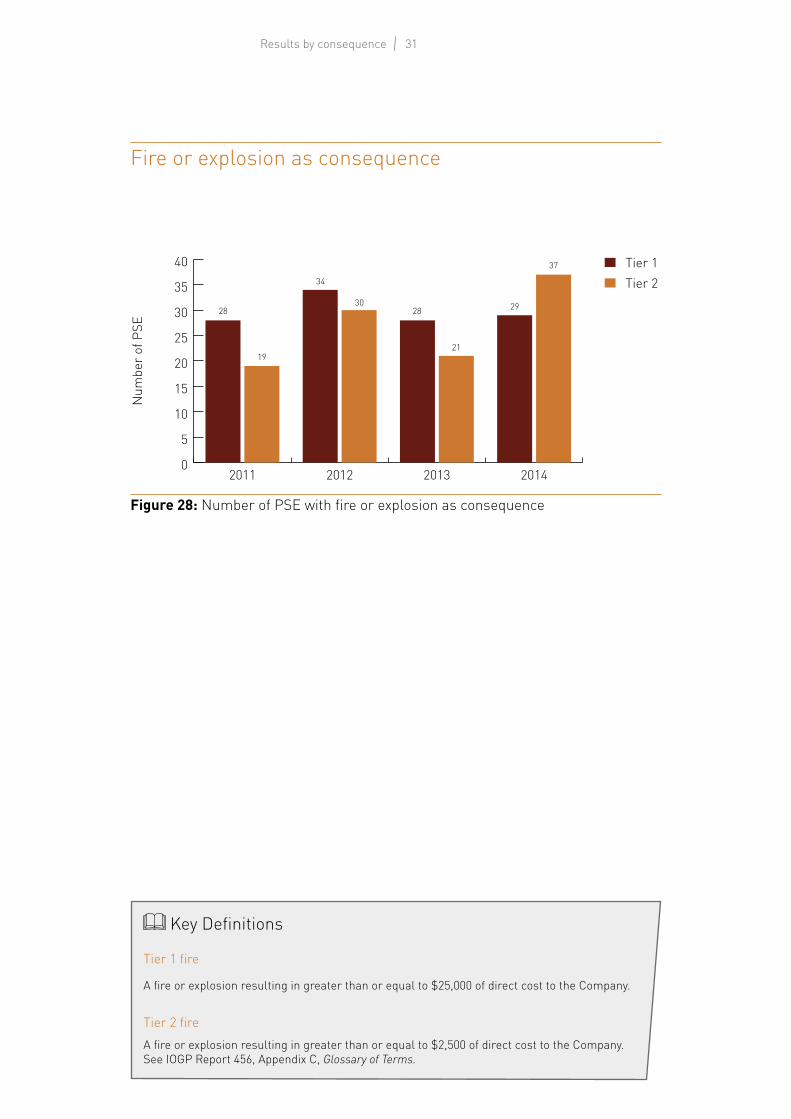
Figure 28: Number of PSE with fire or explosion as consequence
0
5
10
15
20
25
30
35
40
2014201320122011
Num
ber o
f PSE
Tier 1Tier 2
28
19
34
3028
21
29
37
Key Definitions
Tier 1 fire
A fire or explosion resulting in greater than or equal to $25,000 of direct cost to the Company.
Tier 2 fire A fire or explosion resulting in greater than or equal to $2,500 of direct cost to the Company. See IOGP Report 456, Appendix C, Glossary of Terms.
Fire or explosion as consequence
32Process safety events – 2014 data
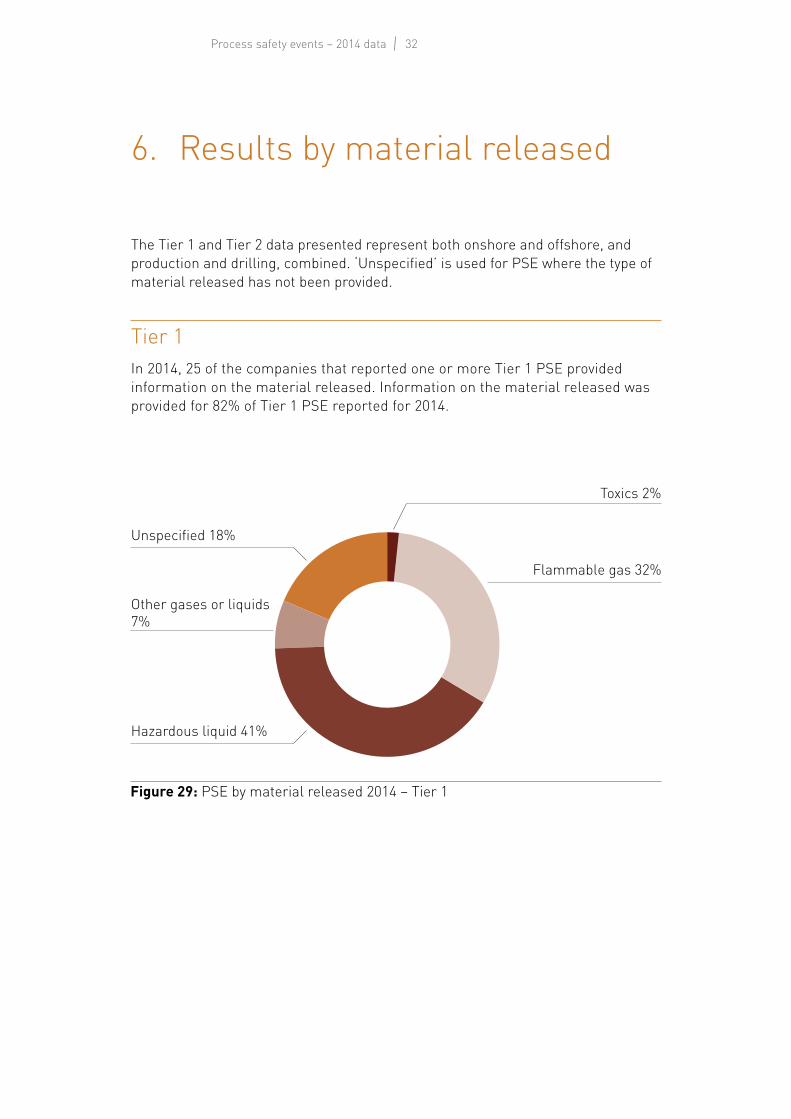
Figure 29: PSE by material released 2014 – Tier 1
Toxics 2%
Flammable gas 32%
Unspecified 18%
Hazardous liquid 41%
Other gases or liquids 7%
6. Results by material released
The Tier 1 and Tier 2 data presented represent both onshore and offshore, and production and drilling, combined. ‘Unspecified’ is used for PSE where the type of material released has not been provided.
Tier 1In 2014, 25 of the companies that reported one or more Tier 1 PSE provided information on the material released. Information on the material released was provided for 82% of Tier 1 PSE reported for 2014.
33Results by material released
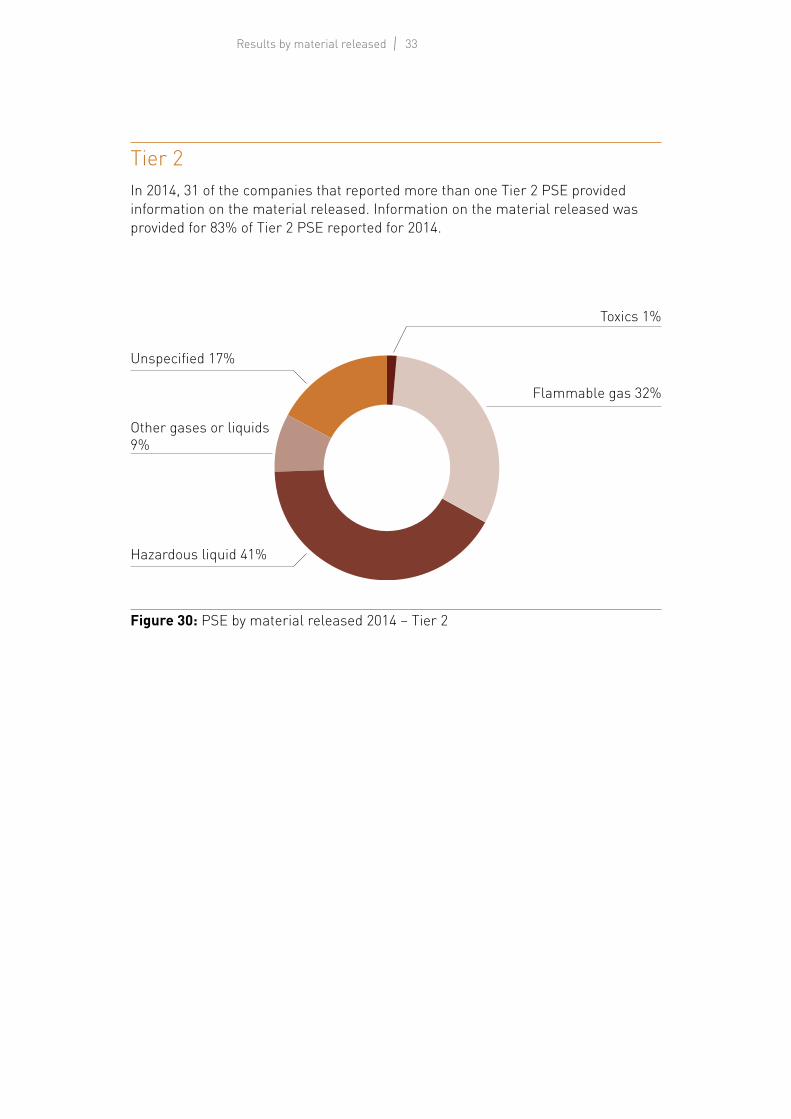
Figure 30: PSE by material released 2014 – Tier 2
Toxics 1%
Flammable gas 32%
Unspecified 17%
Hazardous liquid 41%
Other gases or liquids 9%
Tier 2In 2014, 31 of the companies that reported more than one Tier 2 PSE provided information on the material released. Information on the material released was provided for 83% of Tier 2 PSE reported for 2014.
34Process safety events – 2014 data
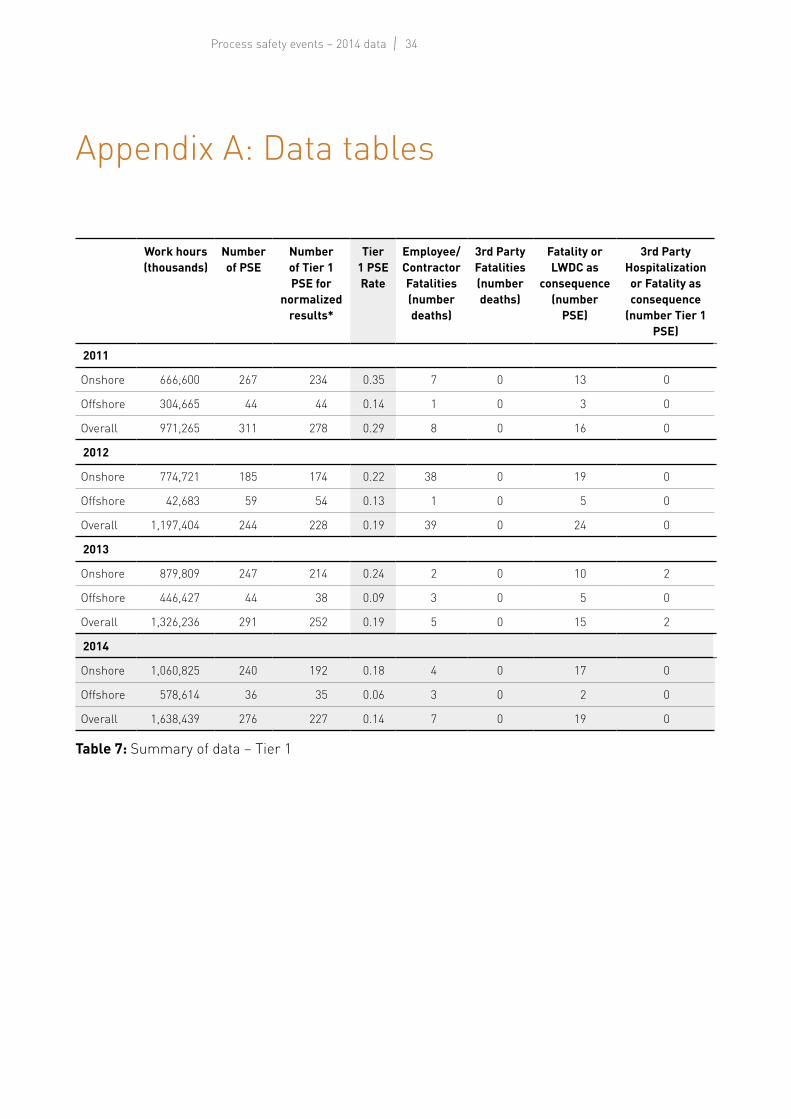
Appendix A: Data tables
Work hours (thousands)
Number of PSE
Number of Tier 1 PSE for
normalized results*
Tier 1 PSE Rate
Employee/ Contractor Fatalities (number deaths)
3rd Party Fatalities (number deaths)
Fatality or LWDC as
consequence (number
PSE)
3rd Party Hospitalization or Fatality as consequence
(number Tier 1 PSE)
2011
Onshore 666,600 267 234 0.35 7 0 13 0
Offshore 304,665 44 44 0.14 1 0 3 0
Overall 971,265 311 278 0.29 8 0 16 0
2012
Onshore 774,721 185 174 0.22 38 0 19 0
Offshore 42,683 59 54 0.13 1 0 5 0
Overall 1,197,404 244 228 0.19 39 0 24 0
2013
Onshore 879,809 247 214 0.24 2 0 10 2
Offshore 446,427 44 38 0.09 3 0 5 0
Overall 1,326,236 291 252 0.19 5 0 15 2
2014
Onshore 1,060,825 240 192 0.18 4 0 17 0
Offshore 578,614 36 35 0.06 3 0 2 0
Overall 1,638,439 276 227 0.14 7 0 19 0
Table 7: Summary of data – Tier 1
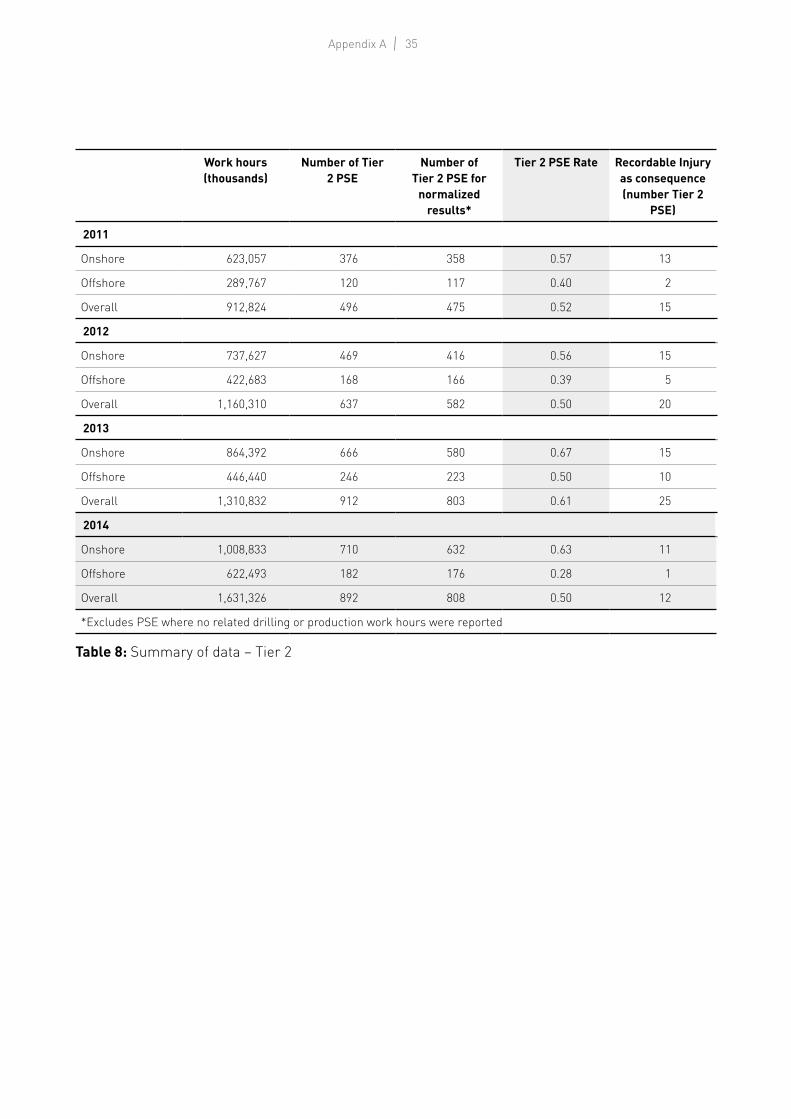
35Appendix A
Work hours (thousands)
Number of Tier 2 PSE
Number of Tier 2 PSE for
normalized results*
Tier 2 PSE Rate Recordable Injury as consequence (number Tier 2
PSE)
2011
Onshore 623,057 376 358 0.57 13
Offshore 289,767 120 117 0.40 2
Overall 912,824 496 475 0.52 15
2012
Onshore 737,627 469 416 0.56 15
Offshore 422,683 168 166 0.39 5
Overall 1,160,310 637 582 0.50 20
2013
Onshore 864,392 666 580 0.67 15
Offshore 446,440 246 223 0.50 10
Overall 1,310,832 912 803 0.61 25
2014
Onshore 1,008,833 710 632 0.63 11
Offshore 622,493 182 176 0.28 1
Overall 1,631,326 892 808 0.50 12
*Excludes PSE where no related drilling or production work hours were reported
Table 8: Summary of data – Tier 2
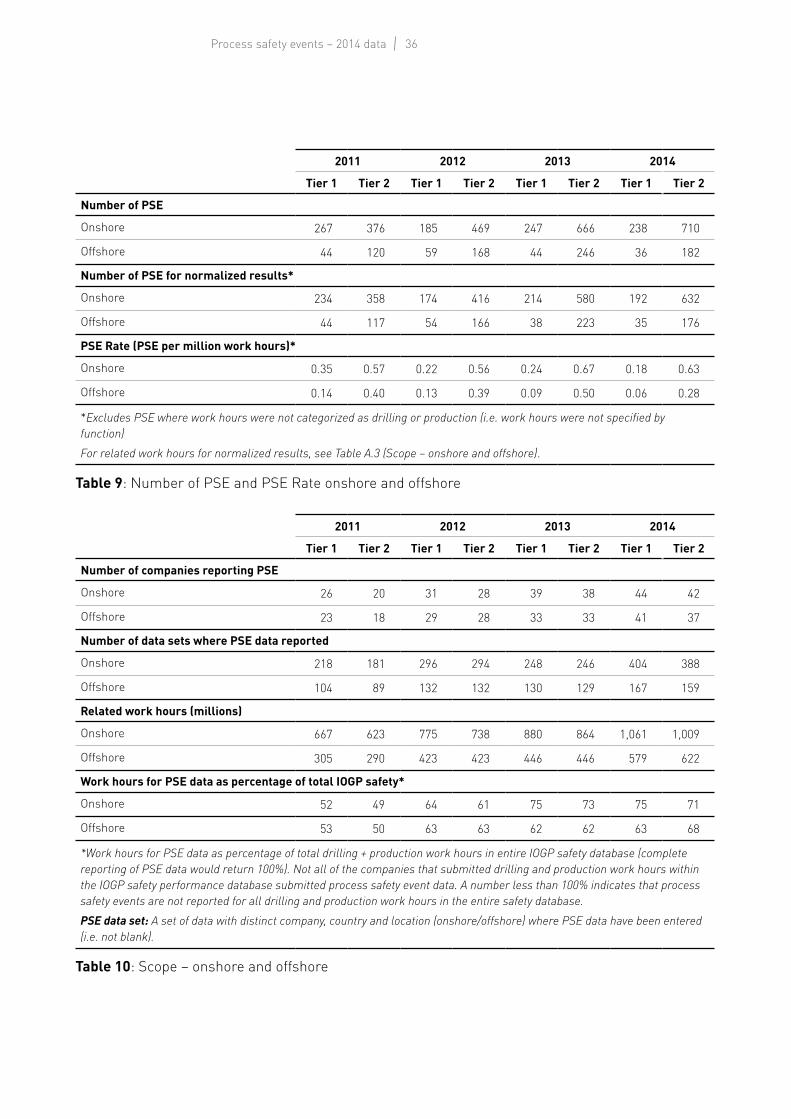
36Process safety events – 2014 data
2011 2012 2013 2014
Tier 1 Tier 2 Tier 1 Tier 2 Tier 1 Tier 2 Tier 1 Tier 2
Number of PSE
Onshore 267 376 185 469 247 666 238 710
Offshore 44 120 59 168 44 246 36 182
Number of PSE for normalized results*
Onshore 234 358 174 416 214 580 192 632
Offshore 44 117 54 166 38 223 35 176
PSE Rate (PSE per million work hours)*
Onshore 0.35 0.57 0.22 0.56 0.24 0.67 0.18 0.63
Offshore 0.14 0.40 0.13 0.39 0.09 0.50 0.06 0.28
*Excludes PSE where work hours were not categorized as drilling or production (i.e. work hours were not specified by function)For related work hours for normalized results, see Table A.3 (Scope – onshore and offshore).
Table 9: Number of PSE and PSE Rate onshore and offshore
2011 2012 2013 2014
Tier 1 Tier 2 Tier 1 Tier 2 Tier 1 Tier 2 Tier 1 Tier 2
Number of companies reporting PSE
Onshore 26 20 31 28 39 38 44 42
Offshore 23 18 29 28 33 33 41 37
Number of data sets where PSE data reported
Onshore 218 181 296 294 248 246 404 388
Offshore 104 89 132 132 130 129 167 159
Related work hours (millions)
Onshore 667 623 775 738 880 864 1,061 1,009
Offshore 305 290 423 423 446 446 579 622
Work hours for PSE data as percentage of total IOGP safety*
Onshore 52 49 64 61 75 73 75 71
Offshore 53 50 63 63 62 62 63 68
*Work hours for PSE data as percentage of total drilling + production work hours in entire IOGP safety database (complete reporting of PSE data would return 100%). Not all of the companies that submitted drilling and production work hours within the IOGP safety performance database submitted process safety event data. A number less than 100% indicates that process safety events are not reported for all drilling and production work hours in the entire safety database.PSE data set: A set of data with distinct company, country and location (onshore/offshore) where PSE data have been entered (i.e. not blank).
Table 10: Scope – onshore and offshore
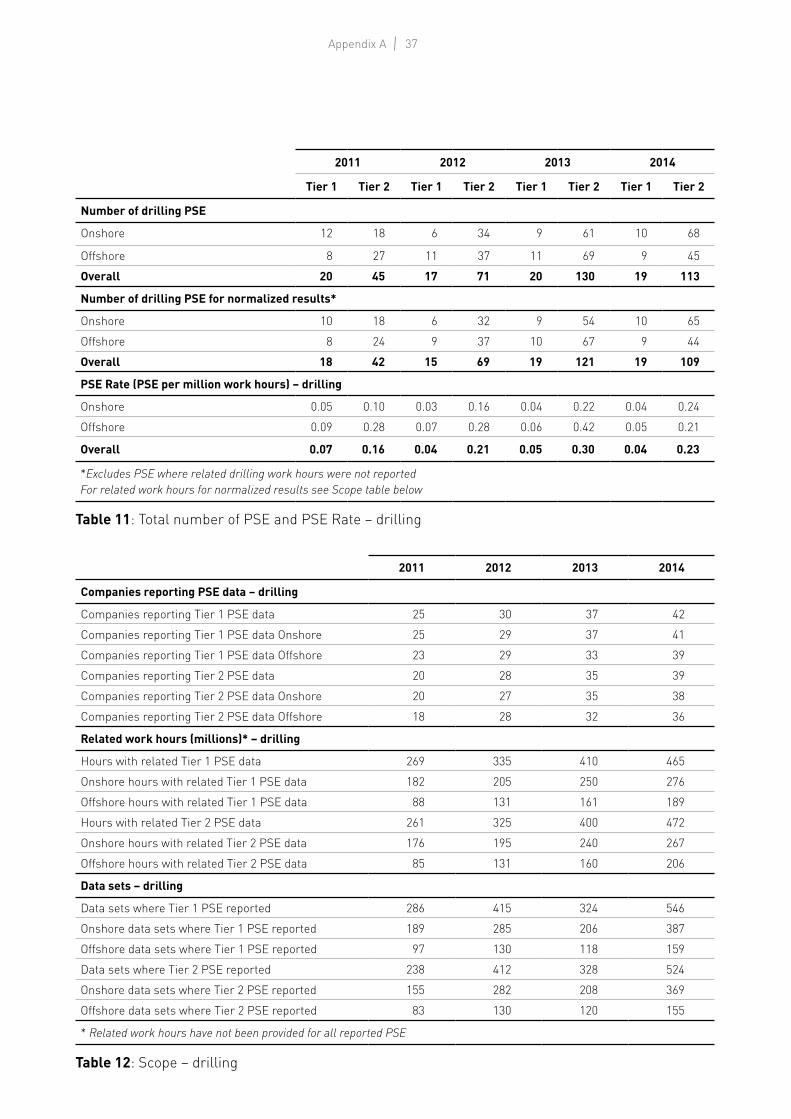
37Appendix A
2011 2012 2013 2014
Tier 1 Tier 2 Tier 1 Tier 2 Tier 1 Tier 2 Tier 1 Tier 2
Number of drilling PSE
Onshore 12 18 6 34 9 61 10 68
Offshore 8 27 11 37 11 69 9 45Overall 20 45 17 71 20 130 19 113
Number of drilling PSE for normalized results*
Onshore 10 18 6 32 9 54 10 65Offshore 8 24 9 37 10 67 9 44Overall 18 42 15 69 19 121 19 109
PSE Rate (PSE per million work hours) – drilling
Onshore 0.05 0.10 0.03 0.16 0.04 0.22 0.04 0.24Offshore 0.09 0.28 0.07 0.28 0.06 0.42 0.05 0.21
Overall 0.07 0.16 0.04 0.21 0.05 0.30 0.04 0.23
*Excludes PSE where related drilling work hours were not reportedFor related work hours for normalized results see Scope table below
Table 11: Total number of PSE and PSE Rate – drilling
2011 2012 2013 2014
Companies reporting PSE data – drilling
Companies reporting Tier 1 PSE data 25 30 37 42Companies reporting Tier 1 PSE data Onshore 25 29 37 41Companies reporting Tier 1 PSE data Offshore 23 29 33 39Companies reporting Tier 2 PSE data 20 28 35 39Companies reporting Tier 2 PSE data Onshore 20 27 35 38Companies reporting Tier 2 PSE data Offshore 18 28 32 36
Related work hours (millions)* – drilling
Hours with related Tier 1 PSE data 269 335 410 465 Onshore hours with related Tier 1 PSE data 182 205 250 276 Offshore hours with related Tier 1 PSE data 88 131 161 189 Hours with related Tier 2 PSE data 261 325 400 472 Onshore hours with related Tier 2 PSE data 176 195 240 267 Offshore hours with related Tier 2 PSE data 85 131 160 206
Data sets – drilling
Data sets where Tier 1 PSE reported 286 415 324 546Onshore data sets where Tier 1 PSE reported 189 285 206 387Offshore data sets where Tier 1 PSE reported 97 130 118 159Data sets where Tier 2 PSE reported 238 412 328 524Onshore data sets where Tier 2 PSE reported 155 282 208 369Offshore data sets where Tier 2 PSE reported 83 130 120 155
* Related work hours have not been provided for all reported PSE
Table 12: Scope – drilling
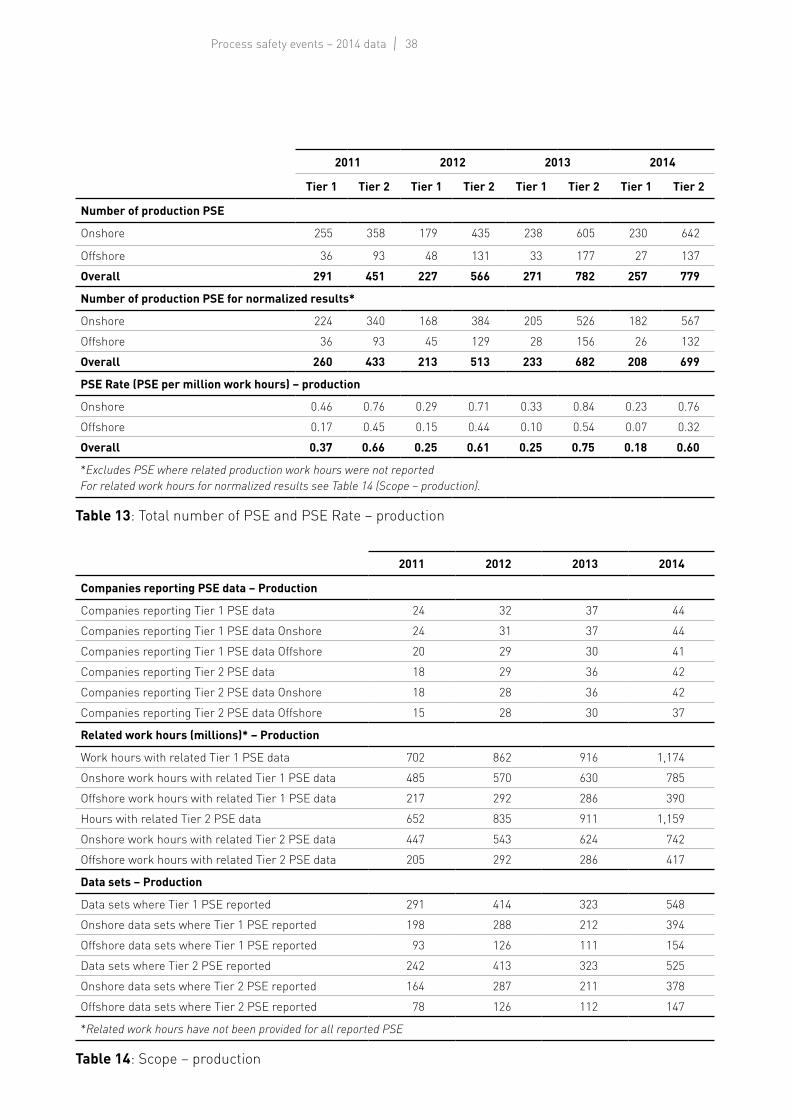
38Process safety events – 2014 data
2011 2012 2013 2014
Tier 1 Tier 2 Tier 1 Tier 2 Tier 1 Tier 2 Tier 1 Tier 2
Number of production PSE
Onshore 255 358 179 435 238 605 230 642
Offshore 36 93 48 131 33 177 27 137Overall 291 451 227 566 271 782 257 779
Number of production PSE for normalized results*
Onshore 224 340 168 384 205 526 182 567Offshore 36 93 45 129 28 156 26 132Overall 260 433 213 513 233 682 208 699
PSE Rate (PSE per million work hours) – production
Onshore 0.46 0.76 0.29 0.71 0.33 0.84 0.23 0.76Offshore 0.17 0.45 0.15 0.44 0.10 0.54 0.07 0.32Overall 0.37 0.66 0.25 0.61 0.25 0.75 0.18 0.60
*Excludes PSE where related production work hours were not reportedFor related work hours for normalized results see Table 14 (Scope – production).
Table 13: Total number of PSE and PSE Rate – production
2011 2012 2013 2014
Companies reporting PSE data – Production
Companies reporting Tier 1 PSE data 24 32 37 44Companies reporting Tier 1 PSE data Onshore 24 31 37 44Companies reporting Tier 1 PSE data Offshore 20 29 30 41Companies reporting Tier 2 PSE data 18 29 36 42Companies reporting Tier 2 PSE data Onshore 18 28 36 42Companies reporting Tier 2 PSE data Offshore 15 28 30 37
Related work hours (millions)* – Production
Work hours with related Tier 1 PSE data 702 862 916 1,174 Onshore work hours with related Tier 1 PSE data 485 570 630 785 Offshore work hours with related Tier 1 PSE data 217 292 286 390 Hours with related Tier 2 PSE data 652 835 911 1,159 Onshore work hours with related Tier 2 PSE data 447 543 624 742 Offshore work hours with related Tier 2 PSE data 205 292 286 417
Data sets – Production
Data sets where Tier 1 PSE reported 291 414 323 548Onshore data sets where Tier 1 PSE reported 198 288 212 394Offshore data sets where Tier 1 PSE reported 93 126 111 154Data sets where Tier 2 PSE reported 242 413 323 525Onshore data sets where Tier 2 PSE reported 164 287 211 378Offshore data sets where Tier 2 PSE reported 78 126 112 147
*Related work hours have not been provided for all reported PSE
Table 14: Scope – production
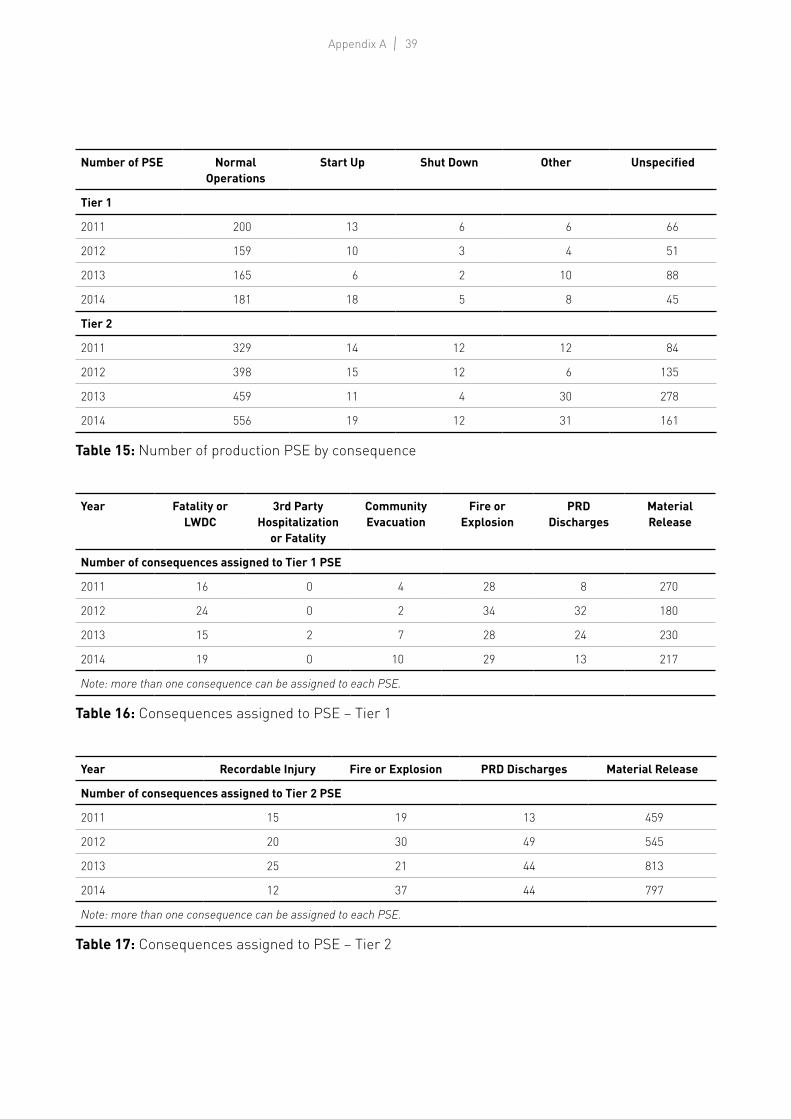
39Appendix A
Number of PSE Normal Operations
Start Up Shut Down Other Unspecified
Tier 1
2011 200 13 6 6 66
2012 159 10 3 4 51
2013 165 6 2 10 88
2014 181 18 5 8 45
Tier 2
2011 329 14 12 12 84
2012 398 15 12 6 135
2013 459 11 4 30 278
2014 556 19 12 31 161
Table 15: Number of production PSE by consequence
Year Fatality or LWDC
3rd Party Hospitalization
or Fatality
Community Evacuation
Fire or Explosion
PRD Discharges
Material Release
Number of consequences assigned to Tier 1 PSE
2011 16 0 4 28 8 270
2012 24 0 2 34 32 180
2013 15 2 7 28 24 230
2014 19 0 10 29 13 217
Note: more than one consequence can be assigned to each PSE.
Table 16: Consequences assigned to PSE – Tier 1
Year Recordable Injury Fire or Explosion PRD Discharges Material Release
Number of consequences assigned to Tier 2 PSE
2011 15 19 13 459
2012 20 30 49 545
2013 25 21 44 813
2014 12 37 44 797
Note: more than one consequence can be assigned to each PSE.
Table 17: Consequences assigned to PSE – Tier 2
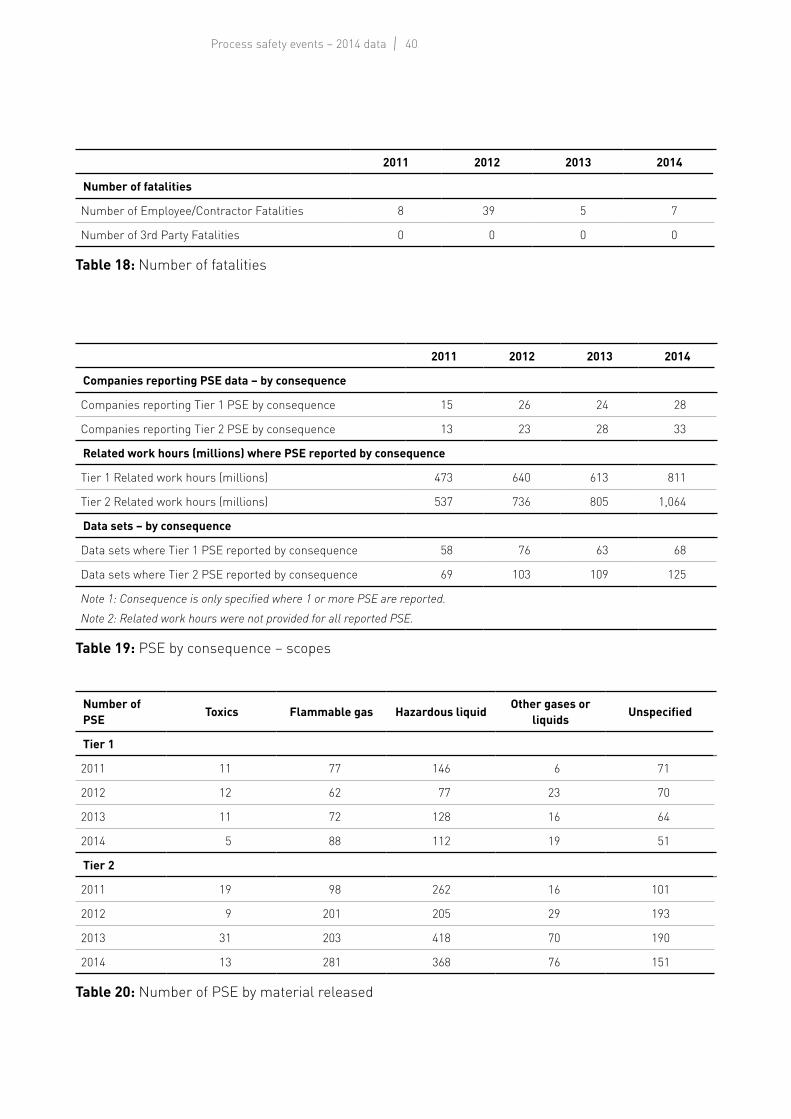
40Process safety events – 2014 data
2011 2012 2013 2014
Number of fatalities
Number of Employee/Contractor Fatalities 8 39 5 7
Number of 3rd Party Fatalities 0 0 0 0
Table 18: Number of fatalities
2011 2012 2013 2014
Companies reporting PSE data – by consequence
Companies reporting Tier 1 PSE by consequence 15 26 24 28
Companies reporting Tier 2 PSE by consequence 13 23 28 33
Related work hours (millions) where PSE reported by consequence
Tier 1 Related work hours (millions) 473 640 613 811
Tier 2 Related work hours (millions) 537 736 805 1,064
Data sets – by consequence
Data sets where Tier 1 PSE reported by consequence 58 76 63 68
Data sets where Tier 2 PSE reported by consequence 69 103 109 125
Note 1: Consequence is only specified where 1 or more PSE are reported.Note 2: Related work hours were not provided for all reported PSE.
Table 19: PSE by consequence – scopes
Number of PSE Toxics Flammable gas Hazardous liquid Other gases or
liquids Unspecified
Tier 1
2011 11 77 146 6 71
2012 12 62 77 23 70
2013 11 72 128 16 64
2014 5 88 112 19 51
Tier 2
2011 19 98 262 16 101
2012 9 201 205 29 193
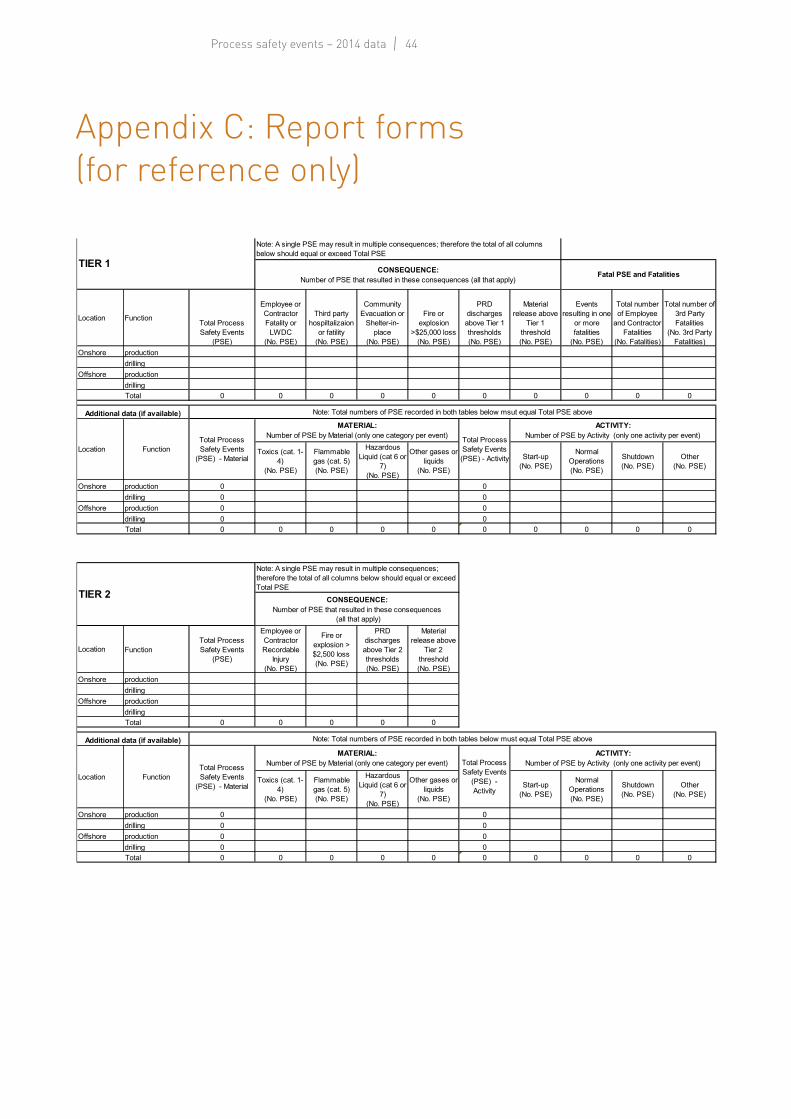
2013 31 203 418 70 190
2014 13 281 368 76 151
Table 20: Number of PSE by material released
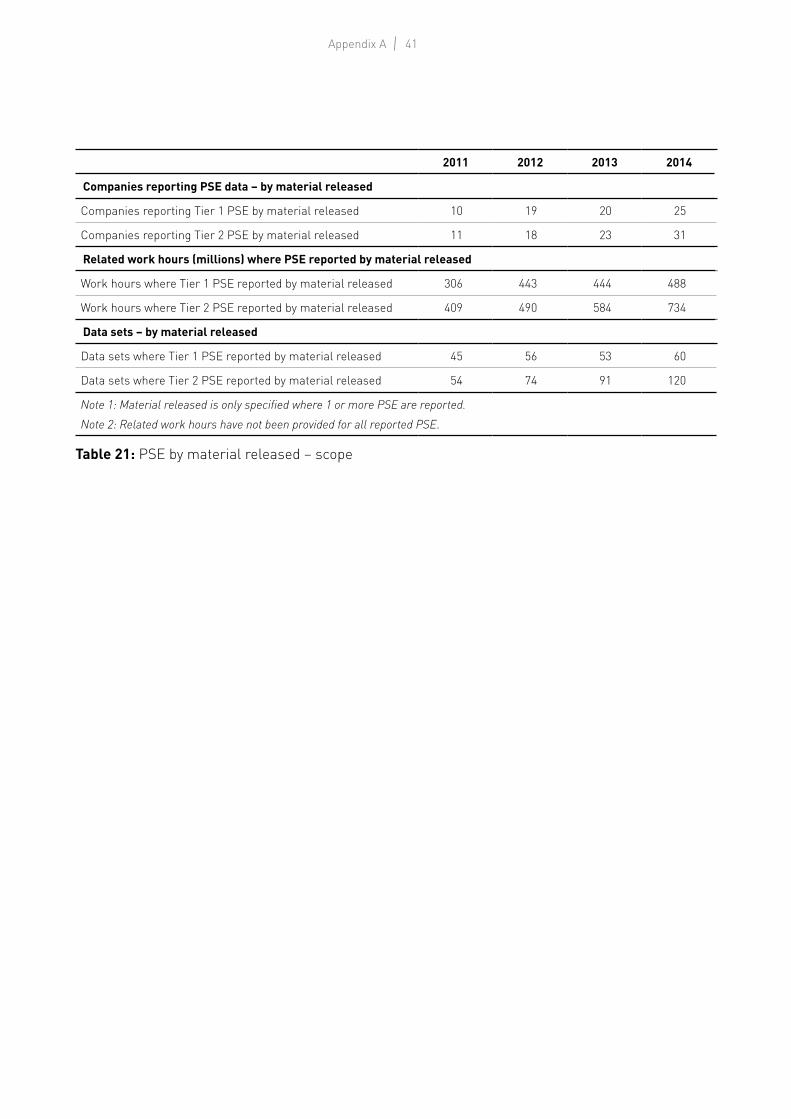
41Appendix A
2011 2012 2013 2014
Companies reporting PSE data – by material released
Companies reporting Tier 1 PSE by material released 10 19 20 25
Companies reporting Tier 2 PSE by material released 11 18 23 31
Related work hours (millions) where PSE reported by material released
Work hours where Tier 1 PSE reported by material released 306 443 444 488
Work hours where Tier 2 PSE reported by material released 409 490 584 734
Data sets – by material released
Data sets where Tier 1 PSE reported by material released 45 56 53 60
Data sets where Tier 2 PSE reported by material released 54 74 91 120
Note 1: Material released is only specified where 1 or more PSE are reported.Note 2: Related work hours have not been provided for all reported PSE.
Table 21: PSE by material released – scope
42Process safety events – 2014 data
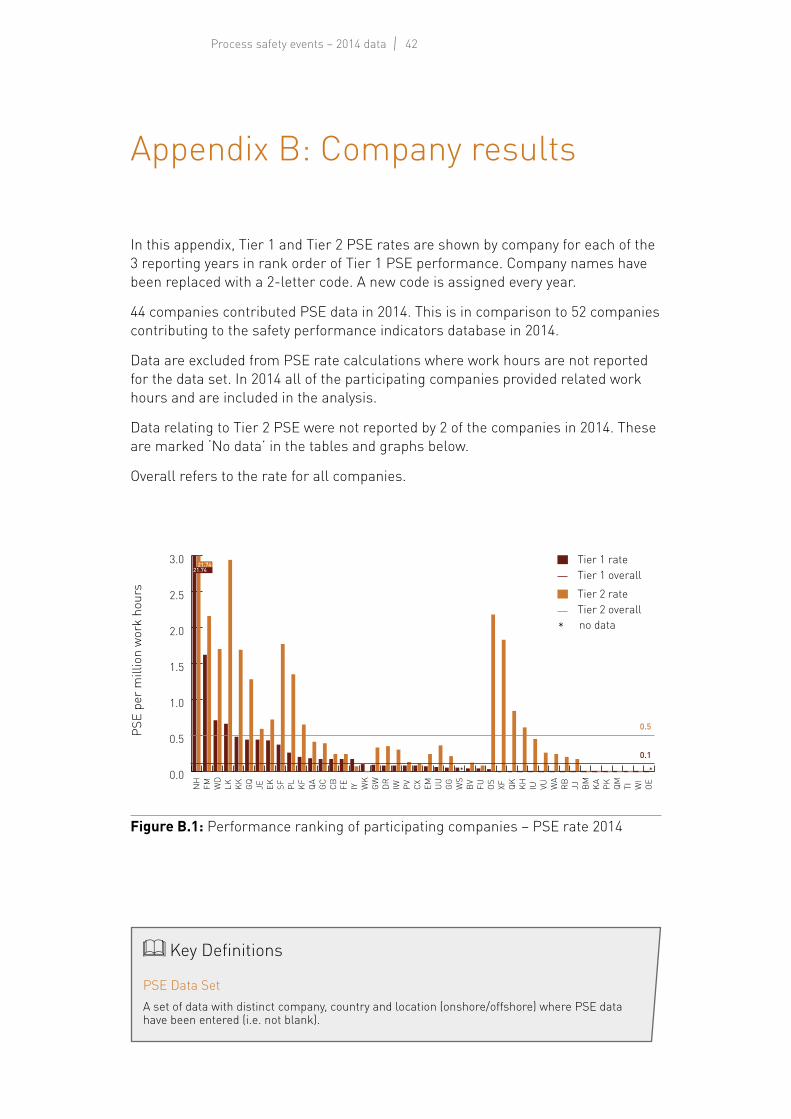
In this appendix, Tier 1 and Tier 2 PSE rates are shown by company for each of the 3 reporting years in rank order of Tier 1 PSE performance. Company names have been replaced with a 2-letter code. A new code is assigned every year.
44 companies contributed PSE data in 2014. This is in comparison to 52 companies contributing to the safety performance indicators database in 2014.
Data are excluded from PSE rate calculations where work hours are not reported for the data set. In 2014 all of the participating companies provided related work hours and are included in the analysis.
Data relating to Tier 2 PSE were not reported by 2 of the companies in 2014. These are marked ‘No data’ in the tables and graphs below.
Overall refers to the rate for all companies.
Appendix B: Company results
Figure B.1: Performance ranking of participating companies – PSE rate 2014
0.0
0.5
1.0
1.5
2.0
2.5
3.0
OE
WI
TI
QM
PK
KA
BM
JJ
RB
W
A
VUIU
KH
QK
XF
OS
FU
BV
WS
GG
U
U
EM
CX
PV
IW
DR
GW
WK
IY
FE
CB
GC
QA
KF
PL
SF
EK
JEGQ
KK
LK
W
D
FM
NH
PSE
per m
illio
n w
ork
hour
s
Tier 1 rateTier 1 overall
* *
Tier 2 rateTier 2 overallno data
0.5
0.1
*
21.7421.74
Key Definitions
PSE Data SetA set of data with distinct company, country and location (onshore/offshore) where PSE data have been entered (i.e. not blank).
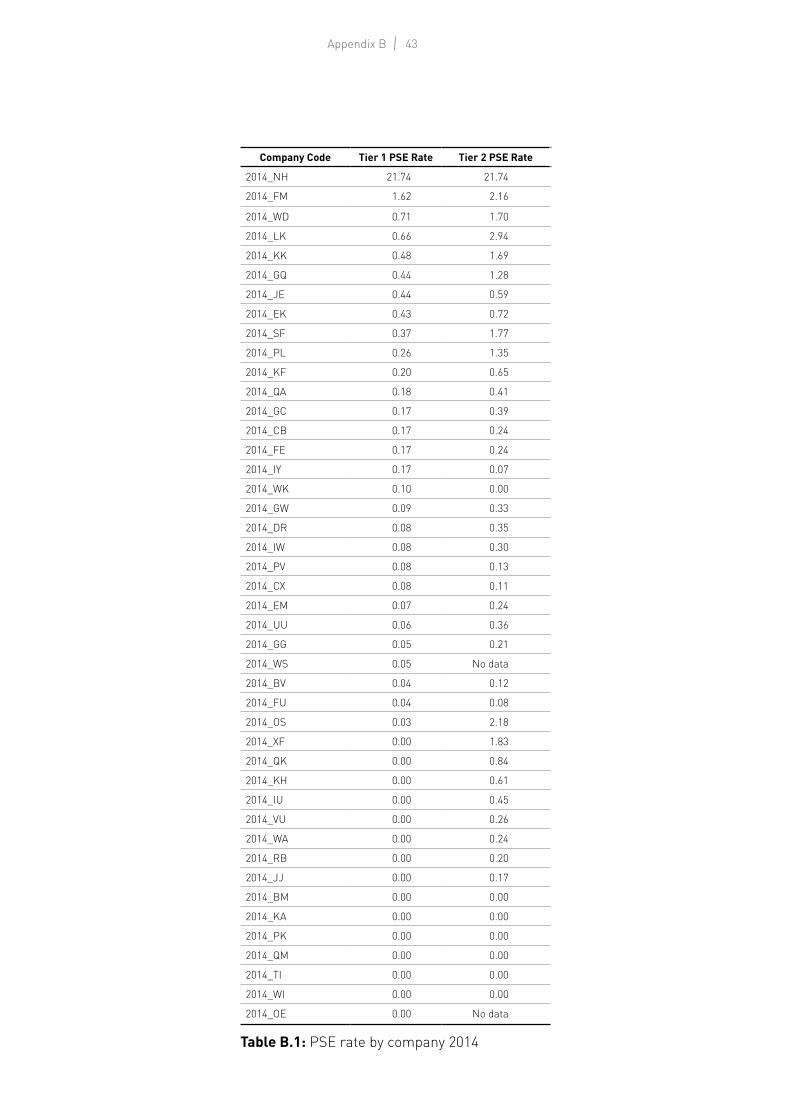
43Appendix B
Company Code Tier 1 PSE Rate Tier 2 PSE Rate
2014_NH 21.74 21.74
2014_FM 1.62 2.16
2014_WD 0.71 1.70
2014_LK 0.66 2.94
2014_KK 0.48 1.69
2014_GQ 0.44 1.28
2014_JE 0.44 0.59
2014_EK 0.43 0.72
2014_SF 0.37 1.77
2014_PL 0.26 1.35
2014_KF 0.20 0.65
2014_QA 0.18 0.41
2014_GC 0.17 0.39
2014_CB 0.17 0.24
2014_FE 0.17 0.24
2014_IY 0.17 0.07
2014_WK 0.10 0.00
2014_GW 0.09 0.33
2014_DR 0.08 0.35
2014_IW 0.08 0.30
2014_PV 0.08 0.13
2014_CX 0.08 0.11
2014_EM 0.07 0.24
2014_UU 0.06 0.36
2014_GG 0.05 0.21
2014_WS 0.05 No data
2014_BV 0.04 0.12
2014_FU 0.04 0.08
2014_OS 0.03 2.18
2014_XF 0.00 1.83
2014_QK 0.00 0.84
2014_KH 0.00 0.61
2014_IU 0.00 0.45
2014_VU 0.00 0.26
2014_WA 0.00 0.24
2014_RB 0.00 0.20
2014_JJ 0.00 0.17
2014_BM 0.00 0.00
2014_KA 0.00 0.00
2014_PK 0.00 0.00
2014_QM 0.00 0.00
2014_TI 0.00 0.00
2014_WI 0.00 0.00
2014_OE 0.00 No data
Table B.1: PSE rate by company 2014
44Process safety events – 2014 data
Appendix C: Report forms (for reference only)
FunctionTotal Process Safety Events
(PSE)
Employee or Contractor Fatality or
LWDC (No. PSE)
Third party hospiltalizaion
or fatility(No. PSE)
Community Evacuation or
Shelter-in-place
(No. PSE)
Fire or explosion
>$25,000 loss(No. PSE)
PRD discharges above Tier 1 thresholds(No. PSE)
Material release above
Tier 1 threshold(No. PSE)
Events resulting in one
or more fatalities
(No. PSE)
Total number of Employee
and Contractor Fatalities
(No. Fatalities)
Total number of 3rd Party Fatalities
(No. 3rd Party Fatalities)
productiondrillingproductiondrilling
0 0 0 0 0 0 0 0 0 0
Toxics (cat. 1-4)
(No. PSE)
Flammable gas (cat. 5)(No. PSE)
Hazardous Liquid (cat 6 or
7)(No. PSE)
Other gases or liquids
(No. PSE)
Start-up(No. PSE)
Normal Operations(No. PSE)
Shutdown(No. PSE)
Other(No. PSE)
production 0 0drilling 0 0production 0 0drilling 0 0
0 0 0 0 0 0 0 0 0 0
FunctionTotal Process Safety Events
(PSE)
Employee or Contractor Recordable
Injury(No. PSE)
Fire or explosion > $2,500 loss(No. PSE)
PRD discharges above Tier 2 thresholds(No. PSE)
Material release above
Tier 2 threshold(No. PSE)
productiondrillingproductiondrilling
0 0 0 0 0
Toxics (cat. 1-4)
(No. PSE)
Flammable gas (cat. 5)(No. PSE)
Hazardous Liquid (cat 6 or
7)(No. PSE)
Other gases or liquids
(No. PSE)
Start-up(No. PSE)
Normal Operations(No. PSE)
Shutdown(No. PSE)
Other(No. PSE)
production 0 0drilling 0 0production 0 0drilling 0 0
0 0 0 0 0 0 0 0 0 0
ACTIVITY: Number of PSE by Activity (only one activity per event)
Onshore
Offshore
Total
Total
Additional data (if available) Note: Total numbers of PSE recorded in both tables below must equal Total PSE above
Location FunctionTotal Process Safety Events
(PSE) - Material
MATERIAL: Number of PSE by Material (only one category per event) Total Process
Safety Events (PSE) - Activity
Note: A single PSE may result in multiple consequences; therefore the total of all columns below should equal or exceed Total PSE
CONSEQUENCE: Number of PSE that resulted in these consequences
(all that apply)
Location
Onshore
Offshore
TIER 2
Onshore
Offshore
Total
Location FunctionTotal Process Safety Events
(PSE) - Material
MATERIAL: Number of PSE by Material (only one category per event) Total Process
Safety Events (PSE) - Activity
ACTIVITY: Number of PSE by Activity (only one activity per event)
Offshore
Total
Additional data (if available) Note: Total numbers of PSE recorded in both tables below msut equal Total PSE above
Note: A single PSE may result in multiple consequences; therefore the total of all columns below should equal or exceed Total PSE
CONSEQUENCE: Number of PSE that resulted in these consequences (all that apply)
Fatal PSE and Fatalities
Location
Onshore
TIER 1

45

46Process safety events – 2014 data

47
Registered OfficeLevel 5209–215 Blackfriars RdLondon SE1 8NLUnited Kingdom
Brussels OfficeBd du Souverain,1654th FloorB-1160 BrusselsBelgium
T +44 (0)20 3763 9700F +44 (0)20 3763 [email protected]
T +32 (0)2 566 9150 F +32 (0)2 566 9159
www.iogp.org
The Process Safety Event data presented in this report are based on voluntary submissions from participating IOGP member companies and are not representative of the entire upstream oil and gas industry. Since this is only the second PSE report published by IOGP, readers are cautioned not to attempt to identify trends at this point.
The Process Safety Events (PSE) data presented are based on the numbers of Tier 1 and Tier 2 PSE reported by participating IOGP member companies, separately for:
• onshore and offshore• drilling and production• activities• consequences• material released.