Introducing S.4840-The New York Health Act. Introducing S ...
Place your chosen image here. The four corners must just cover the arrow tips. For covers, the three pictures should be the same size and in a straight line.
Introducing and Managing Process Safety Key Performance Indicators (KPIs)
Neil Jackson, Process Safety Manager National Grid - Gas Distribution
2
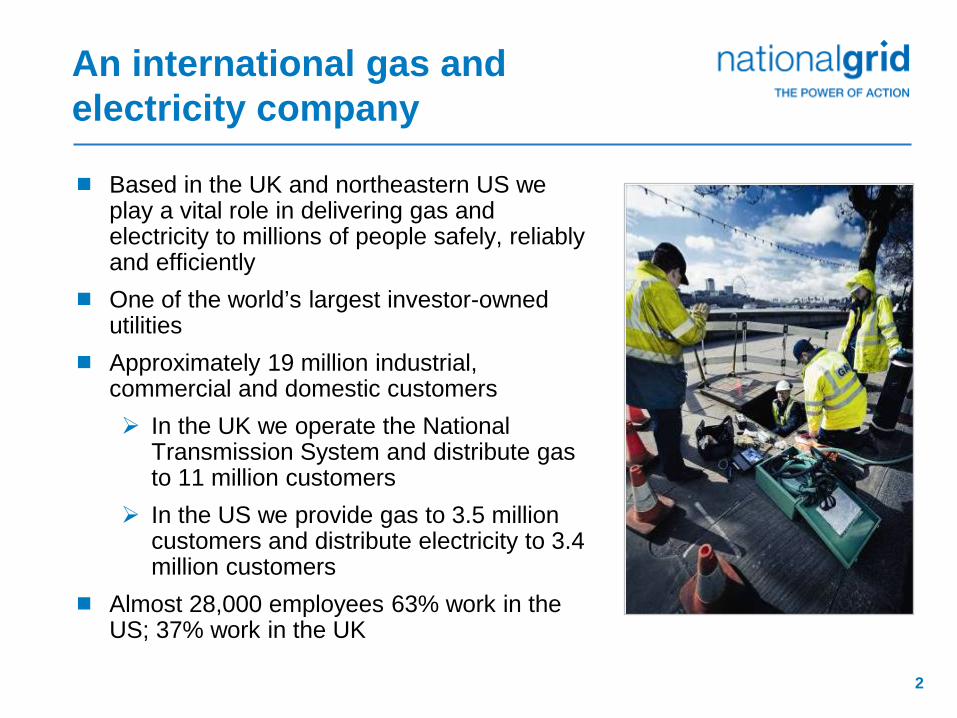
An international gas and electricity company
Based in the UK and northeastern US we play a vital role in delivering gas and electricity to millions of people safely, reliably and efficiently
One of the world’s largest investor-owned utilities
Approximately 19 million industrial, commercial and domestic customers In the UK we operate the National
Transmission System and distribute gas to 11 million customers
In the US we provide gas to 3.5 million customers and distribute electricity to 3.4 million customers
Almost 28,000 employees 63% work in the US; 37% work in the UK
3
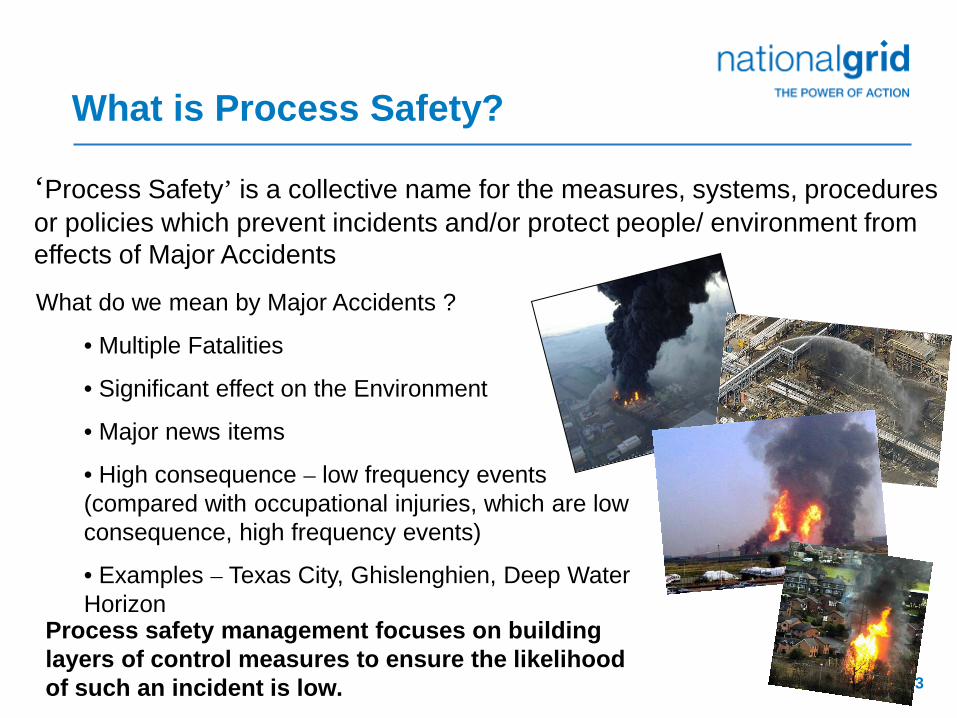
What is Process Safety?
‘Process Safety’ is a collective name for the measures, systems, procedures or policies which prevent incidents and/or protect people/ environment from effects of Major Accidents
What do we mean by Major Accidents ?
• Multiple Fatalities
• Significant effect on the Environment
• Major news items
• High consequence – low frequency events (compared with occupational injuries, which are low consequence, high frequency events)
• Examples – Texas City, Ghislenghien, Deep Water Horizon
Process safety management focuses on building layers of control measures to ensure the likelihood of such an incident is low.
4
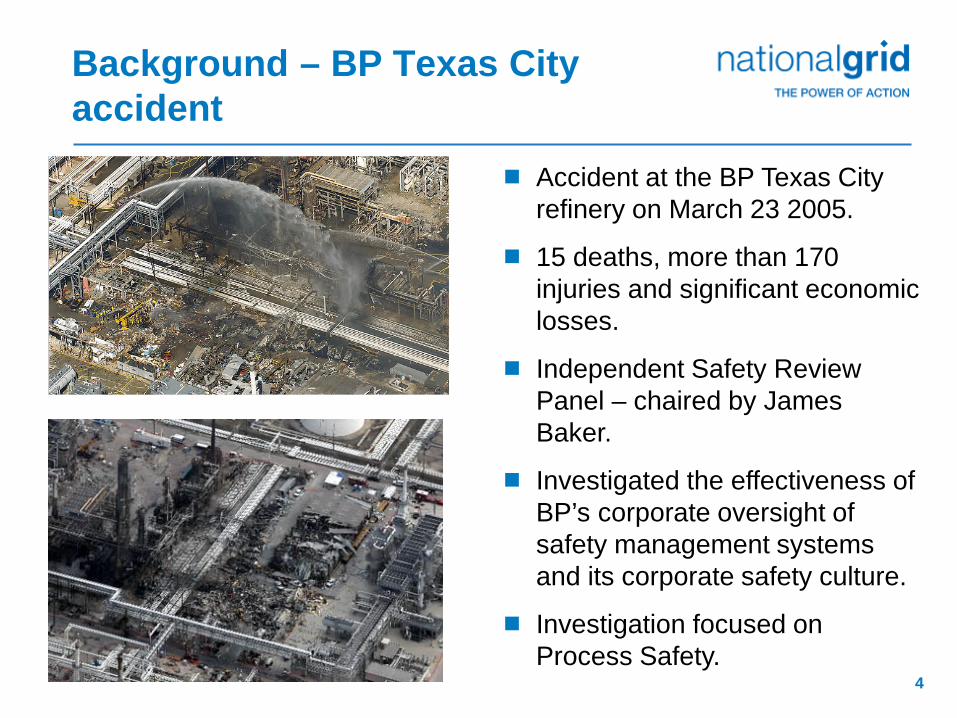
Background – BP Texas City accident
Accident at the BP Texas City refinery on March 23 2005.
15 deaths, more than 170 injuries and significant economic losses.
Independent Safety Review Panel – chaired by James Baker.
Investigated the effectiveness of BP’s corporate oversight of safety management systems and its corporate safety culture.
Investigation focused on Process Safety.
5
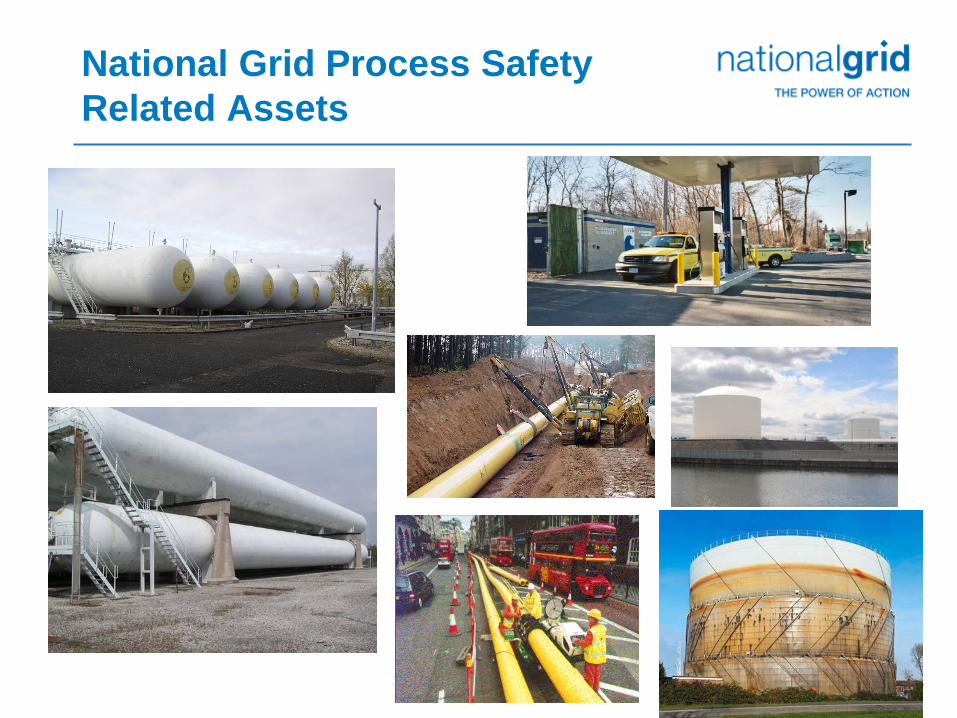
National Grid Process Safety Related Assets
6
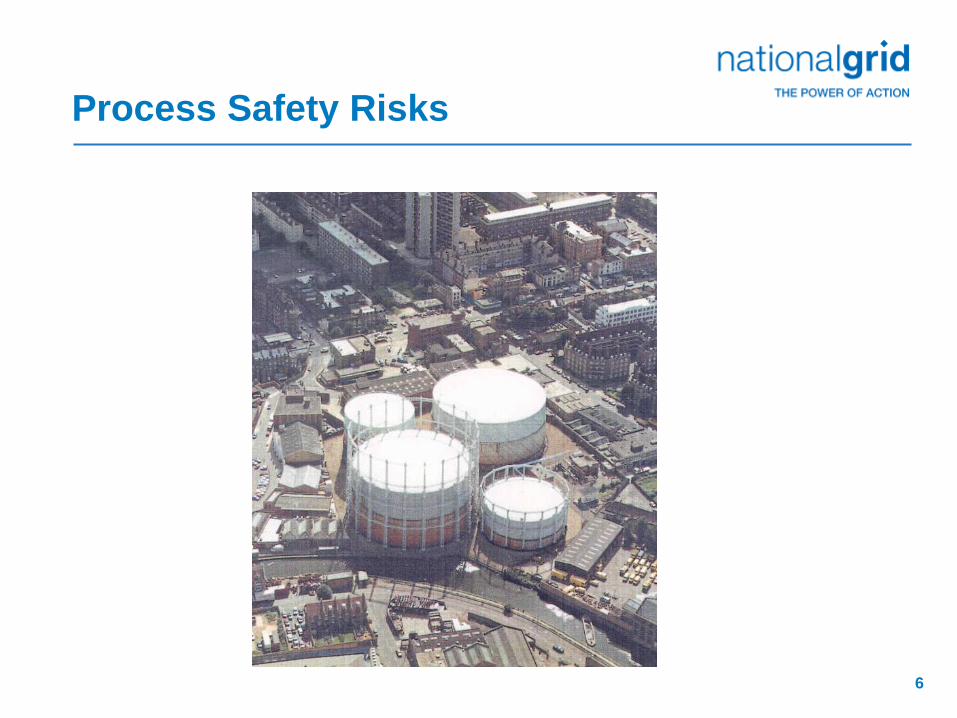
Process Safety Risks
7
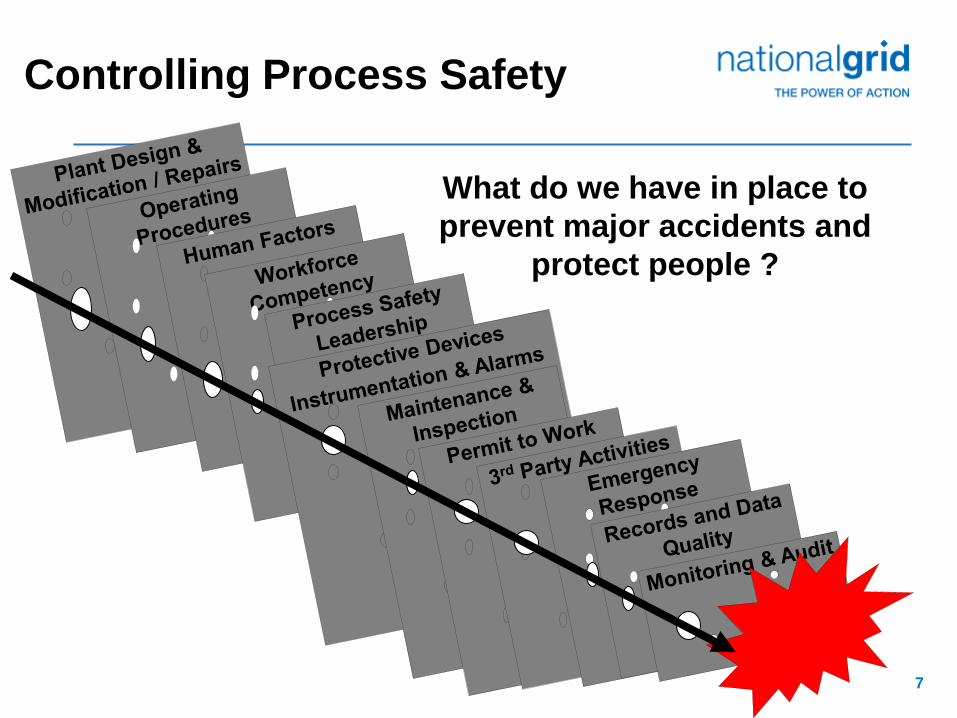
Controlling Process Safety
What do we have in place to prevent major accidents and
protect people ?
8
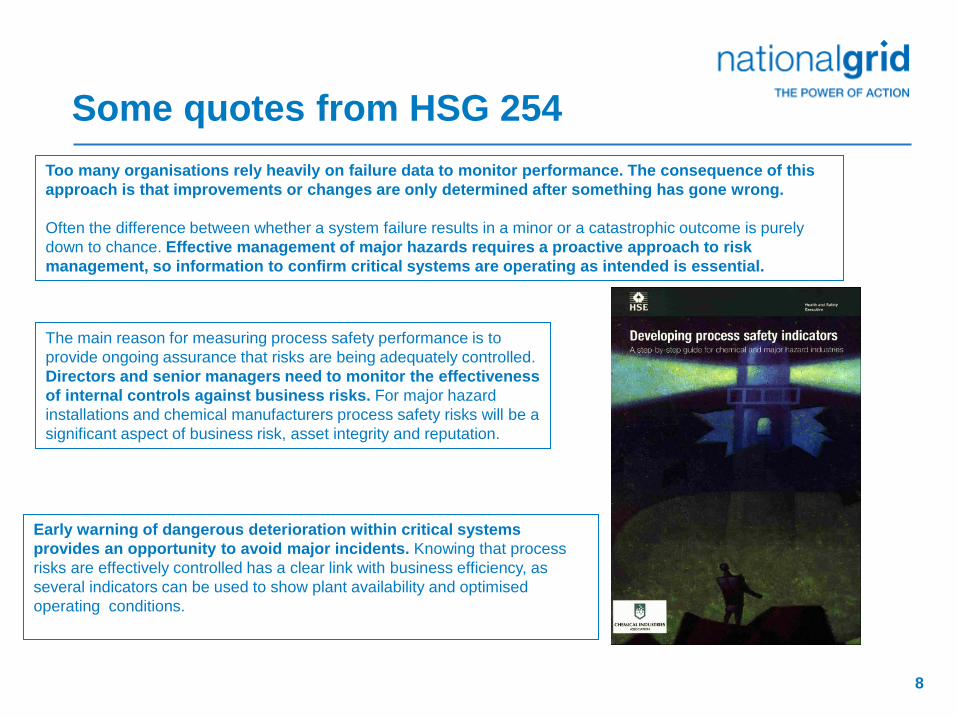
Some quotes from HSG 254 Too many organisations rely heavily on failure data to monitor performance. The consequence of this approach is that improvements or changes are only determined after something has gone wrong. Often the difference between whether a system failure results in a minor or a catastrophic outcome is purely down to chance. Effective management of major hazards requires a proactive approach to risk management, so information to confirm critical systems are operating as intended is essential.
The main reason for measuring process safety performance is to provide ongoing assurance that risks are being adequately controlled. Directors and senior managers need to monitor the effectiveness of internal controls against business risks. For major hazard installations and chemical manufacturers process safety risks will be a significant aspect of business risk, asset integrity and reputation.
Early warning of dangerous deterioration within critical systems provides an opportunity to avoid major incidents. Knowing that process risks are effectively controlled has a clear link with business efficiency, as several indicators can be used to show plant availability and optimised operating conditions.
9
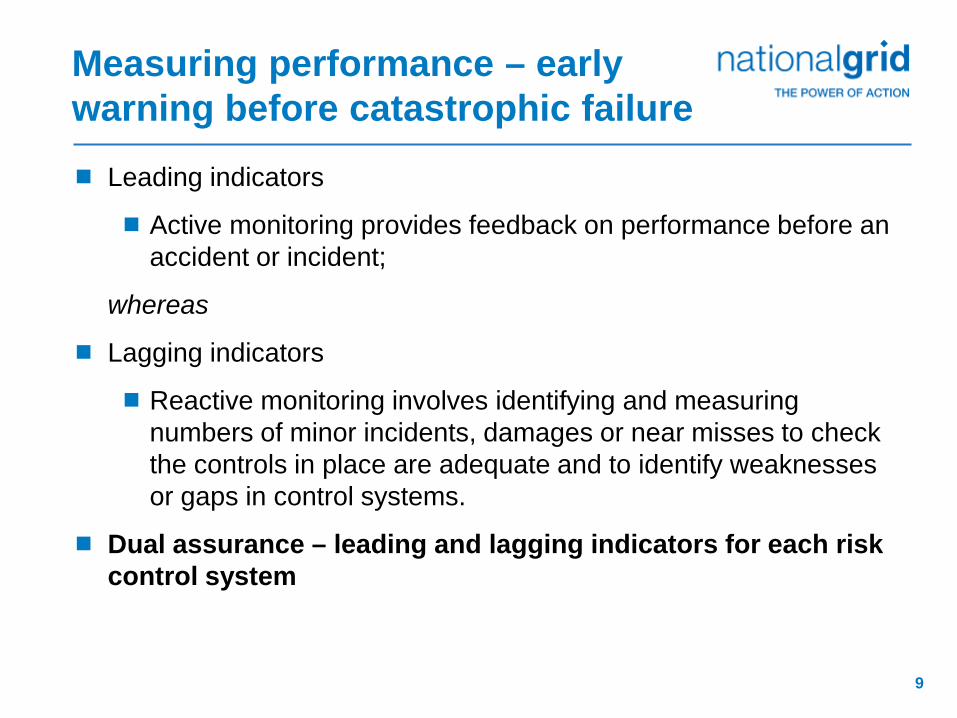
Measuring performance – early warning before catastrophic failure
Leading indicators
Active monitoring provides feedback on performance before an accident or incident;
whereas
Lagging indicators
Reactive monitoring involves identifying and measuring numbers of minor incidents, damages or near misses to check the controls in place are adequate and to identify weaknesses or gaps in control systems.
Dual assurance – leading and lagging indicators for each risk control system
10
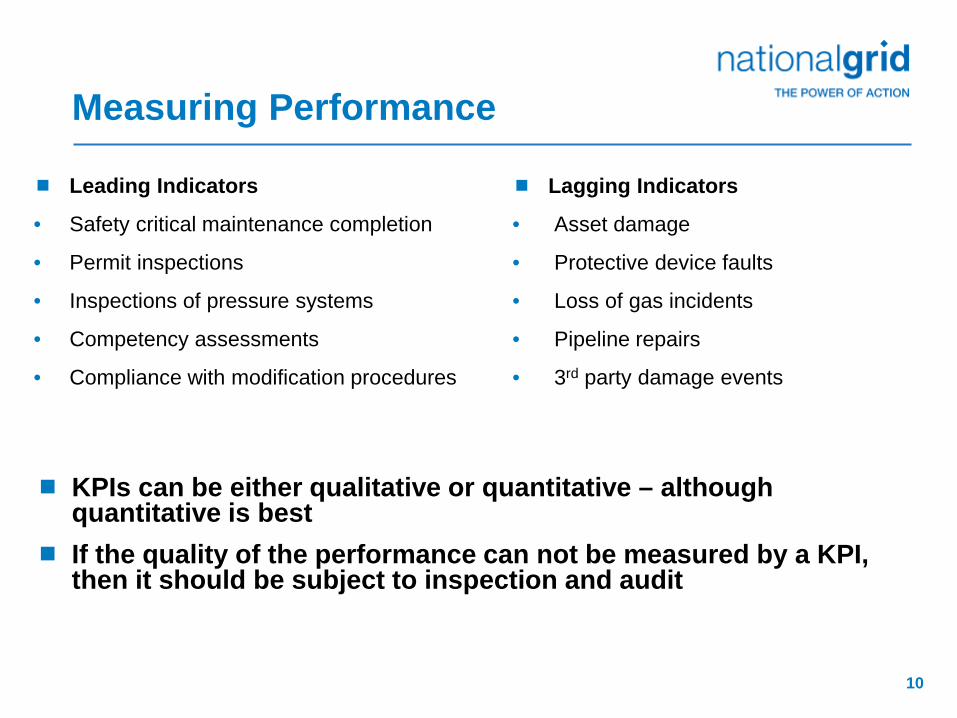
Measuring Performance
Leading Indicators
• Safety critical maintenance completion
• Permit inspections
• Inspections of pressure systems
• Competency assessments
• Compliance with modification procedures
Lagging Indicators
• Asset damage
• Protective device faults
• Loss of gas incidents
• Pipeline repairs
• 3rd party damage events
KPIs can be either qualitative or quantitative – although quantitative is best
If the quality of the performance can not be measured by a KPI, then it should be subject to inspection and audit
11
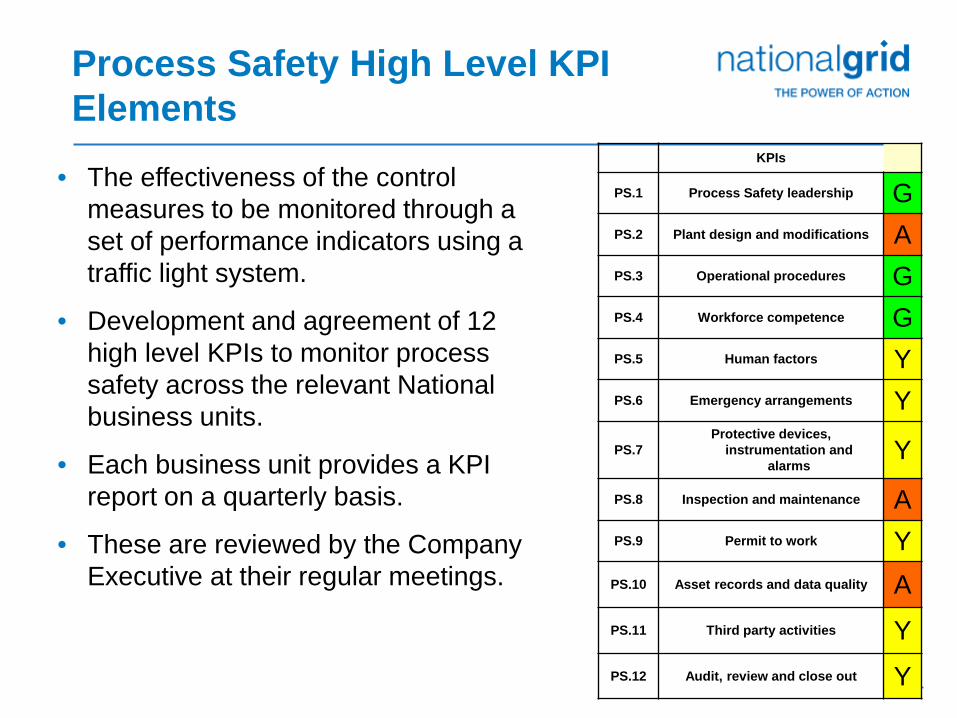
Process Safety High Level KPI Elements
• The effectiveness of the control measures to be monitored through a set of performance indicators using a traffic light system.
• Development and agreement of 12 high level KPIs to monitor process safety across the relevant National business units.
• Each business unit provides a KPI report on a quarterly basis.
• These are reviewed by the Company Executive at their regular meetings.
KPIs
PS.1 Process Safety leadership G PS.2 Plant design and modifications A PS.3 Operational procedures G PS.4 Workforce competence G PS.5 Human factors Y PS.6 Emergency arrangements Y PS.7
Protective devices, instrumentation and
alarms Y
PS.8 Inspection and maintenance A PS.9 Permit to work Y PS.10 Asset records and data quality A PS.11 Third party activities Y PS.12 Audit, review and close out Y
12
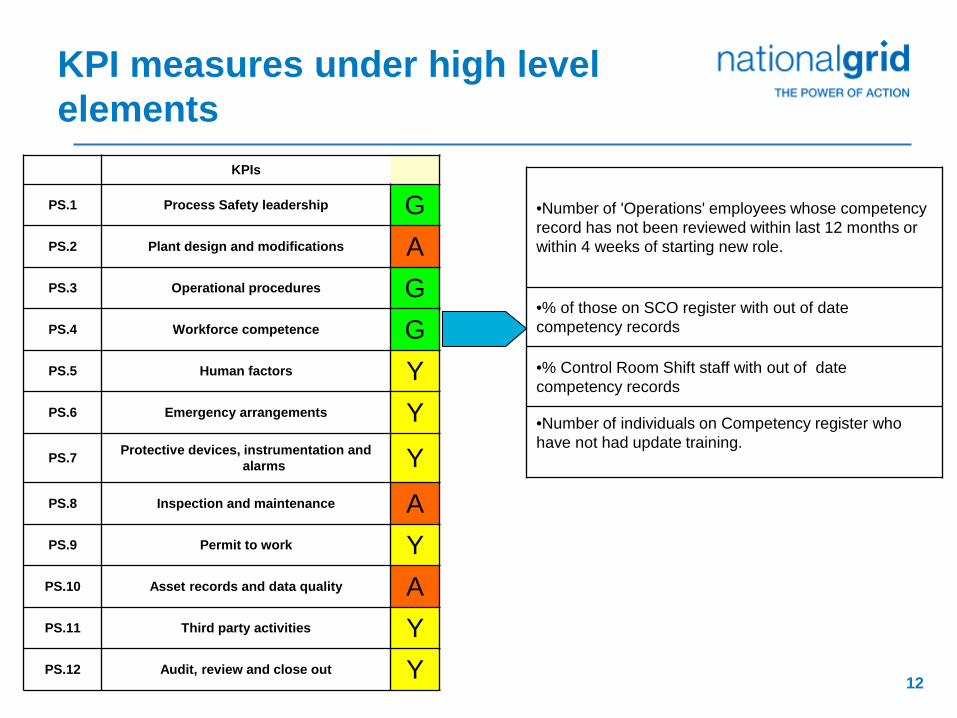
KPI measures under high level elements KPIs
PS.1 Process Safety leadership G PS.2 Plant design and modifications A PS.3 Operational procedures G PS.4 Workforce competence G PS.5 Human factors Y PS.6 Emergency arrangements Y PS.7 Protective devices, instrumentation and
alarms Y PS.8 Inspection and maintenance A PS.9 Permit to work Y PS.10 Asset records and data quality A PS.11 Third party activities Y PS.12 Audit, review and close out Y
•Number of 'Operations' employees whose competency record has not been reviewed within last 12 months or within 4 weeks of starting new role.
•% of those on SCO register with out of date competency records
•% Control Room Shift staff with out of date competency records
•Number of individuals on Competency register who have not had update training.

13
KPI measures under high level elements
KPIs
PS.1 Process Safety leadership G PS.2 Plant design and modifications A PS.3 Operational procedures G PS.4 Workforce competence G PS.5 Human factors Y PS.6 Emergency arrangements Y PS.7 Protective devices, instrumentation and
alarms Y PS.8 Inspection and maintenance A PS.9 Permit to work Y PS.10 Asset records and data quality A PS.11 Third party activities Y PS.12 Audit, review and close out Y
• Have network gas supply emergency plans been tested in line with the plan
• Have the site emergency plans been tested in line with the plan
• Have the standards of service for responding to gas escapes been met
• Have there been any significant events reported
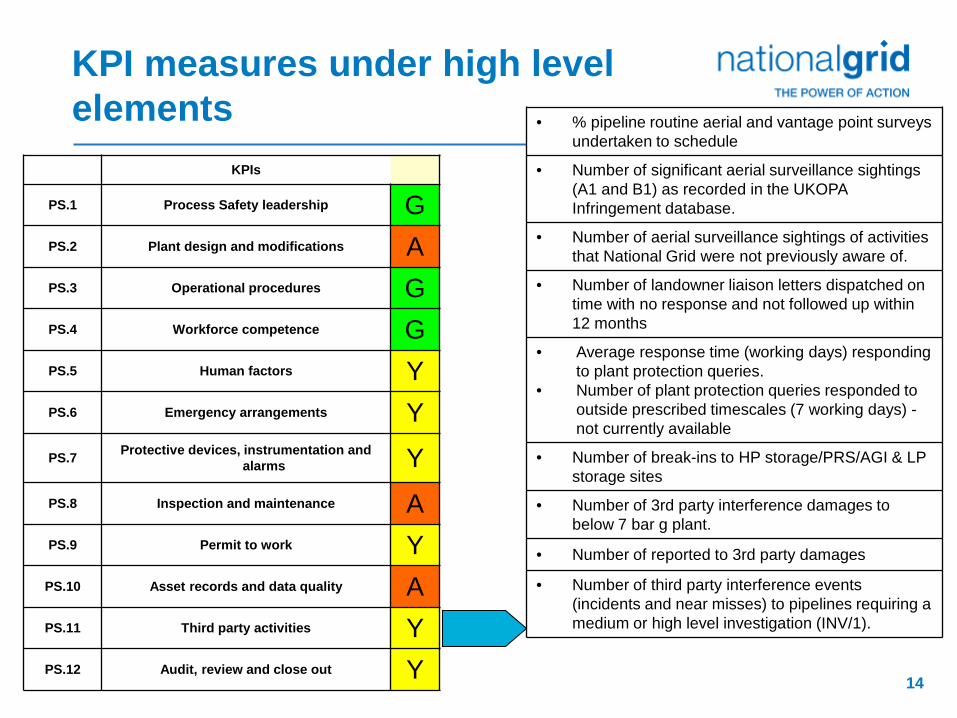
14
KPI measures under high level elements • % pipeline routine aerial and vantage point surveys
undertaken to schedule
• Number of significant aerial surveillance sightings (A1 and B1) as recorded in the UKOPA Infringement database.
• Number of aerial surveillance sightings of activities that National Grid were not previously aware of.
• Number of landowner liaison letters dispatched on time with no response and not followed up within 12 months
• Average response time (working days) responding to plant protection queries.
• Number of plant protection queries responded to outside prescribed timescales (7 working days) - not currently available
• Number of break-ins to HP storage/PRS/AGI & LP storage sites
• Number of 3rd party interference damages to below 7 bar g plant.
• Number of reported to 3rd party damages
• Number of third party interference events (incidents and near misses) to pipelines requiring a medium or high level investigation (INV/1).
KPIs
PS.1 Process Safety leadership G PS.2 Plant design and modifications A PS.3 Operational procedures G PS.4 Workforce competence G PS.5 Human factors Y PS.6 Emergency arrangements Y PS.7 Protective devices, instrumentation and
alarms Y PS.8 Inspection and maintenance A PS.9 Permit to work Y PS.10 Asset records and data quality A PS.11 Third party activities Y PS.12 Audit, review and close out Y

15
Traffic Light Scoring
G Compliance on Target, no serious issues
Y There is some level of non compliance but this is limited and not representative of the overall level of compliance
A
There are significant compliance failures and/or failings in the control process, but there is an action plan in place and the issues are known about by senior management
R High level of non compliance and there is not control framework in place or a significant incident has occurred or a significant audit finding
16
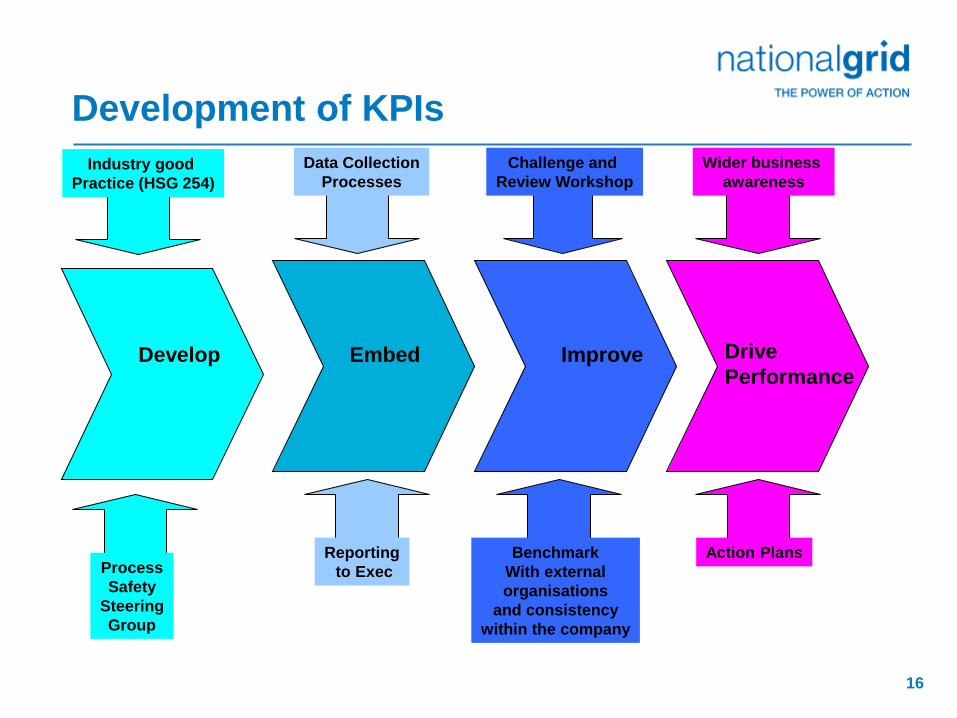
Development of KPIs
Develop Improve Embed
Drive Performance
Data Collection Processes
Reporting to Exec
Wider business awareness
Challenge and Review Workshop
Process Safety
Steering Group
Action Plans
Industry good Practice (HSG 254)
Benchmark With external organisations
and consistency within the company
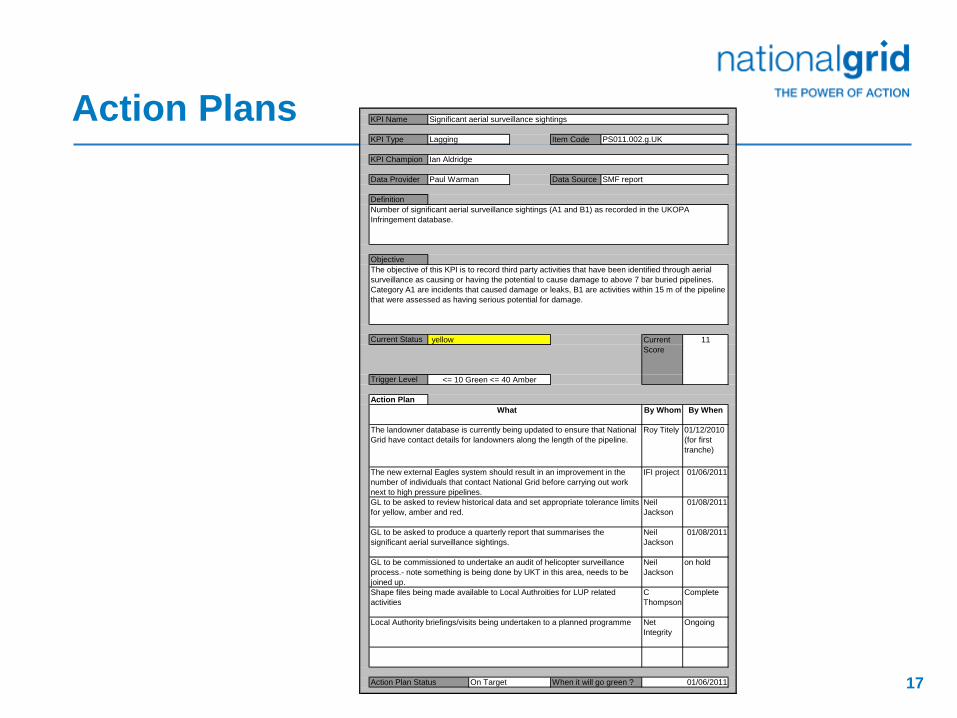
17
Action Plans KPI Name
KPI Type Item Code
KPI Champion
Data Provider Data Source
Definition
Objective
Current Status
Trigger Level
Action PlanBy Whom By When
11 yellow
Shape files being made available to Local Authroities for LUP related activities
C Thompson
Complete
Local Authority briefings/visits being undertaken to a planned programme Net Integrity
Ongoing
GL to be asked to produce a quarterly report that summarises the significant aerial surveillance sightings.
Neil Jackson
01/08/2011
GL to be commissioned to undertake an audit of helicopter surveillance process.- note something is being done by UKT in this area, needs to be joined up.
Neil Jackson
on hold
The new external Eagles system should result in an improvement in the number of individuals that contact National Grid before carrying out work next to high pressure pipelines.
IFI project 01/06/2011
GL to be asked to review historical data and set appropriate tolerance limits for yellow, amber and red.
Neil Jackson
01/08/2011
Action Plan Status On Target When it will go green ? 01/06/2011
What
The landowner database is currently being updated to ensure that National Grid have contact details for landowners along the length of the pipeline.
Roy Titely
Paul Warman SMF report
Number of significant aerial surveillance sightings (A1 and B1) as recorded in the UKOPA Infringement database.
The objective of this KPI is to record third party activities that have been identified through aerial surveillance as causing or having the potential to cause damage to above 7 bar buried pipelines. Category A1 are incidents that caused damage or leaks, B1 are activities within 15 m of the pipeline that were assessed as having serious potential for damage.
01/12/2010 (for first tranche)
<= 10 Green <= 40 Amber
Current Score
Significant aerial surveillance sightings
Lagging PS011.002.g.UK
Ian Aldridge
18
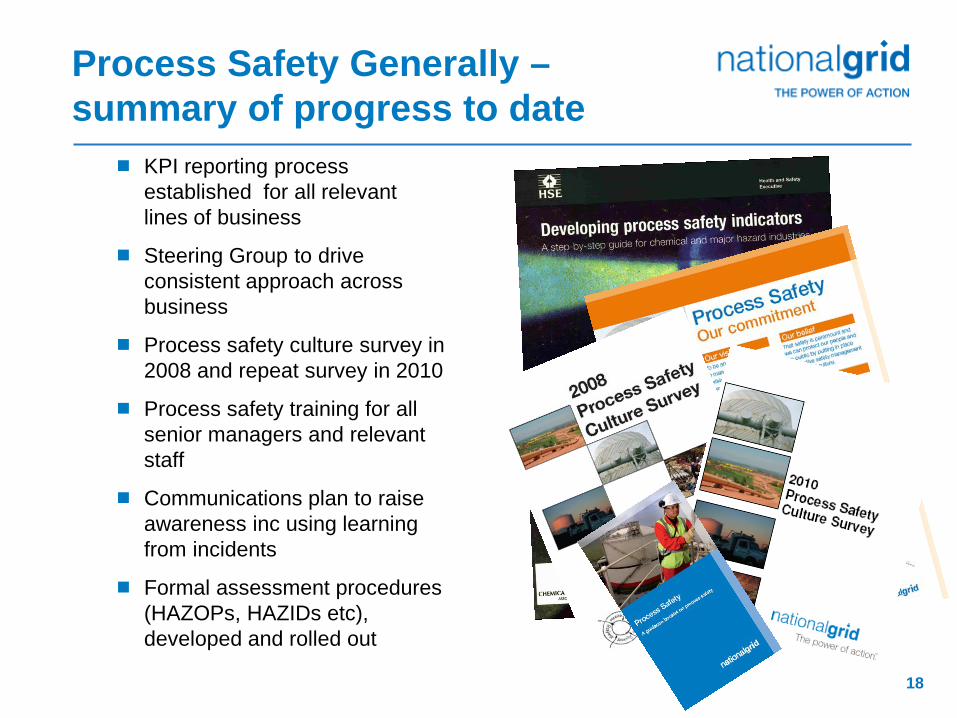
Process Safety Generally – summary of progress to date
KPI reporting process established for all relevant lines of business
Steering Group to drive consistent approach across business
Process safety culture survey in 2008 and repeat survey in 2010
Process safety training for all senior managers and relevant staff
Communications plan to raise awareness inc using learning from incidents
Formal assessment procedures (HAZOPs, HAZIDs etc), developed and rolled out
19
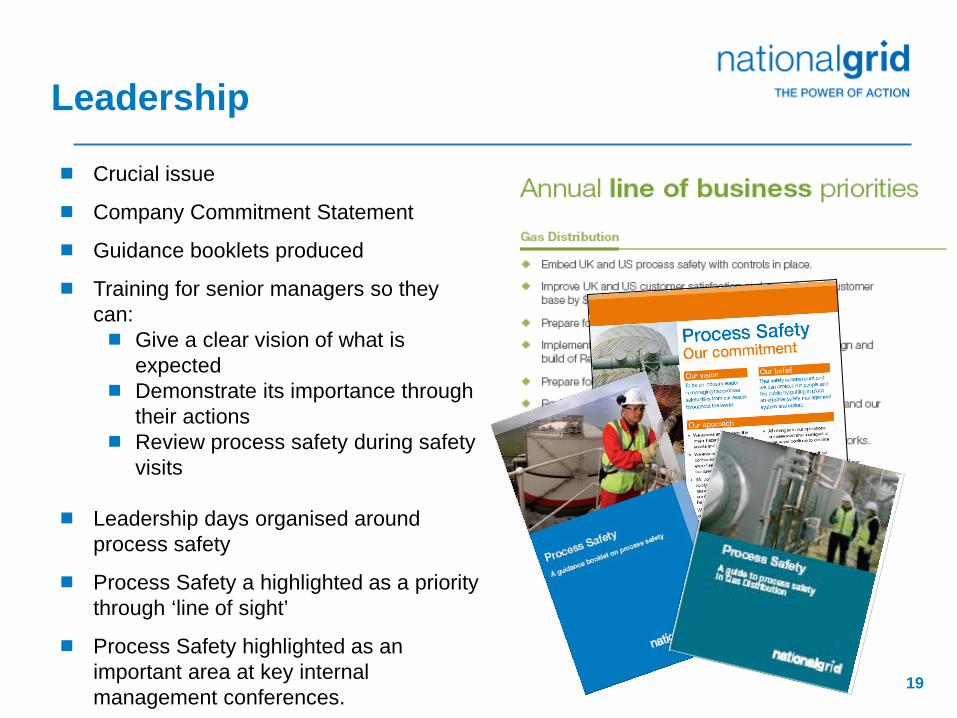
Leadership
Crucial issue
Company Commitment Statement
Guidance booklets produced
Training for senior managers so they can: Give a clear vision of what is
expected Demonstrate its importance through
their actions Review process safety during safety
visits
Leadership days organised around process safety
Process Safety a highlighted as a priority through ‘line of sight’
Process Safety highlighted as an important area at key internal management conferences.
20
Priorities going forward
Using the KPIs to drive process safety improvements
Improving the communication and learning from incidents
Ongoing work to develop a consistent framework across the Group
Making process safety a part of the day job, i.e. not just something that is done by technical specialists
21
Conclusions Major drive to refocus efforts on improving the management of
process safety
Putting a consistent KPI reporting process in place across all relevant National Grid Businesses has been at the heart of this initiative
The KPI process has taken some time to develop and embed within the business but it is now being used to drive process safety improvements
Commitment from the top has been key to ensuring its successful implementation and ongoing application
It’s not about the KPIs it’s about the action plans
Any KPI process needs to be supported by wider Process Safety initiatives
22
The End
Any Questions?