Data handling
13
DATA HANDLING INDEX What is data handling? The types of graphs Bar graph The axis Pie chart Water fall graph Line graph Area graph Pictograph Tally chart By Rayna Rocha VI J
-
Upload
rayna2002 -
Category
Data & Analytics
-
view
39 -
download
0
Transcript of Data handling

DATA HANDLING
INDEXWhat is data handling?
The types of graphs
Bar graph
The axis
Pie chart
Water fall graph
Line graph
Area graph
Pictograph
Tally chart
By Rayna Rocha VI J

What is data handling?
Data handling is the process of ensuring that research data is stored, archived or disposed off in a safe and secure manner during and after the conclusion of a research project. This includes the development of policies and procedures to manage data handled electronically as well as through non-electronic means .
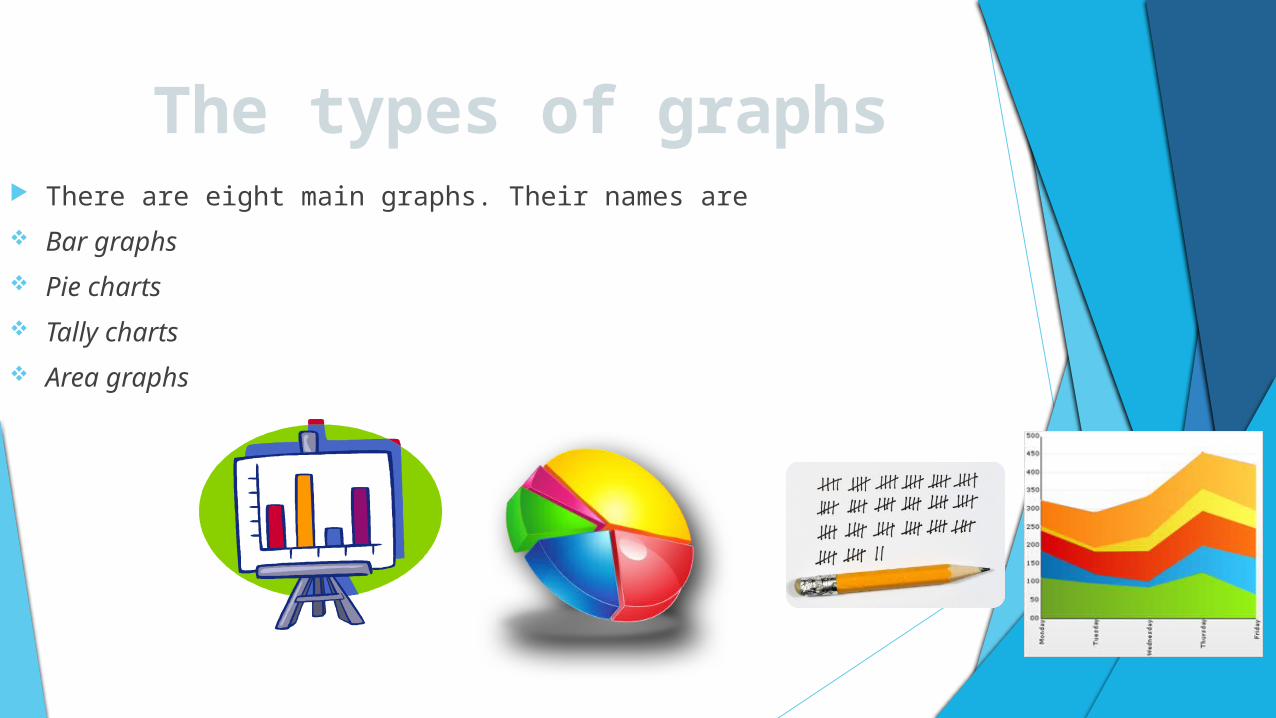
The types of graphs There are eight main graphs. Their names are
Bar graphs
Pie charts
Tally charts
Area graphs
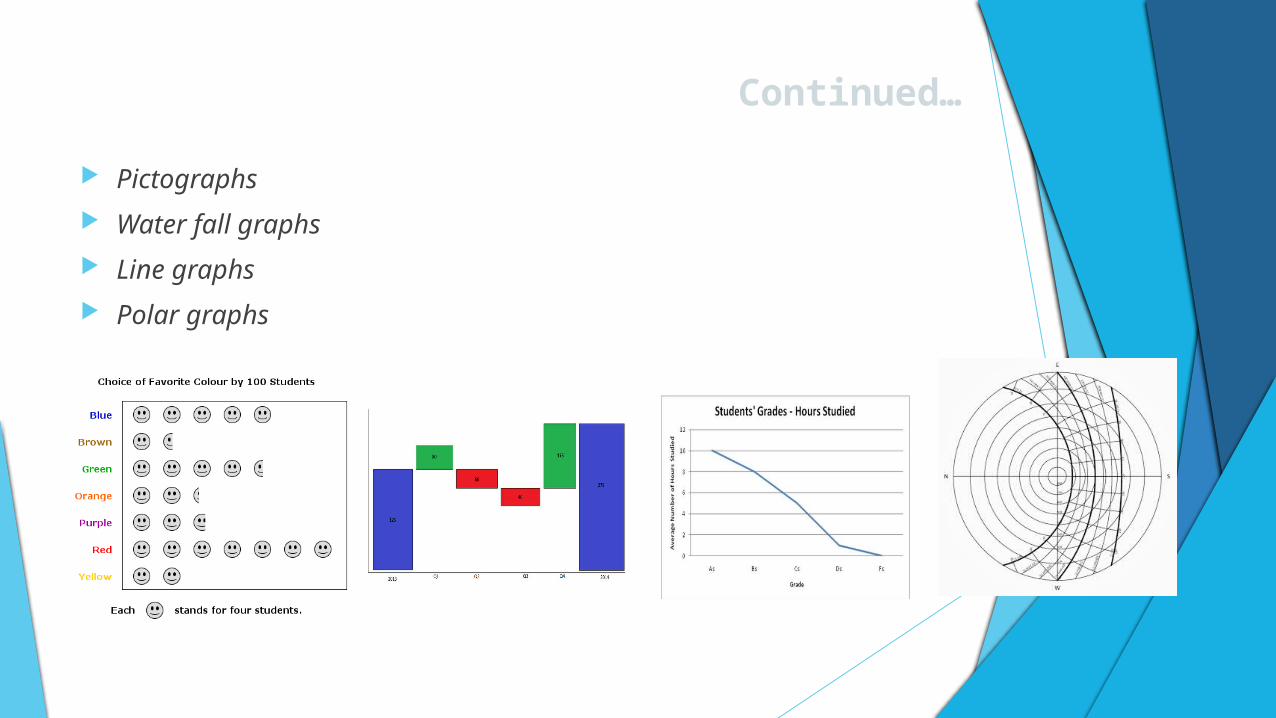
Continued…
Pictographs
Water fall graphs
Line graphs
Polar graphs

BAR GRAPH This is a type of chart, which contains labelled horizontal or
vertical bars showing a piece of information and an axis. The numbers along the side of bar graph compose the axis. This is also called as a histogram; Bar Graph is useful when there is a numerical comparison.
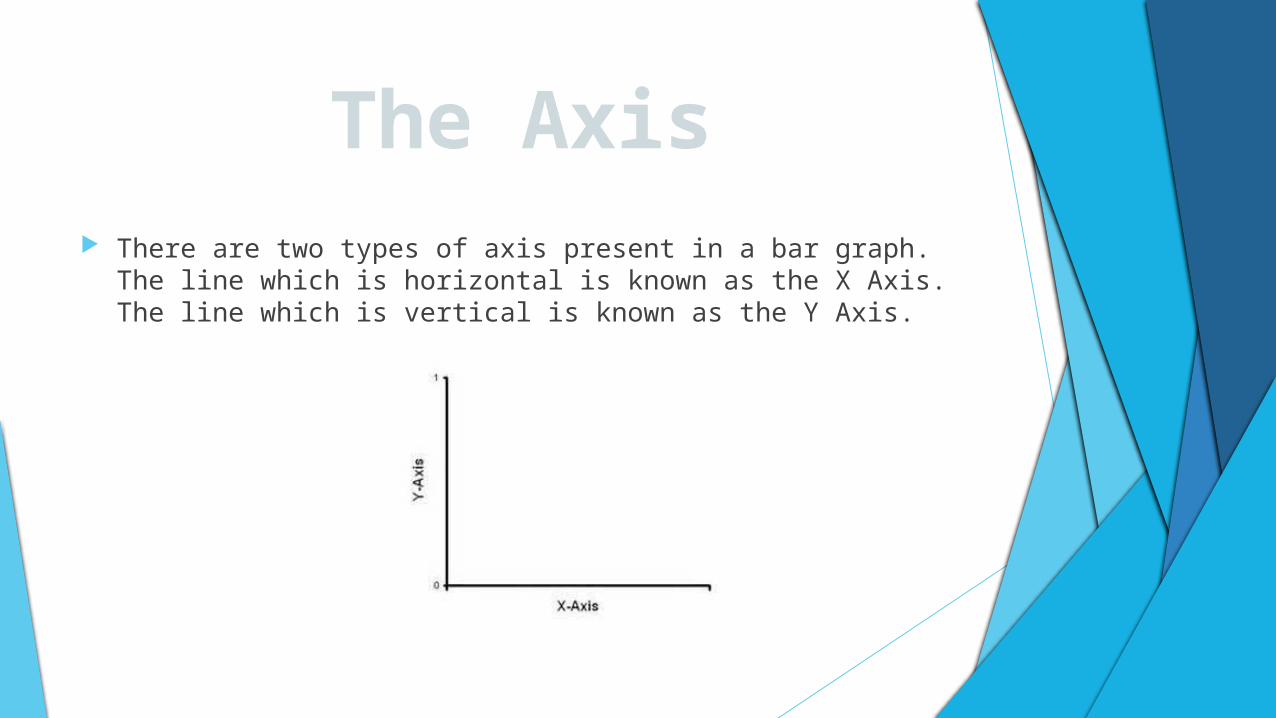
The Axis There are two types of axis present in a bar graph. The line
which is horizontal is known as the X Axis. The line which is vertical is known as the Y Axis.

PIE CHART A pie chart is divided into sectors, illustrating numerical
proportion. In a pie chart, the arc length of each sector, is proportional to the quantity it represents.
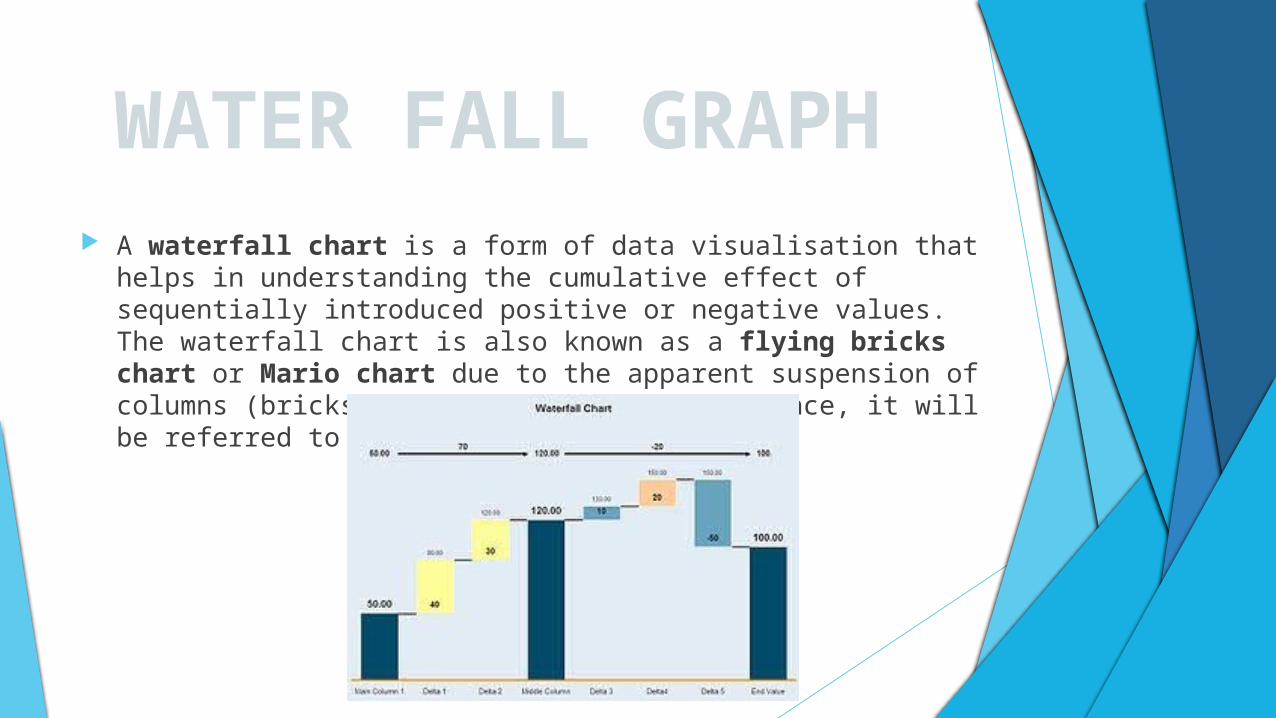
WATER FALL GRAPH
A waterfall chart is a form of data visualisation that helps in understanding the cumulative effect of sequentially introduced positive or negative values. The waterfall chart is also known as a flying bricks chart or Mario chart due to the apparent suspension of columns (bricks) in mid-air. Often in finance, it will be referred to as a bridge.
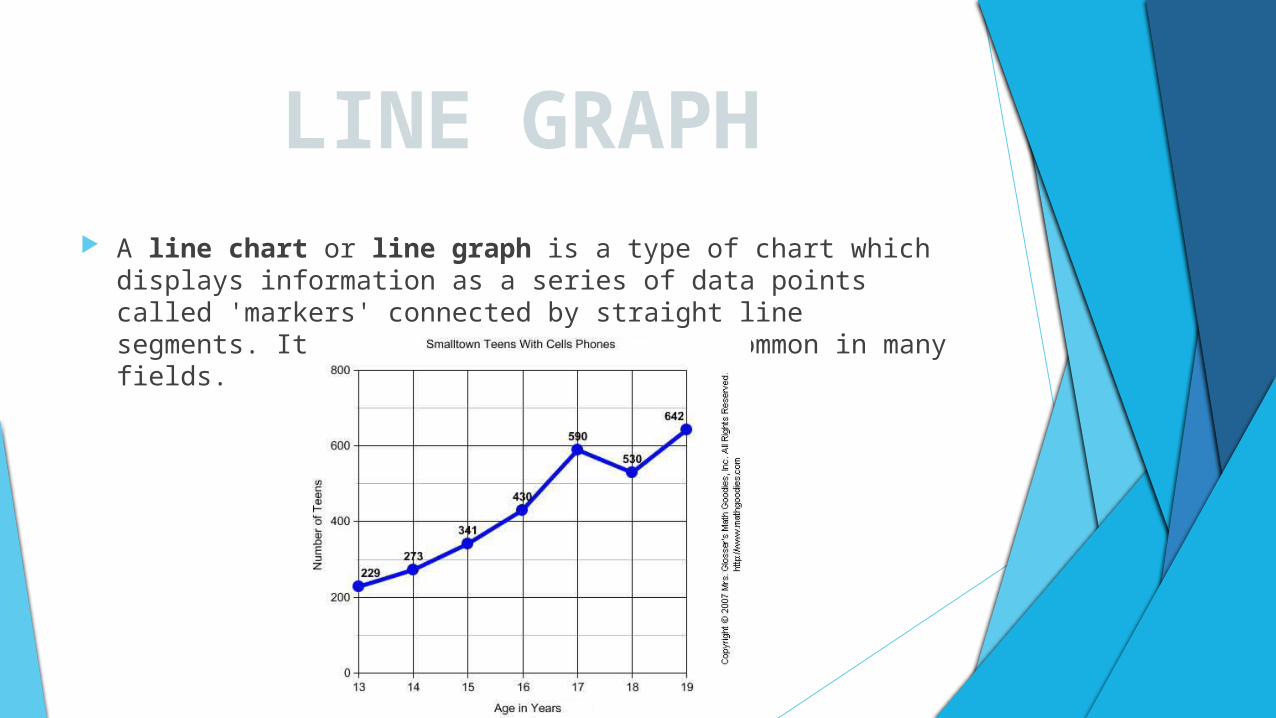
LINE GRAPH A line chart or line graph is a type of chart which displays
information as a series of data points called 'markers' connected by straight line segments. It is a basic type of chart common in many fields.

AREA GRAPH An area chart or area graph displays graphically quantitive
data. It is based on the line chart. The area between axis and line are commonly emphasized with colours, textures and hatchings. Commonly one compares with an area chart two or more quantities.
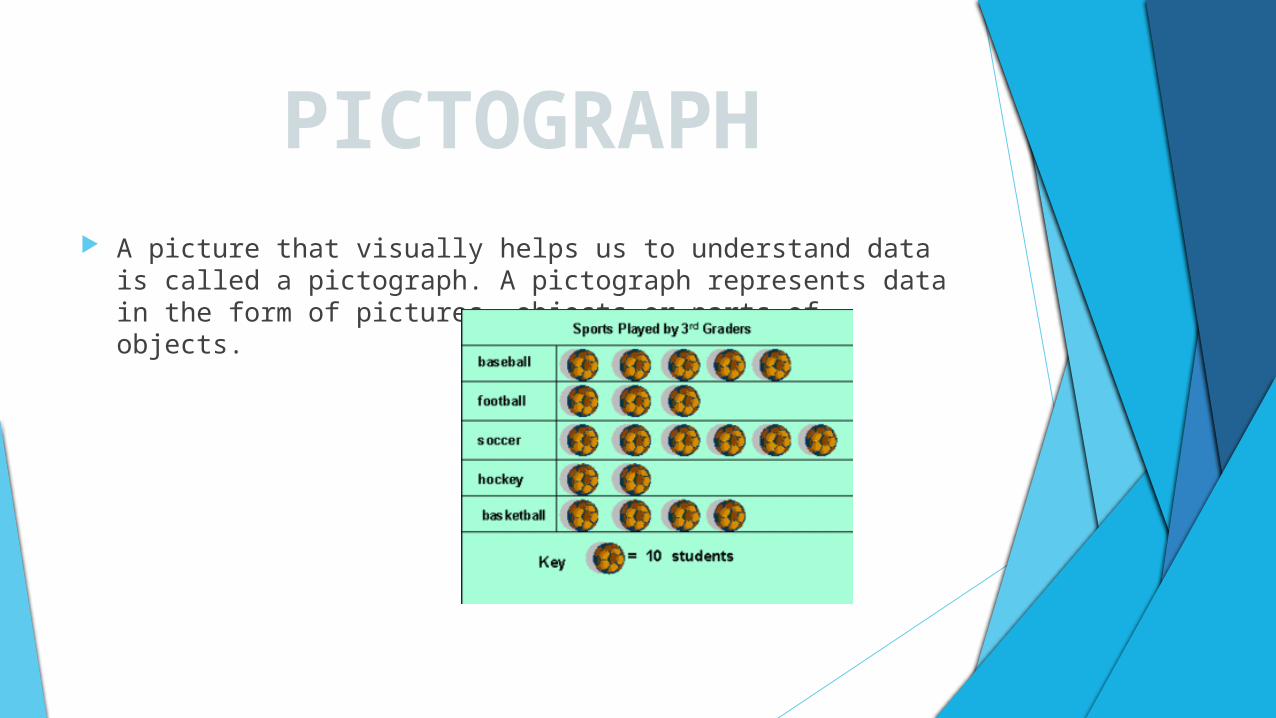
PICTOGRAPH A picture that visually helps us to understand data is called a
pictograph. A pictograph represents data in the form of pictures, objects or parts of objects.
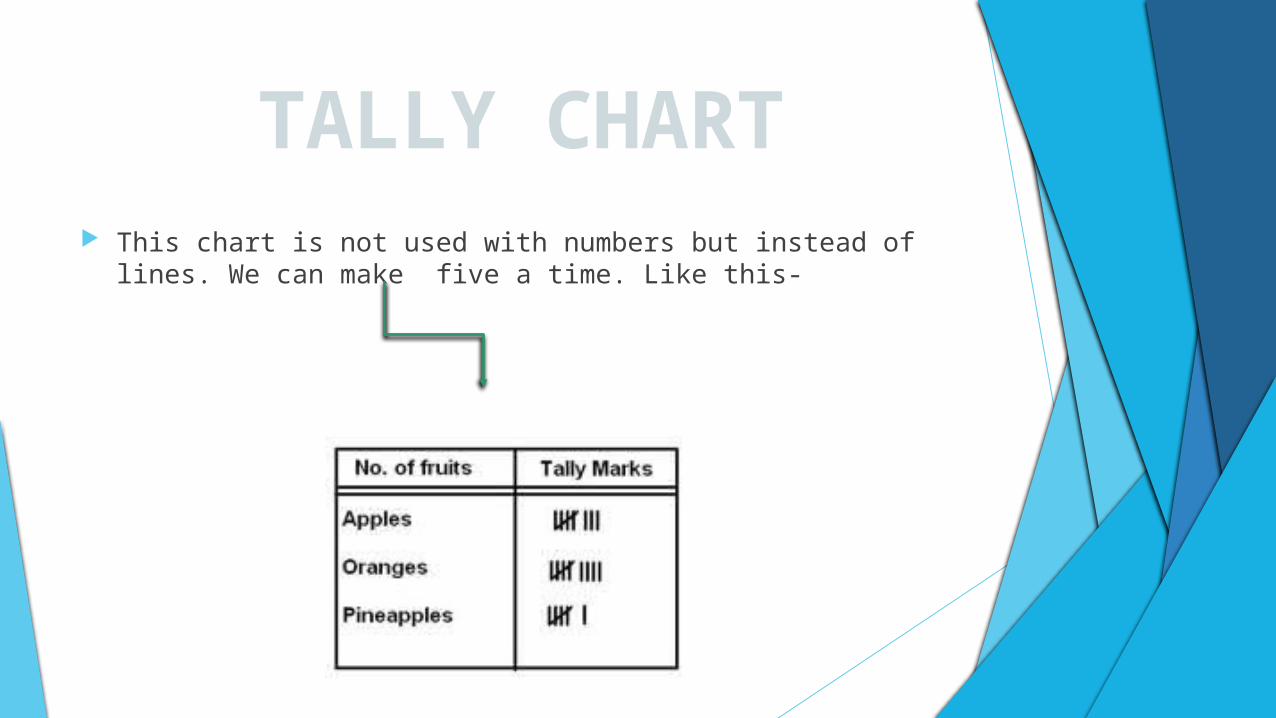
TALLY CHART This chart is not used with numbers but instead of lines. We
can make five a time. Like this-