DATA ACQUISITION AND PROCESSING REPORT Surveys Specifications and Deliverables Manual, Hydrographic...
21
DATA ACQUISITION AND PROCESSING REPORT, 01/18/2011 Survey vessel S3004 Team Leader: Mark J. McMann, NRT1. Applicable Surveys OPR-J417-NRT1-10 H12017 CENTRAL TAMPA BAY, TAMPA, FL All survey data for the aforementioned surveys were acquired with Survey Vessel S3004.
Transcript of DATA ACQUISITION AND PROCESSING REPORT Surveys Specifications and Deliverables Manual, Hydrographic...

DATA ACQUISITION AND PROCESSING REPORT, 01/18/2011
Survey vessel S3004 Team Leader: Mark J. McMann, NRT1.
Applicable Surveys
OPR-J417-NRT1-10
H12017
CENTRAL TAMPA BAY, TAMPA, FL
All survey data for the aforementioned surveys were acquired with Survey Vessel S3004.

A. EQUIPMENT Vessel S3004 has one sonar mounting arm on the starboard side of the vessel from which only one of the unit’s two arm mounted sonar systems- Reson 8125 multibeam echosounder (MBES), Klein Light Weight 5000 side scan sonar (SSS)- are mounted at a given time. The dry hardware (Klein TPU, Reson 8P) are mounted in the cabin rack with all cables run such that changing sonar requires only exchange and connection of the transducer heads. The Odom CV vertical beam echosounder (VBES) is hull mounted near the center of rotation of the vessel. The methods and systems described in this report are used to meet complete coverage and object detection coverage requirements and are in accordance with the OCS Hydrographic Surveys Specifications and Deliverables Manual, Hydrographic Survey Directives, and the OCS Field Procedures Manual for Hydrographic Surveying.
A.1. ECHOSOUNDING EQUIPMENT ODOM ECHOTRAC CV VERTICAL-BEAM ECHOSOUNDER The Odom Echotrac-CV VBES is used as a single-frequency digital recording echosounder system with a digital recorder. The frequency settings range from 100 kHz to 1 MHz, though the normal operating frequency is 200 kHz. The data is digitally recorded in meters as .bin files and Hypack files. The .bin files replace paper-trace records and can be viewed in Pydro Post Acquisition Tools. The Hypack files are converted to Caris HDCS data for processing. The Odom CV is primarily used simultaneously with the Klein 5000 SSS. The ODOM Echotrac CV is inappropriate for sole use in situations requiring complete coverage or object detection coverage. However, combined with SSS data, the ODOM Echotrac CV can be used to meet NOAA specifications for complete and object detection coverage. RESON SEABAT 8125 MULTIBEAM ECHOSOUNDER The Reson SeaBat 8125 MBES is a single-frequency, digital-recording MBES with an operating frequency of 455 kHz. The RESON 8125 transducer consists of a flat transmitter array and solid cylindrical receiver array installed on a manually deployable arm off the starboard side of vessel S3004.

The Reson 8125 forms 240 beams each of which has a 0.5° across-track beam footprint for a maximum total swath width of 120°. Each beam has an along-track resolution of 1°. The ping rate is nominally 20-40 Hz, but may vary according to operating conditions. The Reson 8125 sonar is capable of bottom detection in depths from 3-120m. The Reson 8125 performs active beam steering to correct for sound speed at the transducer head using a surface sound speed sensor. This sensor is discussed in the Sound Speed Equipment section of this report. Real-time attitude data from the vessel’s Applanix POS-MV attitude sensor is also input to the Reson 8125 to aid beam steering, though attitude correction is performed post-acquisition in Caris HIPS. The Applanix POS-MV attitude sensor is discussed in the Positioning and Orientation Equipment section of this report. Reson 8125 data is acquired in meters using Reson HSX format. In addition to bathymetry, Reson “Snippets” and side scan data are also recorded in the HSX file. Reson “Snippets” and side scan data are not routinely used to generate charting products and are archived for second party scientific purposes such as sea bottom characterization, fish habit studies, or geological studies. Reson 8125 user parameters and surface sound speed are also recorded within the HSX file.
A.2. ACOUSTIC IMAGING EQUIPMENT
KLEIN 5000 HIGH-SPEED SIDE SCAN SONAR The light weight Klein 5000 high-resolution side-scan sonar system is a digital-recording, beam-forming acoustic imagery device with an operating frequency of 455 kHz and vertical beam angle of 40°. The Klein 5000 system consists of a Klein fish, a Transceiver/Processing Unit (TPU), and a computer for user interface.

The Klein 5000 system is distinct from other commercially-available SSS in that it forms five simultaneous, dynamically-focused receiver beams per transducer face to improve along-track resolution. The along-track resolution is approximately 30cm at the 100m range scale, even when acquiring data at speeds up to 10 knots. Across-track resolution is typically 7.5cm at the 100m range scale. The achievable 0.3m resolution meets the OCS Hydrographic Surveys Specifications and Deliverables Manual for object detection. Klein Sonarpro software is used to acquire data with the Klein 5000 SSS.
A.3. MANUAL SOUNDING EQUIPMENT Vessel S3004 does possess a lead line that is being used for sounding comparisons with the SBES and MBES.
A.4. POSITIONING AND ORIENTATION EQUIPMENT Vessel S3004 uses an Applanix POS-MV 320 Version 4 inertial positioning and orientation system along with U.S. Coast Guard Differential GPS (DGPS) for a highly accurate blended position and orientation solution. Vessel S3004 is equipped with a Trimble DSM132 DGPS receiver. The DSM132 includes a GPS receiver capable of receiving external RTCM correctors from a shore-based reference station. The system outputs position information once per second. Best expected position accuracy with the DSM132 system is less than one meter with 5 or more space vehicle vectors in the solution. The POS/MV 320 includes dual GPS antennas, an inertial measurement unit (IMU), and data processor (PCS). The IMU measures linear and angular accelerations corresponding to the major motions of the vessel (heave, pitch, roll) and inputs this data to the PCS, where it is combined with a GPS position determined by carrier-phase differential measurements to give the final position solution. Heading is calculated using a GPS-azimuthal measurement system (GAMS); two offset GPS receivers mounted on the cabin of the vessel input to the PCS. The blended DGPS and inertial position/orientation solution has typical values of 0.02° true roll and pitch accuracy, 0.02° heading accuracy, 2m position accuracy, and 0.03 ms-1 speed accuracy. These parameters are monitored in real time during acquisition using the POS/MV user interface software, PosView. These values meet the position accuracy standard for an IHO Order 1 survey. POS-MV True Heave files (.000) are also recorded during bathymetric data acquisition and applied in Caris HIPS/SIPS during post processing.
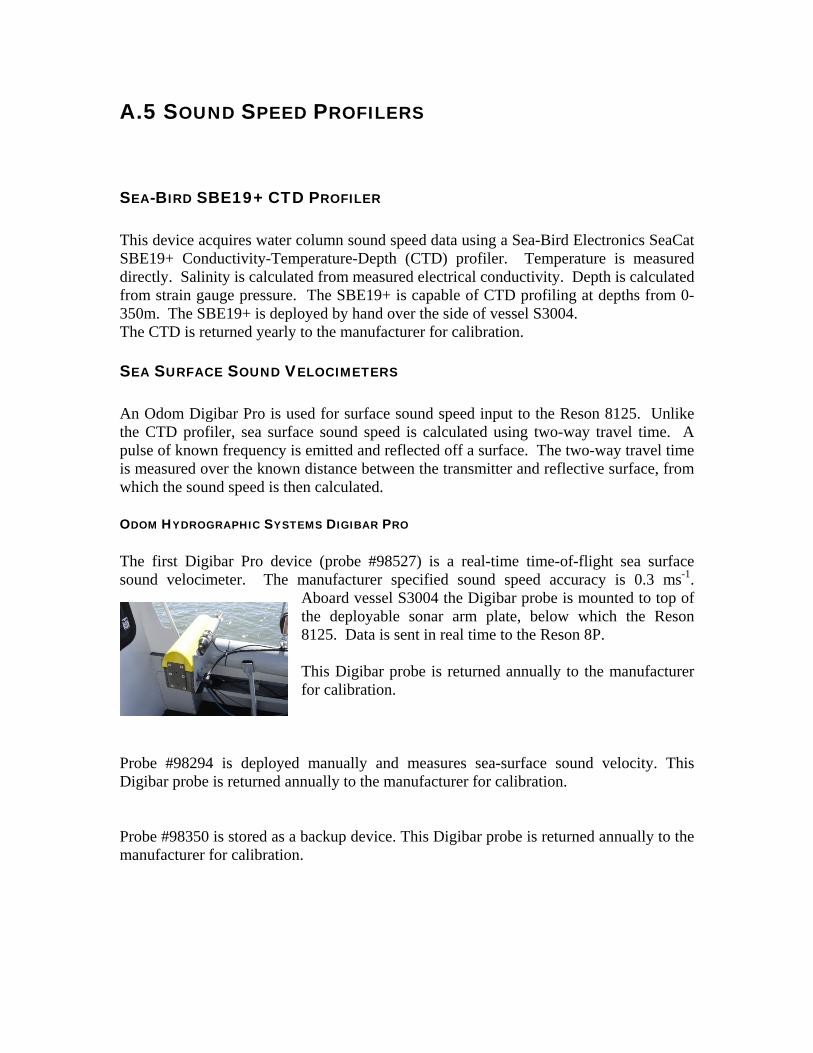
A.5 SOUND SPEED PROFILERS SEA-BIRD SBE19+ CTD PROFILER This device acquires water column sound speed data using a Sea-Bird Electronics SeaCat SBE19+ Conductivity-Temperature-Depth (CTD) profiler. Temperature is measured directly. Salinity is calculated from measured electrical conductivity. Depth is calculated from strain gauge pressure. The SBE19+ is capable of CTD profiling at depths from 0-350m. The SBE19+ is deployed by hand over the side of vessel S3004. The CTD is returned yearly to the manufacturer for calibration. SEA SURFACE SOUND VELOCIMETERS An Odom Digibar Pro is used for surface sound speed input to the Reson 8125. Unlike the CTD profiler, sea surface sound speed is calculated using two-way travel time. A pulse of known frequency is emitted and reflected off a surface. The two-way travel time is measured over the known distance between the transmitter and reflective surface, from which the sound speed is then calculated. ODOM HYDROGRAPHIC SYSTEMS DIGIBAR PRO The first Digibar Pro device (probe #98527) is a real-time time-of-flight sea surface sound velocimeter. The manufacturer specified sound speed accuracy is 0.3 ms-1.
Aboard vessel S3004 the Digibar probe is mounted to top of the deployable sonar arm plate, below which the Reson 8125. Data is sent in real time to the Reson 8P. This Digibar probe is returned annually to the manufacturer for calibration.
Probe #98294 is deployed manually and measures sea-surface sound velocity. This Digibar probe is returned annually to the manufacturer for calibration. Probe #98350 is stored as a backup device. This Digibar probe is returned annually to the manufacturer for calibration.

B. SOFTWARE SYSTEMS B.1 ACQUISITION SOFTWARE HYPACK 2009A Hypack 2009a is a multi-function marine survey software package. Hypack 2009a integrates both Hypack hardware (SBES data acquisition) and Hysweep hardware (MBES data acquisition) and is used to follow survey lines, vessel position with respect to lines, and various navigation parameters are displayed for the helmsman. Reson MBES acquisition controller Even if recording commands for MBES acquisition go through Hypack 2009a, the Reson 8125 sonar is connected to a top side unit and a control window that allow fine tuning parameters of the device as well as real time monitoring of the data being acquired. The primary adjustable user settings during MBES acquisition are transmit power, range, gain, pulse length, ping rate, spreading, and absorption. Typically, power, range, and gain are the only settings that are adjusted dynamically during the logging of a line file (power and gain sparingly). The pulse length, spreading, and absorption are set for the survey depth area and are rarely adjusted. The ping rate is set to its maximum because the Reson 8125 will only use the highest possible ping rate for the vessel speed and depth at any given time. Klein Sonarpro SDF files for SSS data are acquired separately through Klein Sonarpro software. Klein Sonarpro is a Windows-based acquisition software package that provides real-time data display and sonar control. It is used to acquire Klein 5000 data in SDF format. The setup is configurable and allows the user to save the configuration files so that they are automatically launched during start-up. Data acquisition is monitored real-time by a qualified sonar operator. The primary user settings that are adjustable during SSS acquisition are the range scale and the resolution. Typically, the range scale and resolution are set prior to logging data and not changed again until the surveyed depth area changes.

B.2. PROCESSING SOFTWARE CARIS HIPS/SIPS V 7.0 CARIS HIPS (Hydrographic Information Processing System) is used for all initial processing of multibeam and vertical beam echosounder bathymetry data, including tide, sound velocity, and vessel offset correction and data cleaning. CARIS HIPS uses statistical modeling to create Bathymetry with Associated Statistical Error (BASE) surfaces and the ‘uncertainty-weighted grids’ is the option chosen for their creation. Combined Uncertainty and Bathymetry Estimator (CUBE) algorithm grids. CARIS SIPS (Side-scan Information Processing System) is used for all processing of side-scan sonar imagery, including cable layback correction, slant range correction, contact selection, towpoint position, and mosaic generation. Gridding Resolution used (In accordance to 2010 FPM) for shallow depths (below 20m): Data from
Type of hydrography
Grid Method Resolution
SBES Main Scheme BASE 5 meters MBES Investigations CUBE 0.5 meter SSS Object detection Mosaic 1 meter
HSTP PYDRO 10.9 Pydro is a proprietary program developed and maintained by NOAA’s Hydrographic Systems and Technology Program (HSTP), and is used primarily for feature management. MBES and SBES contacts (designated soundings), SSS contacts, and detached position are analyzed, grouped, and assigned S-57 classifications. Bathymetric data are imported into Pydro and excessed at survey scale for chart comparison. The Pydro Preliminary Smooth Sheet file (.pss) is delivered to the Atlantic Hydrographic Branch as part of the final submission package. HSTP VELOCIPY 10.9 HSTP Velocipy is a proprietary program for the processing of SVP data. This program is included in the main HSTP Pydro software, and uses Sea-Bird Electronics SeaTerm and Digibar data. This processing software converts hexadecimal SeaCat or Digibar data into ASCII conductivity-temperature-depth data, and then converts the ASCII data into a depth-binned sound speed file. The resulting SVP files are applied in Caris HIPS during post-processing to correct for sound speed variation within the water column. These sound speed files are applied to the data in Caris HIPS. Velocipy is also used to compare

sound speed casts with its DQA function and to archive sound speed information for the National Oceanographic Data Center. MAPINFO PROFESSIONAL 10.5 MapInfo Professional is the Geographic Information System (GIS) software package used by NRT1. MapInfo is used for sheet management, line planning, final data analysis and creating end-user products such as chartlets and survey plots.
C. ACQUISITION METHODS The project instructions assigned to NRT1 call either for 200% SSS with concurrent VBES, or Complete or Object Detection Coverage as defined in the FPM. CROSS LINES Cross lines are acquired in accordance with the OCS Field Procedures Manual as a confidence check of the survey data. Survey lines are planned such that ten percent of the total linear nautical miles are cross lines. Cross lines are planned in a zig-zag or perpendicular pattern across the main scheme lines when survey area allows. The results of the Cross line Quality Control test are submitted in a report in Separate V of the Descriptive Report of each project.
D. CORRECTIONS TO ECHO SOUNDING AND QUALITY CONTROL
D.1. SOUND SPEED SBE19+ CONDUCTIVITY, TEMPERATURE AND DEPTH (CTD) PROFILER Sound speed profiles acquired with the Sea-Bird Electronics SeaCat SBE19+ CTD profiler and Digibar probes are processed using the HSTP program Velocwin, which generates sound speed profile (SVP) files that are used to correct bathymetric HDCS data in Caris HIPS. Sound speed correctors are applied to MBES and VBES soundings during post processing.

The interval at which SVP casts are conducted depends on the data acquisition type, survey area and prevailing conditions. At a minimum, one SVP cast per week for VBES sound speed correction, even though NRT1 usually takes a SVP cast on every survey day. On MBES acquisition days, a SVP cast is taken every four hours. Casts are conducted more frequently when changing survey areas, or when survey conditions such as weather, tide, or current change sufficiently.
D.2. WATER LEVEL CORRECTORS
Soundings are initially reduced to Mean Lower-Low Water (MLLW) using predicted tides or preliminary (observed) zoned water level data. Data are obtained from a local, primary tide gauge through the Center for Operational Oceanographic Products and Services (CO-OPS) website (http://tidesandcurrents.noaa.gov/olddata). Starting in 2009, TCARI Predicted or observed water level files are converted to Caris tide files (.tid) and applied to all sounding data using either discrete tide zoning in Caris HIPS (.zdf files) or the TCARI module in Pydro if provided by CO-OPS. After data acquisition is complete, a request for final, approved water levels is submitted to CO-OPS. Once final approved water levels are received, sounding data are re-corrected to MLLW using either the verified zones or the verified TCARI files. D.3. TCARI
Tidal Constituent And Residual Interpolation (TCARI) is a quick, accurate method of providing tidal corrections to hydrographic data. Tidal corrections are the measure of the differences in the instantaneous water level from mean lower low water (MLLW), the datum that is used for National Ocean Service (NOS) charts. The difference of the instantaneous water level from MLLW is due to variations in the phase of the astronomic tide, residual (or non-tidal) effects caused primarily by winds and river flows, and to the datum difference between the long-term Mean Sea Level (MSL) and MLLW. Tidal corrections are essential to the hydrographic survey process so that water depths presented on the chart are referenced to the same point.
TCARI works by separating the astronomic tide, residual, and datum difference components and treating them differently. First, the method spatially interpolates each tidal constituent's amplitude and phase throughout the region, based on data at the water level stations and makes a tidal prediction. The amplitude and phase of constituents at water level stations must have been previously determined by analysis of historical records. This predicted tide is then added to the residual component, which is computed by spatially interpolating the non-tidal values observed at the water level stations at the
time of the survey. Finally, the datum offset, or difference between MSL and MLLW based on historical data, is interpolated throughout the region and added to the prediction.
NOTE: For the project OPR-J417-NRT1-10, sheet H12017, NRT1 was initially assigned the TCARI file J417NRT12009.tc to be applied to the survey project, but in 2010, after some issues were encountered with TCARI data quality control, the project was reverted to discrete tide zoning (.zdf). All bathymetric data collected until 12/31/2010 were therefore corrected with discrete tide zoning (.zdf). For the year 2011 (one day of data collected on 1/4/2011), an updated TCARI grid was generated by NOAA / COOPS (J417NRT12011.tc), and was used to correct tide data for that day. D.4. HEAVE, PITCH, ROLL AND HEADING, INCLUDING BIASES AND NAVIGATION TIMING ERRORS Heave, pitch, roll, and timing bias values for vessel S3004 are determined during a patch test after a system is newly mounted on the sonar arm. Vessel offsets, dynamic draft correctors, and system bias values are entered in the sonar’s Caris Hydrographic Vessel Files (.hvf) and applied during Caris’ merge process. D.5. VESSEL OFFSETS AND DYNAMIC DRAFT CORRECTORS On vessel S3004, the offsets were measured with a total station by the National Geodetic Service in St Petersburg, FL, in July 2009. The offsets were entered in the HVFs submitted with each survey. The dynamic draft values are updated after each new Settlement and Squat measurement. Please refer to the Appendices section attached to this document for offset and bias corrections.
E. DATA PROCESSING AND QUALITY CONTROL
E.1. BATHYMETRY Raw imagery and bathymetry data (SDF and Hypack) are converted into Caris HDCS data format upon completion of daily acquisition. Conversion parameters vary for each data format, and are stored in the LogFile of each HDCS processed line folder. After conversion, data are corrected with true heave, tides, and sound speed and then merged. Before the merging process, Total Propagated Error (TPE) is calculated. For further explanation of TPE calculations refer to the OCS Field Procedures Manual.
VERTICAL BEAM BATHYMETRY When VBES is the sole source of bathymetry (e.g. 200% SSS + VBES survey), VBES is converted to Caris HDCS and processed as described in the previous paragraph. The data is then examined and cleaned in Caris Singlebeam Editor. Digital records (.bin files) are used to provide extra information during data cleaning. The .bin files are viewed in Pydro Post Acquisition Tools. After the data has been processed and cleaned, an uncertainty-weighted BASE Surface is computed (usually at a resolution of five meters). MULTIBEAM BATHYMETRY Depending on acquisition type, MBES bathymetry is analyzed using Caris BASE surface layers. Caris BASE surfaces are described in detail in the OCS Field Procedures Manual and the Caris HIPS/SIPS Users Manual. When the primary source of bathymetry for a survey area is a combination of VBES and MBES, a collection of finalized BASE and CUBE surfaces is generated as the depth product of the survey. The data is examined and cleaned as necessary to reject gross fliers and to identify systematic data errors. Systematic errors are corrected or removed from the project, documentation of which is found in the survey processing notes or descriptive report. The surface names contain the resolution at which they were created, which is based on depth and data density. When Complete or Object Detection MBES is the primary source of bathymetry, data are processed using CUBE. After computation of TPE, MBES lines are either used to create a new surface or are added to an existing surface. The resulting layers are analyzed by the data processor to identify fliers and/or systematic errors, and to identify significant bottom features. Fliers are rejected by the data processor in Caris Subset Editor (multi-line spatial view) or Caris Swath Editor (single-line time-series view). Systematic errors are identified and documented by the data processor. Least depths of navigationally significant features are flagged as “designated soundings,” which both identifies the object as a navigationally significant object for import into Pydro and forces the depth of the grid to match the least depth of the feature. After data editing is complete, grids are finalized and combined for delivery to the Atlantic Hydrographic Branch. Surface resolution depends on depth and survey type (see OCS Hydrographic Specifications and Deliverables Manual for further information), and is specified in the name of the surface.

E.2. IMAGERY After acquisition, SSS data are converted from SDF format to Caris HDCS format. Fish height, vessel heading (gyro), and vessel navigation records are then reviewed and corrected and recalculated. Data are then slant-range corrected to 0.1m. The slant-range corrected SSS imagery data are closely examined for contacts. Imaged objects are evaluated for significance based upon apparent shadow length and appearance. Contacts are selected and saved to a contact file within the respective Caris HDCS line file, exported and inserted into Pydro for feature management. Two mosaics are created after SSS data have been processed; one of the first 100% of coverage and one of the second 100% of coverage (200%). If any deficiencies in the SSS coverage are found, a holiday line file is created from the mosaics, and additional lines of SSS are acquired. E.3. BATHYMETRY ANALYSIS AND FEATURE CLASSIFICATION Following data cleaning in Caris HIPS and SIPS, the following items are inserted into Pydro and saved in a Pydro Survey Session (PSS) file: finalized weighted bathymetry grids, SSS contacts, MBES designated soundings, detached positions (DPs), Geographic Positions (GP), bottom samples (Hypack DPs), and AWOIS items. The Pydro .pss is used for survey analysis and feature management. Images of contacts exported from Caris are displayed in the Image Notebook Editor in Pydro. Contacts are arranged by day and line and can be selected in the data “Tree” window. Information concerning a specific contact is reviewed in the Editor Notebook Window in Pydro. This information includes position, surrounding depths, contact cross references, and charting recommendations. Each contact is reviewed, and information flags are set accordingly as described in the Pydro Data Flagging Decision Tree. Contacts appearing significant1 are further investigated with MBES or VBES. Multiple representations of one distinct feature (e.g. contacts from two or more SSS lines on a wreck) may be correlated together. For a group of correlated features, one representation is selected as the primary contact, and all others are selected as secondary contacts with respect to the primary contact.
1 Significant features are defined by the Hydrographic Survey Specifications and Deliverables as an object rising more than one meter above the seafloor in water depths of 0-20 meters, and an object rising 10% of depth above the seafloor in water depths greater than 20 meters.

After a feature is fully classified, primary features are flagged as “Resolved.” If a primary feature is flagged “Resolved,” then the secondary features correlated to that primary feature are automatically flagged “Resolved” and are given the same full classification as the primary feature. After all items within the PSS have been resolved, multiple reports are generated for submission to the Atlantic Hydrographic Branch: Feature Report, AWOIS Report, DR_Charted Report, DR_Uncharted Report and DTON report2. E.4. SURVEY DELIVERABLES AND ANCILLARY PRODUCT GENERATION All data are submitted digitally in close-keeping with the OCS Hydrographic Field Procedures Manual; including raw and processed sonar data, ancillary correction data (tides, sound speed, true heave, hydrographic vessel files, etc), supporting products (Pydro PSS files, Caris sessions and field sheets); and all supporting reports and documentation. The final bathymetric deliverable is a collection of gridded surfaces. Side scan sonar mosaics are also submitted as evidence of appropriate imagery coverage. These mosaics are also used to identify contacts, as well as general bottom type. Bathymetric surfaces and SSS mosaics are submitted in their respective Caris field sheets. In addition, the Pydro Survey Session (PSS) file is submitted as the record of survey feature management.
2 Danger to Navigation (DTON) reports are generated immediately after discovery and analysis and are submitted to the Marine Chart Division of the NOAA Office of Coast Survey. Multiple DTON reports during the course of a survey are possible. If no dangers are found during the course of a survey, no report is generated.

E. APPROVAL SHEET As Team Leader, I have ensured that standard field surveying and processing procedures were utilized in accordance with the NOS Hydrographic Manual, Fourth Edition; Field Procedures Manual, and the NOS Hydrographic Surveys Specifications and Deliverables.
I acknowledge that all of the information contained in this report is complete and accurate to the best of my knowledge. Mark J. McMann, NOAA

Appendices
Appendix I/ Settlement & Squat

Appendix II/ Sounding System Comparison

Appendix III/ Side Scan Sonar Calibration Report

Appendix IV/ Multibeam Echosounder Bias Averages

Appendix V/ Offset and Bias Corrections
a) SBES Swath1
b) MBES Swath1
c) SB Draft

d) SSS and MB Tow Point
Note: Both MBES and SSS are pole mounted.
e) SB Waterline Height
f) SBES TPU values
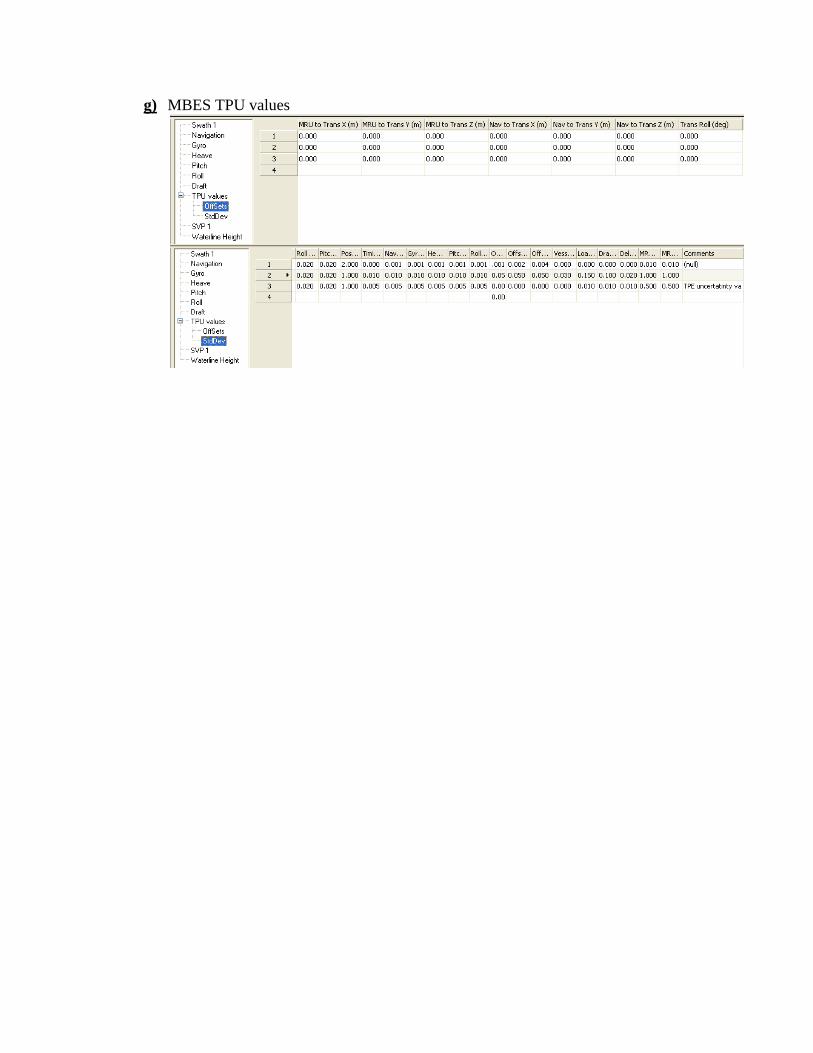
g) MBES TPU values