DaleSASSE 2011 Symposium PdM Elec
25
3/2/2011 1 Predictive Maintenance (PdM) Integration for Electrical Distribution Safety and Reliability Dale P. Smith, CMRP VP Sales & Marketing RAM USA Agenda • The Animal Darwin Awards • Danger: Humans Like Swiss Cheese • Predictive Maintenance Tool Box Facility Walk Down Examples • Facility Walk Down Examples • Mountains of Data • KISS Your Assets Thank Thank You you Thank You
Transcript of DaleSASSE 2011 Symposium PdM Elec

3/2/2011
1
Predictive Maintenance (PdM) Integration for Electrical
Distribution Safety and Reliability
Dale P. Smith, CMRPVP Sales & Marketing
RAM USA
Agenda
• The Animal Darwin Awards• Danger: Humans Like Swiss Cheese• Predictive Maintenance Tool Box
Facility Walk Down Examples• Facility Walk Down Examples• Mountains of Data• KISS Your Assets
Thank Thank You
youThank You

3/2/2011
2
The Animal Darwin Awards
Just a Few Numbers Electrical Hazards / Failures
FM Global - Leading Cause of Fires/Explosions and costing nearly $1Billion
Zurich - 25-30% of all large loss fires
Canadian MOL - 50% of the 1,200 deaths / arc flash injuries “performing basic maintenance and repair on or around energized equipment”79% of Deaths were not electricians!
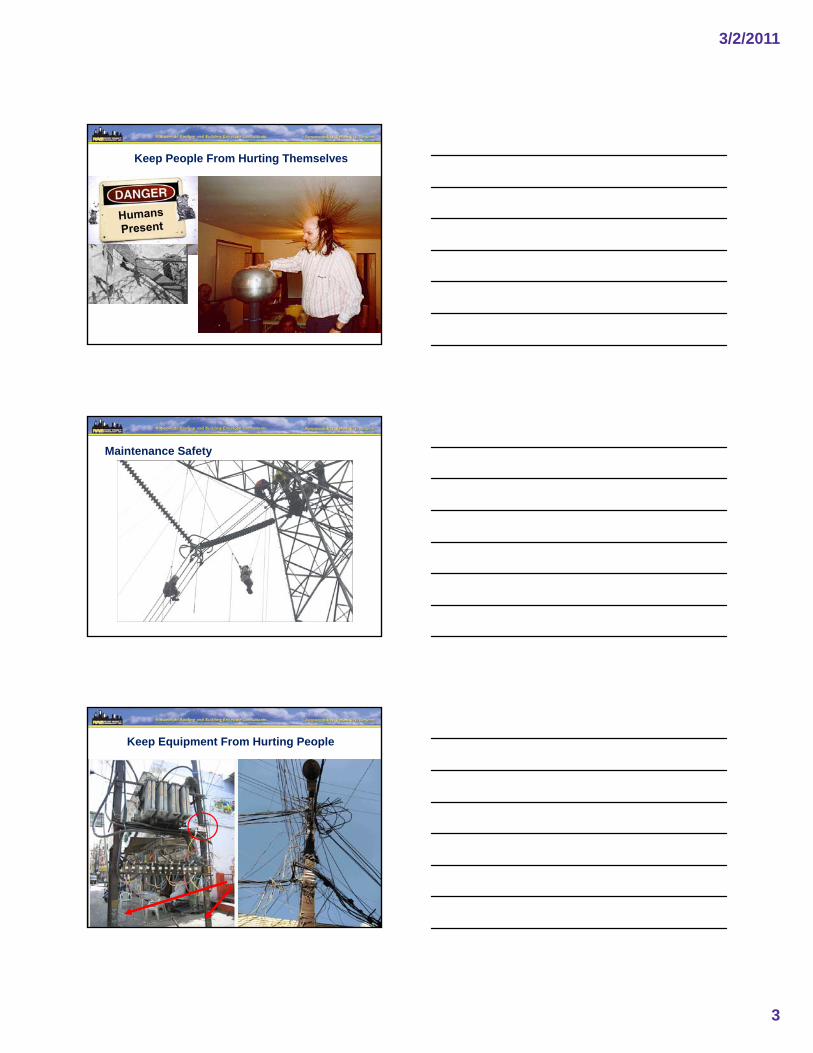
1. Keep Equipment From Hurting People
Two Key Electrical Safety Rules
Quiz: 70% of failures caused by what 2 things?
2. Keep People from Hurting Themselves
3/2/2011
3
Keep People From Hurting Themselves
Maintenance Safety
Keep Equipment From Hurting People
3/2/2011
4
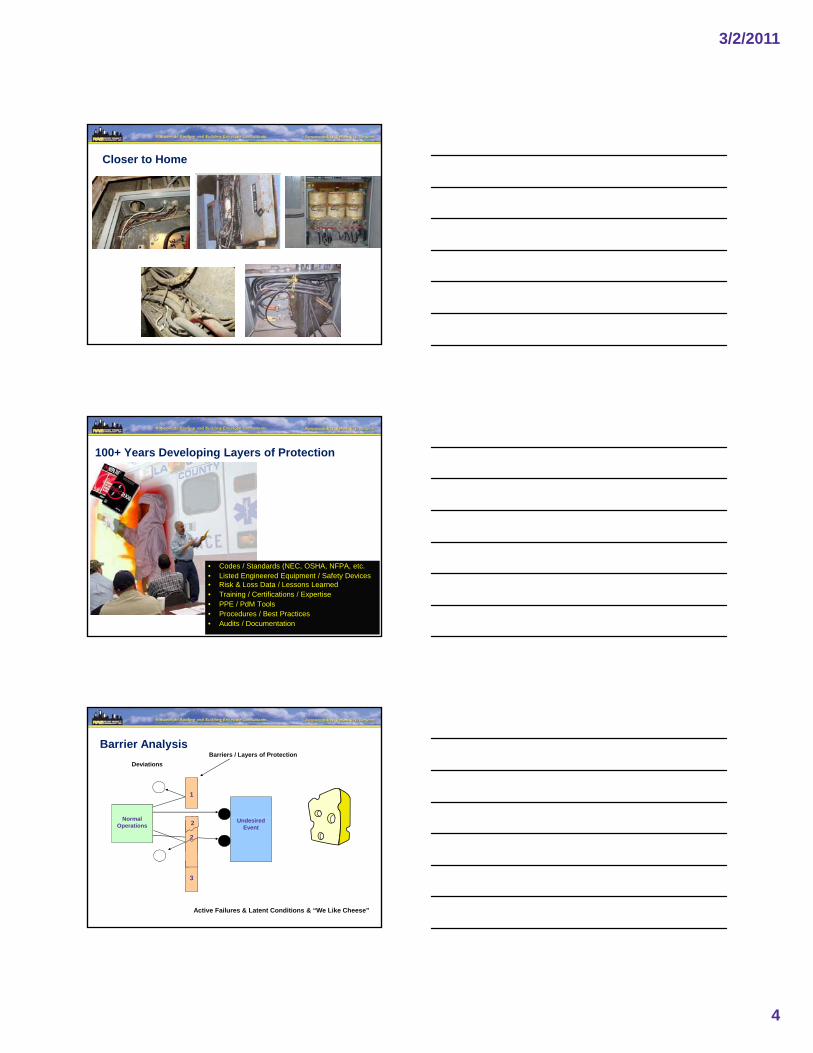
Closer to Home
100+ Years Developing Layers of Protection
• Codes / Standards (NEC, OSHA, NFPA, etc.• Listed Engineered Equipment / Safety Devices• Risk & Loss Data / Lessons Learned • Training / Certifications / Expertise• PPE / PdM Tools• Procedures / Best Practices• Audits / Documentation
Barrier Analysis
1
Normal
Barriers / Layers of ProtectionDeviations
Undesired Event
Normal Operations
Active Failures & Latent Conditions & “We Like Cheese”
2
3
2

3/2/2011
5
Who Moved the Cheese?
Electrical Hazards
Layers of Protection
Failures, Injuries &
Losses
ondi
tion
Audible Audible NoiseNoise
Early Early Signal 3Signal 3
Hot to Hot to TouchTouch
Point where Point where Failure starts Failure starts
to occurto occur
Early Early Signal 1Signal 1 Early Early
Signal 2Signal 2
(P)
NewNew
Forecasting Failure with Condition Monitoring & PdM Tools
TimeTime
Equi
pmen
t Co
BrokenBroken
(F)
Cost to Repair
CM Detects Problems EarlyCM Detects Problems EarlyEquipment Fails HereEquipment Fails Here
S-P-F Curve
100%S = Startup
P = Potential Failure
Equipment Condition
10%
0%
Time
F = Functional Failure
Complete Failure
S-P Interval P-F Interval
3/2/2011
6
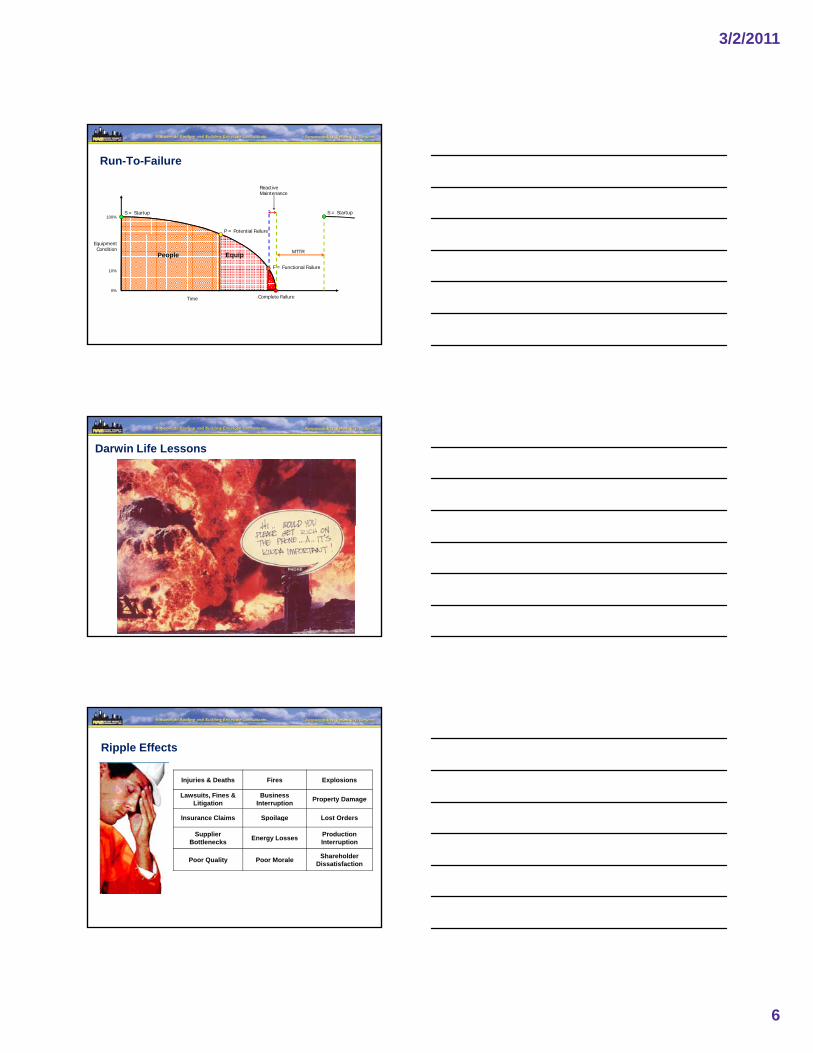
Run-To-Failure
100%S = Startup
P = Potential Failure
S = Startup
ReactiveMaintenance
Equipment Condition
10%
0%
Time
F = Functional Failure
Complete Failure
MTTRPeople Equip
Darwin Life Lessons
Ripple Effects
Injuries & Deaths Fires Explosions
Lawsuits, Fines & Litigation
Business Interruption Property Damage
Insurance Claims Spoilage Lost OrdersInsurance Claims Spoilage Lost Orders
Supplier Bottlenecks Energy Losses Production
Interruption
Poor Quality Poor Morale Shareholder Dissatisfaction
3/2/2011
7
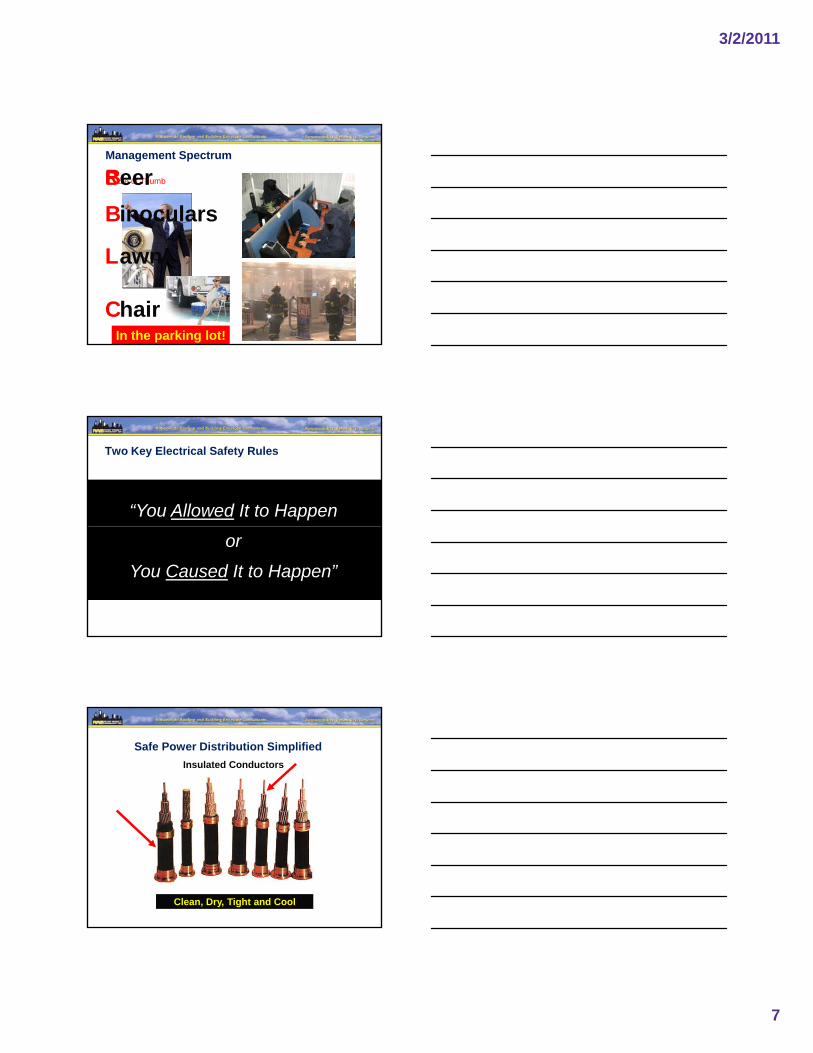
Rule of ThumbBB
eerinoculars
Management Spectrum
L
C
awn
hairIn the parking lot!
1. Keep Equipment From Hurting People
2. Keep People from Hurting Themselves
Two Key Electrical Safety Rules
“You Allowed It to Happen
or
You Caused It to Happen”
Safe Power Distribution Simplified Insulated Conductors
Clean, Dry, Tight and Cool

3/2/2011
8
Hazard Indicators & Failure Indicators• Excessive Dust, Dirt & Debris• Humidity / Water / Corrosive Atmospheres• Water / Vibration • Vibration / High-Resistance Connections & Contacts• Lack of Maintenance • Too High or Too Low Ambient Temperatures
Failures Indicators
Electrical Arcing Overloads, damage, metal fatigue uninterrupted faults overheating
Tracking Path of damaged insulation & Dirt
Corona / Partial Discharge Electrical stress / sharp points sound / Ozone
Overheating Heat, damage
Uninterrupted Fault Current Heat, melting, fire arcing
Voltage Irregularities Heat, surges, unbalanced loads
Sensory Inspections
Infrared
Oil Analysis
Ultrasound
Motor Circuit
Many more. . .
Reducing Exposures Increases Reliability
100%
PF
S = StartupS
Equipment Condition
10%
0%
Time
PF
FF
Complete Failure
MTTR
People Equip
Proactive PdM Task Interval Increased PdM Task Interval

3/2/2011
9
Switchger Bus Uninsulated
Bus Duct
Cable Joints
Cable Terminations
PM / PdM Electrical Component Failures
0% 10% 20% 30% 40% 50% 60% 70% 80% 90% 100%
Circuit Breakers
Transformers
Disconnect Switches
Switchgear Bus Insulated
W/O PdM With PdM
Source: Institute of Electrical and Electronic Engineers
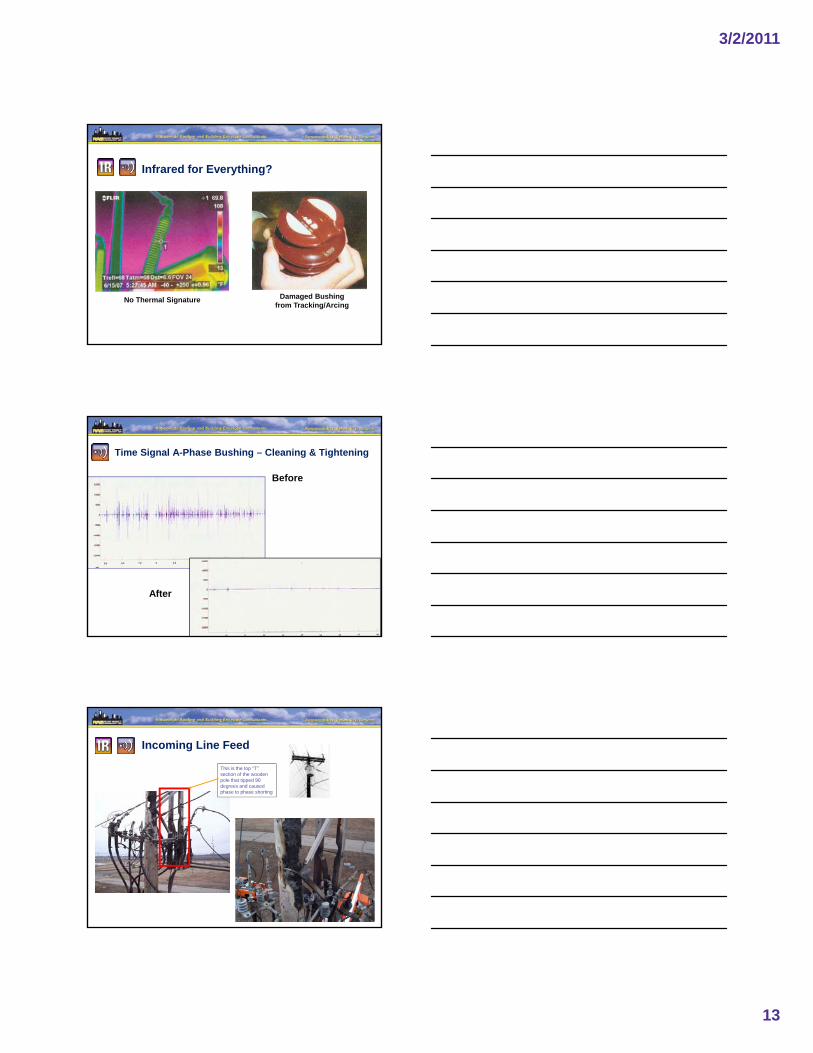
PdM Tool Box & Electrical Equipment Matrix
PdM Tool BoxPrimary Equipment Targets
HV / MV Service
Cables / Bus bars XFMR CB /
FusesMCC / Motors
Senses X X X X XSenses X X X X X
Infrared Thermography X X X X X
Ultrasound X X* X X X*
Oil Analysis X X
Motor Circuit / Current Testing X

3/2/2011
10
Hot and Cold Surfaces
All Types of Physical Degradation and Code Gaps
Arcing / Crackling / Humming
Chemicals, Melting and Burnt Odors
Taste Ozone Odors
and Code Gaps
Compliance Issues (NEC/OSHA) and other problems
Overloaded Lug Dirt & Debris Improper Fuse
Sensory Inspections & Culture of Safety
Clearance Violation Clearance Violation
I don’t Need No Stinkin’ Fuses
3/2/2011
11
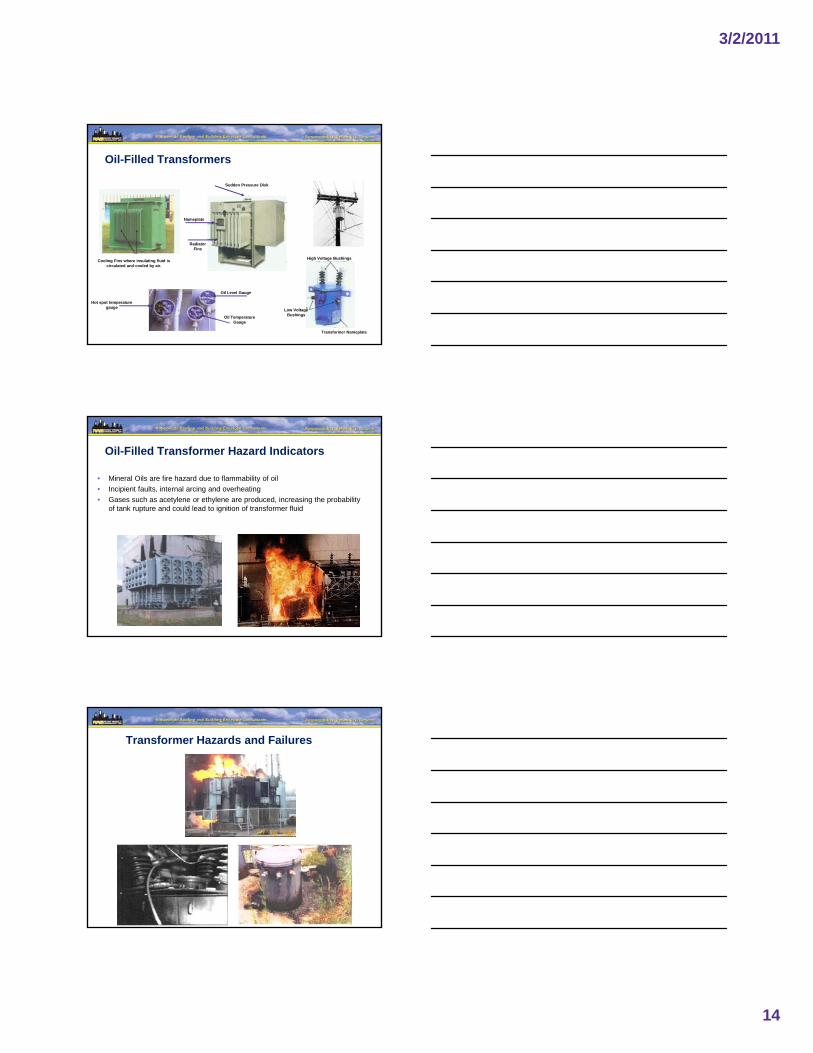
Infrared Thermography
All Electrical Systems and Components• Power Distribution• Substations• Breakers• Fuses• Transformers• Motor / Generator Control Centers• Starters and Thermal Overloads• Disconnects• Bus Connections • Relays • Electrical Vaults• Voltage Regulators

3/2/2011
12
Excessive Heat Impact
Temperature Effect on Insulation Resistance
e (o C
)
Every 18 oF (10 oC) rise
Resistance (Megohms)
Tem
pera
ture beyond rated
temperature, reduces insulation resistance
and useful life by 50%.
Failing Systems
Hot Disconnects Poor Bushing Connection 13.8 kV Air Switch
Tracking on Insulators
Ultrasound
• Corona discharge & Arcing on HV/MV electrical components• Turbulence / “White Noise” above 20 kHz• Airborne and Contact Probes
3/2/2011
13
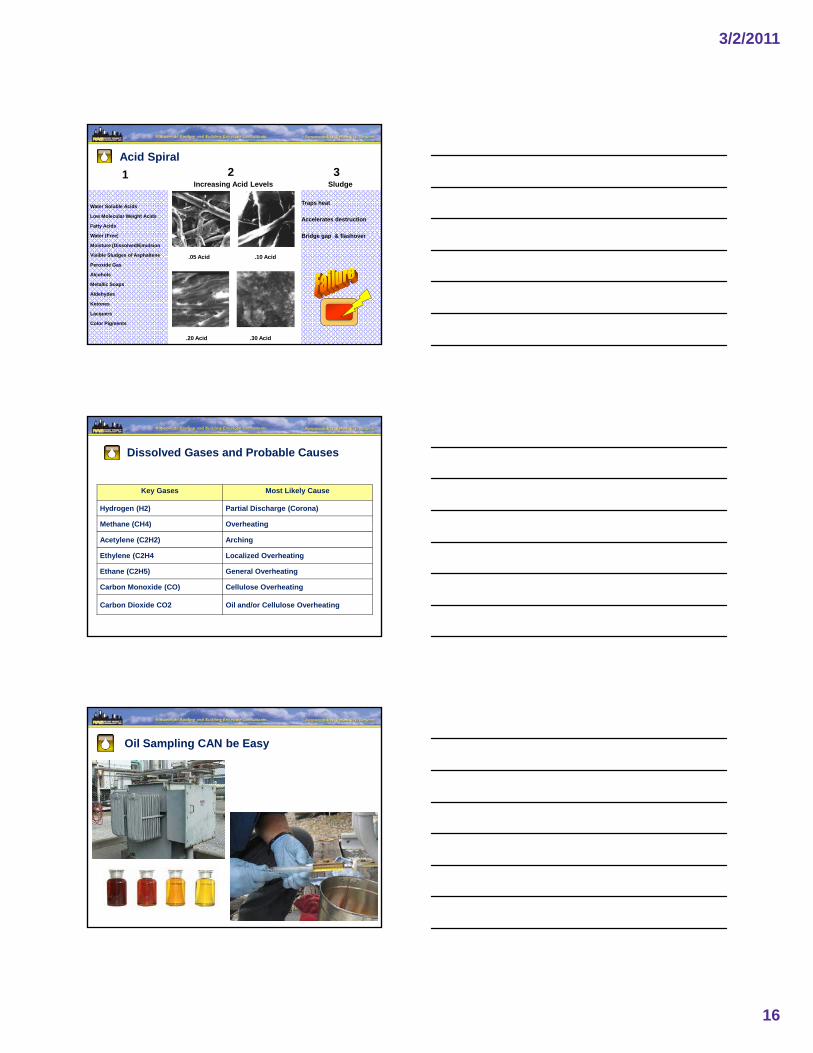
Infrared for Everything?
No Thermal Signature Damaged Bushing from Tracking/Arcing
Time Signal A-Phase Bushing – Cleaning & Tightening
Before
After
Incoming Line Feed
This is the top “T” section of the wooden pole that tipped 90 degrees and caused phase to phase shorting
3/2/2011
14
Oil-Filled Transformers
Sudden Pressure Disk
Nameplate
Cooling Fins where insulating fluid is circulated and cooled by air.
Hot spot temperature gauge
Oil Level Gauge
Oil Temperature Gauge
Radiator Fins
High Voltage Bushings
Transformer Nameplate
Low Voltage Bushings
Oil-Filled Transformer Hazard Indicators
• Mineral Oils are fire hazard due to flammability of oil• Incipient faults, internal arcing and overheating• Gases such as acetylene or ethylene are produced, increasing the probability
of tank rupture and could lead to ignition of transformer fluid
Transformer Hazards and Failures

3/2/2011
15
Transformers
Kraft Paper Internals
Conductors of a transformer are typically wrapped in Kraft paper.
HV Winding
Press board spacers’ support and separate
each turn in the winding.
Press board cylinders support and separate HV
& LV windings
LV Winding
Press board cylinders support and separate the windings from the core.
Normal Load Surge Load
No Moving Parts but it Does Move
Dielectric Clearance
Mechanical vibration
Switching surges
Line surges
Limited short circuits
3/2/2011
16
Traps heat
Accelerates destruction
B id & fl h
21
Water Soluble Acids
Low Molecular Weight Acids
Fatty Acids
W t (F )
3Increasing Acid Levels Sludge
Acid Spiral
Bridge gap & flashover
.05 Acid .10 Acid
.20 Acid .30 Acid
Water (Free)
Moisture (Dissolved/Emulsion
Visible Sludges of Asphaltene
Peroxide Gas
Alcohols
Metallic Soaps
Aldehydes
Ketones
Lacquers
Color Pigments
Dissolved Gases and Probable Causes
Key Gases Most Likely Cause
Hydrogen (H2) Partial Discharge (Corona)
Methane (CH4) OverheatingMethane (CH4) Overheating
Acetylene (C2H2) Arching
Ethylene (C2H4 Localized Overheating
Ethane (C2H5) General Overheating
Carbon Monoxide (CO) Cellulose Overheating
Carbon Dioxide CO2 Oil and/or Cellulose Overheating
Oil Sampling CAN be Easy

3/2/2011
17
Sampling CAN be Hazardous
Internal Distribution
Distribution Bus Work
3/2/2011
18
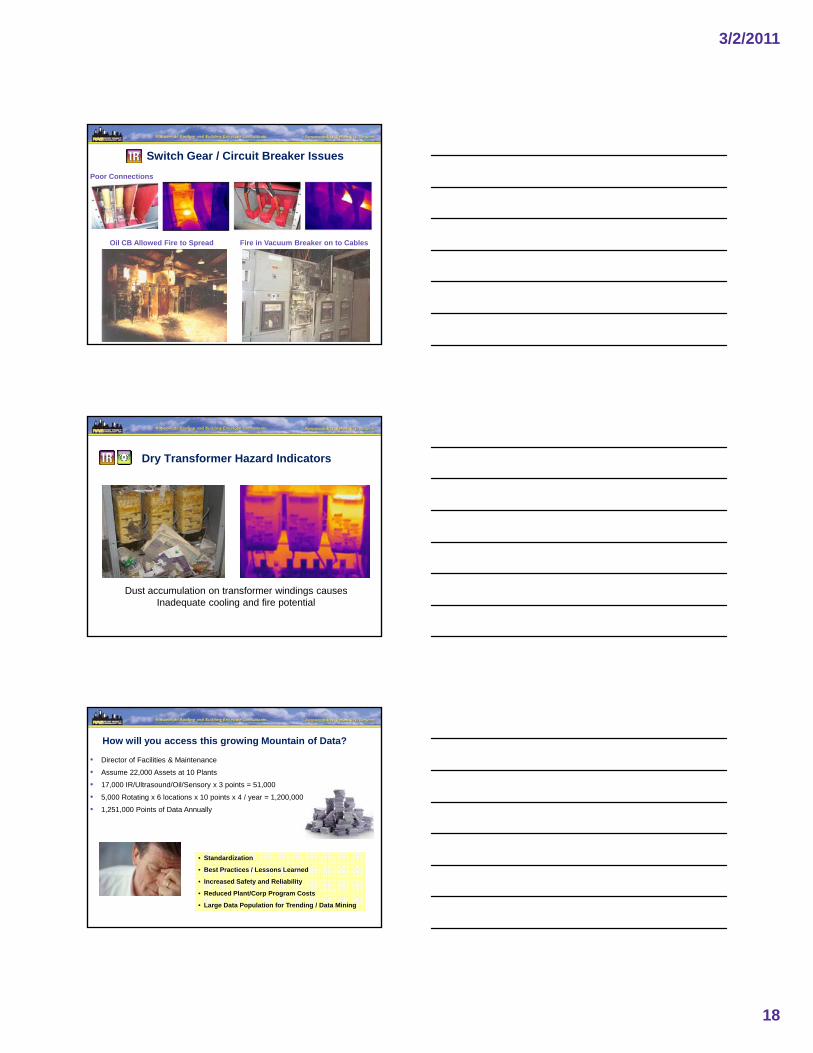
Switch Gear / Circuit Breaker IssuesPoor Connections
Oil CB Allowed Fire to Spread Fire in Vacuum Breaker on to Cables
Dry Transformer Hazard Indicators
Dust accumulation on transformer windings causes Inadequate cooling and fire potential
How will you access this growing Mountain of Data?
• Director of Facilities & Maintenance
• Assume 22,000 Assets at 10 Plants
• 17,000 IR/Ultrasound/Oil/Sensory x 3 points = 51,000
• 5,000 Rotating x 6 locations x 10 points x 4 / year = 1,200,000
• 1,251,000 Points of Data Annually
• Standardization
• Best Practices / Lessons Learned
• Increased Safety and Reliability
• Reduced Plant/Corp Program Costs
• Large Data Population for Trending / Data Mining

3/2/2011
19
Issues with Integration of Reliability Program Data
• Building New Database
• Data Centralization
• Added Resources to Manage
• Multiple Data Types
CMMSP
Your Team3rd Party Services
Reliability Data
Ultimate Goal of Targeted Data Mining
MCCInventory
Get Accurate, Complete Info When, Where and How You Want it
Motors
PumpsCompressors
Chillers
Transformers
Problems
Cost / Benefit
Injuries
KISS Your Data - Start Small w/ Balanced Build Up
Excel / MS Access
3rd Party Platforms

3/2/2011
20
KISS to Close the Deal
Keep It Super Simple• Start Small• Equipment IDs / Criticality• Target Problem Areas• Collect DataCollect Data• Centralize your information • Trend Results (Good and Bad)• Financial Benefits to Corporation • Keep Everyone Engaged - Communicate,
Communicate, Communicate• Repeat
4 Years of FindingsTotal Years of Data in
Sample4 Years
(2004 –2008)
Equipment Inspected 637,976Thermal Anomalies 42,869 6.7% *Compliance Gaps 16,607 2.6% *
Anomaly Category %Poor Connection 72%
Internal Flaw 18%Overload 6%
Misc: Items 4%100%
* % of equipment Inspected
Plastic Pipe Manufacturer2008
Sites: 34
Inventory: 5327Problems: 358
% Problems / Insp.: 7%
Energy Savings: $220,177Run to Failure Cost: $112,720
Less Repair Cost: $38,299 Proactive Repair vs. RTF
Cost: $74,421
Known Fines: $22,000 $316,598
Temp Rise for All 24,975 oF

3/2/2011
21
5
10
15
20
25
30
35
16%18%20%
ProblemsSites
Growing Corporation, Decreasing Problems
2005 2006 2007 20080
1000
2000
3000
4000
5000
6000
2005 2006 2007 20080
0%2%4%6%8%
10%12%14%16%
2005 2006 2007 2008
Assets
Poultry / Beef Producer
Thermal Anomalies
1,500
2,000
2,500
otal
s
Critical
50% Reduction of Thermal Anomalies over 3 Years
50% Reduction of Thermal Anomalies over 3 Years
1 25,450 Electrical Asset Population
2 Annualized savings calculated at $0.04 / kWh with 24/7 operations
0
500
1,000
,
2005 2006 2007 2008
Years
Annu
al T
o
SeriousImportantMinor
Global Automotive Risk Reduction & Reliability Program Overview
Reliability Metrics
Sites: 56
Inventory: 5,435
Problems: 1,692
USACanadaMexicoSouth AmericaEurope
Energy Savings: $630,670
Run to Failure Cost: $387,606
Less Repair Cost: $153,750
Proactive Repair vs. RTF Cost: $233,856
Known Fines: $237,000
$1,100,923

3/2/2011
22
Automotive Trends - Problems
84% - 3 Asset Types82% - 4 Causes72% - Low cost / No
Cost Fixes
What Gets Measured, Gets Done!
200% More Likely to Fix Issues with Email Alerting System
* Graph based upon the survey of more than 100 facilities with multi-year programs totaling over 1,000 sites.
Grain Processing Plant:Embedded Reliability ChampionVibration Analysis / Balancing
Ultrasound Compressed Air
Electrical Infrared
VibrationInfraredVisual Cogen
Wet Mill
6,550 Assets
6,325 IR Electrical Points
650 Vibration Rotating Assets
124 Oil Sample Points
VisualOilUltrasonic Motor Current
* Also includes Wet Mill EIR WIP as of 9.9.10
g
Dry Mill
3/2/2011
23
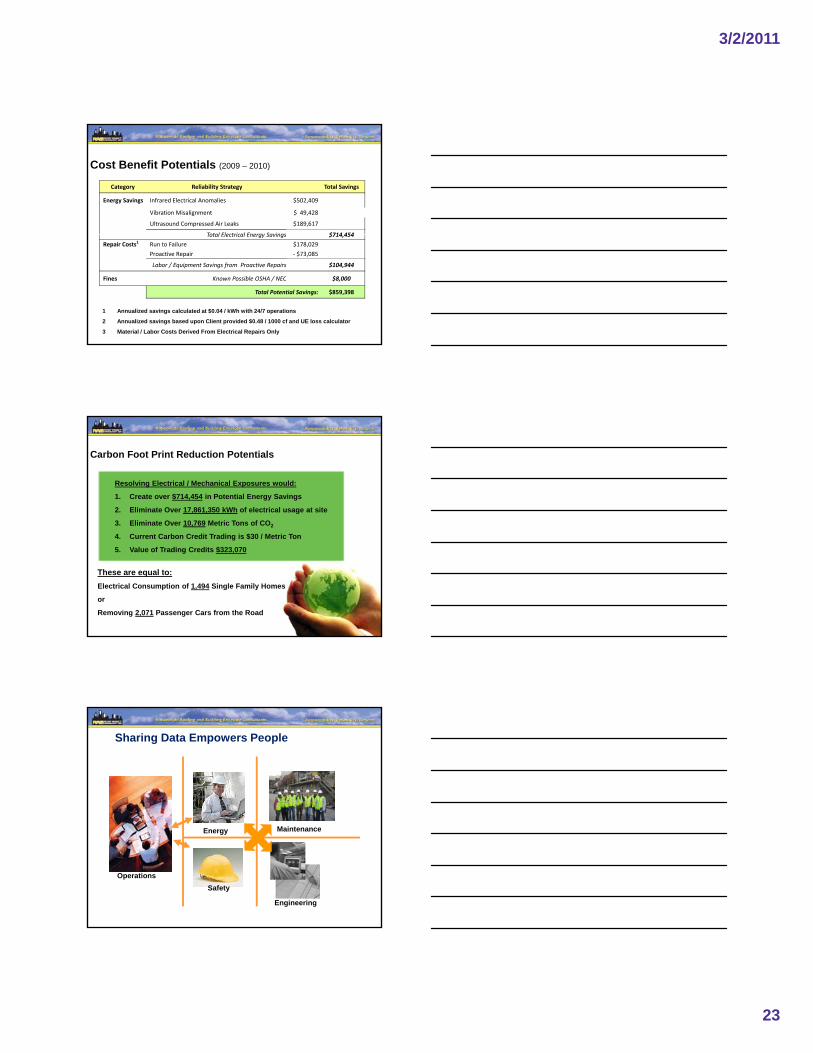
Cost Benefit Potentials (2009 – 2010)
Category Reliability Strategy Total Savings
Energy Savings Infrared Electrical Anomalies $502,409
Vibration Misalignment $ 49,428
Ultrasound Compressed Air Leaks $189,617
Total Electrical Energy Savings $714 454Total Electrical Energy Savings $714,454 Repair Costs1 Run to Failure $178,029
Proactive Repair ‐ $73,085
Labor / Equipment Savings from Proactive Repairs $104,944
Fines Known Possible OSHA / NEC $8,000
Total Potential Savings: $859,398
1 Annualized savings calculated at $0.04 / kWh with 24/7 operations
2 Annualized savings based upon Client provided $0.48 / 1000 cf and UE loss calculator
3 Material / Labor Costs Derived From Electrical Repairs Only
Carbon Foot Print Reduction Potentials
Resolving Electrical / Mechanical Exposures would:
1. Create over $714,454 in Potential Energy Savings
2. Eliminate Over 17,861,350 kWh of electrical usage at site
3. Eliminate Over 10,769 Metric Tons of CO2
These are equal to: Electrical Consumption of 1,494 Single Family Homes
or
Removing 2,071 Passenger Cars from the Road
, 2
4. Current Carbon Credit Trading is $30 / Metric Ton
5. Value of Trading Credits $323,070
Sharing Data Empowers People
Energy
Safety
Maintenance
Engineering
Operations
3/2/2011
24
Integrated PdM for Electrical Distribution Benefits
• Safety – Reduced arc flash and shock exposures• Energy Engineer – Energy Reductions and Savings• Environmental – Carbon Footprint reductions• Risk – eliminate/mitigate casualty and property loss businessRisk eliminate/mitigate casualty and property loss, business
interruption, contamination exposures and increase bidding• Reliability / Maintenance – increased uptime and labor
savings
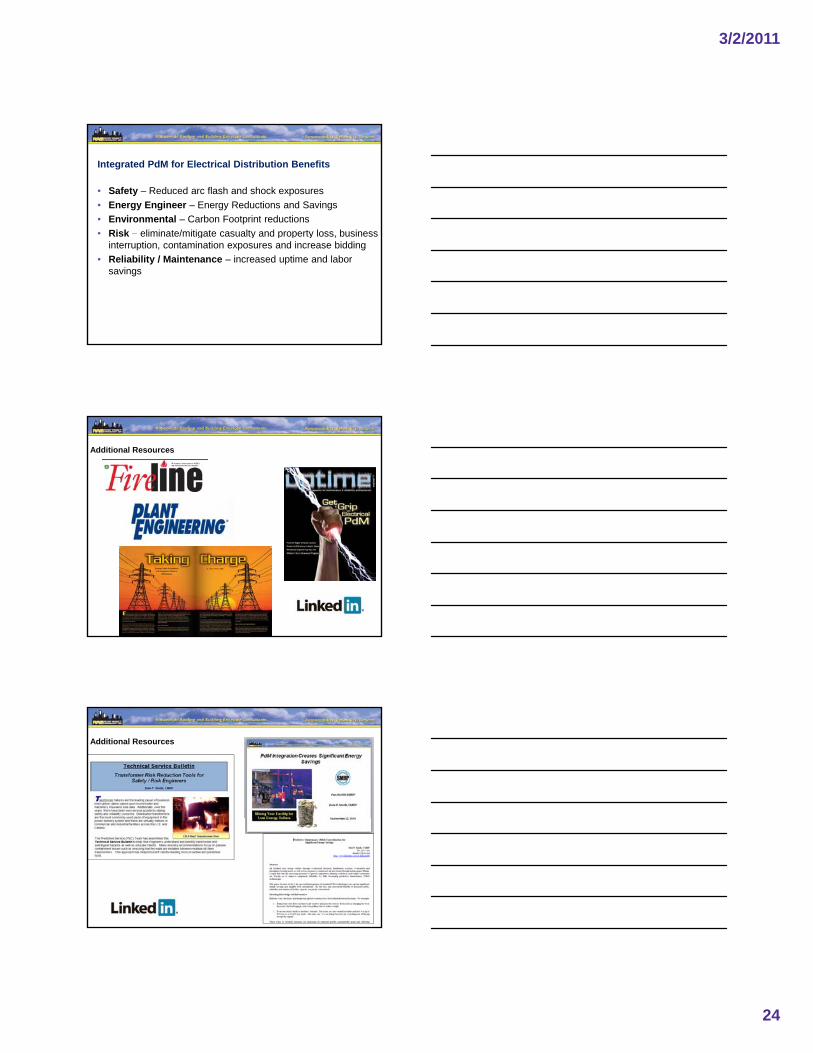
Additional Resources
Additional Resources

3/2/2011
25
ROOF
WALLS
Protecting Value Inside by Securing the Outside
Engineering DesignEngineering Design Vegetative
Surveys & info ManagementSurveys & info Management
FOUNDATION
MaintenanceMaintenance
Project ManagementProject Management
Healthcare Manufacturing Education Commercial Government
Solar
Additional Information
Dale P Smith, CMRPVP Sales & Marketing Roof Asset Management USA
877.RAM.4949 Toll Free440.263.7493 [email protected]
www.RoofRAM.com
Thank Thank you
youThank you