DAHLGREN DIVISION NAVAL SURFACE WARFARE … Laboratory Independent Research Program at the Naval...
40
DAHLGREN DIVISION NAVAL SURFACE WARFARE CENTER Panama City, Florida 32407-7001 CSS/TR-97/16 EVALUATION OF A THREE-CHANNEL HIGH-TEMPERATURE SUPERCONDUCTING MAGNETOMETER SENSOR DR. JOHN W. PURPURA SCIENCE, TECHNOLOGY, AND ANALYSIS DEPARTMENT JUNE 1997 Approved for public release; distribution is unlimited. Co [JDIIC QUALITY IiyGFEÖTlB 8 IHKBBSTWKI 3 IS UNLIMITCO
Transcript of DAHLGREN DIVISION NAVAL SURFACE WARFARE … Laboratory Independent Research Program at the Naval...
DAHLGREN DIVISION NAVAL SURFACE WARFARE CENTER Panama City, Florida 32407-7001
CSS/TR-97/16
EVALUATION OF A THREE-CHANNEL HIGH-TEMPERATURE SUPERCONDUCTING MAGNETOMETER SENSOR
DR. JOHN W. PURPURA
SCIENCE, TECHNOLOGY, AND ANALYSIS DEPARTMENT
JUNE 1997
Approved for public release; distribution is unlimited. Co
[JDIIC QUALITY IiyGFEÖTlB 8
IHKBBSTWKI3
IS UNLIMITCO

REPORT DOCUMENTATION PAGE Form Approved OMB No. 0704-0188
Public reporting burden for this collection of information is estimated to average 1 hour per response, including the time for reviewing instructions, searching existing data sources, gathering and maintaining the data needed, and completion and reviewing the collection of information. Send comments regarding this burden estimate or any other aspect of this collection of information, including suggestions for reducing this burden, to Washington Headquarters Services, Directorate for Information Operations and Reports, 1215 Jefferson Davis Highway, Suite 1204, Arlington, VA 22202%02, and to the Office and Management and Budget, Paperwork Reduction Project (0704-0188), Washington, DC 20503.
1. AGENCY USE ONLY (Leave blank) 2. REPORT DATE
June 1997
3. REPORT TYPE AND DATES COVERED
4. TITLE AND SUBTITLE
Evaluation of a Three-Channel High-Temperature Superconducting Magnetometer System
5. FUNDING NUMBERS
6. AUTHOR(S)
Dr. John W. Purpura
7. PERFORMING ORGANIZATION NAME(S) AND ADDRESS(ES)
Arm: R23 Commanding Officer CSSDDNSWC 6703 W. Highway 98 Panama City, FL 32407-7001
8. PERFORMING ORGANIZATION REPORT NUMBER
CSS/TR-97/16
9. SPONSORING/MONITORING AGENCY NAME(S) AND ADDRESS(ES) Arm: Code 321 Office of Naval Research Ballston Tower One 800 N. Quincy Street Arlington, VA 22217-5660
10. SPONSORING/MONITORING AGENCY REPORT NUMBER
11. SUPPLEMENTARY NOTES
12a. DISTRIBUTION/AVAILABILITY STATEMENT
Approved for public release; distribution is unlimited.
12b. DISTRIBUTION CODE
13. ABSTRACT (Maximum 200 words)
This report presents the results of an evaluation of a three-channel high-temperature superconducting magnetometer sensor which operates at liquid nitrogen temperature. Measurements of sensor white noise levels, low-frequency noise, an response to applied magnetic fields were performed in shielded and unshielded environments. The intrinsic noise of the sensor was found to be independent of the ambient environment in which it was operated. Nonhysteretic response to applied magnetic field was limited to a dynamic range of approximately 2 microtesla.
APPROVED FOR PUSU. RELEASE; DISTRIBUTE IS UNLIMITED
14. SUBJECT TERMS
superconducting quantum interference device (SQUID), magnetometer, high-temperature superconductor, noise-cancellation, white noise, low-frequency noise
15. NUMBER OF PAGES
16. PRICE CODE
17. SECURITY CLASSIFICATION OF REPORT
UNCLASSIFIED
18. SECURITY CLASSIFICATION OF THIS PAGE UNCLASSIFIED
19. SECURITY CLASSIFICATION OF ABSTRACT
UNCLASSIFIED
20. LIMITATION OF ABSTRACT
SAR
NSN 7540-01-280-5500 Standard Form 298 (Rev. 2-89) Presented by ANSI Std. Z39-1« 298-102
CSS/TR-97/16
FOREWORD
A three-channel, high-temperature superconducting magnetometer sensor was fabricated by Conductus, Incorporated as part of Phase II Small Business Independent Research contract number N61331-94-C-0049. Field testing of the sensor was conducted at the Coastal Systems Station (CSS), Panama City, Florida, to measure performance under various ambient conditions. This document describes the testing performed and the results achieved.
This evaluation was primarily sponsored by the Office of Naval Research (Code 322, Dr. Joseph Kravitz) as part of the magnetic sensors project managed at CSS. The project manager was Dr. Ted Clem. Additional support for this work was provided by the Navy In- House Laboratory Independent Research Program at the Naval Surface Warfare Center, Dahlgren Division, administered at CSS by Dr. Raymond Lim under the direction of Dr. Gary Kekelis.
The author gratefully acknowledges the following contributions to this evaluation by his CSS R23 colleagues: Mr. George Allen and Dr. Roy Wiegert for their assistance with the field tests, Mr. Brian Price for performing the data processing, and Mr. Jerry Blimbaum for assisting in the development of the data acquisition software. Special thanks to Dr. John Schmidt of Conductus, Incorporated for his initial operational demonstration of the sensor.
This report has been reviewed by J. Wood, Head, Non-Acoustics Branch and G. Kekelis, Head, Sensing Technology Division.
Approved by:
/tt. d& BARRY L. DILLON, Head Science, Technology, and Analysis Department
DTIC QUALITY INSPECTED 8
iii/iv APPROVED FOR PUBLIC 1U/1V RELEASE; DISTRIBUTION IS UNLIMITED

CSS/TR-97/16
CONTENTS
Page
INTRODUCTION 1
MAGNETOMETER SENSOR DESCRIPTION 1
EXPERIMENTAL TEST FACILITIES 4
DATA ACQUISITION AND PROCESSING 5
EXPERIMENTAL EVALUATION 7 MAGNETOMETER INFORMATION 7 INITIAL SETUP 7 GENERAL OBSERVATIONS ON SENSOR PERFORMANCE 8 MAGNETOMETER CALIBRATIONS 9 WHITE NOISE MEASUREMENTS 11 LOW FREQUENCY NOISE MEASUREMENTS 16 MAGNETIC FIELD RAMP EXPERIMENTS 24
FINAL VERSION IMPROVEMENTS 28
CONCLUSIONS 29
REFERENCES , 32
DISTRIBUTION (1)
APPROVED FOB PUBLIC RELEASE; DISTRIBUTION IS UNLIMITED

CSS/TR-97/16
ILLUSTRATIONS
Figure Page
1 CONDUCTUS PROTOTYPE THREE-CHANNEL MAGNETOMETER SENSOR 2
2 WHITE NOISE OF CHANNEL 1 WHEN SHIELDED FROM DC MAGNETIC FIELDS AND RFI 12
3 WHITE NOISE OF CHANNEL 1 WHEN SHIELDED FROM RFI 14
4 WHITE NOISE OF CHANNEL 1 WHEN UNSHIELDED 15 5 RAW OUTPUT SIGNALS OF TWO UNSHIELDED
MAGNETOMETERS 18 6 POWER SPECTRAL DENSITIES OF RAW UNSHIELDED
CHANNEL 1 OUTPUT AND WHEN NOISE-CANCELED WITH CHANNEL 2 19
7 SPECTRAL DENSITIES OF CHANNEL 1 OUTPUT WITH AND WITHOUT NOISE-CANCELING 20
8 SENSOR PERFORMANCE DEGRADATION 21 9 NOISE-CANCELED PSD OF SENSOR UNSHIELDED AND
u-METAL SHIELDED 22 10 COMPARISON OF SENSOR PERFORMANCE BEFORE AND
AFTER DEWAR VACUUM JACKET WAS RE-EVACUATED 24 11 EFFECT OF LIQUID NITROGEN BOILING RATE ON SENSOR
PERFORMANCE 25 12 RESPONSE OF A MAGNETOMETER TO A LINEAR MAGNETIC
FIELD RAMP 26 13 RESPONSE OF MAGNETOMETERS TO APPLIED FIELD WHEN
UNSHIELDED 27
VI
CSS/TR-97/16
EXECUTIVE SUMMARY
A portable, three-channel, high-temperature superconducting (HTS) magnetometer sensor was constructed by Conductus, Incorporated under a Phase II Small Business Independent Research (SBIR) contract. The sensor was delivered to the Coastal Systems Station (CSS), Panama City, Florida, in January 1996 for a performance evaluation. This document describes the evaluation performed and presents the results obtained.
The magnetometer sensor operates at 77 K and incorporates three commercially available direct current superconducting quantum interference device (SQUID) magnetometers from the Conductus iMAG® product line. The magnetometers are fabricated from single-layer thin films of YBa2Cu307.x on fused bicrystal strontium titanate substrates. The magnetometer geometry consists of a 1-cm2 pickup loop connected in parallel with the much smaller loop comprising the body of the SQUID. All three magnetometers are mounted parallel to each other at the end of a probe, with their sense axes along the vertical direction. The probe fits inside a compact liquid nitrogen dewar that has a two-week hold time. The iMAG® SQUID controller automatically tunes each magnetometer to its proper operating parameters, simultaneously operates all the magnetometers in flux-locked loops, and uses a bias current reversal scheme to reduce low- frequency noise resulting from fluctuations of the critical current of the Josephson junctions.
The white noise measured for the best magnetometer was 36 fT/Hz1/2 (3.1 uO/Hz172). For each channel, the white noise level was the same whether the magnetometer was totally exposed to the Earth's field and the ambient radio frequency noise or fully shielded from them. A necessary requirement for optimal performance is thermally cycling the sensor in the magnetic field in which it is to be operated to prevent large circulating currents from being induced in the pickup loop.
The parallel configuration of the magnetometer sense axes allowed their intrinsic low- frequency noise to be measured by subtracting one channel from another to eliminate the correlated environmental noise. Maximum noise cancellation was achieved by using a software algorithm to determine the best fit to the subtraction of the raw output of the channels. Using this novel technique, a value of intrinsic magnetometer noise of 132 fT/Hz1/2 (11 \i<t>(/H.zm) at a frequency of 1 Hz was obtained. This noise level is approximately 50 times below that achieved by the best commercially available fluxgate magnetometers demonstrated to date and is only surpassed by low temperature superconducting magnetometers. It was determined that the low- frequency noise performance of the HTS magnetometer sensor was limited by the thermal stability of the dewar.
VÜ APPROVED F0,'( ri. ,. .. RELEASE; DISTRISUL IS UNLIMITED
CSS/TR-97/16
The magnetometers operated linearly over a dynamic range of approximately 2 uT, with hysteretic response being observed for larger field excursions. The dynamic range appears to be limited by the critical current of the pickup loop in the regions where it crosses the grain boundary of the bicrystal substrate. Magnetometers with design modifications to eliminate the grain boundary crossings (by using substrates with offset grain boundaries) are currently being fabricated to address this issue. An enlargement of the feedback coil to encompass the entire pickup loop to provide field nulling is also suggested as a result of this evaluation.
The magnetometers in this prototype sensor have operated reliably for over two years and as of January 1997 continue to operate at a level of performance equal to that measured upon their delivery to CSS in January 1996. The hermetically sealed fiberglass buttons in which the magnetometer substrates are mounted have proven to be effective in preventing moisture from damaging the delicate thin film superconducting material of the magnetometers. The battery- powered electronics have provided a user-friendly interface for automatic operation of the sensors, without the performance-degrading ground loops that commonly plague SQUID systems operating off of line, voltage.
A final version of the sensor was delivered under this SBIR contract in April 1997, which implements a large number of improvements over the sensor that was evaluated in this study. In addition to the redesigned SQUID magnetometers using offset grain boundaries mentioned earlier, many modifications to the probe and electronics were completed. A completely new probe replaces the one used in this evaluation to improve performance and orient the magnetometers along three orthogonal axes. The new probe has two x-axis magnetometers, as well as y-axis and z-axis magnetometers. The center shaft of the probe is spring-loaded against the bottom of the Dewar to minimize magnetometer motion relative to the dewar. Also, the internal cabling, connecting the magnetometers to the underside of the top plate of the probe, was replaced with low thermal-conductivity cables to increase dewar holdtime. The entire architecture of the electronics has been significantly changed to provide a powerful, flexible sensor with enhanced capabilities. The SQUID controller electronics have been replaced by a notebook computer to improve the user interface by providing easy-to-read graphical displays of channel information and data. The number of magnetometers that can be operated has increased, from the three channels per controller presently allowed, up to 255 channels, because the new flux-locked loop (FLL) electronics are fully programmable and addressable. The FLL electronics have twice the bandwidth and over two orders of magnitude reduction in its low- frequency drift rate. Bias and modulation current resolution are improved from 1 part in 256 to 1 part in 4096. The new FLL allows remote selection of one of four bias current schemes, whereas the present FLL has only one scheme available. Also, the new FLL will allow for an external feedback signal to be input to implement advanced noise reduction schemes such as the three SQUID gradiometer invented at IBM. A full evaluation of the new sensor will begin during the summer of 1997.
APPROVED FOR PUBLIC Vlll RELEASE; DISTRIBUTION
IS UNLIMITED
CSS/TR-97/16
INTRODUCTION
As part of Phase II Small Business Independent Research (SBIR) contract number N61331-94-C-0049, Conductus, Incorporated constructed a prototype three-channel high transition temperature (Tc) superconducting quantum interference device (SQUID) magnetometer sensor. The sensor was delivered to the Coastal Systems Station (CSS), Panama City, Florida for a performance evaluation to identify any necessary changes required prior to acceptance of the sensor as a contract deliverable. This report describes the field testing performed on the magnetometer sensor at CSS and presents the test results.
The sensor dewar and magnetometer probe arrived at CSS on 24 January 1996. The control unit, battery pack, three flux-locked loop (FLL) electronics units, and interconnecting cabling were delivered on Wednesday, 31 January 1996. A member of the technical staff of Conductus assisted in the initial setup and field testing of the sensor. All testing of the magnetometer sensor took place in the nonmagnetic area at CSS where the evaluation began with Conductus assembling and demonstrating the sensor on the morning of 31 January and assisting with field testing that afternoon and the following day. More extensive testing was conducted by CSS personnel from 5 February through 17 May 1996.
A description of the customized iMAG®1 magnetometer sensor delivered is provided in the next section of this report. The sensor description is followed by sections describing the experimental test area, the data acquisition instrumentation used, and the data processing performed. Next, the experimental tests performed are described and the results presented. A brief section describing the final version of the sensor delivered in April 1997 is also included. Finally, conclusions drawn from the testing are provided.
MAGNETOMETER SENSOR DESCRIPTION
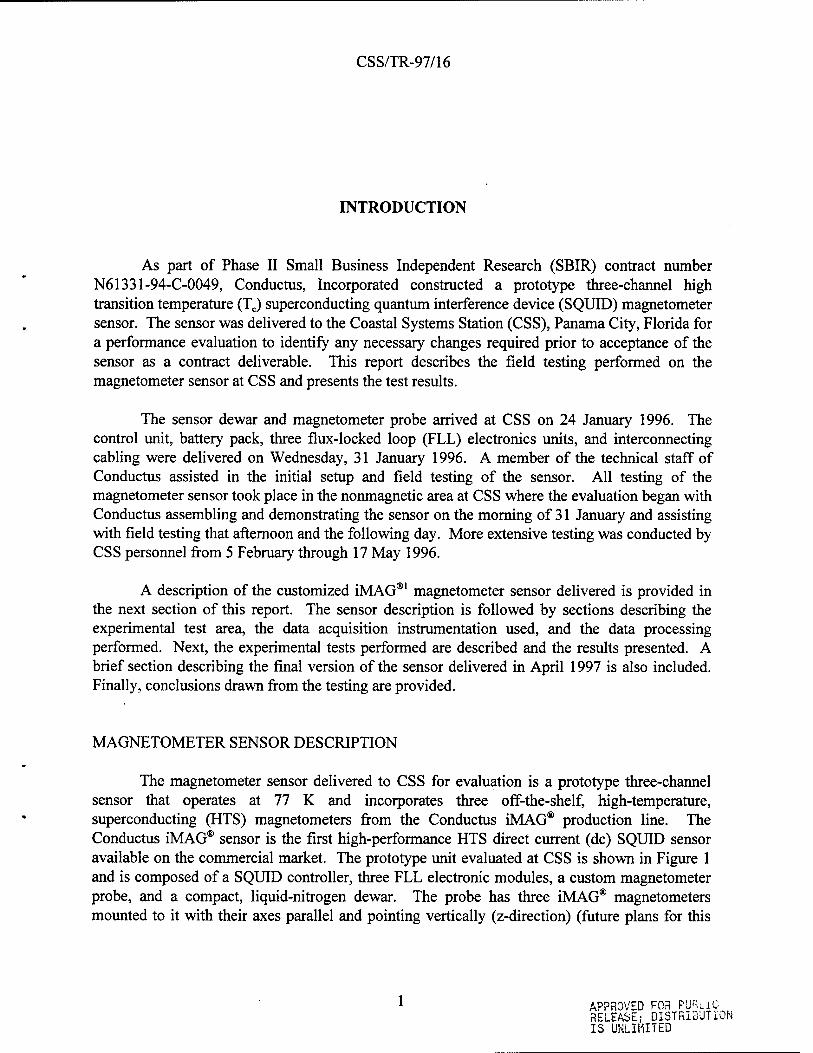
The magnetometer sensor delivered to CSS for evaluation is a prototype three-channel sensor that operates at 77 K and incorporates three off-the-shelf, high-temperature, superconducting (HTS) magnetometers from the Conductus iMAG® production line. The Conductus iMAG® sensor is the first high-performance HTS direct current (dc) SQUID sensor available on the commercial market. The prototype unit evaluated at CSS is shown in Figure 1 and is composed of a SQUID controller, three FLL electronic modules, a custom magnetometer probe, and a compact, liquid-nitrogen dewar. The probe has three iMAG® magnetometers mounted to it with their axes parallel and pointing vertically (z-direction) (future plans for this
APPROVED FOR PUBLIC RELEASE; DISTRIBUTION IS UNLIMITED

CSS/TR-97/16
sensor are for the magnetometers to be oriented along three orthogonal axes (x, y, and z directions)). The parallel configuration of the magnetometers allows magnetic gradiometers to be formed with pairs of magnetometers either electronically or using software subtraction of channels recorded synchronously. This technique is useful for canceling low-frequency environmental noise common to both channels, so that the low-frequency noise intrinsic to the magnetometers can be measured.
Flux-Locked Loop Electronic Modules
SQUID Controller
Probe
FIGURE 1. CONDUCTUS PROTOTYPE THREE-CHANNEL MAGNETOMETER SENSOR
Each magnetometer consists of a dc SQUID having a direct-coupled pickup loop, fabricated using photolithography from a single-layer thin film of YBa2Cu307.x (YBCO) that is deposited onto a 1 by 1-cm bicrystal SrTi03 substrate. The two grain-boundary microbridge Josephson junctions of the SQUID are formed where the SQUID loop crosses the bicrystal grain boundary of the substrate. The direct-coupled pickup loop has a linewidth of approximately 1 mm, and crosses the bicrystal grain boundary in two places. A small copper wire coil (0.125 in. diameter) is positioned over the magnetometer to provide flux modulation and feedback. The magnetometer substrate, modulation coil, and a heater are packaged together in a hermetically sealed fiberglass disk-shaped button (18 mm outer diameter (o.d.) by 4 mm thick),
APPROVED FOR f-v" RELEASE; DISTRIBÜi IS UM IHN ED
CSS/TR-97/16
the superconducting material protected from moisture damage. The top surface of the button has electrical pads that serve to make the connections from the button contents to the probe internal wiring by means of spring-loaded pins.
Each button mounts to the bottom of a fiberglass cylinder (18 mm o.d. by 40 mm long) that contains a cold-side matching transformer for the signal, a 1-A resistor in series with the transformer primary, and protective resistors on the current bias lines. The term magnetometer sensor assembly will be used in this report to refer to the magnetometer button attached to the fiberglass cylinder housing the cold transformer. A 10-conductor shielded cable connects each magnetometer sensor assembly to a connector on the probe top plate. This cable contains wire pairs for the magnetometer signal, bias current, modulation signal, feedback signal, and heater.
The probe is of fiberglass construction and consists of a circular top plate (6 in. o.d.) with a center shaft attached to it, which serves as both a support (for the three magnetometer sensor assemblies, baffles, and vent tube) and as a liquid nitrogen fill tube. The top plate has three 10-pin Lemo® connectors mounted to it (one for each magnetometer channel). The magnetometer sensor assemblies are mounted at the bottom of the probe's center shaft with their axes vertical. These assemblies are positioned such that all three magnetometer substrates lie in the same horizontal plane with the centers of the magnetometers located at the points of an equilateral triangle. Each magnetometer center is spaced 28.5 mm from the other magnetometer centers. The buttons are situated approximately 1 ft below the top plate.
Three FLL electronics modules (Conductus model iFL-301) are stacked on top of one another and mount to the top plate. An 18-in. long shielded pigtail cable is permanently attached to each module and connects to its corresponding Lemo® connector on the top plate. A 20-ft long composite cable (consisting of five wire lines and two fiberoptic cables) connects each FLL module to the Conductus model iMC-303 SQUID controller. The wire lines carry the analog SQUID magnetometer signal as well as dc power and ground, and the fiberoptic lines carry digital clock and data signals.
The iMC-303 SQUID controller can operate up to three magnetometer channels at a time. It has a liquid crystal display that can display SQUID operating parameters; settings for filters, gain, and dc offset, etc.; and locked and unlocked magnetometer voltage outputs. It has front- panel keypad communication as well as full computer control of all functions via IEEE-488 interface. The controller provides for magnetometer heating followed by fully automated tuning of the SQUID operating parameters, and also allows for manual setting of parameters. The electronics uses a bias current reversal scheme to reduce low-frequency noise caused by critical current fluctuations intrinsic to the SQUID. There is a rear panel BNC jack for each of the three magnetometer channel signals to monitor either the locked or unlocked magnetometer output depending on whether the sensor is in the RUN mode or SETUP mode, respectively. In SETUP mode, magnetic flux is ramped on the unlocked magnetometer over a period of several flux quanta, so monitoring the rear panel BNC magnetometer output with an oscilloscope results in a trace resembling the voltage versus magnetic flux (V-O) curve of the SQUID.
APPROVED FC« .: RELEASE; DISTRiaül. 15 UNLIMITED
CSS/TR-97/16
The magnetometer signal can be amplified by any of nine front-panel selectable gain settings of xl, x2, x5, xlO, x20, x50, xlOO, x200, and x500. The normal slew rate setting for the sensor operates the feedback loop with a bandwidth of 20 kHz. When operating with gains of x 100 or more, the slew rate can be set to SLOW, which reduces the feedback loop bandwidth to 250 Hz to reduce flux popping.
There are two distinct feedback loop full-scale ranges of 5 <D0 and 500 <D0, respectively, where <D0 is the magnetic flux quantum and is equal to 2.07 x 10"15 webers. The sensor operates with lowest noise and highest sensitivity in the 5 O0 range. In the 500 O0 range, the sensor provides the greatest dynamic range. The gain setting of the magnetometer channel determines which feedback loop range is selected. Gain settings of xl to x50 result in the sensor operating in the 500 O0 range, while gains of x 100 to x500 cause the sensor to operate in the 5 O0 range.
Each magnetometer channel may be operated in its FLL mode with or without low pass filtering. The three available low pass filters are 5 Hz, 500 Hz, and 5 kHz. Selecting a low pass filter setting of OFF results in the output being limited by the 20 kHz bandwidth of the FLL electronics.
The sensor is powered by four sealed, 12-V, lead-acid batteries. For the prototype sensor, the batteries were placed in a plastic toolbox to make a portable battery pack. A cable provides the connection between the batteries and the SQUID controller. Each battery weighs about 10 lb and has a nominal capacity of 9.5 Ah. It is estimated that the sensor can operate from 16 to 18 hours before the batteries must be recharged. Two battery-chargers were supplied with the sensor. The sensor can also be operated off 120 VAC line voltage, if desired.
A liquid nitrogen dewar was custom-made for the probe. It is of fiberglass construction and has a capacity of about 6.5 L. Its approximate dimensions are 15-in. high with an o.d of 9 in. It has an operational hold time of two weeks.
EXPERIMENTAL TEST FACILITIES
Evaluation of the magnetometer sensor was conducted under a number of magnetic and radio frequency interference (RFI) environments to systematically study environmental effects on sensor performance. All tests were conducted at the Magnet Target Detection and Classification Range (MTDCR) at CSS; either inside buildings in the area or simply outdoors in an open field. This range is a 10-acre nonmagnetic area that has been cleaned and sifted of magnetic material to a depth of 10 ft.
Laboratory measurements were made in an RFI shield room located inside a building on the perimeter of the range and also in the u-metal-shield room connected to this same building. The RFI shield room is approximately 8 by 8 by 8 ft and has walls completely covered with
APPROVED FOH K,'b. .. RELEASE; DISTRIBUTE IS UNLIMITED
CSS/TR-97/16
copper sheets that reduce RFI by 100 dB. A patch panel provides a way to make filtered connections to equipment kept outside of the shield room. The magnetometer sensor dewar can be placed inside of |j.-metal cylinders placed inside the room to reduce the ambient magnetic field. The RFI shield room is ideal for measurements of white noise that is intrinsic to the magnetometers.
The ^-metal-shield room has a double-layer of |j.-metal and provides a good-sized working area in which the ambient magnetic field is reduced to a few milligauss, though it has no built-in RFI shielding. This room was useful for performing the magnetic field ramp experiments with the magnetometers cooled in zero field.
Field tests with the sensor subjected to the Earth's magnetic field were performed in the two motion testing facilities located in the MTDCR and also in the grass field between these buildings. The motion testing facilities are of wood construction held together with aluminum nails to minimize magnetic signatures. These facilities are normally used to test magnetic gradiometer sensors in motion. The newer of the two facilities has an RFI screenroom that nominally shields RFI by over 20 dB. Connections to equipment outside of the screening can be made through a patch panel that has various types of electrical feed-through connectors, including the BNC type that were used in this evaluation. The original motion testing facility has a dirt floor and does not have an RFI screenroom. This facility allows the magnetometers to be operated in the Earth's magnetic field in the ambient RFI environment, yet it provides shielding from the effects of the wind, rain, and sun. An air-conditioned, portable shack of aluminum construction located 140 ft from the motion testing facilities was used to house the data acquisition computers and voltmeters for the field tests.
DATA ACQUISITION AND PROCESSING
Data acquisition and processing for the evaluation of the Conductus HTS magnetometer sensor were accomplished by using a signal analyzer, two types of computer data acquisition systems, a personal computer-based, commercial data-processing program called MACRAN®,2
and a graphics and processing software package called SigmaPlot®.3 Data collected during the evaluation included power spectral densities (PSDs) of magnetometer channels, time-series measurements of magnetometer channels, and measurements of magnet current and multi- channel magnetometer output in experiments that ramped magnetic field on the magnetometers.
Power spectral densities of the locked-up output of the magnetometer channels were measured with a Hewlett Packard (HP) 3 5 62A signal analyzer.4 The signal analyzer was the only measuring instrument used to measure the white noise level of the magnetometers. Typically, to make a quick performance check on the magnetometers, a PSD over the frequency
APPROVED FOR PUBLIC RELEASE; DISTRIBUTION IS UNLIMITED

CSS/TR-97/16
range of 125 Hz to 100 kHz was measured to check the white noise level of the sensors. Often this measurement was followed-up with PSDs in the low-frequency range for further verification of performance.
The most expedient way to collect time-series voltage readings, at rates up to 1 kHz in the field, was to use the data acquisition system already assembled in the field testing shack that was provided by work performed under contract number N61331-91-C-0059. This system consists of an IBM 486 personal computer connected to five HP 3458A digital multimeters and a triggering circuit that triggers simultaneous voltmeter readings from the multimeters. The data acquisition software for this system allows up to five channels of synchronized time-series voltage readings to be collected with up to 8192 stored readings per channel. To maximize voltmeter integration time during data collection, each channel's measurements were stored internally in its multimeter's memory and then dumped to the computer's memory after the experiment was completed. Typically, two channels containing 8192 readings each were taken simultaneously at a 60-Hz rate with 7.5 digits of resolution, resulting in a run time of 2 min and 16 sec. From this data set, PSDs out to 30 Hz could be computed for each channel, as well as a noise-canceled data set computed by subtracting noise common to both channels. The software did have PSD and noise cancellation algorithms built into it, but they were only used to judge relative performance of the magnetometer sensor to make decisions concerning subsequent experimental parameters while out in the field. The data collected with this data acquisition system were processed using MACRAN® software at a later time.
Since full documentation of this software was not available, only minor changes were made to make it more compatible with the magnetometer field tests. Changes included putting in the appropriate calibration constants for each channel to record the raw time-series data in the units of nanotesla (nT) and adjusting the on-screen plot y-axis scale of the computed PSDs to be suitable to the noise levels of the HTS magnetometers. It was not immediately clear how to write and incorporate a routine into this data acquisition software that would ramp a current to a Helmholtz coil to provide a field ramp experiment. Therefore, a second data acquisition computer, with which the author was familiar, was programmed to run this type of experiment.
An HP 9000 Series 300 computer was used to control the field ramp experiments. An HP BASIC program operated an HP 3245A Universal Source as a constant current source to provide current to one axis of a three-axis Helmholtz coil. The program set up one HP 3458A multimeter as an ammeter and two other HP 3458A multimeters as voltmeters. This configuration allowed the current to the magnet coil to be measured along with simultaneous measurements of two magnetometer channels. The data were stored in the multimeters during data acquisition and then dumped to the computer memory to allow on-screen plotting and subsequent mass storage. This program recorded the magnet current in amperes and the magnetometer signals in volts.
Computation of the raw PSDs of the individual magnetometer channels and the noise canceled PSDs of channel pairs was carried out using MACRAN® software. The input that MACRAN® required included ASCII columns of time-series data for each magnetometer channel of interest and the frequency in hertz of the data acquisition rate for the data.
IS UKLIHITEO

CSS/TR-97/16
EXPERIMENTAL EVALUATION
MAGNETOMETER INFORMATION
In this report, the terms magnetometer and channel will be used interchangeably to refer to the specific SQUID magnetometers evaluated in this investigation. So, magnetometer 1 and channel 1 both refer to the same particular SQUID magnetometer. The Conductus fabrication device numbers, serial numbers, as well as selected magnetometer parameters measured at Conductus are given in Table 1 for the magnetometers labeled 1,2, and 3 in this evaluation.
TABLE 1. SQUID MAGNETOMETER INFORMATION
Magnetometer Device
Number Serial
Number Critical Current
0*A)
Modulation Depth G*V)
Mod. CoU Coupling (uAM>0)
1 94620-1 41 17.2 40.6 6.5 2 94620-2 42 8.2 40.6 5.9 3 94620-3 43 12.3 26.2 6.4
INITIAL SETUP
Setting up the magnetometer sensor for operation is a simple and straightforward procedure, which is covered in detail in the Conductus User's Manual for iMAG® HTS Multi- channel SQUID System5 A brief summary of the setup procedures used in this investigation will be given here.
During the course of field testing the magnetometer sensor at CSS, it was found that for best performance the dewar vacuum jacket must be maintained in a high vacuum condition. It is recommended that the dewar be pumped down to 10"6 torr or better every month or so, and especially right before any measurements that will need the sensor's maximum sensitivity and stability.
In most cases during this evaluation, the dewar was pre-cooled with liquid nitrogen a day before inserting the magnetometer probe. Liquid nitrogen was added to the warm dewar, a little at a time, until the dewar was filled about halfway full (about 4 in. of nitrogen measured from the bottom of the dewar). The nitrogen was added slowly (100 ml at a time) to minimize thermal shock to the dewar, and it took about 2 min to fill to the halfway point. Once boiling had slowed down sufficiently the dewar was capped off with a slightly vented foam lid. Typically, the next day, the dewar was topped off with nitrogen to a level of 6 or 8 in. deep, and then the probe was slowly lowered into the dewar over a period of a few minutes. An O-ring seal was used between
APPROVED FOR PUBLIC RELEASE; DISTRIBUTE IS UNLIMITED

CSS/TR-97/16
the probe top plate and the dewar, with six screws holding the top plate in place. The probe and dewar settled for at least a few hours before attempting to operate the sensor. Best performance was obtained when the dewar and probe were left undisturbed overnight. The dewar could subsequently be topped off as necessary by transferring liquid nitrogen through a fill tube in the probe with the probe remaining in place in the dewar.
The three iFL-301 FLL electronics boxes were kept permanently attached to one another and to a mounting flange with screws, and the flange was attached to the top plate of the probe, also with screws. The iFL-301 pigtail cables were then plugged into their respective top plate connectors. The three composite cables were connected between the iMC-303 SQUID controller and the iFL-301 FLL boxes. The composite cables were generally kept connected to the controller and FLL all the time to prevent dirt from contaminating the fiber optics. The composite cables had to be handled with great care to avoid kinking and twisting the fiber optics.
The battery pack was connected to the iMC-303 controller, and the sensor was ready for operation. An oscilloscope was connected to the rear panel SQUID output BNCs to monitor the unlocked tuning voltage (essentially an amplified V-<t> amplitude) of the SQUID channels. The controller was turned on, placed in SETUP mode, and the HEAT key was pressed to thermally cycle the magnetometers above their transition temperatures, cool them back down to liquid nitrogen temperature, and automatically tune the SQUID operating parameters. The built-in tuning algorithm finds the best settings for the positive polarity bias current value (Ib+), the negative polarity bias current value (Ib-), the flux modulation current amplitude, and the skew parameter. The skew parameter corrects the flux modulation signal to account for flux applied to the SQUID by the bias current. The front panel display indicates the values of these four parameters as percentages of their full-scale values. The bias current parameters have full-scale values of approximately 250 pA, and the modulation drive has a maximum value of 25 uA. All parameters are set to a resolution of 1 part in 256. Table 2 shows the nominal values of the SQUID parameters that resulted in optimal performance of the magnetometers used during this investigation.
TABLE 2. TYPICAL OPERATING PARAMETERS FOR THE SQUID MAGNETOMETERS
Magnetometer Ib+ (%) (%)
Modulation (%)
Skew (%)
Tune Voltage (V)
1 17 15 19 9 1.9 2 8 8 19 98 3.3 3 13 14 10 4 0.98
GENERAL OBSERVATIONS ON SENSOR PERFORMANCE
Typically, the sensor operated reliably and reproducibly over the 4 mo that it was tested. The autotuning algorithm consistently found the best operating parameters for the channel 1 and channel 2 magnetometers almost every time that the sensor was thermally cycled. The algorithm
APPROVED FOR Pl'iy t RELEASE; DISTRIBUTi IS UNLIMITED
CSS/TR-97/16
consistently had trouble finding the best parameters for the channel 3 magnetometer, in that it kept setting either the positive or negative bias current value to zero. Manual adjustment of channel 3 parameters usually resulted in more symmetric bias current values with more optimized V-O amplitude in the SETUP mode. It is speculated that the channel 3 magnetometer I-V curve may have a somewhat different shape than the other channels' magnetometers, resulting in the algorithm having difficulty finding the proper parameters. Incidentally, channel 3 also had higher white noise than the other two channels (see section entitled WHITE NOISE MEASUREMENTS).
The magnetometers were generally run with a gain of xlOO so that the FLL would operate on the range that had the lowest noise and highest sensitivity. Exceptions to this were made when conducting experiments with large magnetic field ramps, in which case a large dynamic range was desired. The slew rate setting was always set to NORMAL for the measurements reported in this document. Generally, unless otherwise stated, all measurements were made without low pass filtering.
The built-in heaters in the magnetometer buttons were useful and necessary for breaking up circulating currents in the magnetometers. Any time the probe was moved from a magnetically shielded environment into the Earth's field or vice versa, large circulating currents induced in the pickup loops and SQUID washers would wash out the V-O curves of the magnetometers. Thermally cycling them in the new environment would restore the V-O modulation depth to its normal value.
The magnetometers would typically tune up in the Earth's magnetic field in the ambient RFI environment to tuning voltages within 10 or 20 percent of the tuning voltages obtained in a fully shielded environment. They would operate in FLL mode easily, and white noise levels were comparable to shielded measurement results as will be shown quantitatively in a later section of this report.
To ensure the sensor operated at its lowest noise level, it was found that the sensor should have plenty of time to reach thermal stability. It was important to give the probe a full day to stabilize after its initial cool down and allow time for the dewar to settle down after moving the sensor from one location to another. The best results obtained in this investigation generally came after allowing the probe to settle overnight after moving it.
MAGNETOMETER CALIBRATIONS
Each magnetometer delivered with the sensor came complete with a report of Conductus laboratory test results. The test report included the number of volts output per O0 of applied flux (the voltage/flux transfer function) for a gain setting of x 100 with the iMAG® electronics, and
APPROVED FOR PUBLiv RELEASE DISTRIBUTE, IS UNLIMITED
CSS/TR-97/16
the magnetic field-to-flux conversion efficiency, B^, in terms of nT per O0. Dividing the B0
value by the voltage/flux transfer function value gives the magnetic field calibration in terms of nT/V. Experiments were performed at CSS to verify the Conductus test results.
To measure the voltage/flux transfer function, the probe and dewar were set up inside a single-layer, u-metal cylinder, having a u-metal bottom, in the RFI shield room in the laboratory building. The SQUID controller was operated on battery power inside the RFI shield room. The magnetometers were thermally cycled and tuned up and then were operated in FLL mode. The low pass filter was set to 5 Hz to aid in reading the controller's digital display of the locked-up output voltage. A gain setting of x 100 was used to obtain maximum sensitivity and to match the setting used in the Conductus test.
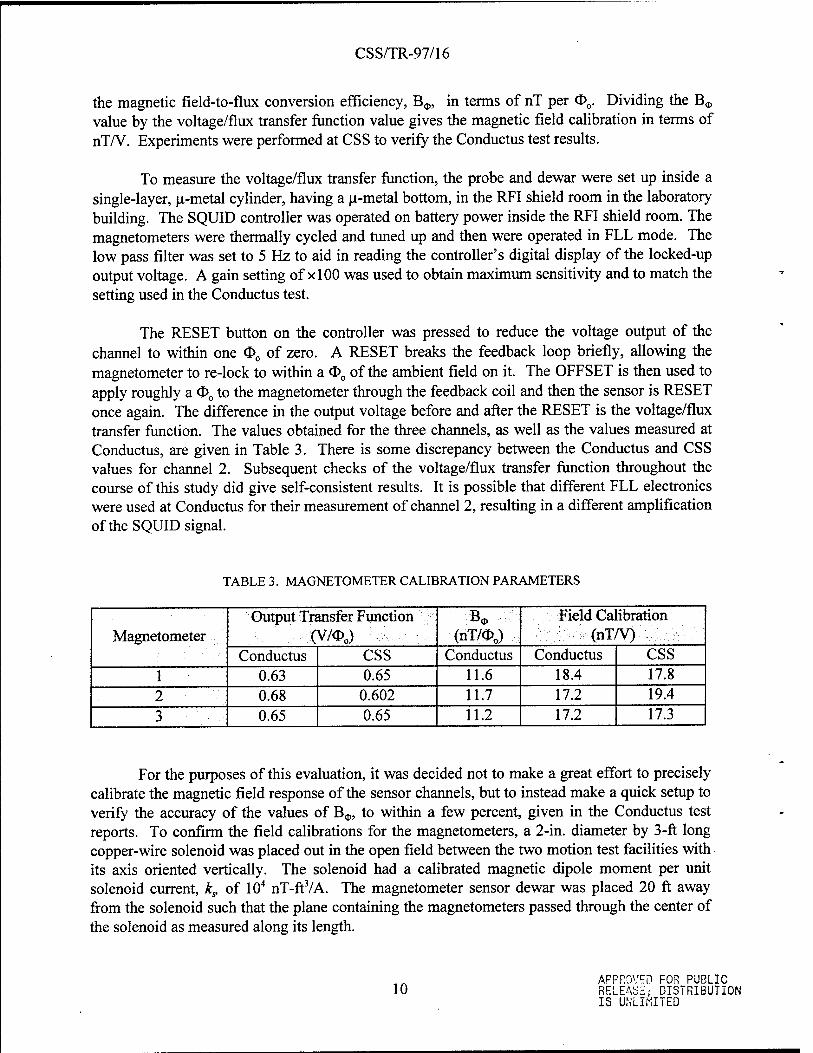
The RESET button on the controller was pressed to reduce the voltage output of the channel to within one <J>0 of zero. A RESET breaks the feedback loop briefly, allowing the magnetometer to re-lock to within a O0 of the ambient field on it. The OFFSET is then used to apply roughly a O0 to the magnetometer through the feedback coil and then the sensor is RESET once again. The difference in the output voltage before and after the RESET is the voltage/flux transfer function. The values obtained for the three channels, as well as the values measured at Conductus, are given in Table 3. There is some discrepancy between the Conductus and CSS values for channel 2. Subsequent checks of the voltage/flux transfer function throughout the course of this study did give self-consistent results. It is possible that different FLL electronics were used at Conductus for their measurement of channel 2, resulting in a different amplification of the SQUID signal.
TABLE 3. MAGNETOMETER CALIBRATION PARAMETERS
Magnetometer Output Transfer Function
(V/<D0) B<j,
(nT/<P0) Field Calibration
(nT/V) Conductus CSS Conductus Conductus CSS
1 0.63 0.65 11.6 18.4 17.8 2 0.68 0.602 11.7 17.2 19.4 3 0.65 0.65 11.2 17.2 17.3
For the purposes of this evaluation, it was decided not to make a great effort to precisely calibrate the magnetic field response of the sensor channels, but to instead make a quick setup to verify the accuracy of the values of B,,,, to within a few percent, given in the Conductus test reports. To confirm the field calibrations for the magnetometers, a 2-in. diameter by 3-ft long copper-wire solenoid was placed out in the open field between the two motion test facilities with its axis oriented vertically. The solenoid had a calibrated magnetic dipole moment per unit solenoid current, k^ of 104 nT-ft3/A. The magnetometer sensor dewar was placed 20 ft away from the solenoid such that the plane containing the magnetometers passed through the center of the solenoid as measured along its length.
10 APPROVED FOR PUBLIC RELEASE DISTRIBUTION IS UNLIMITED

CSS/TR-97/16
The magnetic field, B(r), at a radial distance r from the solenoid center, with the solenoid carrying a current /, is given by
r
A 2-Hz, sinusoidal current with a peak-to-peak (p-p) amplitude of 0.08 A was supplied to the solenoid so that a magnetic field of 0.1 nT p-p amplitude was generated at the magnetometers 20 ft away. The peak amplitude of the 2-Hz signal measured by a locked-up magnetometer was determined using an HP 3 5 62A signal analyzer. For the channel 3 magnetometer with a gain setting of x 100, the measured peak amplitude was 3 mV for the 2 Hz signal, which is 6 mVp-p. Multiplying the 6 mV p-p by the field calibration for magnetometer 3 of 17.3 nT/V gives a field value of 0.1038 nT p-p. So, the calibration obtained in this experiment is within 3.8 percent of the Conductus test value, which is reasonable given the experimental uncertainties. The other channels checked out similarly. The Conductus measured values of B0 are tabulated in Table 3 along with Conductus and CSS field calibration values obtained by dividing the B<j, values by their corresponding voltage/flux transfer function values.
The effective area of a magnetometer can be computed from its B<j, value. For example, taking the channel 1 B^ value of 11.6 nT/O0 and dividing by 2.07 x 10"15 webers/O0 gives 5.6 x 106 m*2, which is the reciprocal of the effective area. Therefore, magnetometer 1 has an effective area of 0.178 mm2.
WHITE NOISE MEASUREMENTS
Magnetically and RFI Shielded
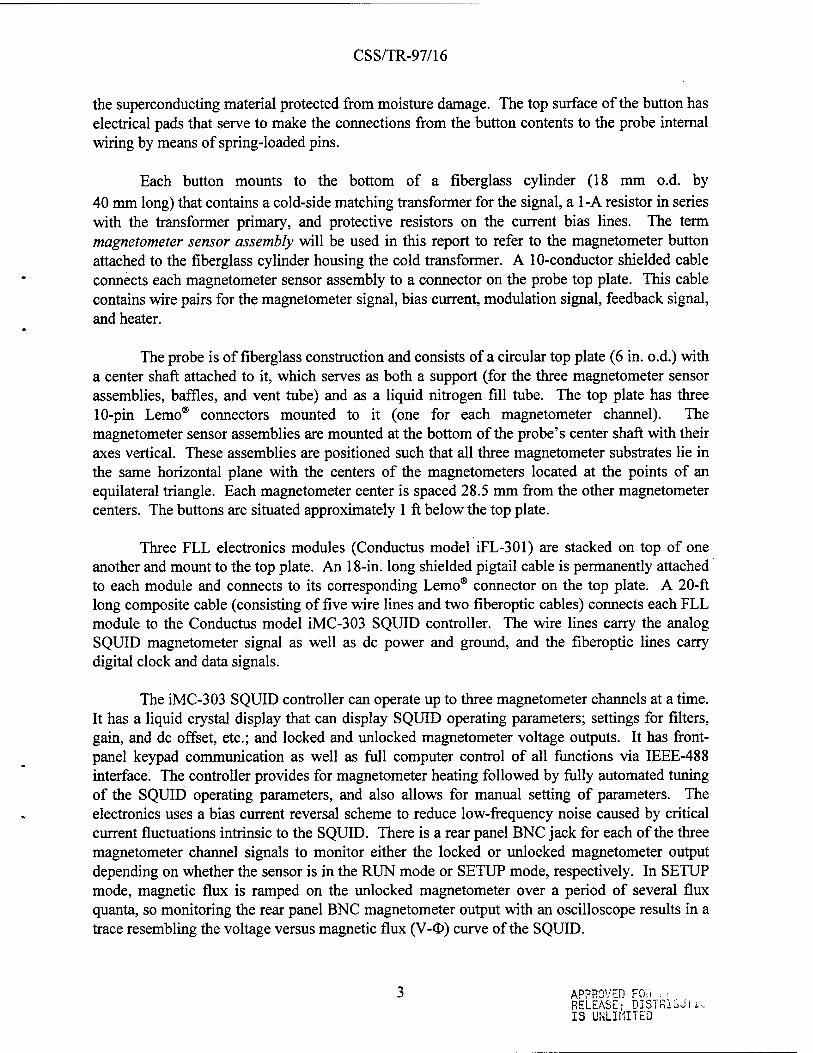
The white noise level of each sensor was measured with the sensor dewar placed inside of a p.- metal cylinder that had a u-metal bottom, which in turn was placed in the RFI shield room. The magnetometers were thermally cycled, tuned to their optimal operating parameters, and then operated in FLL mode. A typical white noise spectrum measured in this configuration with the HP 3562A signal analyzer is shown in Figure 2, which is a plot of the data for the channel 1 magnetometer. Channel 1 had a white noise level of 4.4 ii<$>JHzm, which (multiplying by B0
from Table 3) is equivalent to 51 fT/Hz1/2. The electronics passband begins to roll off around 20 kHz. Values for the white noise levels measured at CSS and from the Conductus tests of all three channels are given in Table 4 in various commonly used units. Channel 2 had the lowest white noise level of the three magnetometer channels, consistently measuring only 3.1 (xO0/Hz1/2
(36 fT/Hz1/2) in measurements performed at CSS.
APPPOVED FOR PUBLIC RELEASE; DISTRIBUTION
11 IS UNLIMITED

CSS/TR-97/16
o
u. -df
c
<D CO
3 2 o u- > "So r" ö> 2 £ *
2f t = o
*- s / "N*
c E 1 i 2 X I >.
-
o c o 3
0) C <D •^" 1 i-
(/) t U_
m j _ O
t—
- jf Q
/ N
/ e / zL
II f\ i i i Im 11 i i i IM ii i i i i 1 ii m CM
«• m tp t^ » ö O O O O ^ T- T— T— l-
(Z/1ZH/8UUA) Aisuea |BJ»oads
FIGURE 2. WHITE NOISE OF CHANNEL 1 WHEN SHIELDED FROM DC MAGNETIC FIELDS AND RFI
APPROVED FC.<.. 12 RELEASE; plj>i
IS UNLIMHEÜ
CSS/TR-97/16
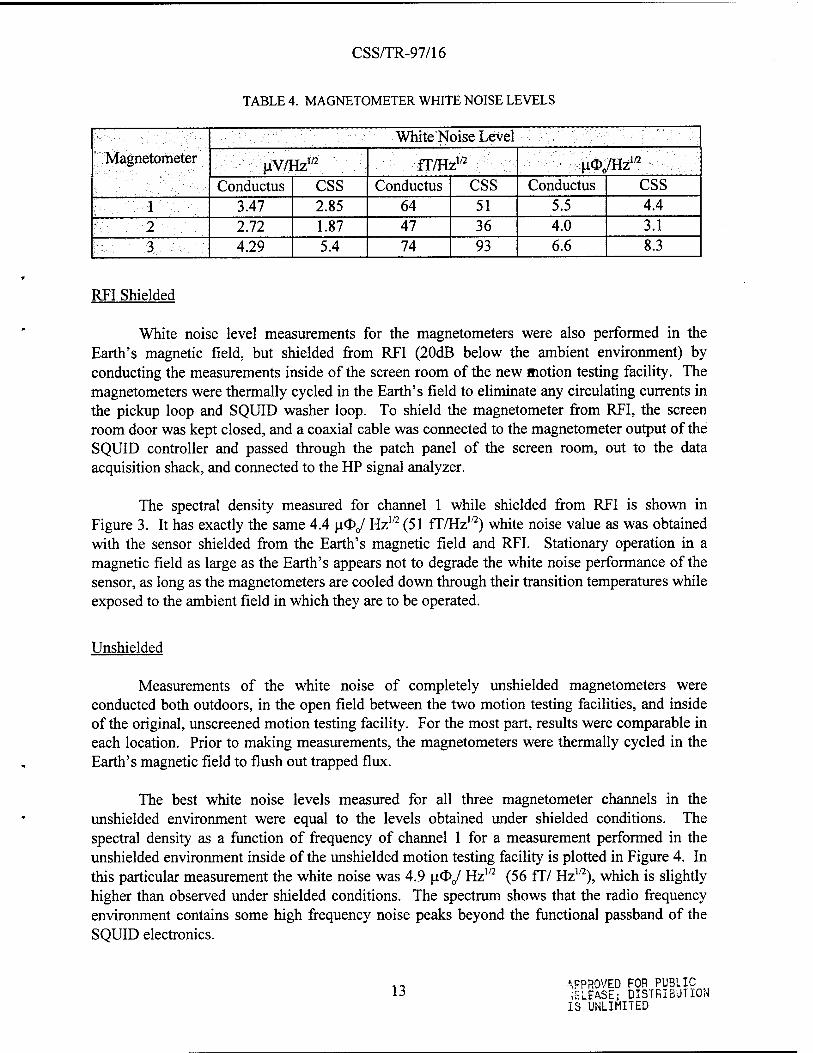
TABLE 4. MAGNETOMETER WHITE NOISE LEVELS
Magnetometer White Noise Level
uV/Hzw ; fI7HzI/2 u<D0/Hz!/2
Conductus CSS Conductus CSS Conductus CSS 1 3.47 2.85 64 51 5.5 4.4 2 2.72 1.87 47 36 4.0 3.1 3 4.29 5.4 74 93 6.6 8.3
RFI Shielded
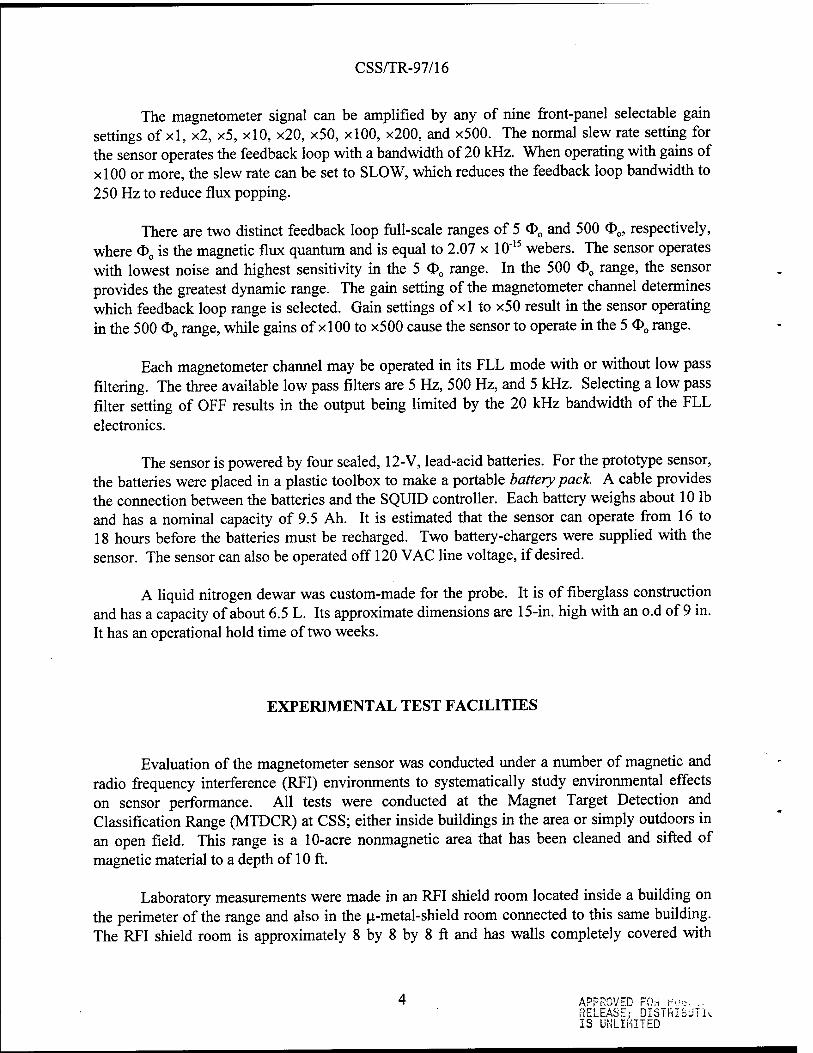
White noise level measurements for the magnetometers were also performed in the Earth's magnetic field, but shielded from RFI (20dB below the ambient environment) by conducting the measurements inside of the screen room of the new motion testing facility. The magnetometers were thermally cycled in the Earth's field to eliminate any circulating currents in the pickup loop and SQUID washer loop. To shield the magnetometer from RFI, the screen room door was kept closed, and a coaxial cable was connected to the magnetometer output of the SQUID controller and passed through the patch panel of the screen room, out to the data acquisition shack, and connected to the HP signal analyzer.
The spectral density measured for channel 1 while shielded from RFI is shown in Figure 3. It has exactly the same 4.4 \i<£>J Hz1/2 (51 fT/HzI/2) white noise value as was obtained with the sensor shielded from the Earth's magnetic field and RFI. Stationary operation in a magnetic field as large as the Earth's appears not to degrade the white noise performance of the sensor, as long as the magnetometers are cooled down through their transition temperatures while exposed to the ambient field in which they are to be operated.
Unshielded
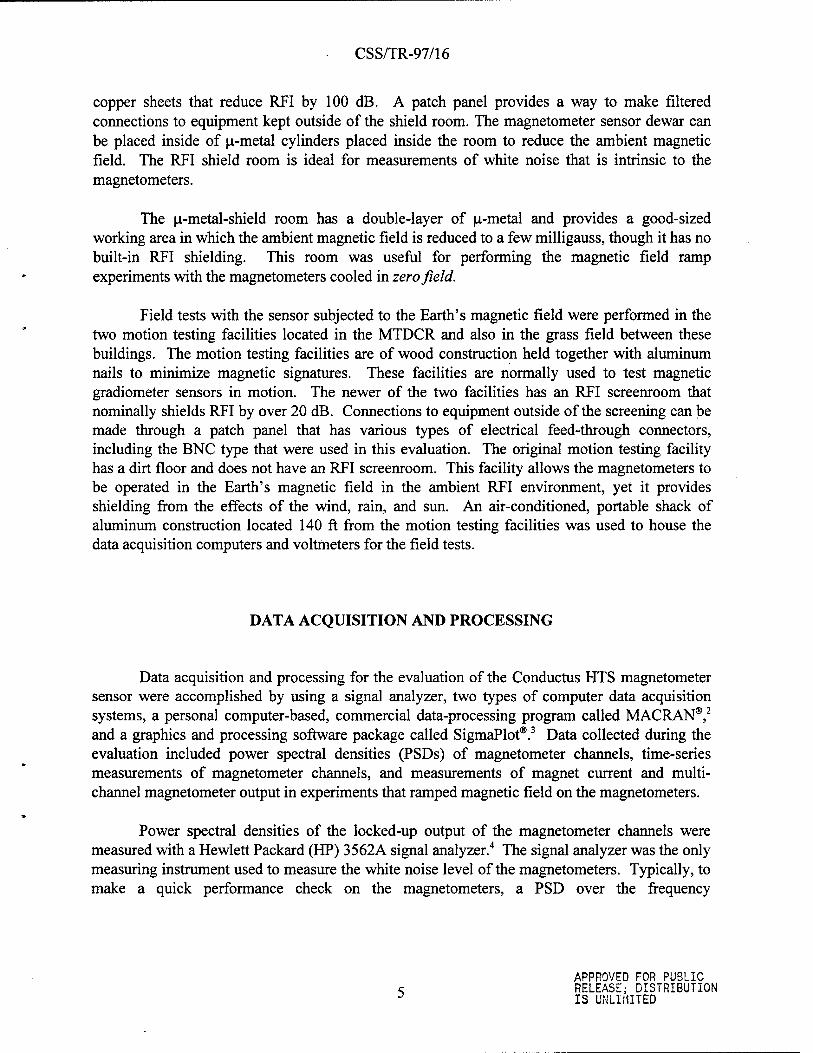
Measurements of the white noise of completely unshielded magnetometers were conducted both outdoors, in the open field between the two motion testing facilities, and inside of the original, unscreened motion testing facility. For the most part, results were comparable in each location. Prior to making measurements, the magnetometers were thermally cycled in the Earth's magnetic field to flush out trapped flux.
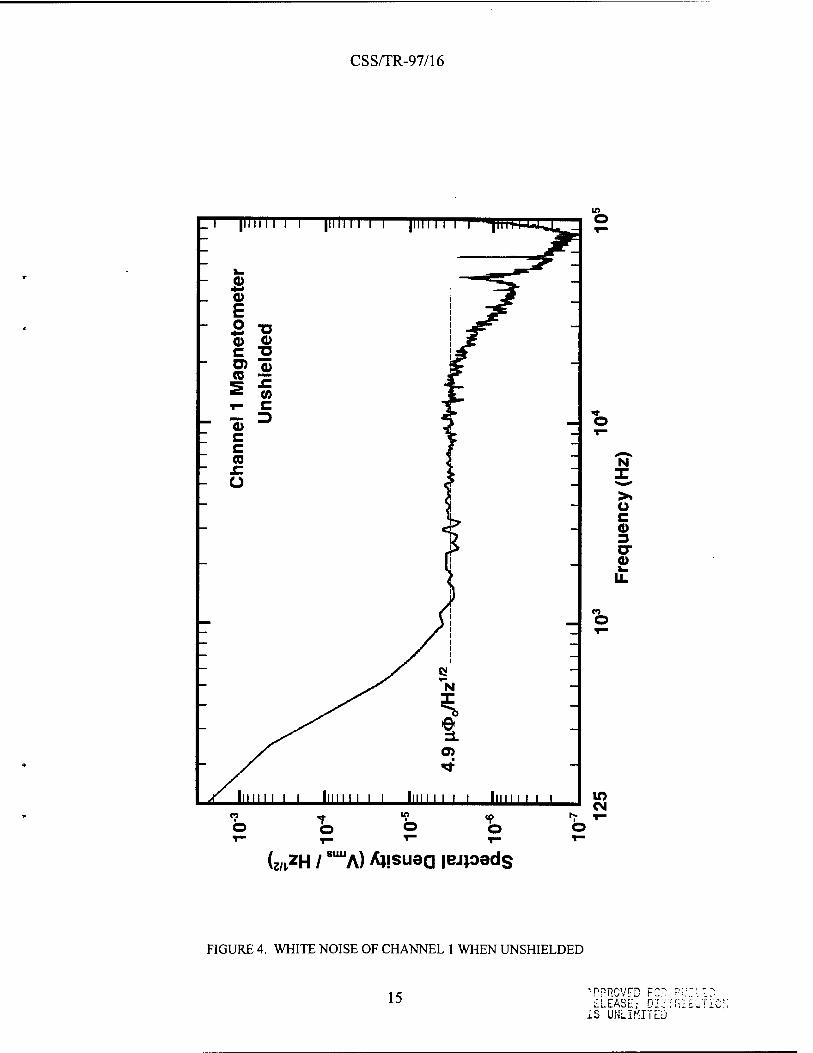
The best white noise levels measured for all three magnetometer channels in the unshielded environment were equal to the levels obtained under shielded conditions. The spectral density as a function of frequency of channel 1 for a measurement performed in the unshielded environment inside of the unshielded motion testing facility is plotted in Figure 4. In this particular measurement the white noise was 4.9 |iO0/ Hz1/2 (56 fT/ Hz1/2), which is slightly higher than observed under shielded conditions. The spectrum shows that the radio frequency environment contains some high frequency noise peaks beyond the functional passband of the SQUID electronics.
13 APPROVED FOR PUBLIC iELEASE; DISTRIBUTION IS UNLIMITED

CSS/TR-97/16
_ 1 ~F UN 1 T—|lllll 1 1 i |iim44^L III 11 II 1 T~Z
i_ ^L
- 0) *-* 0>
-
E o
Li-
0) c E o (0
75
0) ■o 0>
_ c £ _ - c (/> - _ (0 _
- O
j -
— —
- £i
-
1—
- N X
-
- ^b —
" <*
■
<* Inn i i i Inn i i i i
in O
'S-
O
N I > O c 3 o-
CO
©
o ? O
in ■ o
in CM
o
(Z/.ZH/ SUUA) A^isuea lejpeds
FIGURE 3. WHITE NOISE OF CHANNEL 1 WHEN SHIELDED FROM RFI
14 ^PROVED F03 PUBLIC iLEASE; DISTRIE'JTJ
iS UNLIMITED
CSS/TR-97/16
TT—IIIIIII 1 I11 111 i |H4-W-ULJ
1 i
i
i
i i
*l 1
Mag
net
om
eter
Un
shie
lded
Sr
i
i
i
i
i i
11
Cha
nn«
n ii
-
^ /I 11 11
/1 s i S i S i / 1 s 1
N X
t
—
" / *t —
/ IIIIIII I I Im HUj L- JlU -J"
o
N
O c o 3 or o
O
7 O
in
o o o
m CM
U2H / SUUA) Ajisuarj lejpads
FIGURE 4. WHITE NOISE OF CHANNEL 1 WHEN UNSHIELDED
15 PLEASE; oi'zi IS UNLIMITED
CSS/TR-97/16
Over the course of this investigation, it was generally observed that a greater variation in the measured noise levels and tuning voltages occurred for the experiments performed in the unshielded environment than in the shielded cases. Operation of the sensors in the unshielded environment was generally more unpredictable and instances were encountered in which the white noise was more than 60 percent greater than usual. It is difficult to control all of the factors affecting the environment of the magnetometers in field tests of this sort.
It is believed that cases of reduced performance were caused by variations in the mechanical and temperature stability sometimes present in the unshielded environment, rather than as a direct result of exposure to the RFI environment. Exposure of the probe and dewar to the direct rays of the sun, especially when the dewar had a poor vacuum, probably resulted in temperature instability of the sensors, which caused higher noise. The effect of wind-induced dewar motion could also contribute to sensor temperature variations due to motion transmitted through the probe. It is also speculated that performance degradation could result from exposure of the FLL electronic boxes to the direct sun. The fact that excellent white noise levels were reproducibly achieved in the unshielded environment in several cases during this limited study seems to indicate that the CSS RFI environment does not limit performance of these sensors. It is believed that with the experience gained in this investigation, consistent operation of the magnetometers at their best white-noise levels could be achieved.
LOW-FREQUENCY NOISE MEASUREMENTS
Electronic Gradiometer
It is difficult to measure the intrinsic low-frequency noise of a magnetometer because there is usually some source of environmental noise present regardless of where the magnetometer is located. Two distinct cases of interest are measurement of the intrinsic low- frequency noise in zero magnetic field and in the Earth's magnetic field. Conductus has obtained good zero field results by using a special probe that positions the magnetometer sensor inside a high-Tc superconducting shield surrounded by a small u-metal shield.6 Care is taken to keep vibrations to a minimum, but getting good data about intrinsic noise is still difficult at 0.1 Hz or less.
The problem of determining the intrinsic low-frequency noise becomes even more difficult when making measurements with the magnetometers mounted on the three-sensor probe used in the sensor evaluated here. This probe is not highly stabilized with respect to the dewar and there is no room for internal shielding. If the dewar is placed inside a u-metal shield within a building, there are often vibrations that cause the sensor to move relative to the shield, resulting in significant low-frequency signals. On the other hand, if the sensor is placed in an unshielded, remote location, low-frequency (typically 1 mHz to 1 Hz) geomagnetic signals are present along with the usual 60 Hz and its harmonics.
•5.PPRGVFD FC" r- 1/: ^ELEASc; DISTFV lo 13 UNLIMITED

CSS/TR-97/16
To address these difficulties, Conductus personnel decided to take advantage of the parallel mounting of the magnetometers to remove common-mode noise. They fabricated a custom electronics package to allow the output of two of the parallel magnetometer channels to be electronically subtracted.7 Thus, an electronic gradiometer is formed having a baseline of 28.5 mm, the separation between the centers of two magnetometers. The custom electronics allow the gain of each channel to be adjusted and one channel to be inverted before the signals are summed. The resulting signal has all of the environmental noise signals that are correlated between the two channels removed, leaving only the uncorrelated intrinsic noise, in principle. In practice, there is a limit to the amount of noise cancellation that can be achieved. Since the output of each channel is dominated by 60 Hz, the electronics is adjusted to null this signal to zero as well as possible.
In tests of the magnetometer sensor performed at the Conductus, Sunnyvale, California facility by Conductus personnel prior to the CSS evaluation, an electronic gradiometer was formed using channels 1 and 3 with the electronics described earlier.6 Much of the low- frequency noise of the individual channels was canceled by the electronic gradiometer, proving it to be environmental in origin. For totally unshielded operation at a remote rural location outside of Sunnyvale, the noise-canceled spectral density had a value of about 40 ji0o/Hz1/2
(464 fT/Hz1/2) at 1 Hz, which is somewhat higher than the value of approximately 11 |a®0/Hz1/2
(127 fT/Hz1/2) obtained for a single magnetometer with Conductus' YBCO-shielded probe setup. The electronic gradiometer had a noise level of 80 uO0/Hz1/2 (930 fT/Hz"2) at 1 Hz for unshielded operation in the urban environment of the Conductus facility.
The Conductus subtraction electronics were brought to CSS to reproduce the experiment performed at Conductus. In tests conducted out in the nonmagnetics area, the electronic gradiometer signal formed with the electronics had a noise level of 1200 fT/Hz1/2 at 1 Hz; close to the value for the same measurement performed at the Conductus facility.
Software Noise Cancellation
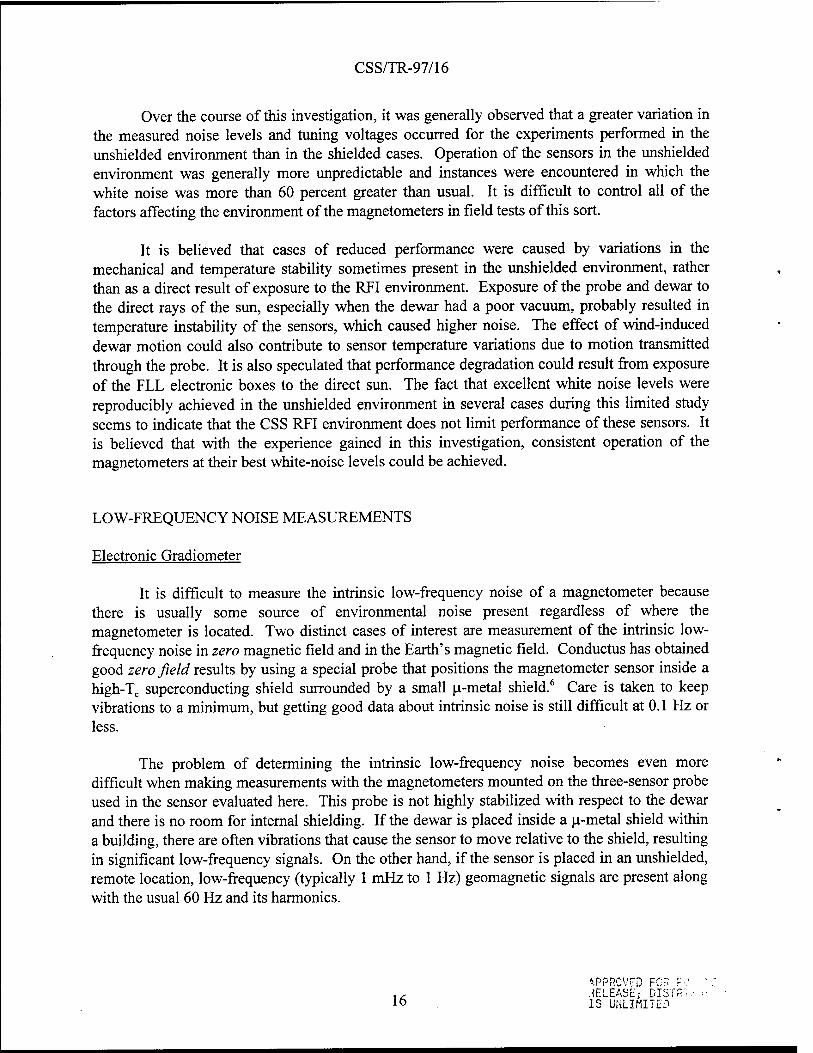
In an attempt to improve upon the cancellation of environmental noise achieved by the electronic gradiometer, a software fitting algorithm was used to perform the subtraction of two magnetometer channels. Synchronized, simultaneous voltage readings were taken on two magnetometer channels of the sensor at a 60-Hz rate and stored for subsequent processing. A commercial software package was used to perform noise cancellation processing on channel pairs.2 An example of the raw output recorded for channels 1 and 2 in an experiment performed inside of the unshielded motion testing facility without any type of magnetic or RFI shielding is shown in Figure 5.
A dc offset is present between the two channels as a result of the practical limitations encountered when zeroing out the output of each channel using the SQUID controller electronics. Of course, as with all SQUID magnetometers, the zero output level does not correspond to an
APPR0VFD FOR FÜHL in
iS UNLIMITED
CSS/TR-97/16
-2.6
-2.7
P S -2.8 IS c g>
2 -29
O -3.0
-3.1 -
-3.2
Channel 2
Channel 1
Unshielded Operation
o 20 40 60 80 100 120 140 160
Time (sec)
FIGURE 5. RAW OUTPUT SIGNALS OF TWO UNSHIELDED MAGNETOMETERS
absolute magnetic field value of zero, but instead corresponds to the ambient field in which the SQUID was locked up, to within the field corresponding to a flux quantum. All SQUID magnetometer readings are relative to the ambient field present at the time the FLL is activated.
Comparison of simultaneous readings of each channel as a function of time shows an extremely high degree of correlation between them (see Figure 5). Close examination of the plots on a point-by-point level reveals just how closely the channel-to-channel correlation tracks. The correlated signal observed shows the variation of geomagnetic and other environmental signals imposed on the magnetometers over time. It is clear that an offset and a scale factor could be chosen and applied to the channel 2 data so that when it was subtracted from the channel 1 data all of the correlated signal would be removed, leaving only the uncorrelated portion of the signal. Likewise, PSDs of the individual channel's time-series data could be computed, and a frequency domain cancellation procedure could be performed to remove the correlated signals.
18 «^PROVED FOR PÜGL. -iE' E-\St; DISTRibu IS"UNLIMITED

CSS/TR-97/16
The MACRAN® signal processing software package used in this evaluation has a built-in routine that operates in the frequency domain to cancel noise that is correlated between channels. Figure 6 shows a MACRAN®-computed PSD of the raw channel 1 data from Figure 5, as well as
10-3
c Q IQ"6 fc-
0)
? 10-'
I
10-9
-i 1 1 1—i—i—r—r~ i i 1 r-"""i—r- i i r—*i—i—i i i I
UNSHIELDED OPERATION
CHANNEL 1 - RAW
CHANNEL 1 NOISE-CANCELED WITH CHANNEL 2
-I I I I, J_ _j i i—1_
0.1 1 10
Frequency (Hz)
10-6
£ 10-7 ~o e
10-8 g
1
10-9 w
I Q.
10-'
10-11
100
FIGURE 6. POWER SPECTRAL DENSITIES OF RAW UNSHIELDED CHANNEL 1 OUTPUT AND WHEN NOISE-CANCELED WITH CHANNEL 2
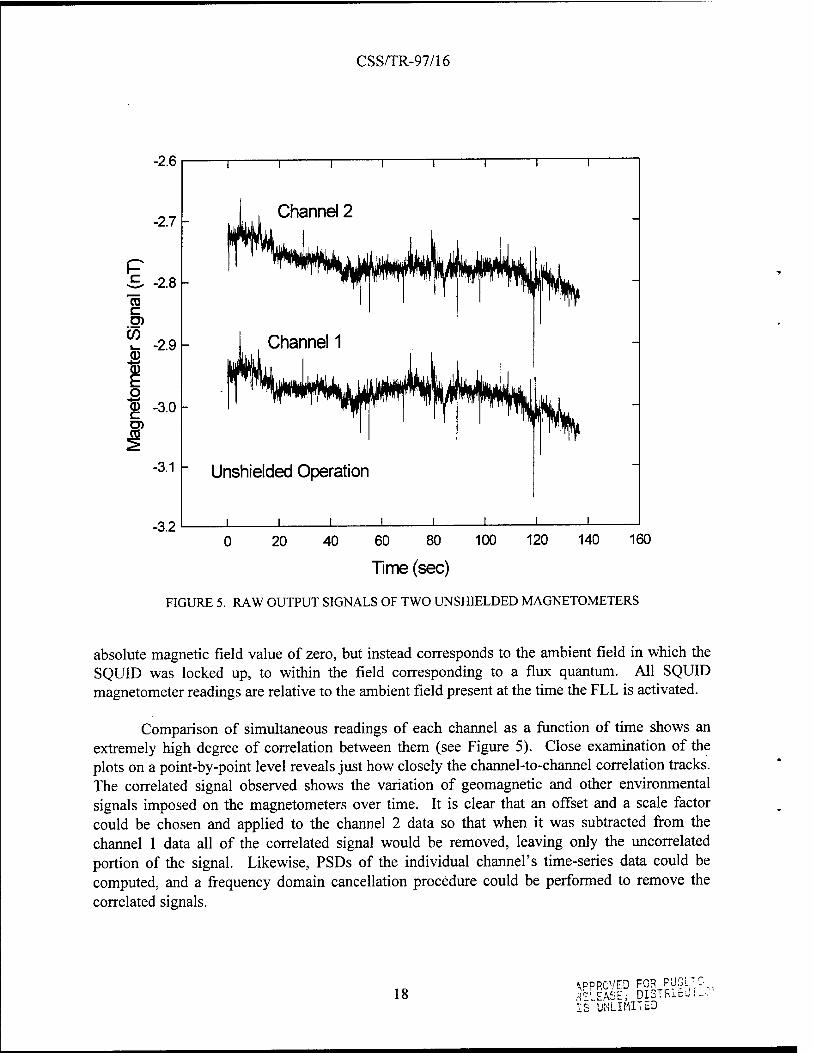
a PSD of the channel 1 output noise-canceled with the channel 2 output using the MACRAN® canceling routine. The large, sharp peaks present in the raw spectrum are absent in the noise- canceled data, and the overall noise level is dramatically lower. The noise-canceled spectrum has white noise down to a frequency of about 7 Hz. For convenience, the data are replotted as spectral densities in field and flux units in Figure 7. The white noise level of the noise-canceled data is approximately 6 (iO0/Hz1/2, which is roughly the value expected if the uncorrelated white noise of the two channels is added together in quadrature.
19 APPROVED FOR FUGL" RELF^'c; DISTRIEJ! iC: IS UNLIMITED
CSS/TR-97/16
10-'
10"2 r
N X
c
55 10
o <D o.
CO
■3 _
10-4
io-;
T
UNSHIELDED OPERATION
CHANNEL 1 - RAW
CHANNEL 1 NOISE-CANCELED WITH CHANNEL 2
10":
N I
e 10-4 £
-. io-!
in c (D Q
u V a
CO
10-6
0.1 10 100
Frequency (Hz)
FIGURE 7. SPECTRAL DENSITIES OF CHANNEL 1 OUTPUT WITH AND WITHOUT NOISE-CANCELING
Long-Term Sensor Performance
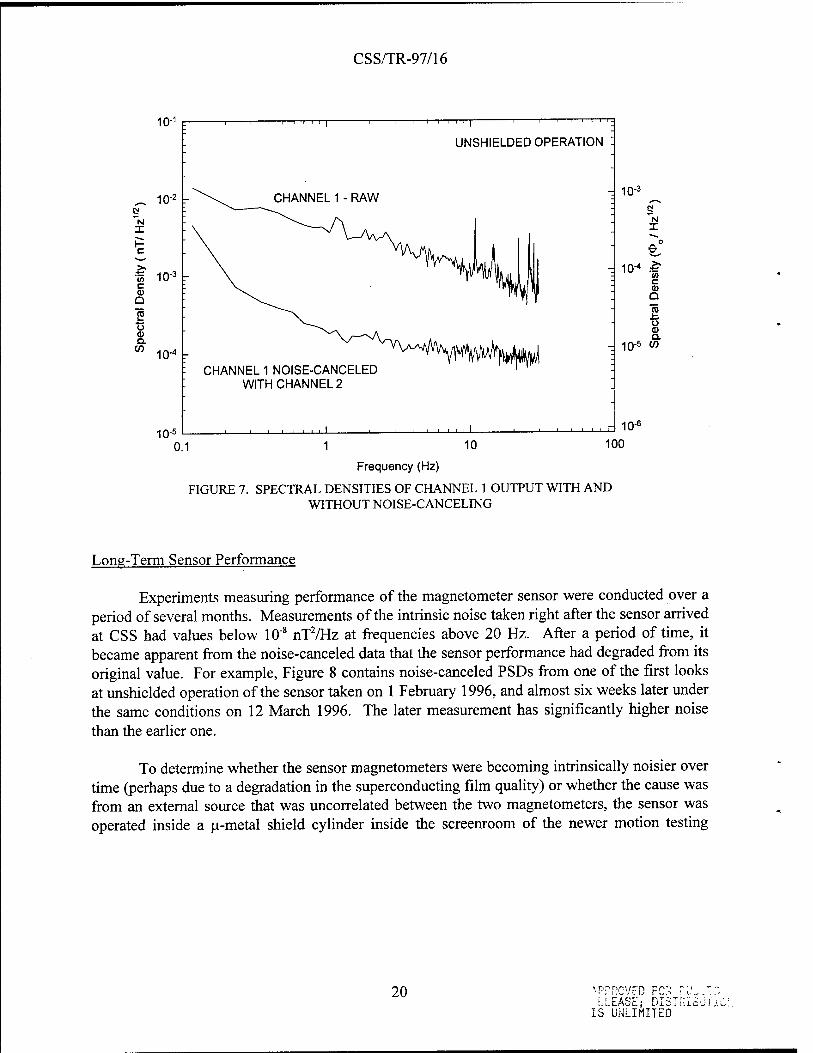
Experiments measuring performance of the magnetometer sensor were conducted over a period of several months. Measurements of the intrinsic noise taken right after the sensor arrived at CSS had values below 10'8 nT2/Hz at frequencies above 20 Hz. After a period of time, it became apparent from the noise-canceled data that the sensor performance had degraded from its original value. For example, Figure 8 contains noise-canceled PSDs from one of the first looks at unshielded operation of the sensor taken on 1 February 1996, and almost six weeks later under the same conditions on 12 March 1996. The later measurement has significantly higher noise than the earlier one.
To determine whether the sensor magnetometers were becoming intrinsically noisier over time (perhaps due to a degradation in the superconducting film quality) or whether the cause was from an external source that was uncorrelated between the two magnetometers, the sensor was operated inside a u-metal shield cylinder inside the screenroom of the newer motion testing
20 'PPRCVFD FC":;
IS UNLIMITED
CSS/TR-97/16
10-4
N I 10-5
CM
I- c
w 10-6
C ' 0 Q
"S io-7
0) Q.
CO
0
I 10 D-
•8 _
10-'
-i 1 r- i ill—i i i i
0.1
UNSHIELDED OPERATION
NOISE CANCELED PSDs
CHANNEL 1-CHANNEL 2
12 MAR 96
1 FEB 96 .
_i i i i i_j_ ' iii i i i_i ■ i i i i i
1 10
Frequency(Hz) FIGURE 8. SENSOR PERFORMANCE DEGRADATION
100
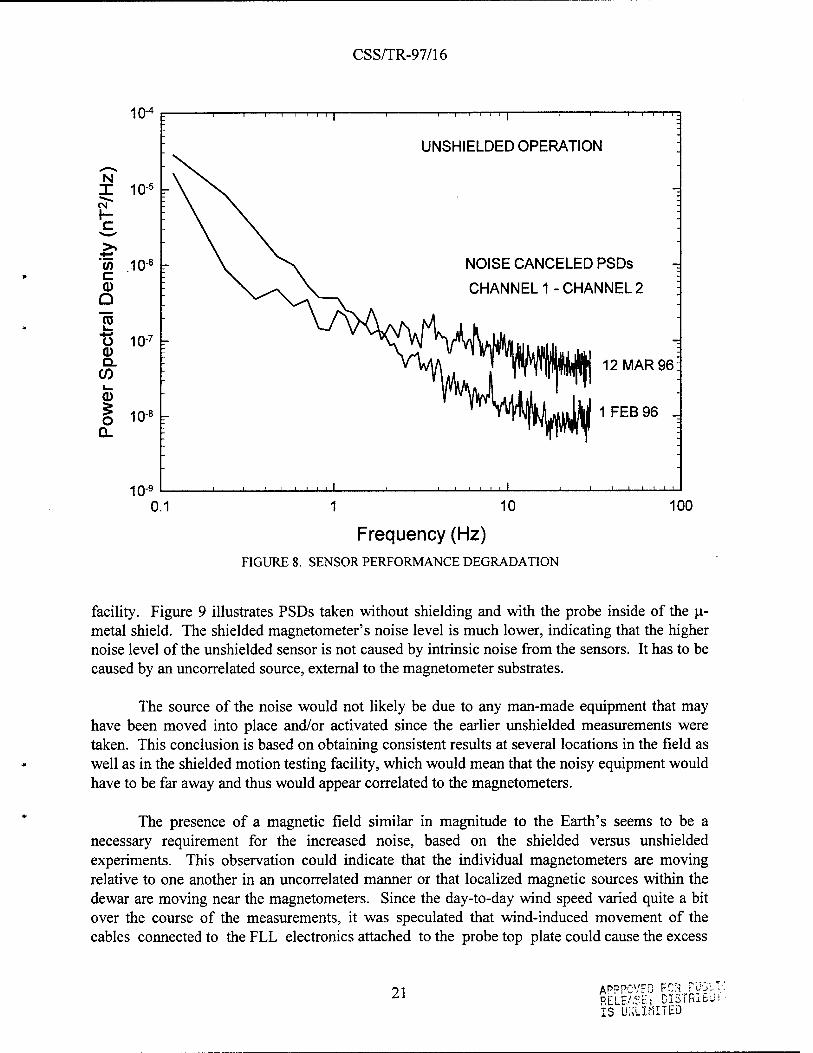
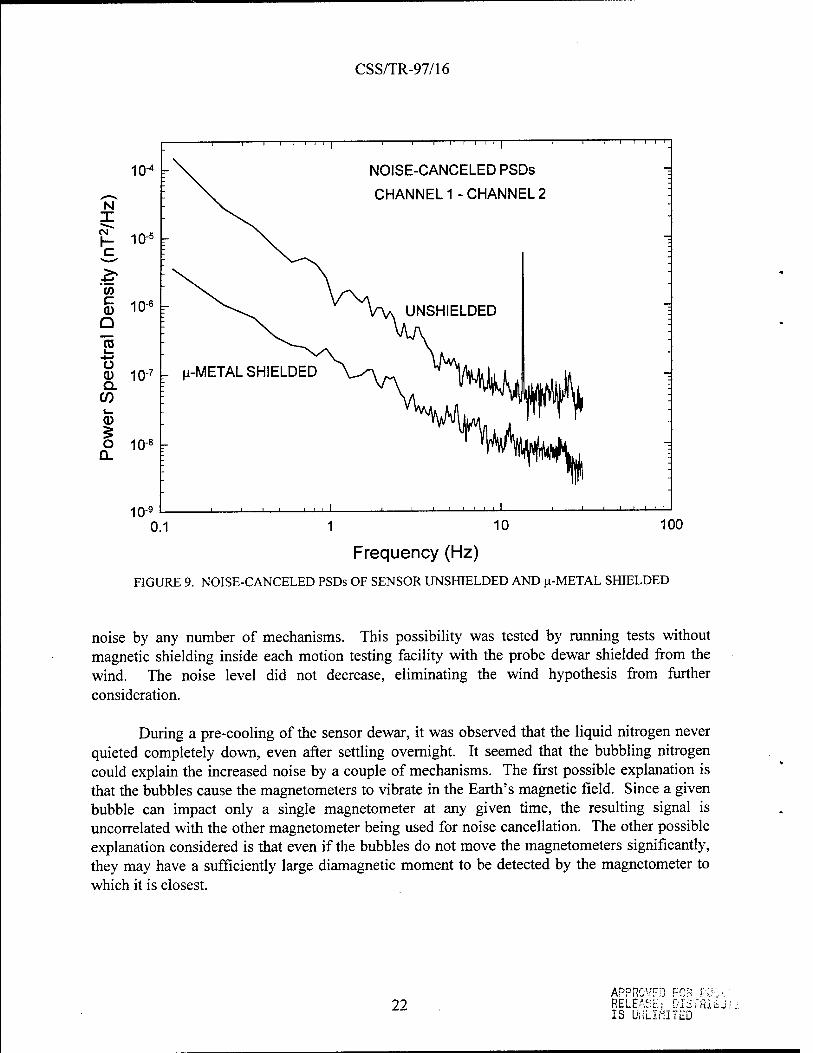
facility. Figure 9 illustrates PSDs taken without shielding and with the probe inside of the u- metal shield. The shielded magnetometer's noise level is much lower, indicating that the higher noise level of the unshielded sensor is not caused by intrinsic noise from the sensors. It has to be caused by an uncorrelated source, external to the magnetometer substrates.
The source of the noise would not likely be due to any man-made equipment that may have been moved into place and/or activated since the earlier unshielded measurements were taken. This conclusion is based on obtaining consistent results at several locations in the field as well as in the shielded motion testing facility, which would mean that the noisy equipment would have to be far away and thus would appear correlated to the magnetometers.
The presence of a magnetic field similar in magnitude to the Earth's seems to be a necessary requirement for the increased noise, based on the shielded versus unshielded experiments. This observation could indicate that the individual magnetometers are moving relative to one another in an uncorrelated manner or that localized magnetic sources within the dewar are moving near the magnetometers. Since the day-to-day wind speed varied quite a bit over the course of the measurements, it was speculated that wind-induced movement of the cables connected to the FLL electronics attached to the probe top plate could cause the excess
21 APPPCVFD FC::! PUbt RELEASE; DIäTRIb'. IS UiiLIrtlTED
CSS/TR-97/16
N X
c
(0 c 0) Q
o (D 10"7
QL CO
0
o Q_
10-*
10"!
io-(
io-(
10!
—I 1 1—I—I—I I I I
NOISE-CANCELED PSDs
CHANNEL 1-CHANNEL 2
-i 1 1 1—i—i—r
UNSHIELDED
^ u-METAL SHIELDED
_J I I L. _J I I I t_L
0.1 1 10
Frequency (Hz)
FIGURE 9. NOISE-CANCELED PSDs OF SENSOR UNSHIELDED AND |i-METAL SHIELDED
100
noise by any number of mechanisms. This possibility was tested by running tests without magnetic shielding inside each motion testing facility with the probe dewar shielded from the wind. The noise level did not decrease, eliminating the wind hypothesis from further consideration.
During a pre-cooling of the sensor dewar, it was observed that the liquid nitrogen never quieted completely down, even after settling overnight. It seemed that the bubbling nitrogen could explain the increased noise by a couple of mechanisms. The first possible explanation is that the bubbles cause the magnetometers to vibrate in the Earth's magnetic field. Since a given bubble can impact only a single magnetometer at any given time, the resulting signal is uncorrelated with the other magnetometer being used for noise cancellation. The other possible explanation considered is that even if the bubbles do not move the magnetometers significantly, they may have a sufficiently large diamagnetic moment to be detected by the magnetometer to which it is closest.
22 IS UNLIMITED
CSS/TR-97/16
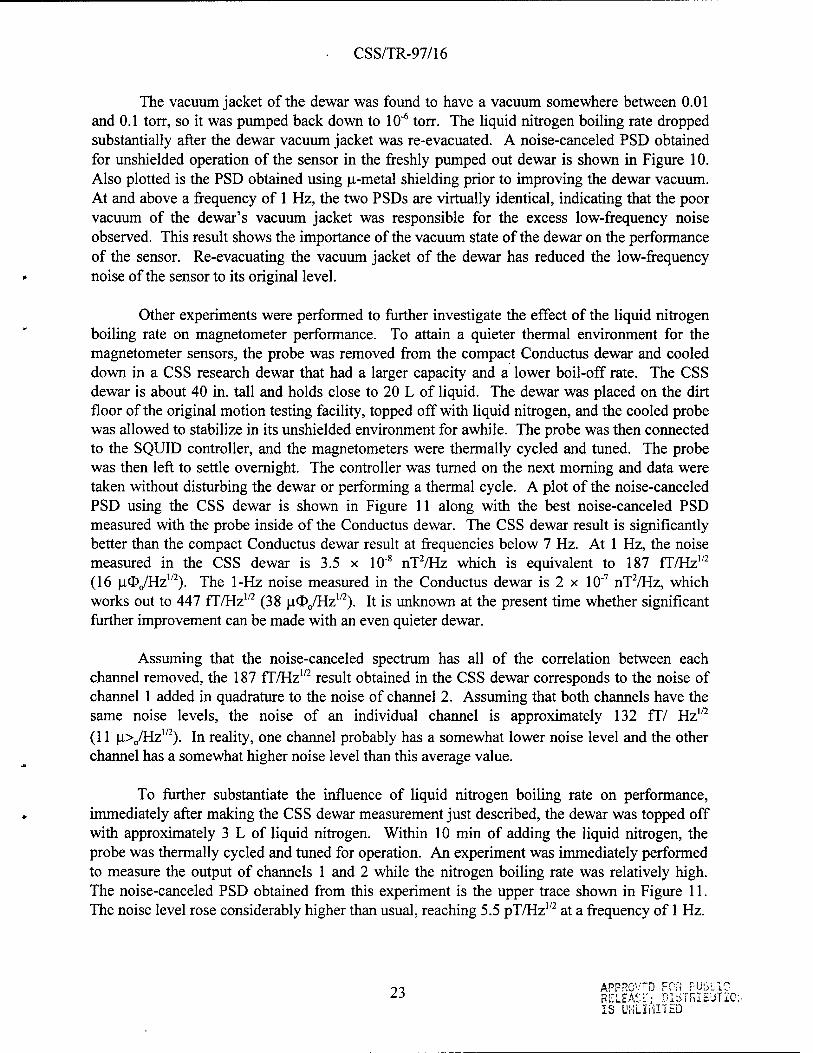
The vacuum jacket of the dewar was found to have a vacuum somewhere between 0.01 and 0.1 torr, so it was pumped back down to 10"6 ton. The liquid nitrogen boiling rate dropped substantially after the dewar vacuum jacket was re-evacuated. A noise-canceled PSD obtained for unshielded operation of the sensor in the freshly pumped out dewar is shown in Figure 10. Also plotted is the PSD obtained using u-metal shielding prior to improving the dewar vacuum. At and above a frequency of 1 Hz, the two PSDs are virtually identical, indicating that the poor vacuum of the dewar's vacuum jacket was responsible for the excess low-frequency noise observed. This result shows the importance of the vacuum state of the dewar on the performance of the sensor. Re-evacuating the vacuum jacket of the dewar has reduced the low-frequency noise of the sensor to its original level.
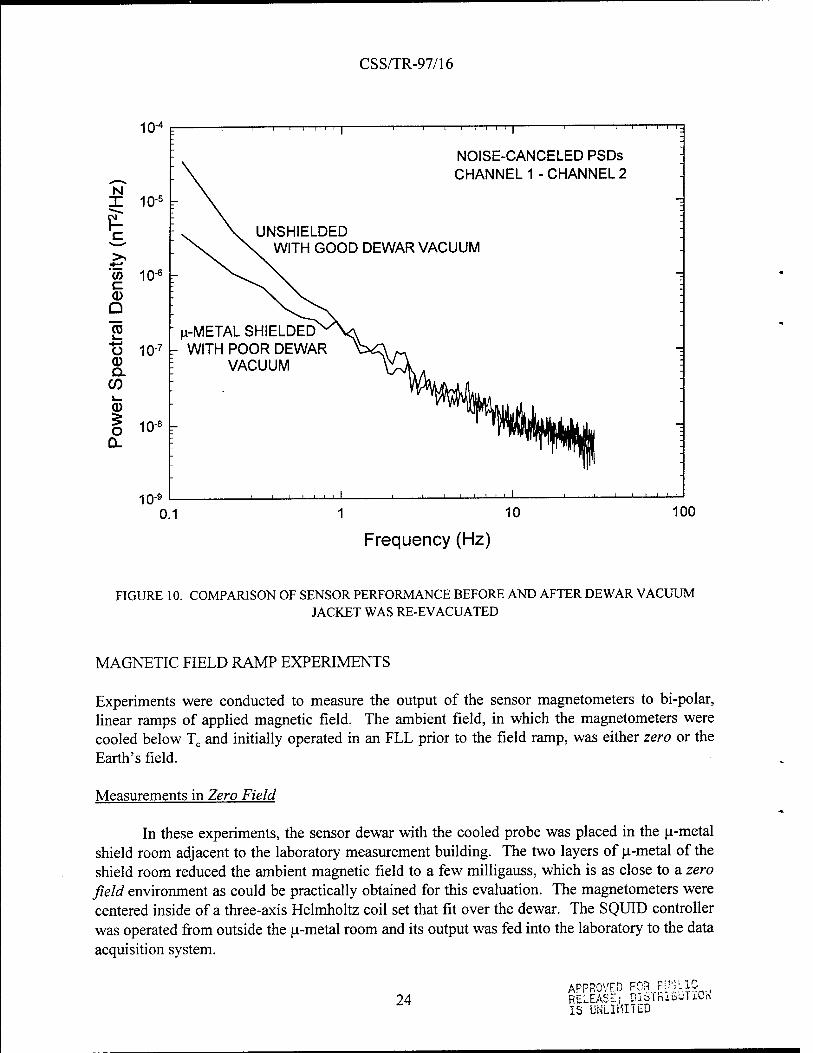
Other experiments were performed to further investigate the effect of the liquid nitrogen boiling rate on magnetometer performance. To attain a quieter thermal environment for the magnetometer sensors, the probe was removed from the compact Conductus dewar and cooled down in a CSS research dewar that had a larger capacity and a lower boil-off rate. The CSS dewar is about 40 in. tall and holds close to 20 L of liquid. The dewar was placed on the dirt floor of the original motion testing facility, topped off with liquid nitrogen, and the cooled probe was allowed to stabilize in its unshielded environment for awhile. The probe was then connected to the SQUID controller, and the magnetometers were thermally cycled and tuned. The probe was then left to settle overnight. The controller was turned on the next morning and data were taken without disturbing the dewar or performing a thermal cycle. A plot of the noise-canceled PSD using the CSS dewar is shown in Figure 11 along with the best noise-canceled PSD measured with the probe inside of the Conductus dewar. The CSS dewar result is significantly better than the compact Conductus dewar result at frequencies below 7 Hz. At 1 Hz, the noise measured in the CSS dewar is 3.5 x 10s nT2/Hz which is equivalent to 187 fT/Hz"2
(16 ji00/Hz1/2). The 1-Hz noise measured in the Conductus dewar is 2 x 10"7 nT2/Hz, which works out to 447 fT/Hz1/2 (38 \x<I>JE.zm). It is unknown at the present time whether significant further improvement can be made with an even quieter dewar.
Assuming that the noise-canceled spectrum has all of the correlation between each channel removed, the 187 fT/Hz1/2 result obtained in the CSS dewar corresponds to the noise of channel 1 added in quadrature to the noise of channel 2. Assuming that both channels have the same noise levels, the noise of an individual channel is approximately 132 fT/ Hz"2
(11 u>0/Hz1/2). In reality, one channel probably has a somewhat lower noise level and the other channel has a somewhat higher noise level than this average value.
To further substantiate the influence of liquid nitrogen boiling rate on performance, immediately after making the CSS dewar measurement just described, the dewar was topped off with approximately 3 L of liquid nitrogen. Within 10 min of adding the liquid nitrogen, the probe was thermally cycled and tuned for operation. An experiment was immediately performed to measure the output of channels 1 and 2 while the nitrogen boiling rate was relatively high. The noise-canceled PSD obtained from this experiment is the upper trace shown in Figure 11. The noise level rose considerably higher than usual, reaching 5.5 pT/Hz1/2 at a frequency of 1 Hz.
VX APPROVED FO^i rüSLIC Zi RELEASE D1STRISUTI0: IS Ui-iLIiiITED
CSS/TR-97/16
10-4
N I 10b *"*1^,
V- C
**■—■*
>» ■*-'
</> 10-B c (D Q "S L_
S 10'7
(D Q.
CO t
(D
O -10-8
Q_
10"!
-i 1—i—i—r-T" —i—i—i—i—i—| 1 1 1
NOISE-CANCELED PSDs CHANNEL 1-CHANNEL 2
UNSHIELDED WITH GOOD DEWAR VACUUM
u-METAL SHIELDED WITH POOR DEWAR
VACUUM
, i
0.1 10 100
Frequency (Hz)
FIGURE 10. COMPARISON OF SENSOR PERFORMANCE BEFORE AND AFTER DEWAR VACUUM JACKET WAS RE-EVACUATED
MAGNETIC FIELD RAMP EXPERIMENTS
Experiments were conducted to measure the output of the sensor magnetometers to bi-polar, linear ramps of applied magnetic field. The ambient field, in which the magnetometers were cooled below Tc and initially operated in an FLL prior to the field ramp, was either zero or the Earth's field.
Measurements in Zero Field
In these experiments, the sensor dewar with the cooled probe was placed in the u-metal shield room adjacent to the laboratory measurement building. The two layers of u-metal of the shield room reduced the ambient magnetic field to a few milligauss, which is as close to a zero field environment as could be practically obtained for this evaluation. The magnetometers were centered inside of a three-axis Helmholtz coil set that fit over the dewar. The SQUID controller was operated from outside the u-metal room and its output was fed into the laboratory to the data acquisition system.
24 APPROVED FOR h^LlC RELEASE; Dl-oTKibLlTiOft IS UNLIMITED
CSS/TR-97/16
10 I-2
io-!
1 ! 1 1 1 1 j—p_
UNSHIELDED OPERATION i i—i—i i i—i i | i i i i i i i
NOISE-CANCELED PSDs
CHANNEL 1 - CHANNEL 2
CSS DEWAR RIGHT AFTER TOPPING OFF WITH 5 LITERS OF LN2
_i i i i i_ ' ' I I l_L
0.1 1 10
Frequency (Hz) FIGURE 11. EFFECT OF LIQUID NITROGEN BOILING RATE ON SENSOR PERFORMANCE
100
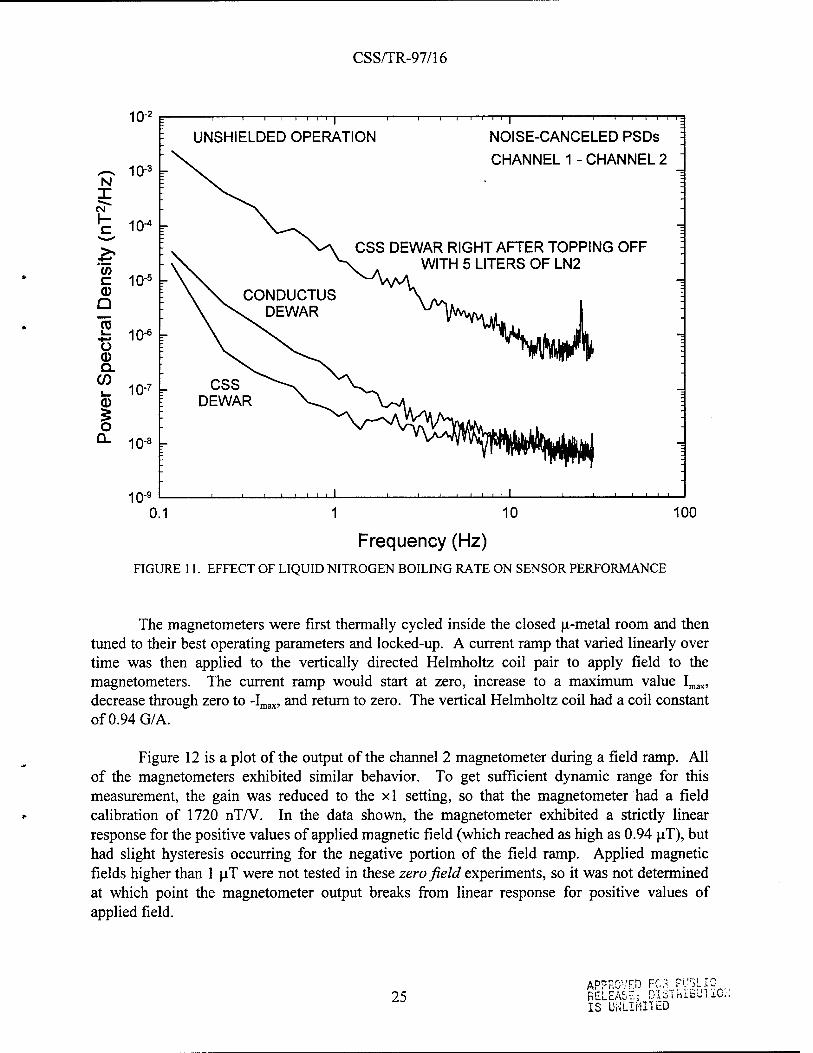
The magnetometers were first thermally cycled inside the closed |x-metal room and then tuned to their best operating parameters and locked-up. A current ramp that varied linearly over time was then applied to the vertically directed Helmholtz coil pair to apply field to the magnetometers. The current ramp would start at zero, increase to a maximum value Imax, decrease through zero to -Imax, and return to zero. The vertical Helmholtz coil had a coil constant of0.94G/A.
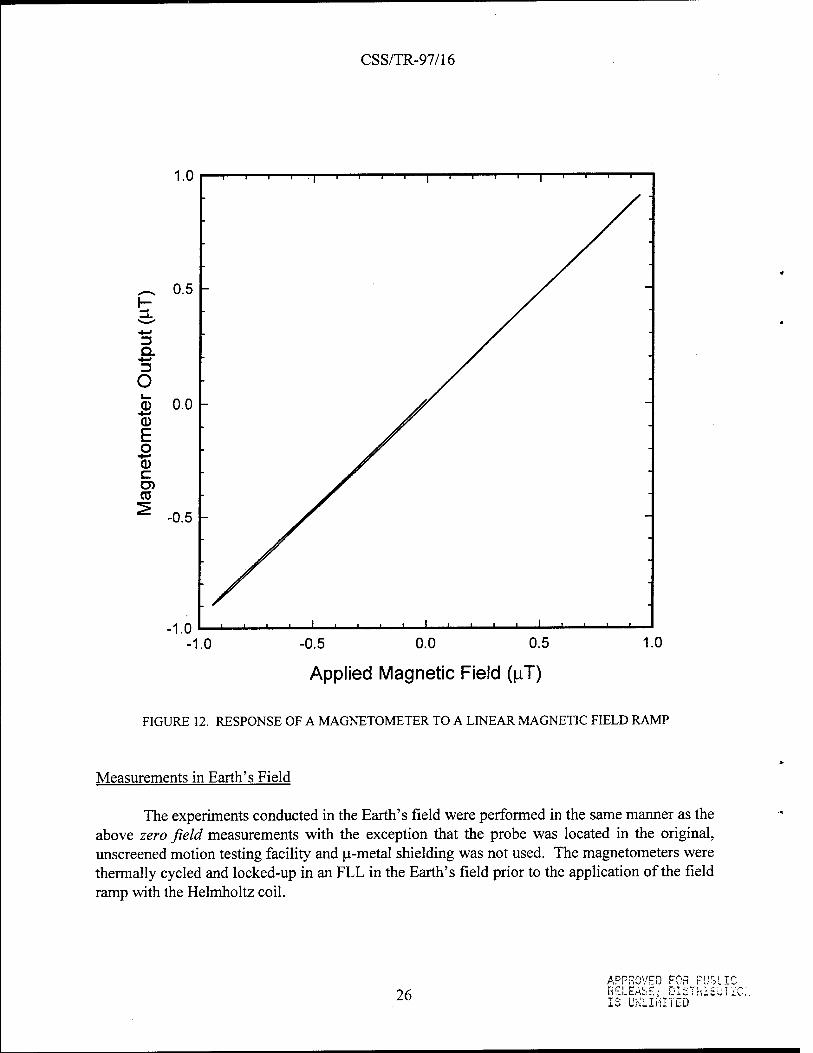
Figure 12 is a plot of the output of the channel 2 magnetometer during a field ramp. All of the magnetometers exhibited similar behavior. To get sufficient dynamic range for this measurement, the gain was reduced to the xl setting, so that the magnetometer had a field calibration of 1720 nT/V. In the data shown, the magnetometer exhibited a strictly linear response for the positive values of applied magnetic field (which reached as high as 0.94 uT), but had slight hysteresis occurring for the negative portion of the field ramp. Applied magnetic fields higher than 1 uT were not tested in these zero field experiments, so it was not determined at which point the magnetometer output breaks from linear response for positive values of applied field.
25 APPROVED FO^ri'SUC RELEASE; DlälKiis'JlH IS UKLIHIltD
CSS/TR-97/16
1.0
0.5
=5 Q.
*-»
o 0
£ o *-> 0 c D)
0.0
-0.5
-1.0 * 1
-1.0 -0.5 0.0 0.5 1.0
Applied Magnetic Field (n"T)
FIGURE 12. RESPONSE OF A MAGNETOMETER TO A LINEAR MAGNETIC FIELD RAMP
Measurements in Earth's Field
The experiments conducted in the Earth's field were performed in the same manner as the above zero field measurements with the exception that the probe was located in the original, unscreened motion testing facility and u-metal shielding was not used. The magnetometers were thermally cycled and locked-up in an FLL in the Earth's field prior to the application of the field ramp with the Helmholtz coil.
26 APPROVED FOR PUBLIC RELEASE; DISThiSUHC IS UNLIMITED

CSS/TR-97/16
The output of magnetometer channels 1 and 2 is shown in Figure 13 for an applied magnetic field ramp up to a maximum field of 4.7 uT. Both magnetometers responded in a similar fashion, each exhibiting a large amount of hysteresis. Starting from zero applied field, both magnetometers begin by responding linearly to increasing magnetic field. As the magnetic field ramp continues its rise, the magnetometers' response slopes are abruptly reduced; the change occurring for a lower field value for channel 2 than channel 1 (1.18 uT and 1.85 uT, respectively). The reduced response slope of each magnetometer continues until the field direction is reversed and begins decreasing, at which point the slope returns to its original value. As the applied field decreases, the slope reverts back to its reduced value, first for channel 2 and then for channel 1. As seen in the plot, the last half of the ramp (negative current values) is similar to the first half of the ramp, with the addition of a couple of instances of unpredictable flip-flops between the two values of slope.
I-
•+■< 3 Q. 3 o
1— 0
■«-»
<D £ o +-• CD C a> Co
3.0
2.0
1.0
0.0
-1.0 -
-2.0
i i i i
3 0 I—i—i—i—i—I—i- 11111 ■ ■ ■ '
-6.0 -4.0 -2.0 0.0 2.0 4.0
Applied Magnetic Field (i^T)
6.0
FIGURE 13. RESPONSE OF MAGNETOMETERS TO APPLIED FIELD WHEN UNSHIELDED
27 RELEAtL"; DISThibJ] JX IS UNLIHIiuQ
CSS/TR-97/16
For field ramps confined to maximum values below the field at which the response slope is initially reduced, the magnetometers operate linearly without hysteresis. Once the response slope drops to its reduced value, the magnetometers have a hysteretic output. There is on the order of 100 O0 applied to the magnetometer when it breaks down and begins operating with a reduced response. The response slope drops to approximately one-fourth of its original value.
It is believed that the reduced response of the magnetometer is caused by the critical current of the pickup loop being exceeded at one of the places where it must cross the grain boundary of the fused bicrystal substrate. The critical current density of the pickup loop is lower in the region where it crosses the grain boundary than in the remainder of the loop. In fact, these sections of the pickup loop act like Josephson junctions. Their relatively large linewidths, however, give them much higher critical currents than the junctions comprising the SQUID. In V-O measurements performed by Conductus,8 it was found that the pickup loops of magnetometers similar to those evaluated in this study would exceed their critical current with approximately 30 <D0 coupled into the core SQUID. Because of the fact that the feedback coil of the magnetometers is smaller than the pickup loop, all of the circulating current in the pickup loop is not canceled, and eventually the critical current of the pickup loop is reached. Conductus has since improved the magnetometers for the final deliverable of the SBIR contract by using substrates with an offset grain boundary, which allows for a design without the pickup loop crossing the grain boundary.
FINAL VERSION IMPROVEMENTS
A final version of the magnetometer sensor was delivered under the SBIR contract in April 1997, which implements a number of improvements to the sensor evaluated in this study. As mentioned in the previous section, Conductus has made an attempt to increase the dynamic range of the magnetometers by changing the magnetometer design, so that the pickup loop does not cross over the grain boundary of the bicrystal substrate. This change was accomplished by using a substrate that has an offset bicrystal grain boundary located close to one edge of the substrate, rather than splitting the substrate into two equal halves. This new substrate allows the pickup loop to be located on the larger portion of the substrate, such that it still has a relatively large area, but does not cross the grain boundary. At this time, the dynamic range of the new magnetometers has not been measured yet.
A new probe replaces the one used in this evaluation, to improve performance and allow the magnetometers to be oriented along three axes. The new probe has two x-axis magnetometers, as well as y-axis and z-axis magnetometers. The two x-axis channels will allow noise-cancellation measurements as performed in this study, while the two additional axes will allow the instrument to operate as a full three-axis sensor. The center shaft of the probe is spring-loaded against the bottom of the dewar to minimize magnetometer motion relative to the dewar. This feature will allow a more thorough investigation of the liquid nitrogen bubbling
DYED H
<*■* IS IKLIHITED
CSS/TR-97/16
effect on noise performance. The cryocables connecting the magnetometer assemblies with the underside of the probe top plate have been replaced with low thermal-conductivity cables to increase sensor stability and dewar hold time.
The entire architecture of the SQUID electronics has been significantly changed to provide a flexible sensor having enhanced capabilities. The SQUID controller has been replaced by a lap-top computer utilizing a Pentium® microprocessor. This change greatly improves the user interface by providing a large, color liquid crystal display, and full keyboard and mouse input capability, in place of the small monochromatic display and limited keypad input of the iMAG® SQUID controller. The number of magnetometers that can be simultaneously operated will increase from the present three channels up to 255 channels, because the new flux-locked loop electronics are fully programmable and addressable. The new FLL electronics have twice the bandwidth and over two orders of magnitude reduction in low-frequency drift. Bias and modulation current resolution have increased from 1 part in 256 up to 1 part in 4096. The improved electronics allow remote selection of one of four bias current modulation schemes in contrast to the present single available scheme. Also, the new electronics allow for an external feedback signal to be input to implement advance noise reduction schemes such as used by the three SQUID gradiometer invented at IBM.9 A full evaluation of the new sensor will begin in the summer of 1997.
CONCLUSIONS
A three-channel, high-Tc SQUID magnetometer sensor was operated and evaluated in environments ranging from highly shielded (from static magnetic fields and radio frequency interference) to completely unshielded. The sensor was a prototype unit assembled from off-the- shelf, commercially available, YBCO magnetometers operating at 77 K, obtained from the iMAG® product line of Conductus, Incorporation. The evaluation consisted of measurements of sensor white noise, low-frequency noise, and response to magnetic field ramps, with the sensor tested in a wide range of ambient environments in each case.
The sensor provided by Conductus was user-friendly and easy to set up. Setup consisted of cooling the probe in the supplied compact liquid nitrogen dewar and connecting a few cables between the probe and the electronics. The electronics could be operated off of alternating current line voltage or 12-V batteries. Once the SQUID controller electronics were activated, a simple touch of a button would initiate the thermal-cycling of all three channels and then automatically tune each SQUID magnetometer to its proper operating parameters.
Measurements of the magnetic field calibrations of the individual magnetometer sensors confirmed the values obtained in experiments performed by Conductus personnel at their facilities. Also, the voltage/flux transfer function was found to agree closely with the Conductus
APPROVED FOR 9Q RELEASE; r-IST
IS UNLIfilTiZD

CSS/TR-97/16
test results in the cases of channels 1 and 3, with a 12 percent disagreement for channel 2. An explanation for the disagreement was not determined, but the CSS result was consistently obtained in several follow-up checks.
The white noise levels of the magnetometers determined at CSS were consistent with values measured at Conductus. White noise levels measured in the Earth's magnetic field in the ambient RFI environment of CSS were equal to levels measured under highly shielded conditions.
The low-frequency noise spectrum of the unshielded magnetometers was much noisier than the noise measured by Conductus for individual magnetometers placed inside YBCO shields. This result is consistent to unshielded results obtained in tests performed by Conductus. The parallel configuration of the magnetometer sense axes allowed the correlated environmental noise to be removed by subtracting the signal from two channels either electronically or using software processing. The remaining low-frequency noise was consistent with the shielded result, with the software - cancellation technique resulting in more complete subtraction than the electronic gradiometer hardware. The best result was obtained for channel 1 noise-canceled with channel 2, which had a noise level at 1 Hz of 187 fT/Hz1/2 (16 |iO0/Hz1/2). If it is assumed that for the noise-canceled result the channels are uncorrelated and make equal contributions to the combined noise level, then channel 1 and channel 2 each have a 1-Hz noise level of approximately 132 fT/Hz1'2 (11 |aO0/Hz1/2). The 1/f knee for the spectrum was approximately 7 Hz.
The sensor magnetometers responded linearly to magnetic field ramps for fields below approximately 1 uT in experiments conducted with the sensors initiated either in a zero field environment or in the Earth's field. For larger field excursions, the magnetometers response to field would drop to roughly one-fourth of its original value and behave in a hysteretic manner. It was speculated that the change in response was caused by the critical current of the pickup loop being exceeded in the regions where the loop crosses the bicrystal grain boundary of the substrate.
The magnetometers in this prototype sensor have operated reliably for over two years, and as of January 1997 continue to operate at a level of performance equal to that measured upon their delivery to CSS in January 1996. The hermetically sealed fiberglass buttons in which the magnetometer substrates are mounted have proven to be effective in preventing moisture from damaging the delicate thin film superconducting material of the magnetometers.
Over a period of time, degraded sensor performance was observed. An increase in low- frequency noise was noticed, and through experimentation, the cause of the excess noise was traced to the vacuum jacket of the de war becoming soft. Re-evacuating the dewar restored the original performance level of the sensor. In fact, further testing of the sensor in a dewar having more thermal stability resulted in even lower low-frequency noise.
APPROVED ror ••:-> >:>.<■'-.. m -■
30 IS UrtLli'-IITED

CSS/TR-97/16
In summary, the Earth's field and the normal CSS RFI environment did not have any adverse effects on the intrinsic noise of the HTS magnetometers. The magnetometers operate well in an ambient magnetic field as long as they are thermally cycled in the ambient field. The thermal stability of the sensor dewar is very important to optimal performance of the sensors. A signal larger than approximately 1 |iT will cause the sensor to respond in a hysteretic manner. The significance of this fact is that rotations of the sensor in the Earth's field are not possible without the sensor response becoming hysteretic. A modification of the magnetometer design and a change to the feedback coil may improve sensor operation in this regard.
APPROVED For? RELEASE; PIS'
31 13 UNLIMITED
CSS/TR-97/16
REFERENCES
1. Conductus, Incorporated, 969 W. Maude Avenue, Sunnyvale, CA 94086.
2. University Software Systems, P.O. Box 24860, Los Angeles, CA 90024.
3. SPSS Incorporated, 444 N. Michigan Avenue, Chicago, IL 60611.
4. Hewlett-Packard, Palo Alto, CA 94304.
5. User's Manual for iMAG® HTS Multi-Channel SQUID System, Conductus Instrument and Systems Division, San Diego, CA, 1995.
6. Schmidt, J. M., "77 Kelvin SQUID Magnetometers as Detectors of Metallic Objects" Contractor's Progress, Status, and Management Report, Phase II SBIR Contract N61331-94- C-0049, December 5, 1995, pp. 3-8.
7. Schmidt, J. M., "77 Kelvin SQUID Magnetometers as Detectors of Metallic Objects," Contractor's Progress, Status, and Management Report, Phase II SBIR Contract N61331-94- C-0049, 7 August 1995, p 7.
8. Burns, M. J., "77 Kelvin SQUID Magnetometers as Detectors of Metallic Objects," Contractor's Progress, Status, and Management Report, Phase II SBIR Contract N61331-94- C-0049, 15 May 1995, pp. 4-7.
9. R. H. Koch, J. R. Rozen, J. Z. Sun, and W. J. Gallagher, "Three SQUID Gradiometer," Applied Physics Letters, 63 (3), 403, 1993.
32
APPROVED FC? P'.-fj: T<->
13 UKLIHIVED

CSS/TR-97/16
DISTRIBUTION
COPIES
DOD ACTIVITIES (CONUS)
ATTN ONR 321 (DR. J. KRAVITZ) ONR 321 (DR. D. JOHNSON) ONR 321 (DR. R. JACOBSON) ONR 321 (DR. D. TODOROFF) ONR 312 (DR. D. VANVECHTEN) SBIR OFFICE (D. HARRY)
CHIEF OF NAVAL RESEARCH BALLSTON TOWER ONE 800 N QUINCY ST ARLINGTON VA 22217-5660
ATTN CODE 6344 (DR. R. SOULEN) CODE 6854 (DR. M. NISENOFF)
COMMANDING OFFICER NAVAL RESEARCH LABORATORY WASHINGTON DC 20375-5320
ATTN CODE 7442 (DR. E. MOZLEY) COMMANDING OFFICER NAVAL RESEARCH LABORATORY STENNIS SPACE CENTER MS 39529
ATTN CODE 854 (J. SCARZELLO) COMMANDER CARDEROCK DIVISION NAVAL SURFACE WARFARE CENTER BETHESDAMA 20084-5000
ATTN CODE 4556 (DR. L. BOBB) COMMANDER NAVAL AIR WARFARE CENTER 22541 MILLSTONE ROAD PATUXENT RIVER MD 20670-5304
ATTN CODE D714 (T. ROY) COMMANDER NAVAL COMMAND CONTROL AND OCEAN SURVEILLANCE CENTER 53660 OCEANVIEW DR STE 317 SAN DIEGO CA 92147-5088
DEFENSE TECHNICAL INFORMATION CENTER 8725 JOHN J KINGMAN RD SUITE 0944 FTBELVOIRVA 22060-6218
NON-DOD ACTIVITIES (CONUS)
THE CNA CORPORATION PO BOX 16268 ALEXANDRIA VA 22302-0268
INTERNAL
A76 (TECHNICAL LIBRARY) CP232 (MSC) R23 (ALLEN) R22 (CLEM) R051 (EVERHART) R23 (FROELICH) R23 (OVERWAY) R23 (WIEGERT) R23 (WOOD) R22 (WYNN) R23 (PURPURA)
(1) APPROVED F0r
13 UNLIMITED ;in:L.,