CSF biomarkers in aging and the transition to Alzheimer’s ... · CSF biomarkers in aging and the...
30
CSF biomarkers in aging and the transition to Alzheimer’s Disease Douglas Galasko Dept of Neurosciences, UCSD Neurology Service, VAMC Director, Shiley-Marcos Alzheimer’s Disease Research Center, UCSD
Transcript of CSF biomarkers in aging and the transition to Alzheimer’s ... · CSF biomarkers in aging and the...

CSF biomarkers in aging and the transition to Alzheimer’s Disease
Douglas Galasko
Dept of Neurosciences, UCSDNeurology Service, VAMCDirector, Shiley-Marcos Alzheimer’s Disease Research Center, UCSD

Biomarkers, key AD lesions and symptoms
Jack et al, 2009
Plaques
Tangles
MCI DementiaCognitively normal

CSF biomarkers and AD
• Low CSF Aβ42, and high levels of tau and P-tau181 are a core biomarker signature related to AD pathology
• Many studies have defined cutoffs to diagnose AD vscontrols, or for differential diagnosis
• CSF biomarkers can clarify: timing of the onset of pathology the relationship to brain structural changes and to
symptoms pathological mechanisms that may contribute to AD

What does the ‘concentration’ of a biomarker in CSF mean?
• CSF biomarkers turn over, and reflect recent brain events• Markers reach ISF space through
– secretion e.g. Aβ– leakage or damage e.g. tau
• They then undergo clearance:– Uptake by cells in the brain– Degradation by enzymes– Binding to plaques e.g. Aβ42– Passage into blood
• Levels of biomarkers in CSF represent an equilibrium between these processes

APP
secretases
Aβ
Aggregation: oligomers, fibrils and amyloid plaques
AD
Microglia clear Aβ
Aβ clearance into blood vessels
Enzymes break down Aβ

Low CSF Aβ42 in AD is related to amyloid depositionCSF Aβ42 vs PIB PET imaging
Lower CSF Aβ42 is associated with higher firbillar amyloidamyloid burden (PIB)
- Fagan et al, 2006; 2008, Rabinovici et al, 2009
About 14% of normal subjects are PIB neg, but have low CSF Aβ42 ? variability of CSF, or pre-fibrillarAβ e.g. diffuse deposits
- Fagan et al, 2010

Tau and tangles
Phosphatekinase phosphatase
Microtubule-binding region
Soluble tau
Paired helical filament
Total tau assay P-tau assay

CSF total tau and P-tau
• 2-3 fold ↑ in AD vs controls; sensitivity 75-85%• Levels not related to APO-E genotype or dementia severity• Remains stably ↑ in AD • Acute damage e.g. stroke, or neuronal death e.g. CJD,
leads to marked ↑ total tau, not P-tau
CSF Tau increases after stroke, P-tau181 does not
Hesse, 2001
CS
F To
tal t
au
CS
F P
-tau
181

A CSF study across the adult lifespan
• Funded as NACC Collaborative project: UCSD, U Washington, OHSU, U Penn
• I/E criteria for normals: – Age 20 – 100, recruited to fill age strata– generally healthy, CDR 0, MMSE > 27/30, normal on NYU
story learning and recall– BMI: non-obese– No recent infectious or inflammatory illnesses– No neurological illness affecting CNS– No chronic inflammatory illness, major organ failure, – Normal CBC, chem 12, glucose and platelet count– Normal neurological exam

Demographics and biomarker levels
Controls< 60
Controls,≥ 60
AD
Number 155 145 104
Age 41 ± 3.0 72 ± 7.2 72 ± 9.2Sex (% F) 54 54 46Education 16 ± 2.7 16 ± 2.7 16 ± 3.2APO-E e4+ (%) 38 28 69Body Mass Index 24 ± 3.2 26 ± 3.4 26 ± 3.3CSF Aβ42 274 ± 41 236 ± 67 157 ± 54CSF Tau 54 ± 14 71 ± 24 105 ± 37CSF P-tau181 26 ± 8 33 ± 14 51 ± 18

Comparisons between AD and controls
Tau / Aβ42: AUC = 0.84,Sens = 86%, spec 75 %
Galasko et al, ICAD 2008
Tau / Aβ42: AUC = 0.90,sens = 87%, spec 85 %
Shaw et al, 2009

MCI, CSF biomarkers and the Alzheimer’s Disease Neuroimaging initiative (ADNI)
Cutoffs for Aβ42, tau and P-tau181 came from a cohort of autopsy-proven AD and elderly controls.
CSF Aβ42 and tau/ Aβ42 predicted which MCI subjects progressed to AD in 12 months.
Shaw et al, 2009
AD MCI NC

CSF biomarkers and structural MRI in MCI
ADNI MCI subjects with an AD CSF profile showed greater atrophy at baseline and on follow-up
Fjell et al, 2010

Detecting an AD signature in normals
• Amyloid pathology is a likely initiating event in AD• Deposition is followed by a long preclinical buildup of
structural changes before symptoms emerge• A signature of pathology in cognitively normal
subjects should meet the following predictions:– Resembles the signature in AD-dementia– Increased frequency with age– Increased in genetically predisposed subjects– Predicts cognitive decline and progression to MCI
and AD

Age, APO-E e4 and amyloid biomarkers
PIB PET +
↓ CSF Aβ42Morris et al, 2010
Age of normal
subjects
% with AD CSF
ADNI 76 ± 5 31 - 38
DESCRIPAnormal
complaints
67 ± 6
66 ± 8
31
52
Galasko et al 67 ± 10 25
40-59 60-69 70-79 80-89Age

Mean – 2SD, young NC
Aβ42pg/mL
Age (years)
CSF Aβ42 in controls vs age and APO-E e4
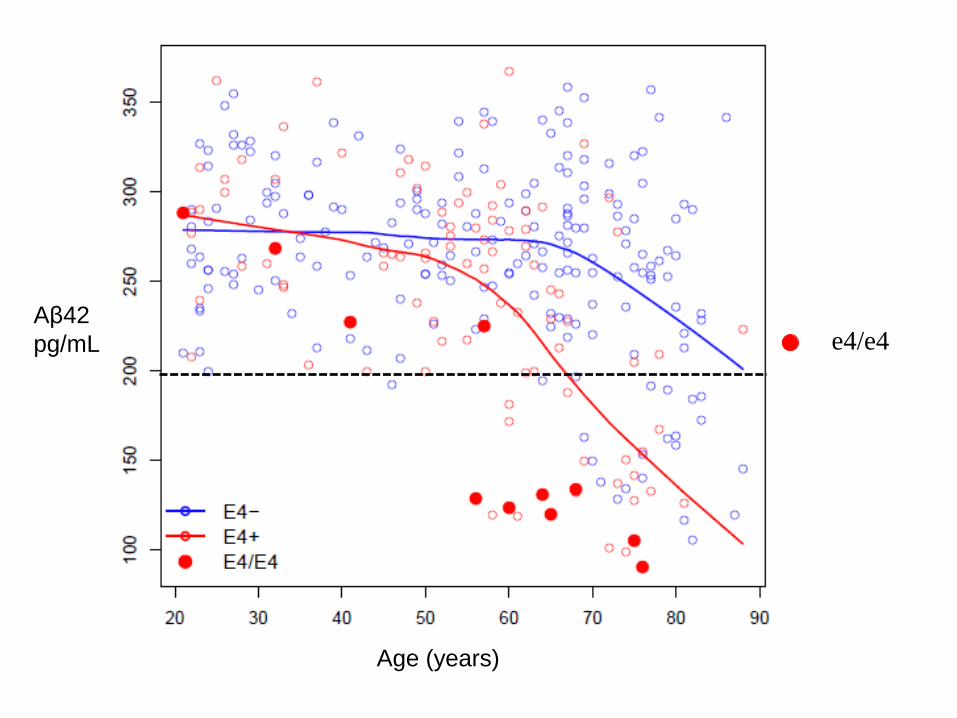
e4/e4Aβ42pg/mL
Age (years)

Mean ± 2SD, young NC
T-taupg/mL
Age (years)
CSF T-tau in controls vs age and APO-E e4
e4/e4

Mean ± 2SD, young NC
P-tau181pg/mL
Age (years)
CSF P-tau181 in controls vs age and APO-E e4

Young NC cutoff
Tau / Aβ42 in controls vs age and APO-E e4

Do CSF biomarkers predict decline in normals?
61 subjects, initially CDR 0, mean age 75HR for progression = 2.4 for tau/Aβ42 and 1.8 for Ptau181/Aβ42
Fagan et al, 2007
109 controls, mean age 70HR for progression = 1.6 for tau/Aβ42
Galasko et al, unpublished
Years Since Baseline Visit
Pro
porti
on N
ot C
onve
rted
to M
CI
0 1 2 3 4 5 6
0.0
0.2
0.4
0.6
0.8
1.0
Conversion to MCI for ControlsN = 198 , N w/ FU = 109 , N Converted = 7
Baseline Tau/Ab42 <= 75th %ileBaseline Tau/Ab42 > 75th %ile
Logrank p-value = 0.04
Progression to MCI or AD in controls

CSF biomarkers in control subjects who progressed
Aβ42
Tau
PTau181
Tau/Aβ42

Proteomic adventures 2D-DIGE Craig-Shapiro et al
14 23
10,000
15,000
20,00025,000
37,000
50,000
75,000100,000
MW(kDa)
CSF discovery samples: AD NC
Immunodeplete 6 highly abundant proteins
Differential dye labels for:AD NC PoolCy5 Cy3 Cy2
2D gel electrophoresis
Fluorescence image analysisExcise differentially expressed spotsDigest, sequence with MS
Compare levels in AD vs controls in Discovery and Validation cohorts
YKL40

A
D
G H I
E F
B C
J K L
M N O
GFAP purple (astrocytes)YKL blue
LN-3 brown (microglia)YKL blue
LN-3 brown (microglia)YKL blue
PHF black (dystrophic neurites)YKL brown
PHF black (dystrophic neurites)YKL brown
YKL brown
PHF black (neurofibrillary tangles)YKL brown
PHF black (neurofibrillary tangles)YKL brown
YKL brown
LN-3 brown (microglia)YKL blue
LN-3 brown (microglia)YKL blue
LN-3 brown (microglia)YKL blue
OverlayA
D
G H I
E F
B C
J K L
M N O
GFAP purple (astrocytes)YKL blue
LN-3 brown (microglia)YKL blue
LN-3 brown (microglia)YKL blue
PHF black (dystrophic neurites)YKL brown
PHF black (dystrophic neurites)YKL brown
YKL brown
PHF black (neurofibrillary tangles)YKL brown
PHF black (neurofibrillary tangles)YKL brown
YKL brown
LN-3 brown (microglia)YKL blue
LN-3 brown (microglia)YKL blue
LN-3 brown (microglia)YKL blue
YKL brown Thioflavin S green (plaque) YKL brown YKL40 A secreted 40 kD glycoprotein
In AD, YKL i.r. is in the vicinity of fibrillar amyloid plaques (A,B,C).
Present within a subset of GFAP-positive astrocytes (D) and not in LN-3-positive microglia (E,F).
YKL-40 is also seen in swollen cell processes associated with plaques (G); these lack reactivity for dystrophic neurite marker PHF-1 (H,I) and microglial marker LN-3 (J,K,L ), and may represent astrocytic processes.
YKL-40 i.r. is also observed in occasional neurons in the superficial white matter (M,N,O), some of which contain neurofibrillary tangles.

YKL40 levels were increased in CDR 1 vs 0 subjects in the discovery cohort, and in a larger independent sample in CDR 0.5 and 1
YKL40 levels correlated with tau and P-tau181levels

CSF YKL-40/Aβ42 and tau/Aβ42 as predictors of A. conversion from CDR 0 to CDR>0 and B progression from CDR 0.5 to CDR>0.5.Kaplan-Meier estimates of rates of conversion and progression are shown; red curves represent the upper tertile and black curves the lower two tertiles.

BDNF, aging and AD
• Identified in a proteomic CSF study using iTRAQ: ↓ in AD (Zhang et al, 2008)
• BDNF is an activity-dependent secreted protein • Present at synapses; roles in synaptic plasticity,
hippocampal neuronal circuits • Can promote neurogenesis in dentate gyrus• Enhances aspects of spatial memory in rodents• BDNF knockout mouse shows impaired LTP• An allelic variant (Val66Met) may be associated with
poorer memory performance and smaller hippocampalvolume in humans

CSF BDNF in aging and AD
CSF BDNF levels are decreased in AD vs controls(202 ± 31 vs 242 ± 33 pg/mL)
In NC, levels decrease with age and
Lower BDNF was associated with worse performance and greater 12 month decline in immediate and delayed recall and category fluency.
Independent of APOE e4, and CSF Aβ42 and tau.
Li et al, 2009

Can CSF biomarkers help to map a cascade in AD?
Aβ toxic species
Parts of the cascade Potential biomarkersDamage to neurons and axons, tangle formation
Tau, P-tauneurofilaments
Glial reaction GFAP, YKL40
Inflammation S100b, cytokines
Oxidative stress F2-isoprostanes
Synaptic damage ?
Synaptic function and plasticity
Neurotransmitters? sAPPα, sAPPβBDNF
Trafficking SORLA /LR11
Lipids, cholesterol 24-OH-cholesterol
Neurogenesis ? BDNF

Thanks!!
• UCSD: – Helen Vanderswag– Barbara Cottrell– Steven Edland
• U Washington– Elaine Peskind– Gail Li– Thomas Montine– Gerry Schellenberg– Jing Zhang
• OHSU– Jeffrey Kaye– Joseph Quinn
• U Penn– Chris Clark– Virginia Lee
• Washington University– Rebecca Craig-Shapiro– Richard Perrin– Anne Fagan– David Holtzman
Funding support from NIA and VA
Research participants