Title: Structural imaging biomarkers of Alzheimer’s ...
24
1 Title: Structural imaging biomarkers of Alzheimer’s disease: predicting disease progression Authors: Simon F. Eskildsen a,* , Pierrick Coupé b , Vladimir Fonov c , Jens C. Pruessner d , D. Louis Collins c for the Alzheimer’s Disease Neuroimaging Initiative 1 a Center of Functionally Integrative Neuroscience, Aarhus University, Aarhus, Denmark b Laboratoire Bordelais de Recherche en Informatique, Unité Mixte de Recherche CNRS (UMR 5800), Bor- deaux, France c McConnell Brain Imaging Centre, Montreal Neurological Institute, McGill University, Montreal, Canada d Departments of Psychiatry, Neurology and Neurosurgery, McGill University, Montreal, Canada Word count: 5194 (excluding references, figures and tables) 3 tables and 5 figures *Corresponding author: Simon Fristed Eskildsen Center of Functionally Integrative Neuroscience, Aarhus University Nørrebrogade 44, byg. 10G DK-8000, Aarhus, Denmark Telephone: +45-7846-9939, mobile: +45-2210-1234, fax: +45-8949-4400 Email: [email protected] 1 Data used in the preparation of this article were obtained from the Alzheimer's Disease Neuroimaging Initiative (ADNI) database (www.loni.ucla.edu/ADNI). As such, the investigators within the ADNI contributed to the design and implementation of ADNI and/or provided data but did not participate in analysis or writing of this report. A complete listing of ADNI investigators can be found at: http://adni.loni.ucla.edu/wp-content/uploads/how_to_apply/ADNI_Authorship_List.pdf.
Transcript of Title: Structural imaging biomarkers of Alzheimer’s ...
1
Title: Structural imaging biomarkers of Alzheimer’s disease: predicting disease progression
Authors: Simon F. Eskildsena,*, Pierrick Coupéb, Vladimir Fonovc, Jens C. Pruessnerd, D. Louis Collinsc for the
Alzheimer’s Disease Neuroimaging Initiative1
a Center of Functionally Integrative Neuroscience, Aarhus University, Aarhus, Denmark
b Laboratoire Bordelais de Recherche en Informatique, Unité Mixte de Recherche CNRS (UMR 5800), Bor-
deaux, France
c McConnell Brain Imaging Centre, Montreal Neurological Institute, McGill University, Montreal, Canada
d Departments of Psychiatry, Neurology and Neurosurgery, McGill University, Montreal, Canada
Word count: 5194 (excluding references, figures and tables)
3 tables and 5 figures
*Corresponding author:
Simon Fristed Eskildsen
Center of Functionally Integrative Neuroscience, Aarhus University
Nørrebrogade 44, byg. 10G
DK-8000, Aarhus, Denmark
Telephone: +45-7846-9939, mobile: +45-2210-1234, fax: +45-8949-4400
Email: [email protected]
1 Data used in the preparation of this article were obtained from the Alzheimer's Disease Neuroimaging Initiative
(ADNI) database (www.loni.ucla.edu/ADNI). As such, the investigators within the ADNI contributed to the design and
implementation of ADNI and/or provided data but did not participate in analysis or writing of this report. A complete
listing of ADNI investigators can be found at:
http://adni.loni.ucla.edu/wp-content/uploads/how_to_apply/ADNI_Authorship_List.pdf.
2
Abstract
Optimized MRI-based biomarkers of Alzheimer’s disease (AD) may allow earlier detection and refined pre-
diction of the disease. In addition, they could serve as valuable tools when designing therapeutic studies of
individuals at risk of AD. In this study we combine (i) a novel method for grading medial temporal lobe
structures with (ii) robust cortical thickness measurements to predict AD among subjects with mild cogni-
tive impairment (MCI) from a single T1-weighted MRI scan. Using AD and cognitively normal individuals, we
generate a set of features potentially discriminating between MCI subjects who convert to AD and those
that remain stable over a period of three years. Using mutual information based feature selection we iden-
tify five key features optimizing the classification of MCI converters. These features are the left and right
hippocampus grading and cortical thicknesses of the left precuneus, left superior temporal sulcus, and right
anterior part of the parahippocampal gyrus. We show that these features are highly stable in cross valida-
tion and enable a prediction accuracy of 72% using a simple linear discriminant classifier; the highest pre-
diction accuracy obtained on the baseline ADNI1 cohort to date. The proposed structural features are con-
sistent with Braak stages and previously reported atrophic patterns in AD and are easy to transfer to new
cohorts and to clinical practice.
Keywords: Alzheimer, MCI, MRI, early detection, prediction, SNIPE, FACE, hippocampus, cortical thickness
3
1. Introduction
Neuronal injury is an integral part of the pathophysiological process of Alzheimer’s disease (AD). Measures
of neuronal injury and neurodegeneration are among the most important biomarkers of AD (Jack et al.,
2012). Cerebral atrophy caused by the progressive neurodegeneration can be measured in detail by mag-
netic resonance imaging (MRI). Anatomical MRI is routinely carried out in clinical practice when diagnosing
patients with cognitive disturbances, such as memory problems, to eliminate other possible symptom
causes. Thus, atrophy biomarkers based on MRI have a minimal cost impact since MRI scanning is often
part of the standard assessment. Optimizing such MRI-based biomarkers for detection and prediction of AD
may have a significant impact on early diagnosis of patients as well as being valuable tools when designing
therapeutic studies of individuals at risk of AD to prevent or alter the progression of the disease.
Hippocampal atrophy has long been recognized as an early feature of the degenerative process in AD (Ball
et al., 1985). Reductions in hippocampal volume appear to correspond to early memory decline (De Leon et
al., 1989). While sensitive, hippocampal degeneration is involved in other dementias, such as vascular de-
mentia (Gainotti et al., 2004), and is known to be part of non-pathological brain aging (Driscoll et al., 2003).
Thus, volumetric measurements of the hippocampus (HC) are limited in their ability to predict the progres-
sion of AD (Chupin et al., 2009; Clerx et al., 2013; Coupé et al., 2012; Wolz et al., 2011). Evidence suggests
that the nature of degeneration in the HC and surrounding structures, such as the entorhinal cortex (ERC)
and parahippocampal gyrus, is different in AD compared to other dementias and different from the chang-
es occurring during normal aging (Devanand et al., 2012). We have recently obtained results that support
this finding; prediction can be improved by considering the structural composition of the HC and its sur-
rounding structures in the medial temporal lobe (Coupé et al., 2012). Our results were obtained using a
novel concept of measuring structural similarities, comparing the anatomy of a test subject to a library of
AD patients and cognitive normal (CN) subjects.
4
Studies have shown that, apart from hippocampal and medial temporal lobe (MTL) atrophy, AD has a char-
acteristic neocortical atrophy pattern (Dickerson et al., 2009; McEvoy et al., 2009). Cortical thinning of
temporal and parietal lobe regions, the posterior cingulate and the precuneus seem to be involved at early
stages of the disease (Reiman and Jagust, 2012). In the advanced stages of the disease, atrophy spreads to
almost the entire cortex sparing only the sensory-motor and visual cortex (Eskildsen et al., 2012b). Recent-
ly, we showed in (Eskildsen et al., 2013) that if cortical thickness is measured in a consistent manner, pat-
terns of cortical thinning can predict conversion to AD among mild cognitive impaired (MCI) subjects with
higher accuracy (68%) compared to conventional voxel based morphometry (56%) (Davatzikos et al., 2011)
and deformation based morphometry (64%) (Wolz et al., 2011).
In the current study we combine measurements of structural pathological patterns, measured by analyzing
morphological alterations, in key structures of the MTL with degenerative patterns of the neocortex, meas-
ured by cortical thickness, to determine if prediction accuracies can be improved further by considering the
entire gray matter (GM) atrophy footprint of AD. Moreover, we study the advantage of using feature selec-
tion to extract the highest relevant information from a set of potential discriminant features.
2. Methods
2.1. Participants and imaging
Data used in the preparation of this article were obtained from the Alzheimer’s Disease Neuroimaging Initi-
ative (ADNI) database (adni.loni.ucla.edu). The primary goal of ADNI has been to test whether serial MRI,
positron emission tomography (PET), other biological markers, and clinical and neuropsychological assess-
ment can be combined to measure the progression of MCI and early AD. Determination of sensitive and
specific markers of very early AD progression is intended to aid researchers and clinicians to develop new
treatments and monitor their effectiveness, as well as lessen the time and cost of clinical trials. ADNI began
5
in 2004 and is ongoing, now in its third phase (ADNI2). In this study we focused on the now completed first
phase of ADNI (ADNI1, 2004-2010). For up-to-date information, see www.adni-info.org.
In this study we selected all 834 ADNI1 subjects available at baseline or screening. Note that only 819 sub-
jects were officially enrolled in ADNI1. However, in order to compare results with recently published stud-
ies on ADNI data (Coupé et al., 2012; Eskildsen et al., 2013; Liu et al., 2012; Wolz et al., 2011), we decided
to conform to the subject inclusion criteria described in these papers. At baseline or screening 198 subjects
were diagnosed as AD patients, 405 subjects had MCI, and 231 subjects were categorized as cognitively
normal (CN). As done by Wolz et al. (2011), we determined progressive MCI (pMCI) as those patients who
had a diagnosis of AD as of July 2011. The complementary group of MCI patients was considered stable MCI
(sMCI). It should be noted that due to study drop-outs, and to the limited follow-up period, the label sMCI
is uncertain for a potentially important group of MCI patients. Table 1 summarizes the cohorts in our study.
For our analyses we used baseline (or screening) T1-weighted MRI acquired at 1.5T only. One of our goals
was to determine how well we could predict conversion to AD using only cross-sectional data, as would be
the case at the first visit of a patient in clinical practice. AD and CN subject baseline scans were used for
extracting image features sensitive to the pathology, thus enabling an independent analysis for sMCI and
pMCI populations. While there were no statistical significant differences in age or sex between AD and CN
(age: p=0.490, sex: p=0.652) and between sMCI and pMCI (age: p=0.532, sex: p=0.206), it is important to
note that there were statistically significant sex differences between the MCI cohort and the AD and CN
cohorts. The MCI cohort has a significantly (p<0.005) lower rate of females. A complete list of the MCI sub-
jects used in the analyses identified by ADNI ID can be found in the supplementary material of (Eskildsen et
al., 2013).
2.2. Image preprocessing
All images were processed using a fully automatic pipeline (Aubert-Broche et al., 2013). Images were de-
noised (Coupe et al., 2008) using a Rician-adapted noise estimation (Coupe et al., 2010), bias field corrected
6
(Sled et al., 1998), and registered to MNI space using a 12 parameter affine transformation (Collins et al.,
1994). To enable robust registrations we used as registration target a population-specific template derived
from the ADNI1 database constructed using a series of linear and non-linear registrations as described in
(Fonov et al., 2011). The custom template was created from 50 AD patients and 50 CN subjects randomly
selected. This template better reflects the anatomy of ADNI data compared to the conventional ICBM tem-
plate build from young healthy adults. Image intensities were normalized to match the intensity profile of
the template (Nyul and Udupa, 2000), and finally the images were skull stripped using BEaST (Eskildsen et
al., 2012a).
2.3. Hippocampus and entorhinal cortex
The SNIPE (Scoring by Nonlocal Image Patch Estimator) method was used to extract structural features of
the hippocampal complex (Coupé et al., 2012). In this technique, the local structural information surround-
ing each voxel (i.e., 3D patch) of a test subject is compared to those in a library of pre-labeled MRI datasets
from AD and CN subjects. In short, a small patch of MRI data around each voxel (e.g., 7x7x7 voxel patches)
from the test subject is compared to the training library in a non-local fashion, with a goal to find similar
patches, where similar is defined by the sum of squared intensity differences (SSD). The patch similarity is
used to compute a weight for the match and used to determine two pieces of information. First, the weight
is integrated for the different voxel labels in the template library (i.e., background, HC or ERC) and the label
with the maximum weight determines the label of the voxel in the test subject, thus achieving segmenta-
tion. Second, the weights are multiplied against the subject group label (AD=-1.0 , CN=+1.0) in the template
library, and integrated over all matches, to determine if the voxel in question is more similar to the AD
group (with a negative integrated score) or the CN group (with a positive integrated score). More specific
details are given in (Coupé et al., 2012). Before running SNIPE, images were cropped around the structures
of interest and intensity cross-normalized between the subjects using a histogram based method applied
within the MTL region (Nyul and Udupa, 2000). We used SNIPE to obtain both grading values and volumes
of the left and right HC and ERC of all MCI subjects using the parameters proposed in (Coupé et al., 2012).
7
As detailed in (Coupe et al., 2012), the first step to apply SNIPE to the ADNI dataset was to perform a label
propagation. This step consisted in propagating a small number of manual segmentations over the entire
training library using the segmentation described in (Coupe et al., 2011). As in (Coupe et al., 2012), we used
20 scans randomly selected from the AD and CN populations (10 CN and 10 AD) for manual labeling by an
expert using the protocol described in (Pruessner et al., 2002). Then, these manual segmentations were
used to segment the entire AD and CN populations. Finally, HC and ERC segmentations were available for
the 231 CN subjects and 198 AD patients constituting our training library.
The second step of the SNIPE is the structure grading using automatic segmentations obtained from the
propagation step. As proposed in (Coupé et al., 2012), the 50 closest subjects were first selected from each
training population (i.e., 50 AD and 50 CN) using SSD over an initialization mask. Then, the grading maps
and the segmentations of the considered structure were obtained simultaneously using SNIPE. Finally, the
8 SNIPE-based features extracted were the average grading value over the left and right HC and ERC and
the volume of the same four structures (feature 1-8). Volumes were calculated in normalized space (MNI
space) to avoid bias toward head size.
2.4. Neocortex
Cortical thickness was calculated using FACE (Fast Accurate Cortex Extraction) (Eskildsen and Ostergaard,
2006; Eskildsen et al., 2005) and mapped to the cortical surface of the population-specific average non-
linear anatomical template (Fonov et al., 2011) using an iterative, feature-based algorithm (Eskildsen and
Ostergaard, 2008). All AD and CN subjects were used to generate a statistical map of group differences in
cortical thickness. From this t-map, cortical thickness features were derived with the procedure described
in (Eskildsen et al., 2013) using the proportion of the cortical surface with the 20% largest t-values corre-
sponding to a threshold of t=7.4 (see Figure 2). In brief, candidate ROIs were calculated using a multi-seed
constrained surface based region growing algorithm initialized at local maxima of the 20% t-map. In
8
(Eskildsen et al., 2013) we found a cortical area of 10-15% to be suitable for searching for candidate ROIs. In
the current study we decided to increase the threshold, and thereby the search area, to account for popu-
lation differences between selection datasets and prediction datasets (AD/CN vs. pMCI/sMCI). Note that
here, as in the application of SNIPE above, the feature generation is completely independent of the test
data. The CN and AD groups are used to determine the regions of interest (ROIs) in terms of cortical thick-
ness, and these are used to evaluate the independent MCI group. A total of 63 candidate cortical thickness
ROIs were identified this way (see Figure 2). Neocortical features comprised the mean cortical thickness
within each of these ROIs (feature 9-71) measured in subject native space.
2.5. Quality control
All results were visually evaluated for quality control by an expert and subjects were excluded if errors
were found in one of the image processing steps mentioned above. Due to our highly robust image pro-
cessing pipeline, only 3.1% of the images were excluded this way. The cohort numbers after quality control
are given in Table 1. For the 24 datasets that failed, 5 were CN, 9 were sMCI, 6 were pMCI and 4 were AD.
Failures were due mostly to excessive motion artifacts or unexpected head position in the scanner. All oth-
er CN and AD data were used in the template library and all other MCI data were used in the experiments.
Our 3.1% failure rate is much lower than the 12.8% failure rate reported by Wolz et al. (2011) on the same
data for a similar analysis using cortical thickness.
2.6. Feature selection
Candidate features for the prediction of AD among MCI subjects included 71 image-based features (8 SNIPE
features and 63 cortical thickness ROIs). To select discriminant features, we used a mutual information
feature selection (MIFS) method (Battiti, 1994). In this method, features are selected iteratively in ascend-
ing order according to their mutual information score between feature and class and the already selected
features. This way features are selected for being informative of the class without being predictable from
the current set of features, thus removing redundancy in the feature set. In the given prediction problem,
9
many of the candidate features can be assumed highly correlated, especially as cortical ROIs are spatially
close. Thus, we expect the MIFS algorithm to remove many redundant features while keeping the most
informative ones. Feature values were standardized before calculating the mutual information. As the se-
lection method does not provide any information of the optimal number of features, we automatically se-
lected features using the MIFS method generating feature sets consisting of 1 to 30 features to be tested by
the classifier. To get an unbiased estimate of the prediction accuracy, we carefully performed feature selec-
tion independent of the subject to be classified. This was done in a leave-one-out (LOO) fashion where the
feature set optimizing the classification of the training set was used to classify the subject left out. This
nested LOO procedure resulted in a specific feature set for each subject. To analyze the stability of the se-
lected features we recorded how frequent each feature was chosen for optimal classification in the training
data.
2.7. Prediction
Generated features were used for prediction of MCI subjects using a linear discriminant classifier (LDA) in
the LOO cross validation procedure mentioned above. Eight different feature sets were tested: 1) Total
MMSE score, 2) long delayed recall score of Rey auditory verbal learning test (RAVLT), 3), all cortical thick-
ness features, 4) all SNIPE features, 5) all imaging features, 6) selected cortical thickness features, 7) select-
ed SNIPE features, and 8) selected features among all imaging features (identified below as the combined
feature set). This was done to evaluate the added prediction power of each method and the effect of using
feature selection. Prediction using MMSE alone was chosen as a reference as this neuropsychological as-
sessment is widely used in clinical practice for screening purposes, and permits comparisons with previous
literature using the ADNI database. However, studies have shown that episodic memory may be a better
predictor of disease progression (Balthazar et al., 2010; Mormino et al., 2009). Thus we included RAVLT
scores for comparison in our analysis. To be of any value, predictions based on imaging should improve the
prediction based on cognitive scores alone. In all scenarios the subject age was included as feature, as our
10
previous results have shown improved prediction accuracies when age is used in combination with struc-
tural features (Coupe et al., 2012; Eskildsen et al., 2013).
3. Results
When using SNIPE features only, the feature selection method selected left and right HC grading values in
all LOO experiments (Table 2). The next most selected features were only selected in about quarter of the
experiments. In most experiments two features were found to be optimal. This fully automatic feature se-
lection is in line with results obtained in (Coupé et al., 2012) doing an exhaustive search of the optimal
combination of SNIPE features. Using cortical thickness features only, the left precuneus were chosen in all
cases followed by the left parahippocampal gyrus and an area corresponding to the uncal recess of the
inferior horn of the lateral ventricle on top of the hippocampus. In this case, three features were found to
be optimal for most classification experiments. Interestingly, when applying the feature selection on the
combined feature set, the stability of the selected features increased. The same five imaging features were
selected in almost all experiments. These were left and right HC grading values and cortical thickness of the
left precuneus, left superior temporal sulcus and right anterior part of parahippocampal gyrus. Figure 3
visualizes the cortical thickness features most frequently selected for cortical thickness only and the com-
bined feature set, respectively. The same five features were chosen in almost all experiments, making five
the optimal number of features. Figure 4 visualizes the estimated prediction accuracy using varying number
of selected features of the combined feature set.
Table 3 lists the results of predicting conversion using the LDA classifier in the eight different scenarios.
Four things should be noted: 1) using just MMSE and age do not provide better accuracy than random se-
lection (p=0.07, McNemar’s test), while all other feature sets do (p<0.05), 2) SNIPE features yield nominally
higher accuracies than cortical thickness features, though differences were not significant (p>0.05, see be-
low), 3) applying feature selection increases accuracy (p≤0.003, see below), and 4) the combined selected
features reach the best prediction among the tested scenarios, though only borderline significantly better
11
than SNIPE (p=0.068, see below). Figure 5 shows the corresponding receiver operating characteristic (ROC)
curves for the three scenarios with feature selection. Using DeLong's test for two ROC curves (DeLong et al.,
1988) revealed that the area under the curve (AUC) for the combined classifier was significantly different
from the AUC of the cortical thickness classifier (p=0.027) and almost significantly different from the AUC of
the SNIPE classifier (p=0.068). AUCs were not significantly different between the SNIPE and the cortical
thickness classifiers both with and without feature selection. Using feature selection significantly improved
the AUC in all feature sets (p≤0.003). Though prediction using RAVLT scores was significantly better than
random selection (p=0.028), RAVLT was not significantly better than MMSE (p=0.31). The classifier using
the combined feature set performed significantly better than RAVLT scores (p=0.012).
4. Discussion
The results demonstrate that the optimal prediction accuracy can be obtained using a set of few selected
features from the medial and lateral temporal lobes and the precuneus. Adding further features reduces
the prediction accuracy as additional noise is introduced without adding discriminative information. In gen-
eral, it seems that there are many irrelevant candidates within the cortical thickness features. This might
result from that fact that the cortical thickness features are based on statistical differences between AD
patients and CN subjects. The same could be said for the SNIPE features as they too were built from AD/CN
templates. However, in this case the features are predetermined and not driven by the AD/CN contrast.
Even though the t-map of cortical AD/CN differences covers the regions involved in early AD, there are also
large parts of the cortex that are affected in the later stages of the disease. Therefore, candidate features
not suited for the sMCI/pMCI classification are also generated by the feature extraction method. However,
the mutual information feature selection (MIFS) method (Battiti, 1994) manages to identify a few discrimi-
native ROIs from the 63 candidate ROIs. In the future, we will investigate feature selection based on the
sMCI/pMCI differences.
12
From Table 2 it can be observed that the same five features are selected in almost all the LOO experiments
of the combined feature set and that in Figure 4 these five features seem to optimize the prediction accu-
racy. This indicates that the method proposed to generate and select features is stable and should general-
ize well to other datasets. The stability of the estimated prediction accuracy (indicated by the small stand-
ard error in Figure 4) indicates that our reported prediction accuracy of 72% is what can be expected in a
real clinical prospective setup.
The prediction accuracy we obtain for conversion from MCI to AD is nominally higher than most recently
published results on ADNI data (Chincarini et al., 2011; Cho et al., 2012; Chupin et al., 2009; Coupé et al.,
2012; Cuingnet et al., 2011; Davatzikos et al., 2011; Eskildsen et al., 2013; Gray et al., 2013; Westman et al.,
2013; Westman et al., 2011; Wolz et al., 2011). Though cohort definitions and sizes vary between studies,
our cohort definition is identical to several of these published works (Coupé et al., 2012; Eskildsen et al.,
2013; Wolz et al., 2011). A few studies report slightly higher accuracy than we obtain here (Li et al., 2012;
Misra et al., 2009; Wee et al., 2012). However, these studies are all based on a smaller subset of the co-
horts studied here and thus comparability with the current results is limited. In addition, non-linear classifi-
ers were applied in these studies, which can potentially lead to unstable feature selection during training
(Kalousis et al., 2007). Here, we demonstrate relatively high accuracy on all baseline ADNI1 data (excluding
the 3% failing the image processing) using a linear classifier and few features, which are highly stable when
cross-validated, imposing more confidence in the selected features.
The improvement in prediction accuracy over similar methods based on T1w MRI (Chincarini et al., 2011;
Cho et al., 2012; Chupin et al., 2009; Cuingnet et al., 2011; Westman et al., 2013; Wolz et al., 2011) as
demonstrated here is likely due to 1) the robustness and consistency of the image processing pipeline
demonstrated by the very low failure rate, 2) the complementarity of the features extracted from the im-
ages (MTL and neocortical structures), as the neurodegenerative process in AD occurs across several re-
gions of the brain, 3) the use of a robust and consistent feature extraction method reducing noise in the
13
measurements, and 4) the high relevance of certain features such as HC grading and thickness of left
precuneus and left superior temporal sulcus. The selection strategy showed that only a few key features
extracted from structural MRI are sufficient for reaching prediction accuracy superior to state-of-the-art
methods involving several thousands of features (Chincarini et al., 2011) or involving multi-modal features
including MRI and PET (Gray et al., 2013).
Studies to date suggest a natural limit in the prediction accuracy obtained on the ADNI data. No method
achieves higher accuracy than we report here on the baseline ADNI1 cohort, thus one can assume an upper
limit of the prediction accuracy well under 100%. This limitation may have several explanations. First, due
to study drop-outs and limited follow-up, the status of a potentially important group of MCI subjects re-
main unknown, yet they are all grouped together as sMCI. Second, many MCI subjects may have mixed
pathologies affecting their cognitive performance. Thus, subjects not converting to AD may still suffer from
other neurodegenerative processes with similar or overlapping atrophy patterns compared to the atrophy
pattern of AD. Third, subjects diagnosed as sMCI might still convert to AD in the future, but since they have
not done so yet are misdiagnosed as sMCI and confound the analysis. Finally, there is still a high uncertainty
attached to the clinical diagnosis of AD. All of these issues will negatively affect the training of a classifier
and impair its predictive power.
Contrary to recently reported prediction results on the ADNI data that rely on complex combinations of
features (Chincarini et al., 2011; Cho et al., 2012; Li et al., 2012; Wee et al., 2012), we wanted to have sim-
ple, interpretable features. This was obtained by selecting a set of features linked to specific anatomical
structures (not voxel or vertex level) and not transforming the feature space as done in many feature re-
duction methods (Brunzell and Eriksson, 2000). With a small feature set as we report here it is easier to
replicate findings on other cohorts. In addition, by doing feature selection instead of feature reduction,
new knowledge can be put into the context of the pathophysiological process of AD.
14
The stability of which the same set of features were selected in the LOO experiments show that these fea-
tures are measuring key processes involved in early AD. Contrary to other methods (Misra et al., 2009; Wee
et al., 2012; Westman et al., 2013), the features proposed here do not need any normalization or modula-
tion, are stable across sites with well-aligned scanner parameters (e.g., 59 different acquisition sites are
involved in ADNI), and do not rely on longitudinal information as they can be obtained from a single T1-
weighted MRI sequence. It is very important to be able to predict outcome already at patient’s first visit.
Waiting for example 6 to 12 months for a follow-up scan may unnecessarily delay initiation of crucial neu-
roprotective therapies.
The regions we report to be the most sensitive in predicting AD among subjects with MCI overlaps with
atrophic regions identified in early AD (Apostolova and Thompson, 2008; Desikan et al., 2010; Reiman and
Jagust, 2012; Vemuri et al., 2008) and are consistent with the Braak stages (Braak and Braak, 1991). The
selection of the left precuneus as a predictive feature for the disease progression is notable. Ishii et al.
(2005) showed that GM density of the precuneus was lower in early onset AD (EOAD) compared to late
onset AD (LOAD), while there were no statistical differences in GM densities in the MTL between groups.
EOAD has a more aggressive course and higher pathological burden than LOAD. Even though none of the
subjects enrolled in our study can be characterized as EOAD, we speculate that atrophy of the precuneus
may be a sign that the pathology is taking a more progressive trajectory than those with mainly MTL atro-
phy. It should be noted that the features selected to optimize the prediction of AD do not reflect the full
atrophic pattern of early structural changes. Several potentially pathologically important ROIs correlated
with selected regions are excluded by the classifier due to information redundancy.
The grading method obtained by SNIPE, though quantified over a single structure, includes information of
the surrounding structures. Indeed, while HC grading value is estimated over the HC segmentation only, the
involved patch similarity is estimated between patches of 7x7x7 voxels (mm) and thus includes larger struc-
tural patterns. Therefore, the HC grading may encode pathological structures found in the parahippocam-
15
pal gyrus and other neighboring anatomy. This is further supported by the fact that the feature selection
method chose cortical ROIs away from the HC region in the combined feature set, where both the left and
right HC grading were chosen in all experiments. Our results demonstrate that grading values of the HC are
compact measures of MTL changes due to disease and captures the early neurodegenerative process in AD
yielding relatively high prediction accuracy. This enables even higher prediction accuracy with the support
of only a few key cortical ROIs.
In line with previous work (Balthazar et al., 2010; Mormino et al., 2009), we find that episodic memory
seems to be a better predictor of disease progression than global cognitive scores, such as MMSE. Howev-
er, our results demonstrate that a small set of features extracted from structural MRI significantly improve
prediction over neuropsychological tests.
5. Conclusion
We demonstrate that AD can be predicted with relatively high accuracy using a small set of key anatomical
features extracted from a single T1-weighted MR image. The prediction accuracy of 72% is the highest re-
ported on the entire baseline ADNI1 cohort. The improvement in accuracy is likely due to the application of
a novel and compact description of structural changes in the medial temporal lobe combined with neocor-
tical thickness features and a highly robust image processing pipeline. Using feature selection based on
mutual information lead to the selection of only five features highly stable under cross validation. The five
proposed features are the left and right HC grading and the cortical thickness of the left precuneus, left
superior temporal sulcus, and right anterior part of the parahippocampal gyrus. These are consistent with
Braak stages and previously reported atrophic patterns in AD and are easy to transfer to new cohorts and
to clinical practice.
16
Acknowledgements
This work was funded in part by operating grants from the Canadian Institutes of Health Research, les Fonds
de la recherche santé du Quebec, MINDLab UNIK initiative at Aarhus University, funded by the Danish Min-
istry of Science, Technology and Innovation, grant agreement number 09-065250. Data collection and shar-
ing for this project were funded by the Alzheimer's Disease Neuroimaging Initiative (ADNI) (National Insti-
tutes of Health Grant U01 AG024904). The ADNI is funded by the National Institute on Aging and the Na-
tional Institute of Biomedical Imaging and Bioengineering and through generous contributions from the fol-
lowing: Abbott, AstraZeneca AB, Bayer Schering Pharma AG, Bristol-Myers Squibb, Eisai Global Clini-
cal Development, Elan Corporation, Genentech, GE Healthcare, GlaxoSmithKline, Innogenetics NV, John-
son & Johnson, Eli Lilly and Co., Medpace, Inc., Merck and Co., Inc., Novartis AG, Pfizer Inc., F. Hoffmann-
La Roche, Schering-Plough, Synarc Inc., as well as nonprofit partners, the Alzheimer's Association
and Alzheimer's Drug Discovery Foundation, with participation from the U.S. Food and Drug Administra-
tion. Private sector contributions to the ADNI are facilitated by the Foundation for the National Institutes of
Health (www.fnih.org). The grantee organization is the Northern California Institute for Research and Educa-
tion, and the study was coordinated by the Alzheimer's Disease Cooperative Study at the University
of California, San Diego. ADNI data are disseminated by the Laboratory for Neuro Imaging at the University
of California, Los Angeles. This research was also supported by NIH grants P30AG010129, K01
AG030514 and the Dana Foundation.
Disclosure statement
FACE is the subject of European Patent No. EP04011386.2. and US Patent No. 060/570,493. SNIPE is the
subject of a US provisional patent application (US 61/535,720 / P1310USPR). D.L. Collins is a consultant for
NeuroRx Inc. and co-founder of True Positive Medical Devices Inc.
17
References Apostolova, L.G., Thompson, P.M., 2008. Mapping progressive brain structural changes in early Alzheimer's disease and mild cognitive impairment. Neuropsychologia 46, 1597-1612.
Aubert-Broche, B., Fonov, V.S., Garcia-Lorenzo, D., Mouiha, A., Guizard, N., Coupe, P., Eskildsen, S.F., Collins, D.L., 2013. A new method for structural volume analysis of longitudinal brain MRI data and its application in studying the growth trajectories of anatomical brain structures in childhood. NeuroImage 82C, 393-402.
Ball, M.J., Fisman, M., Hachinski, V., Blume, W., Fox, A., Kral, V.A., Kirshen, A.J., Fox, H., Merskey, H., 1985. A new definition of Alzheimer's disease: a hippocampal dementia. Lancet 1, 14-16.
Balthazar, M.L., Yasuda, C.L., Cendes, F., Damasceno, B.P., 2010. Learning, retrieval, and recognition are compromised in aMCI and mild AD: are distinct episodic memory processes mediated by the same anatomical structures? Journal of the International Neuropsychological Society : JINS 16, 205-209.
Battiti, R., 1994. Using mutual information for selecting features in supervised neural net learning. Neural Networks, IEEE Transactions on 5, 537-550.
Brunzell, H., Eriksson, J., 2000. Feature reduction for classification of multidimensional data. Pattern Recog-nition 33, 1741-1748.
Braak, H., Braak, E., 1991. Neuropathological stageing of Alzheimer-related changes. Acta Neuropathol 82, 239-259.
Chincarini, A., Bosco, P., Calvini, P., Gemme, G., Esposito, M., Olivieri, C., Rei, L., Squarcia, S., Rodriguez, G., Bellotti, R., Cerello, P., De Mitri, I., Retico, A., Nobili, F., 2011. Local MRI analysis approach in the diagnosis of early and prodromal Alzheimer's disease. NeuroImage 58, 469-480.
Cho, Y., Seong, J.K., Jeong, Y., Shin, S.Y., 2012. Individual subject classification for Alzheimer's disease based on incremental learning using a spatial frequency representation of cortical thickness data. NeuroImage 59, 2217-2230.
Chupin, M., Gerardin, E., Cuingnet, R., Boutet, C., Lemieux, L., Lehericy, S., Benali, H., Garnero, L., Colliot, O., 2009. Fully automatic hippocampus segmentation and classification in Alzheimer's disease and mild cogni-tive impairment applied on data from ADNI. Hippocampus 19, 579-587.
Clerx, L., van Rossum, I.A., Burns, L., Knol, D.L., Scheltens, P., Verhey, F., Aalten, P., Lapuerta, P., van de Pol, L., van Schijndel, R., de Jong, R., Barkhof, F., Wolz, R., Rueckert, D., Bocchetta, M., Tsolaki, M., Nobili, F., Wahlund, L.-O., Minthon, L., Frölich, L., Hampel, H., Soininen, H., Visser, P.J., 2013. Measurements of medi-al temporal lobe atrophy for prediction of Alzheimer's disease in subjects with mild cognitive impairment. Neurobiology of aging.
Collins, D.L., Neelin, P., Peters, T.M., Evans, A.C., 1994. Automatic 3D intersubject registration of MR volu-metric data in standardized Talairach space. Journal of computer assisted tomography 18, 192-205.
Coupe, P., Manjon, J.V., Fonov, V., Pruessner, J., Robles, M., Collins, D.L., 2011. Patch-based segmentation using expert priors: application to hippocampus and ventricle segmentation. NeuroImage 54, 940-954.
Coupe, P., Eskildsen, S.F., Manjon, J.V., Fonov, V.S., Collins, D.L., 2012. Simultaneous segmentation and grading of anatomical structures for patient's classification: application to Alzheimer's disease. NeuroImage 59, 3736-3747.
18
Coupé, P., Eskildsen, S.F., Manjón, J.V., Fonov, V.S., Pruessner, J.C., Allard, M., Collins, D.L., 2012. Scoring by nonlocal image patch estimator for early detection of Alzheimer's disease. NeuroImage: Clinical 1, 141-152.
Coupe, P., Manjon, J.V., Gedamu, E., Arnold, D., Robles, M., Collins, D.L., 2010. Robust Rician noise estima-tion for MR images. Med Image Anal 14, 483-493.
Coupe, P., Yger, P., Prima, S., Hellier, P., Kervrann, C., Barillot, C., 2008. An optimized blockwise nonlocal means denoising filter for 3-D magnetic resonance images. IEEE transactions on medical imaging 27, 425-441.
Cuingnet, R., Gerardin, E., Tessieras, J., Auzias, G., Lehericy, S., Habert, M.O., Chupin, M., Benali, H., Colliot, O., 2011. Automatic classification of patients with Alzheimer's disease from structural MRI: a comparison of ten methods using the ADNI database. NeuroImage 56, 766-781.
Davatzikos, C., Bhatt, P., Shaw, L.M., Batmanghelich, K.N., Trojanowski, J.Q., 2011. Prediction of MCI to AD conversion, via MRI, CSF biomarkers, and pattern classification. Neurobiology of aging 32, 2322 e2319-2327.
De Leon, M., George, A., Stylopoulos, L., Smith, G., Miller, D., 1989. EARLY MARKER FOR ALZHEIMER'S DIS-EASE: THE ATROPHIC HIPPOCAMPUS. The Lancet 334, 672-673.
DeLong, E.R., DeLong, D.M., Clarke-Pearson, D.L., 1988. Comparing the areas under two or more correlated receiver operating characteristic curves: a nonparametric approach. Biometrics 44, 837-845.
Desikan, R.S., Cabral, H.J., Settecase, F., Hess, C.P., Dillon, W.P., Glastonbury, C.M., Weiner, M.W., Schman-sky, N.J., Salat, D.H., Fischl, B., 2010. Automated MRI measures predict progression to Alzheimer's disease. Neurobiology of aging 31, 1364-1374.
Devanand, D.P., Bansal, R., Liu, J., Hao, X., Pradhaban, G., Peterson, B.S., 2012. MRI hippocampal and ento-rhinal cortex mapping in predicting conversion to Alzheimer's disease. NeuroImage 60, 1622-1629.
Dickerson, B.C., Bakkour, A., Salat, D.H., Feczko, E., Pacheco, J., Greve, D.N., Grodstein, F., Wright, C.I., Blacker, D., Rosas, H.D., Sperling, R.A., Atri, A., Growdon, J.H., Hyman, B.T., Morris, J.C., Fischl, B., Buckner, R.L., 2009. The Cortical Signature of Alzheimer's Disease: Regionally Specific Cortical Thinning Relates to Symptom Severity in Very Mild to Mild AD Dementia and is Detectable in Asymptomatic Amyloid-Positive Individuals. Cerebral cortex 19, 497-510.
Driscoll, I., Hamilton, D.A., Petropoulos, H., Yeo, R.A., Brooks, W.M., Baumgartner, R.N., Sutherland, R.J., 2003. The aging hippocampus: cognitive, biochemical and structural findings. Cerebral cortex 13, 1344-1351.
Eskildsen, S.F., Coupe, P., Fonov, V., Manjon, J.V., Leung, K.K., Guizard, N., Wassef, S.N., Ostergaard, L.R., Collins, D.L., 2012a. BEaST: brain extraction based on nonlocal segmentation technique. NeuroImage 59, 2362-2373.
Eskildsen, S.F., Coupe, P., Garcia-Lorenzo, D., Fonov, V., Pruessner, J.C., Collins, D.L., 2013. Prediction of Alzheimer's disease in subjects with mild cognitive impairment from the ADNI cohort using patterns of cor-tical thinning. NeuroImage 65C, 511-521.
Eskildsen, S.F., Fonov, V., Coupe, P., Collins, D.L., 2012b. Visualizing stages of cortical atrophy in progressive MCI from the ADNI cohort. Alzheimer's Association International Conference on Alzheimer's Disease. Alz-heimer's Dementia, Vancouver, Canada.
19
Eskildsen, S.F., Uldahl, M., Ostergaard, L.R., 2005. Extraction of the cerebral cortical boundaries from MRI for measurement of cortical thickness. pp. 1400-1410.
Eskildsen, S.F., Ostergaard, L.R., 2006. Active surface approach for extraction of the human cerebral cortex from MRI. Medical image computing and computer-assisted intervention: MICCAI ... International Confer-ence on Medical Image Computing and Computer-Assisted Intervention 9, 823-830.
Eskildsen, S.F., Ostergaard, L.R., 2008. Evaluation of Five Algorithms for Mapping Brain Cortical Surfaces. Proceedings of the 2008 XXI Brazilian Symposium on Computer Graphics and Image Processing. IEEE Com-puter Society, pp. 137-144.
Fonov, V., Evans, A.C., Botteron, K., Almli, C.R., McKinstry, R.C., Collins, D.L., 2011. Unbiased average age-appropriate atlases for pediatric studies. NeuroImage 54, 313-327.
Gainotti, G., Acciarri, A., Bizzarro, A., Marra, C., Masullo, C., Misciagna, S., Tartaglione, T., Valenza, A., Colosimo, C., 2004. The role of brain infarcts and hippocampal atrophy in subcortical ischaemic vascular dementia. Neurol Sci 25, 192-197.
Gray, K.R., Aljabar, P., Heckemann, R.A., Hammers, A., Rueckert, D., 2013. Random forest-based similarity measures for multi-modal classification of Alzheimer's disease. NeuroImage 65, 167-175.
Ishii, K., Kawachi, T., Sasaki, H., Kono, A.K., Fukuda, T., Kojima, Y., Mori, E., 2005. Voxel-based morphometric comparison between early- and late-onset mild Alzheimer's disease and assessment of diagnostic perfor-mance of z score images. AJNR Am J Neuroradiol 26, 333-340.
Jack, C.R., Jr., Vemuri, P., Wiste, H.J., Weigand, S.D., Lesnick, T.G., Lowe, V., Kantarci, K., Bernstein, M.A., Senjem, M.L., Gunter, J.L., Boeve, B.F., Trojanowski, J.Q., Shaw, L.M., Aisen, P.S., Weiner, M.W., Petersen, R.C., Knopman, D.S., 2012. Shapes of the trajectories of 5 major biomarkers of Alzheimer disease. Arch Neurol 69, 856-867.
Kalousis, A., Prados, J., Hilario, M., 2007. Stability of feature selection algorithms: a study on high-dimensional spaces. Knowl. Inf. Syst. 12, 95-116.
Li, Y., Wang, Y., Wu, G., Shi, F., Zhou, L., Lin, W., Shen, D., 2012. Discriminant analysis of longitudinal cortical thickness changes in Alzheimer's disease using dynamic and network features. Neurobiology of aging 33, 427 e415-430.
Liu, M., Zhang, D., Shen, D., 2012. Ensemble sparse classification of Alzheimer's disease. NeuroImage 60, 1106-1116.
McEvoy, L.K., Fennema-Notestine, C., Roddey, J.C., Hagler, D.J., Holland, D., Karow, D.S., Pung, C.J., Brewer, J.B., Dale, A.M., 2009. Alzheimer Disease: Quantitative Structural Neuroimaging for Detection and Predic-tion of Clinical and Structural Changes in Mild Cognitive Impairment1. Radiology 251, 195-205.
Misra, C., Fan, Y., Davatzikos, C., 2009. Baseline and longitudinal patterns of brain atrophy in MCI patients, and their use in prediction of short-term conversion to AD: results from ADNI. NeuroImage 44, 1415-1422.
Mormino, E.C., Kluth, J.T., Madison, C.M., Rabinovici, G.D., Baker, S.L., Miller, B.L., Koeppe, R.A., Mathis, C.A., Weiner, M.W., Jagust, W.J., 2009. Episodic memory loss is related to hippocampal-mediated beta-amyloid deposition in elderly subjects. Brain : a journal of neurology 132, 1310-1323.
Nyul, L.G., Udupa, J.K., 2000. Standardizing the MR image intensity scales: making MR intensities have tis-sue-specific meaning. In: Mun, S.K. (Ed.). SPIE, San Diego, CA, USA, pp. 496-504.
20
Pruessner, J.C., Kohler, S., Crane, J., Pruessner, M., Lord, C., Byrne, A., Kabani, N., Collins, D.L., Evans, A.C., 2002. Volumetry of temporopolar, perirhinal, entorhinal and parahippocampal cortex from high-resolution MR images: considering the variability of the collateral sulcus. Cereb Cortex 12, 1342-1353.
Reiman, E.M., Jagust, W.J., 2012. Brain imaging in the study of Alzheimer's disease. NeuroImage 61, 505-516.
Robin, X., Turck, N., Hainard, A., Tiberti, N., Lisacek, F., Sanchez, J.C., Muller, M., 2011. pROC: an open-source package for R and S+ to analyze and compare ROC curves. BMC bioinformatics 12, 77.
Sled, J.G., Zijdenbos, A.P., Evans, A.C., 1998. A nonparametric method for automatic correction of intensity nonuniformity in MRI data. IEEE transactions on medical imaging 17, 87-97.
Vemuri, P., Whitwell, J.L., Kantarci, K., Josephs, K.A., Parisi, J.E., Shiung, M.S., Knopman, D.S., Boeve, B.F., Petersen, R.C., Dickson, D.W., Jack, C.R., Jr., 2008. Antemortem MRI based STructural Abnormality iNDex (STAND)-scores correlate with postmortem Braak neurofibrillary tangle stage. NeuroImage 42, 559-567.
Wee, C.Y., Yap, P.T., Shen, D., 2012. Prediction of Alzheimer's disease and mild cognitive impairment using cortical morphological patterns. Human brain mapping.
Westman, E., Aguilar, C., Muehlboeck, J.S., Simmons, A., 2013. Regional magnetic resonance imaging measures for multivariate analysis in Alzheimer's disease and mild cognitive impairment. Brain Topogr 26, 9-23.
Westman, E., Simmons, A., Muehlboeck, J.S., Mecocci, P., Vellas, B., Tsolaki, M., Kloszewska, I., Soininen, H., Weiner, M.W., Lovestone, S., Spenger, C., Wahlund, L.O., 2011. AddNeuroMed and ADNI: similar patterns of Alzheimer's atrophy and automated MRI classification accuracy in Europe and North America. Neu-roImage 58, 818-828.
Wolz, R., Julkunen, V., Koikkalainen, J., Niskanen, E., Zhang, D.P., Rueckert, D., Soininen, H., Lotjonen, J., 2011. Multi-method analysis of MRI images in early diagnostics of Alzheimer's disease. PloS one 6, e25446.
21
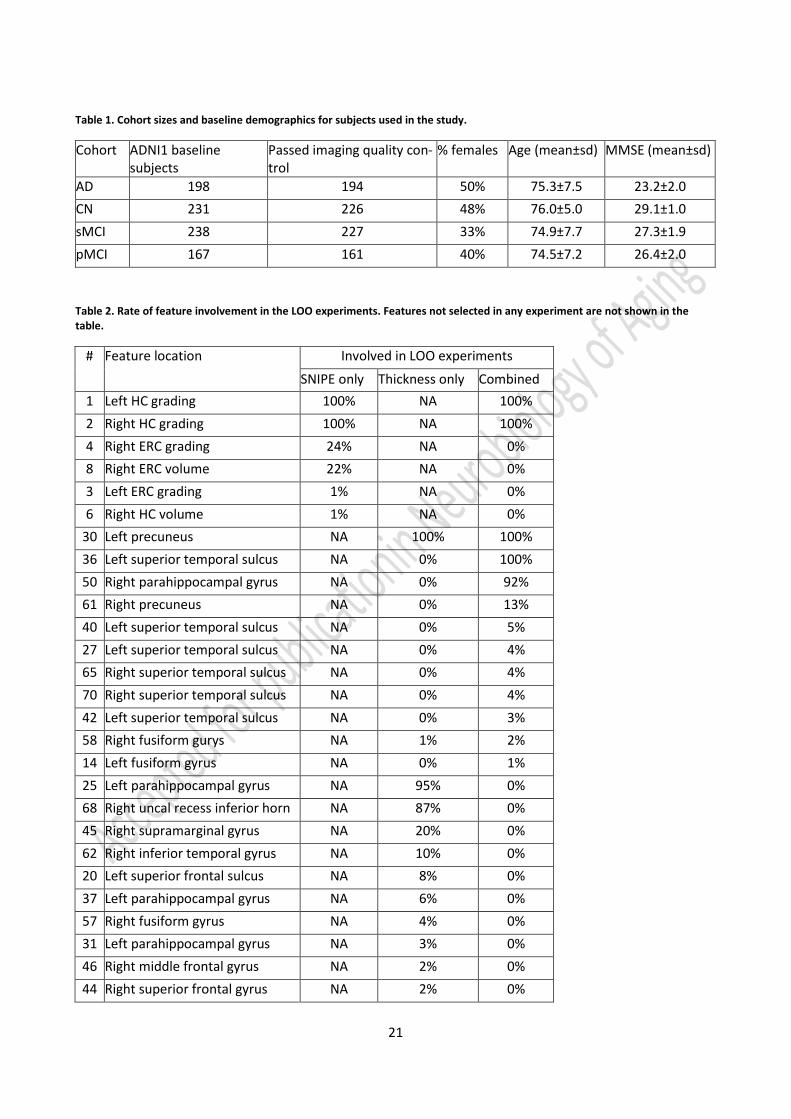
Table 1. Cohort sizes and baseline demographics for subjects used in the study.
Cohort ADNI1 baseline subjects
Passed imaging quality con-trol
% females Age (mean±sd) MMSE (mean±sd)
AD 198 194 50% 75.3±7.5 23.2±2.0
CN 231 226 48% 76.0±5.0 29.1±1.0
sMCI 238 227 33% 74.9±7.7 27.3±1.9
pMCI 167 161 40% 74.5±7.2 26.4±2.0
Table 2. Rate of feature involvement in the LOO experiments. Features not selected in any experiment are not shown in the table.
# Feature location Involved in LOO experiments
SNIPE only Thickness only Combined
1 Left HC grading 100% NA 100%
2 Right HC grading 100% NA 100%
4 Right ERC grading 24% NA 0%
8 Right ERC volume 22% NA 0%
3 Left ERC grading 1% NA 0%
6 Right HC volume 1% NA 0%
30 Left precuneus NA 100% 100%
36 Left superior temporal sulcus NA 0% 100%
50 Right parahippocampal gyrus NA 0% 92%
61 Right precuneus NA 0% 13%
40 Left superior temporal sulcus NA 0% 5%
27 Left superior temporal sulcus NA 0% 4%
65 Right superior temporal sulcus NA 0% 4%
70 Right superior temporal sulcus NA 0% 4%
42 Left superior temporal sulcus NA 0% 3%
58 Right fusiform gurys NA 1% 2%
14 Left fusiform gyrus NA 0% 1%
25 Left parahippocampal gyrus NA 95% 0%
68 Right uncal recess inferior horn NA 87% 0%
45 Right supramarginal gyrus NA 20% 0%
62 Right inferior temporal gyrus NA 10% 0%
20 Left superior frontal sulcus NA 8% 0%
37 Left parahippocampal gyrus NA 6% 0%
57 Right fusiform gyrus NA 4% 0%
31 Left parahippocampal gyrus NA 3% 0%
46 Right middle frontal gyrus NA 2% 0%
44 Right superior frontal gyrus NA 2% 0%
22
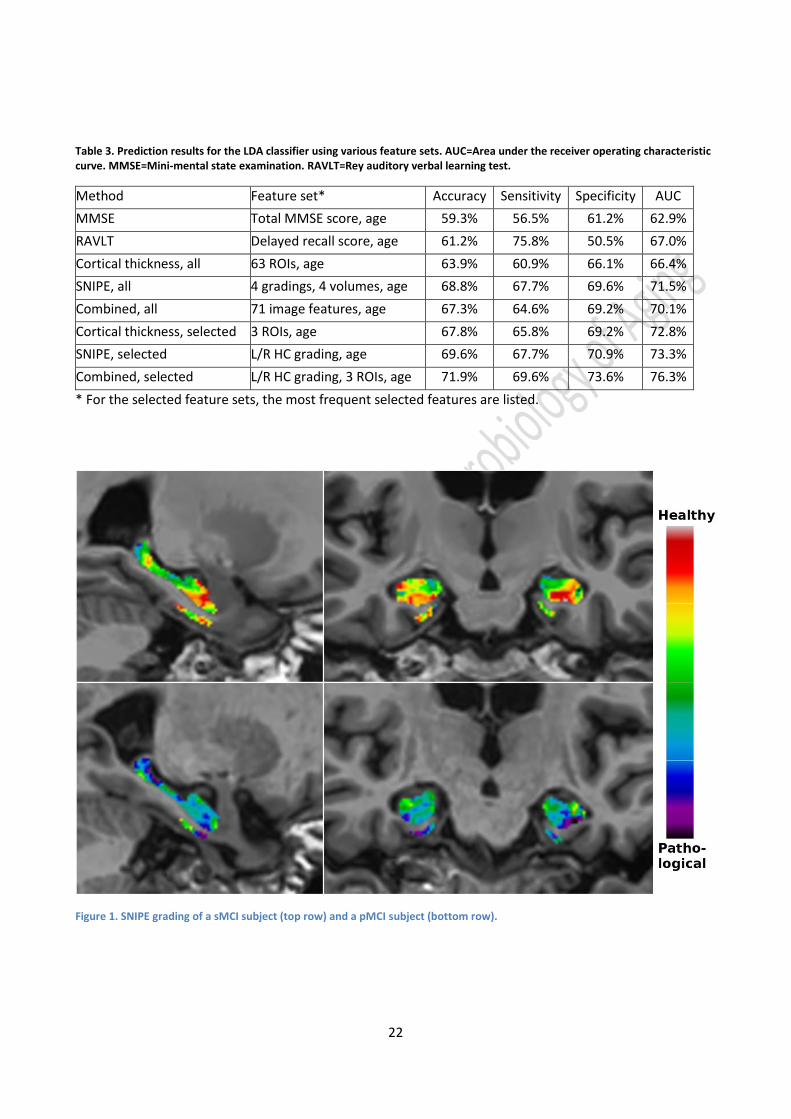
Table 3. Prediction results for the LDA classifier using various feature sets. AUC=Area under the receiver operating characteristic curve. MMSE=Mini-mental state examination. RAVLT=Rey auditory verbal learning test.
Method Feature set* Accuracy Sensitivity Specificity AUC
MMSE Total MMSE score, age 59.3% 56.5% 61.2% 62.9%
RAVLT Delayed recall score, age 61.2% 75.8% 50.5% 67.0%
Cortical thickness, all 63 ROIs, age 63.9% 60.9% 66.1% 66.4%
SNIPE, all 4 gradings, 4 volumes, age 68.8% 67.7% 69.6% 71.5%
Combined, all 71 image features, age 67.3% 64.6% 69.2% 70.1%
Cortical thickness, selected 3 ROIs, age 67.8% 65.8% 69.2% 72.8%
SNIPE, selected L/R HC grading, age 69.6% 67.7% 70.9% 73.3%
Combined, selected L/R HC grading, 3 ROIs, age 71.9% 69.6% 73.6% 76.3%
* For the selected feature sets, the most frequent selected features are listed.
Figure 1. SNIPE grading of a sMCI subject (top row) and a pMCI subject (bottom row).
23
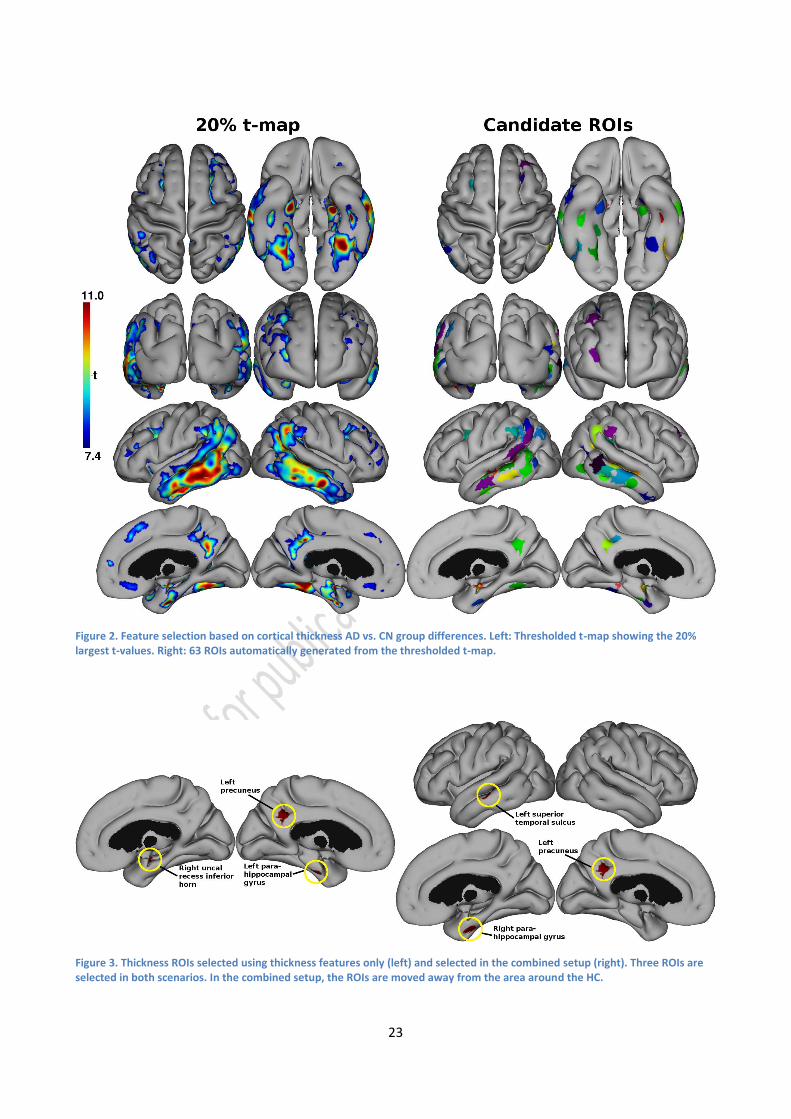
Figure 2. Feature selection based on cortical thickness AD vs. CN group differences. Left: Thresholded t-map showing the 20% largest t-values. Right: 63 ROIs automatically generated from the thresholded t-map.
Figure 3. Thickness ROIs selected using thickness features only (left) and selected in the combined setup (right). Three ROIs are selected in both scenarios. In the combined setup, the ROIs are moved away from the area around the HC.
24
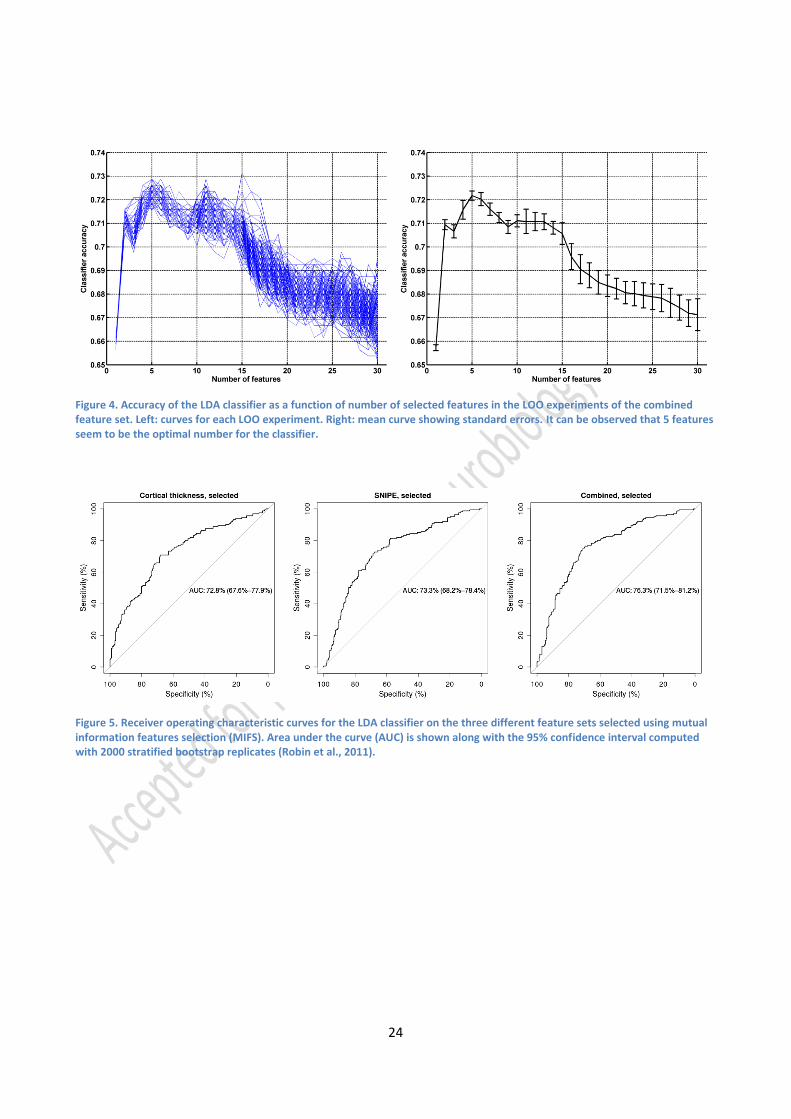
Figure 4. Accuracy of the LDA classifier as a function of number of selected features in the LOO experiments of the combined feature set. Left: curves for each LOO experiment. Right: mean curve showing standard errors. It can be observed that 5 features seem to be the optimal number for the classifier.
Figure 5. Receiver operating characteristic curves for the LDA classifier on the three different feature sets selected using mutual information features selection (MIFS). Area under the curve (AUC) is shown along with the 95% confidence interval computed with 2000 stratified bootstrap replicates (Robin et al., 2011).