Cruise Report Sea Education Association Cruise S-239 ... · sets, and much more. During this...
22
Cruise Report Sea Education Association Cruise S-239 Sustainability in Polynesian Island Cultures and Ecosystems (SPICE) Scientific Data Collected Aboard SSV Robert C. Seamans Papeete, Tahiti, French Polynesia – Tikehau, French Polynesia –Rangiroa, French Polynesia – Nuku Hiva, French Polynesia – Kiritimati Island, Kiribati – Kailua- Kona, Hawaii – Honolulu, Hawaii January 31, 2012 – March 18, 2012 Sea Education Association Woods Hole, Massachusetts
Transcript of Cruise Report Sea Education Association Cruise S-239 ... · sets, and much more. During this...

Cruise Report
Sea Education Association Cruise S-239 Sustainability in Polynesian Island Cultures and Ecosystems
(SPICE)
Scientific Data Collected Aboard SSV Robert C. Seamans
Papeete, Tahiti, French Polynesia – Tikehau, French Polynesia –Rangiroa, French
Polynesia – Nuku Hiva, French Polynesia – Kiritimati Island, Kiribati – Kailua-Kona, Hawaii – Honolulu, Hawaii
January 31, 2012 – March 18, 2012
Sea Education Association Woods Hole, Massachusetts

2
Citation:
Witting, Jan, 2014. Final report for S.E.A. Cruise S-239. Sea Education Association, P.O. Box 6, Woods Hole, MA 02543, USA.
To obtain unpublished data, contact the Chief Scientist or SEA Data Archivist:
Data Archivist Sea Education Association P.O. Box 6 Woods Hole, MA 02543 Phone: 508-540-3954 Fax: 508-457-4673 E-mail: [email protected] Web: www.sea.edu
3
Table of Contents
Ship’s Company 4 Data Description and Cruise Narrative 5 Figure 1: Cruise Track 5
Figure 2: Sea Surface Temperature and Salinity 8
Figure 3: Salinity and Temperature Sections 9
Figure 4: Chlorophyll Fluorescence and Dissolved 10 Oxygen Concentration Sections
Figure 5: ADCP-derived Current Velocity Sections 11
Table 1: Oceanographic Sampling Sections 12
Table 2: Hydrocast Data Summary 15
Table 3: Neuston Net Data Summary 20
Table 4: Meter Net Data Summary 21

4
Ship’s Company, SSV Robert C. Seamans, Cruise S-239 Nautical Staff Sean Bercaw Captain Carl Herzog Chief Mate Meredith Helfrich Second Mate Erin Bostrom Third Mate Seth Murray Engineer James O’Hare Assistant Engineer Laurie Weitzen Steward Scientific Staff Jan Witting Chief Scientist Katherine Hunter First Assistant Scientist Gregory Boyd Second Assistant Scientist Carla Scocchi Third Assistant Scientist Students Meredith Bosco Cornell University Nora Cassidy Carleton College Colleen Doyle Beloit College Melissa Enright Endicott College Jueqian Fang University of Washington, Seattle Anna Farrell Denison University Sarah Feiges Colorado College Hannah Glover Bowdoin College Hannah Gossner Boston University Matthew Harrison Carleton College John Jinishian University of Vermont Samuel Kaiser Denison University Laura Karson Carleton College Hedee Kim Boston University Justin Lawrence Boston College Gabrielle Page Northeastern University Bethany Reynolds Boston University Hallie Robbie Colby College Michelle Rossi Muhlenberg College Marty Schwarz Carleton College Kaitlin Summers St. Lawrence University Ashley Taylor University of Vermont Janie Wong Carleton College
Other Participants Gordon Bigelow Maritime Professor Jane Frye Visitor Paul Niva Visitor Are Raimbault Visitor Teurutahiarii Yoram Pariente Visitor
5
Data Description and Cruise Narrative
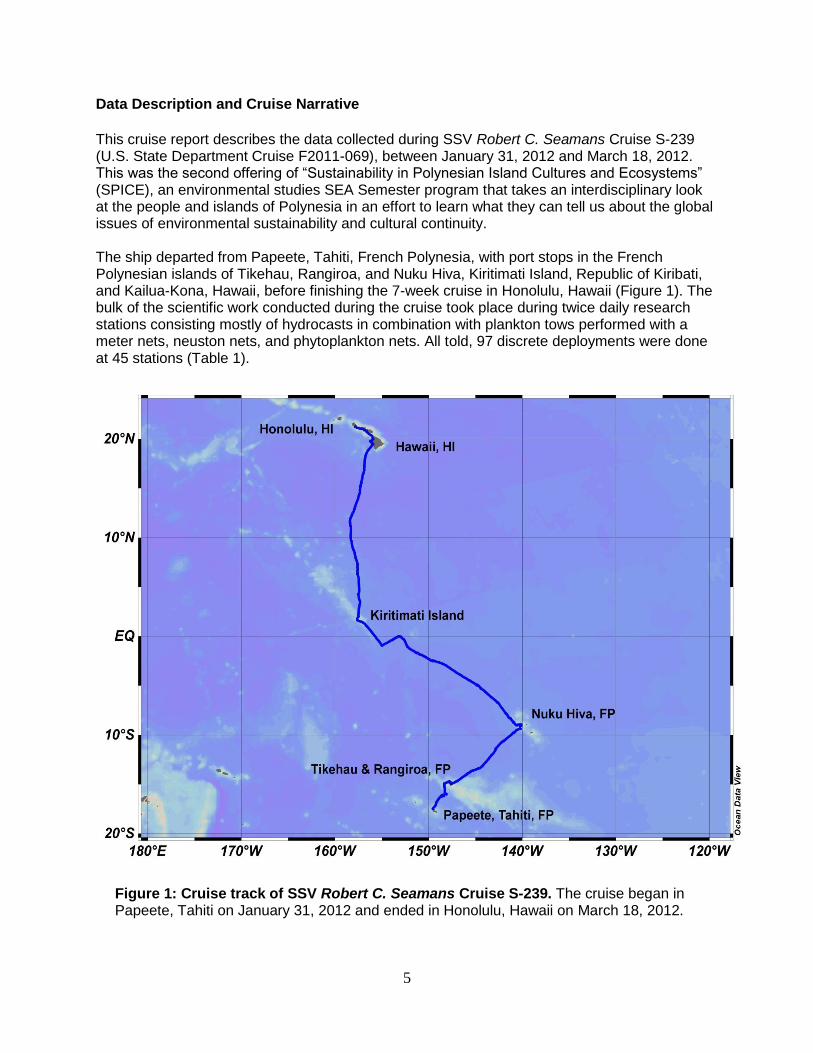
This cruise report describes the data collected during SSV Robert C. Seamans Cruise S-239 (U.S. State Department Cruise F2011-069), between January 31, 2012 and March 18, 2012. This was the second offering of “Sustainability in Polynesian Island Cultures and Ecosystems” (SPICE), an environmental studies SEA Semester program that takes an interdisciplinary look at the people and islands of Polynesia in an effort to learn what they can tell us about the global issues of environmental sustainability and cultural continuity. The ship departed from Papeete, Tahiti, French Polynesia, with port stops in the French Polynesian islands of Tikehau, Rangiroa, and Nuku Hiva, Kiritimati Island, Republic of Kiribati, and Kailua-Kona, Hawaii, before finishing the 7-week cruise in Honolulu, Hawaii (Figure 1). The bulk of the scientific work conducted during the cruise took place during twice daily research stations consisting mostly of hydrocasts in combination with plankton tows performed with a meter nets, neuston nets, and phytoplankton nets. All told, 97 discrete deployments were done at 45 stations (Table 1).
Figure 1: Cruise track of SSV Robert C. Seamans Cruise S-239. The cruise began in Papeete, Tahiti on January 31, 2012 and ended in Honolulu, Hawaii on March 18, 2012.

6
The students joined the ship and professional crew in Papeete, French Polynesia on January 31, 2012. Prior to heading out to sea, we spent 3 days exploring the island of Tahiti. Highlights included visiting a traditional Polynesian double canoe operated by the Voyaging Society, meeting and talking with local French government representatives, visiting the Musee de Tahiti and the beach where Captain Cook set up his instruments to observe the transit of Venus in 1791, swimming at Teahupoo surf spot, sharing a fabulous meal at a community Catholic Church, and listening to two local anthropologists discuss Polynesian tradition and archaeology. We said our farewells and left Tahiti on February 3, headed out to sea towards Tikehau Atoll. The short 3-day passage allowed the students to begin learning the basics of working on deck and in the science lab, and to start getting their sea legs. Oceanographic sampling began almost immediately, and several brief squalls provided the deck watches with good opportunities to learn about sail handling. The cruise included stops at two islands in the Tuamotu archipelago – first at Tikehau Atoll and then at Rangiroa. Both visits included meetings with government officials and tours of the local communities. These activities, coupled with some unscheduled time to wander around on their own, allowed the students to learn much about the culture of these islands and to explore how they are addressing significant issues of sustainability. Tikehau featured a fascinating visit to a coconut plantation, while a highlight on Rangiroa was a breathtakingly beautiful snorkeling expedition. Leaving the Tuamotu archipelago, we sailed a 6-day passage to Nuku Hiva, Marquesas Islands. Scientific sampling continued throughout this transit, with data collected for student projects and ongoing SEA research projects. The students were introduced during afternoon classes to the fundamentals of traditional Polynesian navigation by Tahi, one of our shipboard visitors. They also learned and practiced our haka, a traditional dance of the Marquesan Islands, in preparation for performing it for our new friends and colleagues at Nuku Hiva. We arrived at Nuku Hiva on February 14, and spent four delightful days there. On our first morning, we anchored in Hakatea Bay and hiked up a mountain gorge to a beautiful waterfall and pool nestled within towering rock cliffs. En route to the waterfall, the students made an archaeological survey, documenting built rock structures that were the remnants of an ancient Marquesan settlement. The remaining days of our stay on Nuku Hiva were filled with tours of the island, conversations with many wonderful members of the local community, and even the chance to paddle in an outrigger canoe. At a dance and music festival on our last night there, people from all across the island joined together for a benefit concert, to which we were invited to participate in as well. It made a lasting impression on the students and crew, and we deeply appreciate the great gift of generous hospitality that we received from the Marquesas and her people. Heading back out to sea on February 19, our next port stop was to be in the Northern Hemisphere, with the equator to cross en route. The ten days that followed were full of science deployments, lab analyses, setting and striking of sails, writing, music on deck, sunrises and sets, and much more. During this passage we formally started working on celestial navigation. In addition to weaning ourselves off of the GPS, we also began to put the principles of Polynesian non-instrumental navigation into practice. We learned how to determine our speed by looking at the bubbles over the side of the vessel, how to find our bearing by looking at stars and planets, and how to steer using a star rather than the compass. And, in keeping with maritime tradition, the entire ship’s company also participated in a celebration of “crossing the line” with an afternoon of ceremonial activities that transformed 30 Pollywogs into Shellbacks.
7
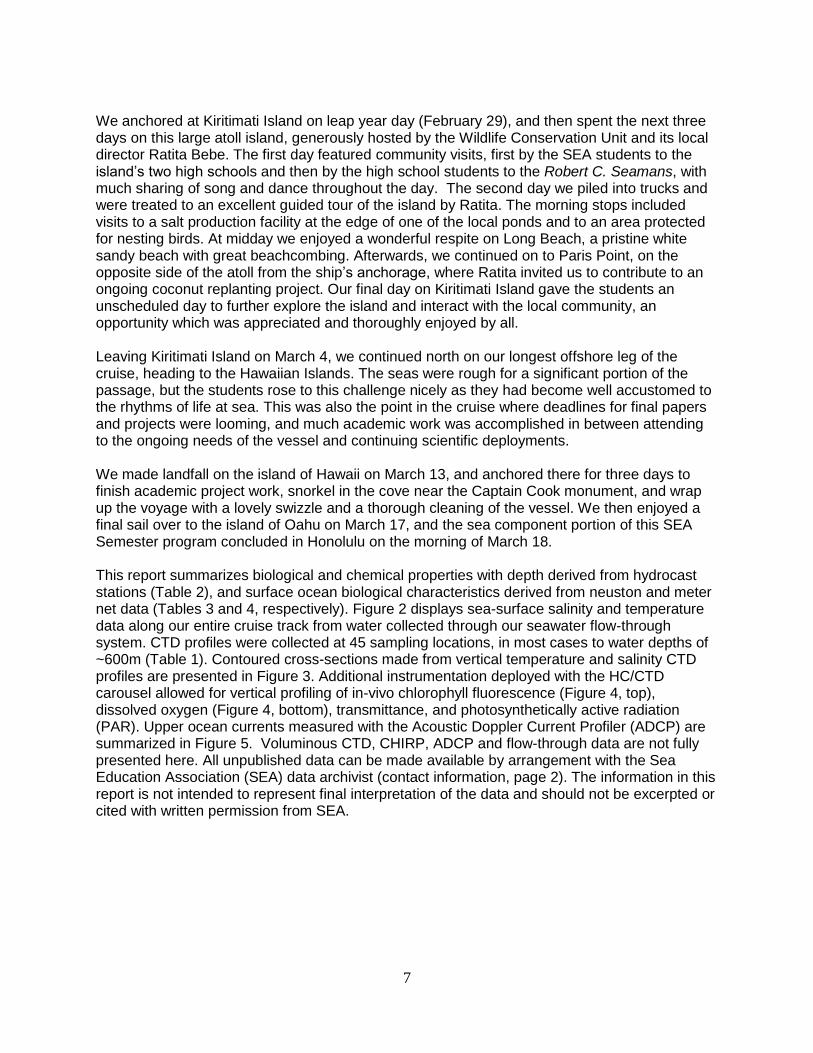
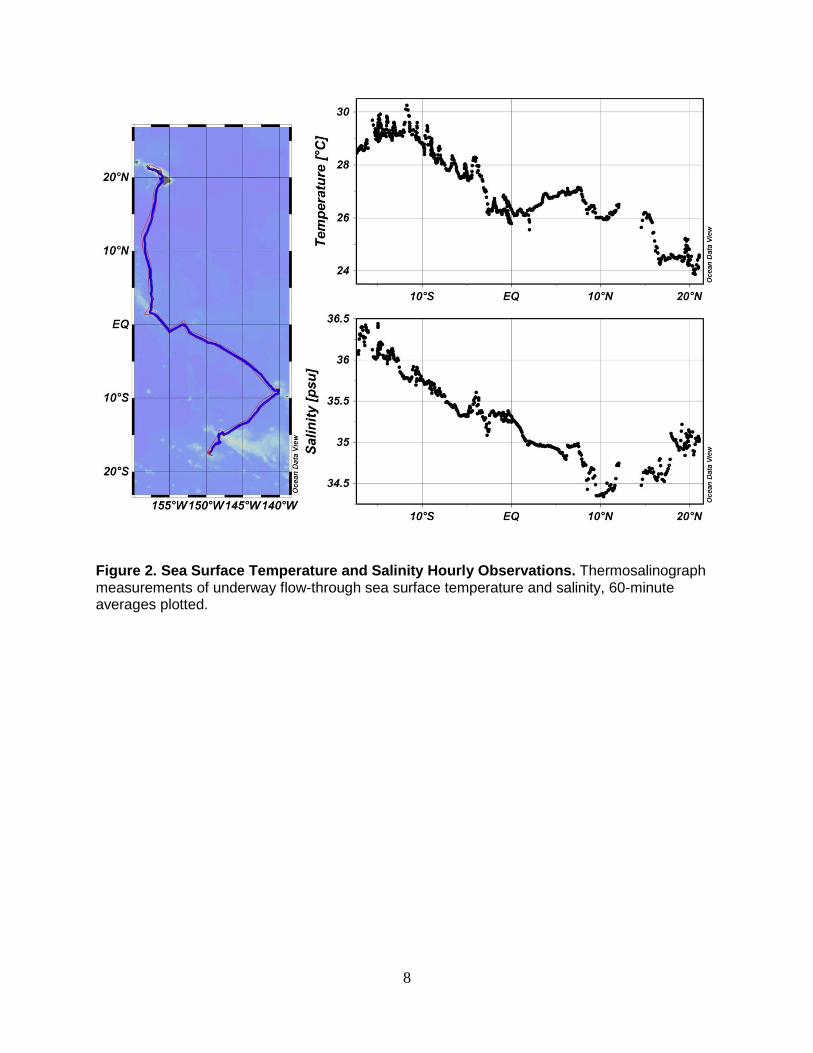
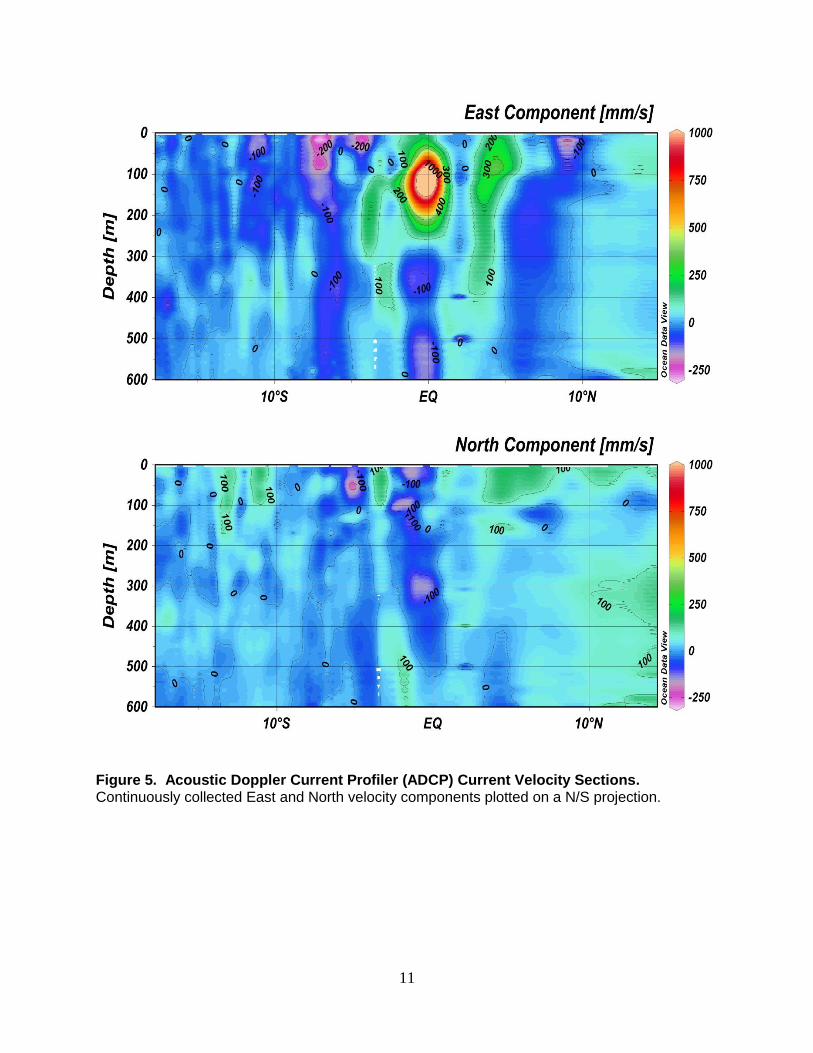
We anchored at Kiritimati Island on leap year day (February 29), and then spent the next three days on this large atoll island, generously hosted by the Wildlife Conservation Unit and its local director Ratita Bebe. The first day featured community visits, first by the SEA students to the island’s two high schools and then by the high school students to the Robert C. Seamans, with much sharing of song and dance throughout the day. The second day we piled into trucks and were treated to an excellent guided tour of the island by Ratita. The morning stops included visits to a salt production facility at the edge of one of the local ponds and to an area protected for nesting birds. At midday we enjoyed a wonderful respite on Long Beach, a pristine white sandy beach with great beachcombing. Afterwards, we continued on to Paris Point, on the opposite side of the atoll from the ship’s anchorage, where Ratita invited us to contribute to an ongoing coconut replanting project. Our final day on Kiritimati Island gave the students an unscheduled day to further explore the island and interact with the local community, an opportunity which was appreciated and thoroughly enjoyed by all. Leaving Kiritimati Island on March 4, we continued north on our longest offshore leg of the cruise, heading to the Hawaiian Islands. The seas were rough for a significant portion of the passage, but the students rose to this challenge nicely as they had become well accustomed to the rhythms of life at sea. This was also the point in the cruise where deadlines for final papers and projects were looming, and much academic work was accomplished in between attending to the ongoing needs of the vessel and continuing scientific deployments. We made landfall on the island of Hawaii on March 13, and anchored there for three days to finish academic project work, snorkel in the cove near the Captain Cook monument, and wrap up the voyage with a lovely swizzle and a thorough cleaning of the vessel. We then enjoyed a final sail over to the island of Oahu on March 17, and the sea component portion of this SEA Semester program concluded in Honolulu on the morning of March 18. This report summarizes biological and chemical properties with depth derived from hydrocast stations (Table 2), and surface ocean biological characteristics derived from neuston and meter net data (Tables 3 and 4, respectively). Figure 2 displays sea-surface salinity and temperature data along our entire cruise track from water collected through our seawater flow-through system. CTD profiles were collected at 45 sampling locations, in most cases to water depths of ~600m (Table 1). Contoured cross-sections made from vertical temperature and salinity CTD profiles are presented in Figure 3. Additional instrumentation deployed with the HC/CTD carousel allowed for vertical profiling of in-vivo chlorophyll fluorescence (Figure 4, top), dissolved oxygen (Figure 4, bottom), transmittance, and photosynthetically active radiation (PAR). Upper ocean currents measured with the Acoustic Doppler Current Profiler (ADCP) are summarized in Figure 5. Voluminous CTD, CHIRP, ADCP and flow-through data are not fully presented here. All unpublished data can be made available by arrangement with the Sea Education Association (SEA) data archivist (contact information, page 2). The information in this report is not intended to represent final interpretation of the data and should not be excerpted or cited with written permission from SEA.
8
Figure 2. Sea Surface Temperature and Salinity Hourly Observations. Thermosalinograph measurements of underway flow-through sea surface temperature and salinity, 60-minute averages plotted.

9
Figure 3. Salinity and Temperature Sections. CTD salinity and temperature profiles plotted on a N/S projection. Data come from all combined hydrocast and CTD stations. Vertical lines represent stations, and intermediate data have been interpolated.

10
Figure 4. Chlorophyll-a Fluorescence and Dissolved Oxygen Sections. CTD-mounted in-situ profiles plotted on a N/S projection. Oxygen data come from all combined hydrocast and CTD stations; vertical lines represent stations, and intermediate data have been interpolated. Chlorophyll-a data come from night stations only to eliminate diel variation.
11
Figure 5. Acoustic Doppler Current Profiler (ADCP) Current Velocity Sections. Continuously collected East and North velocity components plotted on a N/S projection.
12
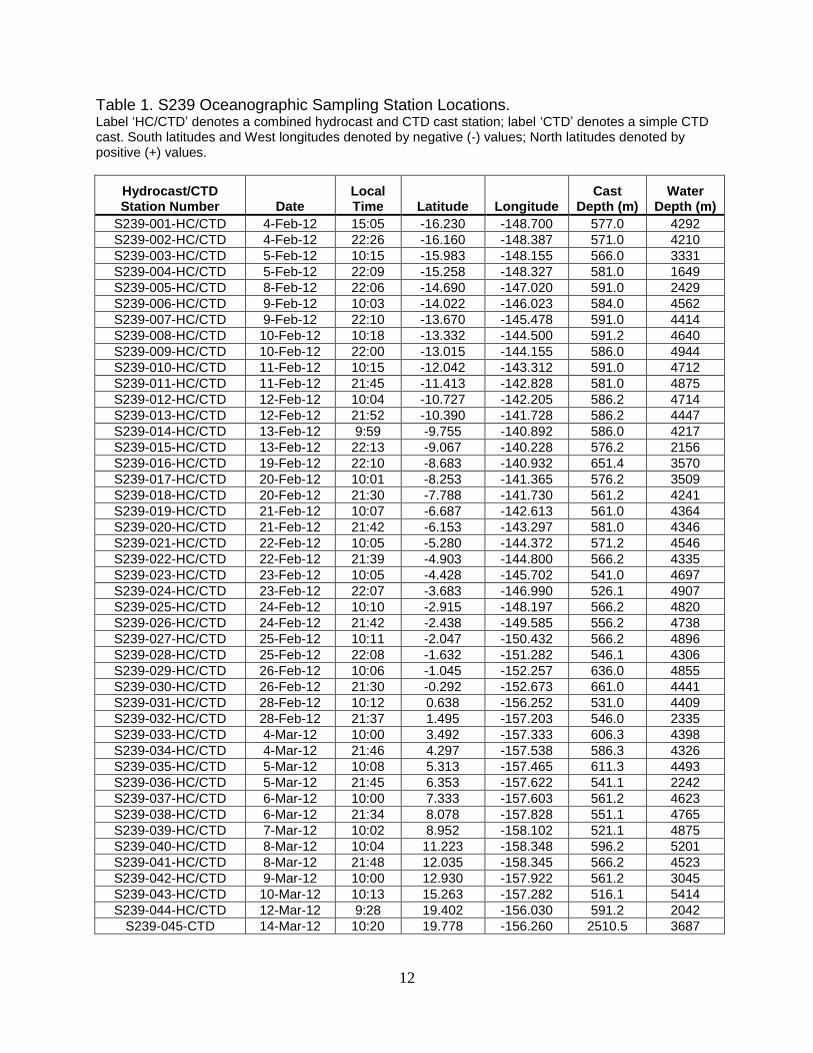
Table 1. S239 Oceanographic Sampling Station Locations. Label ‘HC/CTD’ denotes a combined hydrocast and CTD cast station; label ‘CTD’ denotes a simple CTD cast. South latitudes and West longitudes denoted by negative (-) values; North latitudes denoted by positive (+) values.
Hydrocast/CTD Station Number Date
Local Time Latitude Longitude
Cast Depth (m)
Water Depth (m)
S239-001-HC/CTD 4-Feb-12 15:05 -16.230 -148.700 577.0 4292
S239-002-HC/CTD 4-Feb-12 22:26 -16.160 -148.387 571.0 4210
S239-003-HC/CTD 5-Feb-12 10:15 -15.983 -148.155 566.0 3331
S239-004-HC/CTD 5-Feb-12 22:09 -15.258 -148.327 581.0 1649
S239-005-HC/CTD 8-Feb-12 22:06 -14.690 -147.020 591.0 2429
S239-006-HC/CTD 9-Feb-12 10:03 -14.022 -146.023 584.0 4562
S239-007-HC/CTD 9-Feb-12 22:10 -13.670 -145.478 591.0 4414
S239-008-HC/CTD 10-Feb-12 10:18 -13.332 -144.500 591.2 4640
S239-009-HC/CTD 10-Feb-12 22:00 -13.015 -144.155 586.0 4944
S239-010-HC/CTD 11-Feb-12 10:15 -12.042 -143.312 591.0 4712
S239-011-HC/CTD 11-Feb-12 21:45 -11.413 -142.828 581.0 4875
S239-012-HC/CTD 12-Feb-12 10:04 -10.727 -142.205 586.2 4714
S239-013-HC/CTD 12-Feb-12 21:52 -10.390 -141.728 586.2 4447
S239-014-HC/CTD 13-Feb-12 9:59 -9.755 -140.892 586.0 4217
S239-015-HC/CTD 13-Feb-12 22:13 -9.067 -140.228 576.2 2156
S239-016-HC/CTD 19-Feb-12 22:10 -8.683 -140.932 651.4 3570
S239-017-HC/CTD 20-Feb-12 10:01 -8.253 -141.365 576.2 3509
S239-018-HC/CTD 20-Feb-12 21:30 -7.788 -141.730 561.2 4241
S239-019-HC/CTD 21-Feb-12 10:07 -6.687 -142.613 561.0 4364
S239-020-HC/CTD 21-Feb-12 21:42 -6.153 -143.297 581.0 4346
S239-021-HC/CTD 22-Feb-12 10:05 -5.280 -144.372 571.2 4546
S239-022-HC/CTD 22-Feb-12 21:39 -4.903 -144.800 566.2 4335
S239-023-HC/CTD 23-Feb-12 10:05 -4.428 -145.702 541.0 4697
S239-024-HC/CTD 23-Feb-12 22:07 -3.683 -146.990 526.1 4907
S239-025-HC/CTD 24-Feb-12 10:10 -2.915 -148.197 566.2 4820
S239-026-HC/CTD 24-Feb-12 21:42 -2.438 -149.585 556.2 4738
S239-027-HC/CTD 25-Feb-12 10:11 -2.047 -150.432 566.2 4896
S239-028-HC/CTD 25-Feb-12 22:08 -1.632 -151.282 546.1 4306
S239-029-HC/CTD 26-Feb-12 10:06 -1.045 -152.257 636.0 4855
S239-030-HC/CTD 26-Feb-12 21:30 -0.292 -152.673 661.0 4441
S239-031-HC/CTD 28-Feb-12 10:12 0.638 -156.252 531.0 4409
S239-032-HC/CTD 28-Feb-12 21:37 1.495 -157.203 546.0 2335
S239-033-HC/CTD 4-Mar-12 10:00 3.492 -157.333 606.3 4398
S239-034-HC/CTD 4-Mar-12 21:46 4.297 -157.538 586.3 4326
S239-035-HC/CTD 5-Mar-12 10:08 5.313 -157.465 611.3 4493
S239-036-HC/CTD 5-Mar-12 21:45 6.353 -157.622 541.1 2242
S239-037-HC/CTD 6-Mar-12 10:00 7.333 -157.603 561.2 4623
S239-038-HC/CTD 6-Mar-12 21:34 8.078 -157.828 551.1 4765
S239-039-HC/CTD 7-Mar-12 10:02 8.952 -158.102 521.1 4875
S239-040-HC/CTD 8-Mar-12 10:04 11.223 -158.348 596.2 5201
S239-041-HC/CTD 8-Mar-12 21:48 12.035 -158.345 566.2 4523
S239-042-HC/CTD 9-Mar-12 10:00 12.930 -157.922 561.2 3045
S239-043-HC/CTD 10-Mar-12 10:13 15.263 -157.282 516.1 5414
S239-044-HC/CTD 12-Mar-12 9:28 19.402 -156.030 591.2 2042
S239-045-CTD 14-Mar-12 10:20 19.778 -156.260 2510.5 3687
13
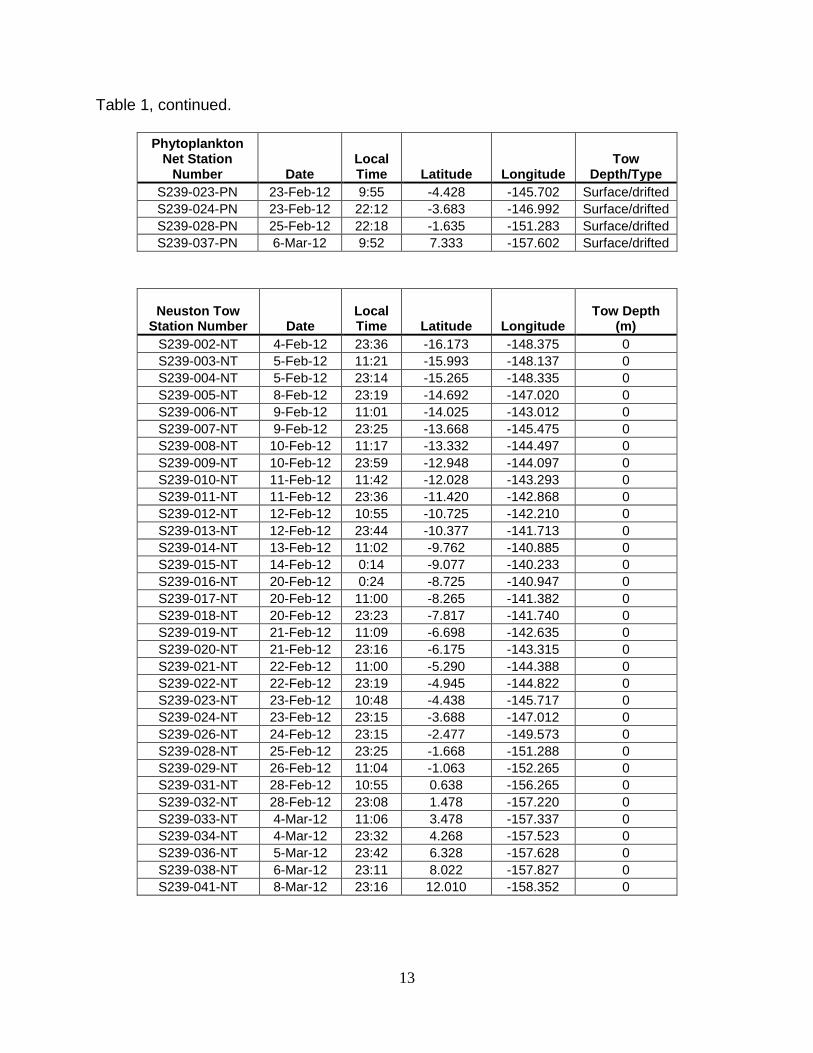
Table 1, continued.
Phytoplankton Net Station
Number Date Local Time Latitude Longitude
Tow Depth/Type
S239-023-PN 23-Feb-12 9:55 -4.428 -145.702 Surface/drifted
S239-024-PN 23-Feb-12 22:12 -3.683 -146.992 Surface/drifted
S239-028-PN 25-Feb-12 22:18 -1.635 -151.283 Surface/drifted
S239-037-PN 6-Mar-12 9:52 7.333 -157.602 Surface/drifted
Neuston Tow Station Number Date
Local Time Latitude Longitude
Tow Depth (m)
S239-002-NT 4-Feb-12 23:36 -16.173 -148.375 0
S239-003-NT 5-Feb-12 11:21 -15.993 -148.137 0
S239-004-NT 5-Feb-12 23:14 -15.265 -148.335 0
S239-005-NT 8-Feb-12 23:19 -14.692 -147.020 0
S239-006-NT 9-Feb-12 11:01 -14.025 -143.012 0
S239-007-NT 9-Feb-12 23:25 -13.668 -145.475 0
S239-008-NT 10-Feb-12 11:17 -13.332 -144.497 0
S239-009-NT 10-Feb-12 23:59 -12.948 -144.097 0
S239-010-NT 11-Feb-12 11:42 -12.028 -143.293 0
S239-011-NT 11-Feb-12 23:36 -11.420 -142.868 0
S239-012-NT 12-Feb-12 10:55 -10.725 -142.210 0
S239-013-NT 12-Feb-12 23:44 -10.377 -141.713 0
S239-014-NT 13-Feb-12 11:02 -9.762 -140.885 0
S239-015-NT 14-Feb-12 0:14 -9.077 -140.233 0
S239-016-NT 20-Feb-12 0:24 -8.725 -140.947 0
S239-017-NT 20-Feb-12 11:00 -8.265 -141.382 0
S239-018-NT 20-Feb-12 23:23 -7.817 -141.740 0
S239-019-NT 21-Feb-12 11:09 -6.698 -142.635 0
S239-020-NT 21-Feb-12 23:16 -6.175 -143.315 0
S239-021-NT 22-Feb-12 11:00 -5.290 -144.388 0
S239-022-NT 22-Feb-12 23:19 -4.945 -144.822 0
S239-023-NT 23-Feb-12 10:48 -4.438 -145.717 0
S239-024-NT 23-Feb-12 23:15 -3.688 -147.012 0
S239-026-NT 24-Feb-12 23:15 -2.477 -149.573 0
S239-028-NT 25-Feb-12 23:25 -1.668 -151.288 0
S239-029-NT 26-Feb-12 11:04 -1.063 -152.265 0
S239-031-NT 28-Feb-12 10:55 0.638 -156.265 0
S239-032-NT 28-Feb-12 23:08 1.478 -157.220 0
S239-033-NT 4-Mar-12 11:06 3.478 -157.337 0
S239-034-NT 4-Mar-12 23:32 4.268 -157.523 0
S239-036-NT 5-Mar-12 23:42 6.328 -157.628 0
S239-038-NT 6-Mar-12 23:11 8.022 -157.827 0
S239-041-NT 8-Mar-12 23:16 12.010 -158.352 0

14
Table 1, continued.
Meter Net Station Number Date
Local Time Latitude Longitude
Tow Depth (m)
S239-009-MN 10-Feb-12 22:50 -13.003 -144.140 74.0
S239-011-MN 11-Feb-12 22:42 -11.408 -142.845 134.5
S239-013-MN 12-Feb-12 22:42 -10.393 -141.723 134.5
S239-015-MN 13-Feb-12 23:20 -9.075 -140.243 138.0
S239-016-MN 19-Feb-12 23:35 -8.702 -140.947 201.0
S239-018-MN 20-Feb-12 22:36 -7.795 -141.745 120.0
S239-020-MN 21-Feb-12 22:31 -6.165 -143.305 198.0
S239-022-MN 22-Feb-12 22:34 -4.920 -144.813 123.9
S239-026-MN 24-Feb-12 22:35 -2.457 -149.583 148.7
S239-030-MN 25-Feb-12 22:26 -0.298 -152.680 63.0
S239-032-MN 28-Feb-12 0:00 1.492 -157.218 208.9
S239-034-MN 4-Mar-12 22:46 4.287 -157.538 127.5
S239-036-MN 5-Mar-12 22:47 6.343 -157.635 169.9
S239-038-MN 6-Mar-12 22:27 8.052 -157.832 85.0
S239-041-MN 8-Mar-12 22:33 12.028 -158.353 148.7
15
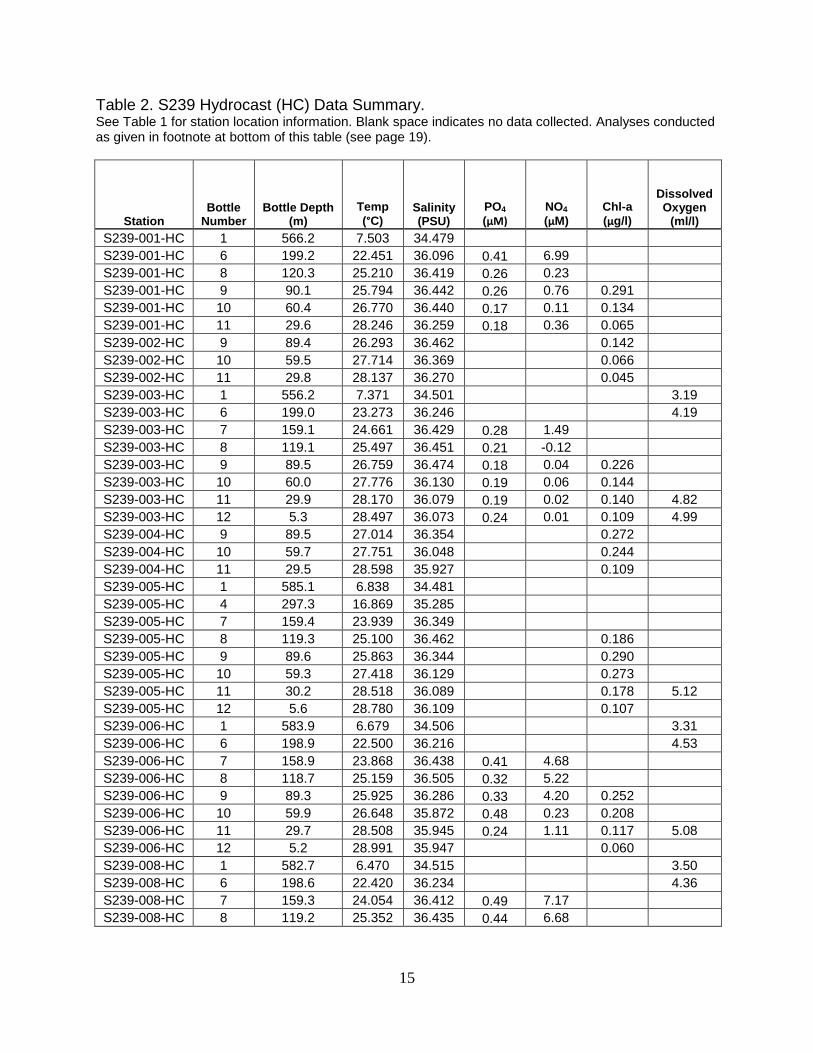
Table 2. S239 Hydrocast (HC) Data Summary. See Table 1 for station location information. Blank space indicates no data collected. Analyses conducted as given in footnote at bottom of this table (see page 19).
Station Bottle
Number Bottle Depth
(m)
Temp
(°C) Salinity (PSU)
PO4
(µM) NO4
(µM)
Chl-a
(µg/l)
Dissolved Oxygen
(ml/l)
S239-001-HC 1 566.2 7.503 34.479
S239-001-HC 6 199.2 22.451 36.096 0.41 6.99
S239-001-HC 8 120.3 25.210 36.419 0.26 0.23
S239-001-HC 9 90.1 25.794 36.442 0.26 0.76 0.291
S239-001-HC 10 60.4 26.770 36.440 0.17 0.11 0.134
S239-001-HC 11 29.6 28.246 36.259 0.18 0.36 0.065
S239-002-HC 9 89.4 26.293 36.462 0.142
S239-002-HC 10 59.5 27.714 36.369 0.066
S239-002-HC 11 29.8 28.137 36.270 0.045
S239-003-HC 1 556.2 7.371 34.501 3.19
S239-003-HC 6 199.0 23.273 36.246 4.19
S239-003-HC 7 159.1 24.661 36.429 0.28 1.49
S239-003-HC 8 119.1 25.497 36.451 0.21 -0.12
S239-003-HC 9 89.5 26.759 36.474 0.18 0.04 0.226
S239-003-HC 10 60.0 27.776 36.130 0.19 0.06 0.144
S239-003-HC 11 29.9 28.170 36.079 0.19 0.02 0.140 4.82
S239-003-HC 12 5.3 28.497 36.073 0.24 0.01 0.109 4.99
S239-004-HC 9 89.5 27.014 36.354 0.272
S239-004-HC 10 59.7 27.751 36.048 0.244
S239-004-HC 11 29.5 28.598 35.927 0.109
S239-005-HC 1 585.1 6.838 34.481
S239-005-HC 4 297.3 16.869 35.285
S239-005-HC 7 159.4 23.939 36.349
S239-005-HC 8 119.3 25.100 36.462 0.186
S239-005-HC 9 89.6 25.863 36.344 0.290
S239-005-HC 10 59.3 27.418 36.129 0.273
S239-005-HC 11 30.2 28.518 36.089 0.178 5.12
S239-005-HC 12 5.6 28.780 36.109 0.107
S239-006-HC 1 583.9 6.679 34.506 3.31
S239-006-HC 6 198.9 22.500 36.216 4.53
S239-006-HC 7 158.9 23.868 36.438 0.41 4.68
S239-006-HC 8 118.7 25.159 36.505 0.32 5.22
S239-006-HC 9 89.3 25.925 36.286 0.33 4.20 0.252
S239-006-HC 10 59.9 26.648 35.872 0.48 0.23 0.208
S239-006-HC 11 29.7 28.508 35.945 0.24 1.11 0.117 5.08
S239-006-HC 12 5.2 28.991 35.947 0.060
S239-008-HC 1 582.7 6.470 34.515 3.50
S239-008-HC 6 198.6 22.420 36.234 4.36
S239-008-HC 7 159.3 24.054 36.412 0.49 7.17
S239-008-HC 8 119.2 25.352 36.435 0.44 6.68

16
Table 2, continued.
Station Bottle
Number Bottle Depth
(m)
Temp
(°C) Salinity (PSU)
PO4
(µM) NO4
(µM)
Chl-a
(µg/l)
Dissolved Oxygen
(ml/l)
S239-008-HC 9 89.9 26.254 36.198 0.44 5.27 0.362
S239-008-HC 10 59.7 28.128 36.067 0.22 3.43 0.293
S239-008-HC 11 29.9 28.660 36.021 0.22 2.22 0.135 4.53
S239-008-HC 12 5.6 28.975 36.029 0.105
S239-010-HC 1 586.7 6.645 34.528 3.53
S239-010-HC 6 198.3 22.199 36.185 0.42 8.82 4.93
S239-010-HC 8 118.7 25.374 36.459 0.46 2.51
S239-010-HC 9 89.6 25.883 36.068 0.60 6.03 0.304
S239-010-HC 10 59.9 27.120 35.724 0.39 9.17 0.317
S239-010-HC 11 30.0 28.199 35.648 0.32 6.67 0.168 4.97
S239-010-HC 12 5.6 28.752 35.683 0.079
S239-012-HC 1 580.6 7.249 34.575 1.12
S239-012-HC 6 198.6 19.975 35.748 1.90
S239-012-HC 7 158.1 23.352 36.358 0.47 7.28
S239-012-HC 8 118.3 24.995 36.421 0.48 7.95
S239-012-HC 9 88.7 26.439 36.098 0.53 7.39 0.352
S239-012-HC 10 59.9 28.052 35.783 0.30 5.01 0.485
S239-012-HC 11 30.0 28.349 35.761 5.91 0.393 2.79
S239-012-HC 12 5.1 28.804 35.773 0.134
S239-014-HC 1 580.9 7.170 34.567 3.37
S239-014-HC 6 198.9 18.822 35.576 4.29
S239-014-HC 7 158.9 22.216 36.155 0.69 9.04
S239-014-HC 8 119.5 24.782 36.053 0.77 13.88
S239-014-HC 9 89.4 26.313 35.668 0.83 18.32 0.190
S239-014-HC 10 57.0 27.382 35.596 0.54 7.34 0.409
S239-014-HC 11 29.8 27.558 35.609 0.39 7.96 0.781 5.17
S239-014-HC 12 5.2 28.216 35.626 0.213
S239-016-HC 7 159.2 20.520 35.778 0.64 19.44
S239-016-HC 8 118.6 23.873 35.982 0.47 18.13 0.034
S239-016-HC 9 89.1 26.653 35.573 0.51 19.82 0.043
S239-016-HC 10 59.8 27.334 35.586 0.44 10.95 0.270
S239-016-HC 11 29.9 27.803 35.608 0.35 6.60 0.352
S239-016-HC 12 5.5 28.018 35.613 0.47 7.19 0.190
S239-017-HC 7 159.1 19.699 35.607 0.95 22.61
S239-017-HC 8 118.9 24.806 35.856 0.74 15.20 0.136
S239-017-HC 9 88.7 26.525 35.585 0.47 13.72 0.282
S239-017-HC 10 59.4 27.321 35.529 0.44 13.54 0.808
S239-017-HC 11 29.4 27.707 35.489 0.58 13.17 0.334
S239-017-HC 12 5.3 27.915 35.492 0.46 12.70 0.149
S239-018-HC 8 119.2 24.148 35.983 0.134
S239-018-HC 9 89.4 25.977 35.634 0.204
S239-018-HC 10 59.1 26.862 35.487 0.378

17
Table 2, continued.
Station Bottle
Number Bottle Depth
(m)
Temp
(°C) Salinity (PSU)
PO4
(µM) NO4
(µM)
Chl-a
(µg/l)
Dissolved Oxygen
(ml/l)
S239-018-HC 11 29.6 27.686 35.474 0.151
S239-018-HC 12 5.2 27.843 35.469 0.091
S239-019-HC 1 553.7 7.631 34.604 2.35
S239-019-HC 6 199.1 13.764 34.963 0.64
S239-019-HC 7 159.1 16.949 35.270 1.10 43.77
S239-019-HC 8 118.9 21.772 35.961 0.71 19.00 0.148
S239-019-HC 9 88.8 25.774 35.482 0.74 17.10 0.321
S239-019-HC 10 59.7 26.706 35.382 0.49 16.75 0.338
S239-019-HC 11 29.7 27.241 35.385 0.46 14.27 0.225 4.47
S239-019-HC 12 5.2 27.648 35.352 0.57 16.59 0.107
S239-021-HC 7 158.8 16.137 35.201 1.63 41.77
S239-021-HC 8 119.0 23.708 35.620 0.71 21.71 0.321
S239-021-HC 9 89.4 25.712 35.207 0.82 19.29 0.338
S239-021-HC 10 59.6 26.179 35.176 0.73 19.52 0.340
S239-021-HC 11 29.6 26.896 35.241 0.70 15.07 0.039
S239-021-HC 12 5.4 27.255 35.238 0.69 17.17 0.107
S239-022-HC 8 119.0 24.028 35.176 0.314
S239-022-HC 9 89.8 25.909 35.202 0.301
S239-022-HC 10 59.4 26.268 35.178 0.277
S239-022-HC 11 29.7 26.938 35.252 0.127
S239-022-HC 12 5.9 27.208 35.231 0.078
S239-023-HC 7 158.8 16.408 35.397 1.59 38.52
S239-023-HC 8 118.4 22.689 35.582 0.95 25.47 0.324
S239-023-HC 9 89.1 24.990 35.380 0.64 19.97 0.293
S239-023-HC 10 59.6 26.144 35.321 0.57 21.00 0.262
S239-023-HC 11 29.8 26.870 35.306 0.68 17.17 0.171
S239-023-HC 12 5.6 27.312 35.293 0.69 17.01 0.083
S239-024-HC 1 520.9 7.330 34.595 1.58
S239-024-HC 6 198.5 12.382 34.904 1.06
S239-024-HC 11 29.5 27.549 35.471 4.66
S239-025-HC 1 560.0 7.283 34.599 0.97
S239-025-HC 6 198.8 12.851 34.929 0.62
S239-025-HC 7 158.6 13.591 35.013 2.20 62.19
S239-025-HC 8 118.2 22.343 35.586 0.86 23.61 0.246
S239-025-HC 9 89.7 25.020 35.214 0.78 17.62 0.303
S239-025-HC 10 60.4 26.693 35.464 0.66 13.56 0.255
S239-025-HC 11 29.6 26.559 35.231 0.61 16.91 0.140 2.10
S239-025-HC 12 5.4 26.702 35.213 0.53 16.78 0.128
S239-027-HC 1 559.6 7.745 34.616 1.66
S239-027-HC 6 198.7 12.735 34.923 1.33
S239-027-HC 7 159.3 14.233 35.036 1.84 62.54
S239-027-HC 8 119.2 22.722 35.516 0.86 25.02 0.272
S239-027-HC 9 89.6 25.032 35.277 0.61 15.94 0.324

18
Table 2, continued.
Station Bottle
Number Bottle Depth
(m)
Temp
(°C) Salinity (PSU)
PO4
(µM) NO4
(µM)
Chl-a
(µg/l)
Dissolved Oxygen
(ml/l)
S239-027-HC 10 58.9 25.810 35.293 0.48 17.68 0.263
S239-027-HC 11 29.7 26.013 35.295 0.46 16.04 0.175 4.91
S239-027-HC 12 5.1 26.176 35.294 0.52 18.04 0.125
S239-028-HC 9 89.5 25.622 35.229 0.69 17.71 0.202
S239-028-HC 10 59.4 25.819 35.237 0.48 16.88 0.227
S239-028-HC 11 30.1 25.929 35.250 0.65 16.39 0.151
S239-028-HC 12 5.7 25.968 35.254 0.56 21.55 0.119
S239-029-HC 7 158.9 14.813 35.193 1.43 45.28
S239-029-HC 8 118.9 20.621 35.605 1.18 32.72 0.100
S239-029-HC 9 89.8 24.705 35.328 0.79 20.48 0.374
S239-029-HC 10 59.1 25.774 35.213 0.49 16.62 0.301
S239-029-HC 11 29.9 25.760 35.193 0.58 0.230
S239-029-HC 12 5.3 25.841 35.193 0.66 16.52 0.201
S239-030-HC 1 595.6 6.841 34.572 0.79
S239-030-HC 6 199.1 13.145 34.973 1.32
S239-030-HC 11 30.2 25.381 35.191 1.90
S239-031-HC 7 158.6 15.023 34.972 1.29 39.58
S239-031-HC 8 120.1 23.742 35.295 0.77 19.87 0.110
S239-031-HC 9 89.9 24.820 35.297 0.69 18.58 0.234
S239-031-HC 10 59.6 25.336 35.182 0.50 15.46 0.450
S239-031-HC 11 29.8 25.661 35.144 0.55 15.72 0.345
S239-031-HC 12 5.8 25.827 35.134 0.59 15.88 0.307
S239-032-HC 7 159.0 13.367 34.710 1.34 52.49
S239-032-HC 8 119.9 23.224 34.929 0.76 25.63 0.091
S239-032-HC 9 89.5 23.976 35.000 0.78 21.90 0.158
S239-032-HC 10 59.9 25.427 34.979 0.65 11.92 0.385
S239-032-HC 11 29.5 25.689 34.967 0.57 12.56 0.321
S239-032-HC 12 5.4 25.796 34.960 0.56 14.17 0.282
S239-033-HC 7 158.8 15.769 34.733 1.43 53.45
S239-033-HC 8 119.3 24.939 34.937 0.72 25.18 0.180
S239-033-HC 9 90.3 26.222 34.871 0.58 11.43 0.232
S239-033-HC 10 58.9 26.264 34.870 0.58 9.55 0.253
S239-033-HC 11 30.2 26.280 34.871 0.51 11.50 0.246
S239-033-HC 12 5.1 26.305 34.870 0.56 10.48 0.233
S239-034-HC 3 397.3 8.583 34.629 1.67
S239-034-HC 6 198.5 11.159 34.685 0.89
S239-034-HC 11 30.0 26.458 34.869 4.45
S239-035-HC 7 158.1 13.342 34.665 1.88 26.01
S239-035-HC 8 118.7 19.237 34.778 1.02 55.75
S239-035-HC 9 88.3 26.515 34.827 0.41 6.35 0.356
S239-035-HC 10 60.4 26.582 34.825 0.34 5.30 0.411
S239-035-HC 11 30.0 26.594 34.824 0.33 4.58 0.384
S239-035-HC 12 FlowThrough 26.9 34.90 0.31 3.81 0.328

19
Table 2, continued.
Station Bottle
Number Bottle Depth
(m)
Temp
(°C) Salinity (PSU)
PO4
(µM) NO4
(µM)
Chl-a
(µg/l)
Dissolved Oxygen
(ml/l)
S239-037-HC 7 159.3 11.494 34.560 2.30 40.68
S239-037-HC 8 119.2 13.868 34.469 1.34 47.67
S239-037-HC 9 90.3 24.372 34.898 0.35 4.11 0.353
S239-037-HC 10 59.3 26.674 34.891 0.32 4.73 0.341
S239-037-HC 11 29.5 26.698 34.892 0.33 4.37 0.316
S239-037-HC 12 FlowThrough 27.0 34.97 0.29 4.35 0.273
S239-039-HC 7 159.6 11.614 34.583 2.30 33.60
S239-039-HC 8 119.0 13.187 34.426 1.64 56.50 0.289
S239-039-HC 9 89.7 19.844 34.771 0.54 7.70 0.436
S239-039-HC 10 59.8 26.132 34.604 0.28 1.13 0.110
S239-039-HC 11 28.9 26.146 34.607 0.31 1.16 0.105
S239-039-HC 12 FlowThrough 26.5 34.69 0.24 1.06 0.095
S239-040-HC 7 157.7 12.817 34.333 1.79 53.54
S239-040-HC 8 119.6 18.814 34.661 0.73 18.13 0.363
S239-040-HC 9 89.1 25.656 34.708 0.24 1.12 0.367
S239-040-HC 10 59.8 25.814 34.361 0.24 1.01 0.124
S239-040-HC 11 28.9 25.805 34.356 0.22 1.08 0.105
S239-040-HC 12 FlowThrough 26.1 34.44 0.16 1.12 0.097
S239-042-HC 7 158.6 16.162 34.685 0.63 0.54
S239-042-HC 8 119.9 20.357 35.061 0.32 5.99
S239-042-HC 9 88.4 22.928 35.068 0.21 0.92
S239-042-HC 10 59.0 24.727 34.495 0.27 1.03
S239-042-HC 11 28.8 25.526 34.502 0.23 0.92
S239-042-HC 12 5.4 25.534 34.503 0.19 0.93
S239-044-HC 7 158.9 19.130 34.947 0.38
S239-044-HC 8 119.2 23.781 35.102 0.19 9.43 0.128
S239-044-HC 9 89.6 24.102 35.017 0.19 1.02 0.209
S239-044-HC 10 59.9 24.057 34.933 0.25 1.05 0.239
S239-044-HC 11 29.7 24.084 34.901 0.99 0.187
S239-044-HC 12 6.0 24.101 34.896 0.21 1.05 0.157
Notes: Temperature and salinity data determined from a SeaBird 19Plus V2 CTD. CTD profiles from these hydrocast stations, along with PAR, dissolved oxygen, chlorophyll fluorescence, and transmittance profiles are available from SEA. Nutrients (PO4 and NO3) were assessed with
colorometric spectrophotometry. Extracted chlorophyll-a samples were filtered through 0.45 µm filters
and measured with a Turner Designs Model 10-AU fluorometer. Dissolved oxygen content of water samples was determined by Winkler titration. Bottle 12 samples indicated at 'Flow Through' depths were taken from ship's seawater flow-through system.

20
Table 3. S239 Neuston Tow (NT) Data Summary. See Table 1 for station location information. Details about types of organisms recovered in each tow and quantitative 100-count data of zooplankton samples are available from SEA. Additional explanatory notes are given at bottom of this table.
Station Tow Area
(m2)
Zooplankton Biovolume
(cm3)
Zooplankton Density (cm
3/m
2)
S239-002-NT 1688 4.5 0.0027
S239-003-NT 2207 16.0 0.0073
S239-004-NT 2430 7.5 0.0031
S239-005-NT 2071 43.0 0.0208
S239-006-NT 1340 6.5 0.0048
S239-007-NT 2402 26.0 0.0108
S239-008-NT 1666 18.0 0.0108
S239-009-NT 2439 141.0 0.0578
S239-010-NT 2117 32.0 0.0151
S239-011-NT 2921 55.0 0.0188
S239-012-NT 1528 24.0 0.0157
S239-013-NT 1822 10.0 0.0055
S239-014-NT 2349 8.0 0.0034
S239-015-NT 868 83.0 0.0956
S239-016-NT 2519 1269.0 0.5038
S239-017-NT 2658 14.0 0.0053
S239-018-NT 2523 22.0 0.0087
S239-019-NT 1704 10.0 0.0059
S239-020-NT 1912 41.0 0.0214
S239-021-NT 2032 9.5 0.0047
S239-022-NT 2191 18.0 0.0082
S239-023-NT 1661 10.0 0.0060
S239-024-NT 1653 43.0 0.0260
S239-026-NT 1902 20.0 0.0105
S239-028-NT 2808 43.2 0.0154
S239-029-NT 2778 16.0 0.0058
S239-031-NT 2337 9.0 0.0039
S239-032-NT 1651 29.0 0.0176
S239-033-NT 2038 4.5 0.0022
S239-034-NT 2135 36.0 0.0169
S239-036-NT 1681 29.0 0.0173
S239-038-NT 2712 6.0 0.0022
S239-041-NT 2584 4.0 0.0015
Notes: Tow area calculated using distance (meters) between successive minutes' GPS position. Neuston net opening 1.0m
wide by 0.5m tall, with a 333µm mesh net. Zooplankton density
recorded as wet volume displacement of zooplankton biomass per tow area (cm
3/m
2).

21
Table 4. S239 Meter Net (MN) Data Summary. See Table 1 for station information. Details about types of organisms recovered in each tow and quantitative 100-count data of zooplankton samples are available from SEA. Additional explanatory notes are given at bottom of this table.
Station
Tow Depth
(m)
Tow Length
(m)
Tow Volume
(m3)
Zooplankton Biomass
(cm3)
Zooplankton Density (cm
3/m
3)
S239-009-MN 74.0 1677.214 1316.6 116.0 0.0881
S239-011-MN 134.5 1080.068 847.9 50.0 0.0590
S239-013-MN 134.5 1248.786 980.3 86.0 0.0877
S239-015-MN 138.0 1414.967 1110.7 119.0 0.1071
S239-016-MN 201.0 1193.090 936.6 251.0 0.2680
S239-018-MN 120.0 1106.261 868.4 78.0 0.0898
S239-020-MN 198.0 919.548 721.8 33.0 0.0457
S239-022-MN 123.9 1129.090 886.3 54.0 0.0609
S239-026-MN 148.7 1111.655 872.6 123.5 0.1415
S239-030-MN 63.0 1223.207 960.2 152.0 0.1583
S239-032-MN 208.9 1230.923 966.3 146.0 0.1511
S239-034-MN 127.5 1292.841 1014.9 86.0 0.0847
S239-036-MN 169.9 1105.006 867.4 95.0 0.1095
S239-038-MN 85.0 1456.725 1144.7 36.0 0.0314
S239-041-MN 148.7 1226.732 964.2 40.0 0.0415
Notes: Meter net (MN) mesh size = 333µm. Maximum tow depth determined with
Minilog sensor attached to net. Tow volume (m3) calculated by multiplying tow
length (m) by net area (0.785m2). Zooplankton density recorded as wet volume
displacement of zooplankton biomass (cm3) per tow volume (m
3).

22