Crop Production · 2015-09-19 · Physiographic Regions • Northern Piedmont – Bordered by the...
82
Crop Production DCR Training July 2011
Transcript of Crop Production · 2015-09-19 · Physiographic Regions • Northern Piedmont – Bordered by the...

Crop Production
DCR Training July 2011
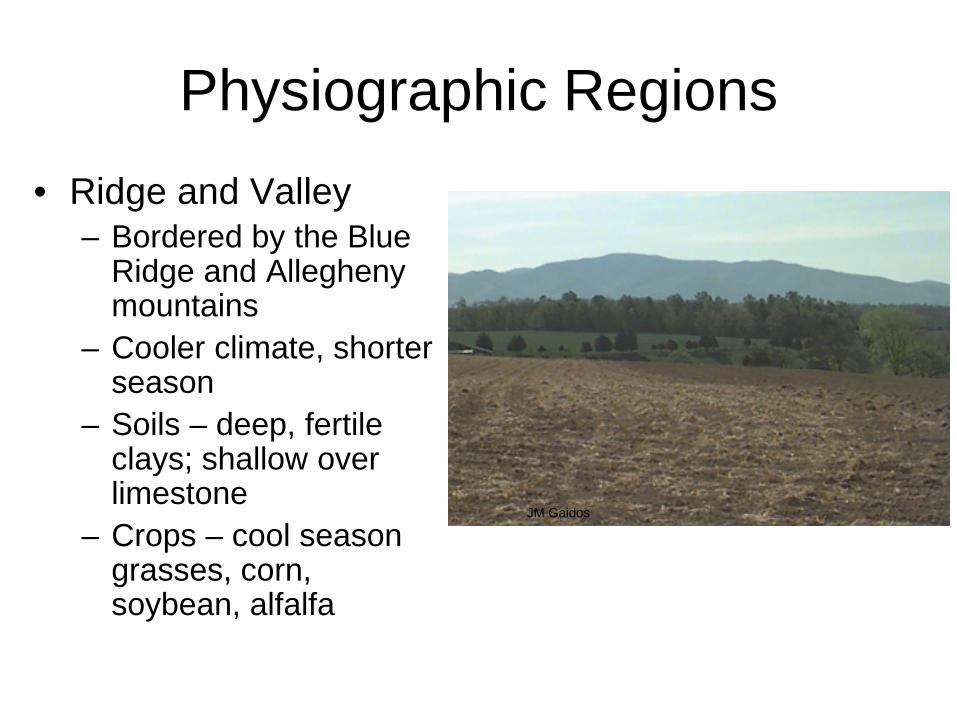
Physiographic Regions • Ridge and Valley
– Bordered by the Blue Ridge and Allegheny mountains
– Cooler climate, shorter season
– Soils – deep, fertile clays; shallow over limestone
– Crops – cool season grasses, corn, soybean, alfalfa
JM Gaidos

Physiographic Regions
• Northern Piedmont – Bordered by the Blue Ridge
and Coastal Plain – 600-700 ft lower in elevation – Soils – granite derived, red,
high in clay, acidic, low OM – Reduced tillage practices to
decrease erosion – Crops – CS grasses, corn,
soybean, small grains
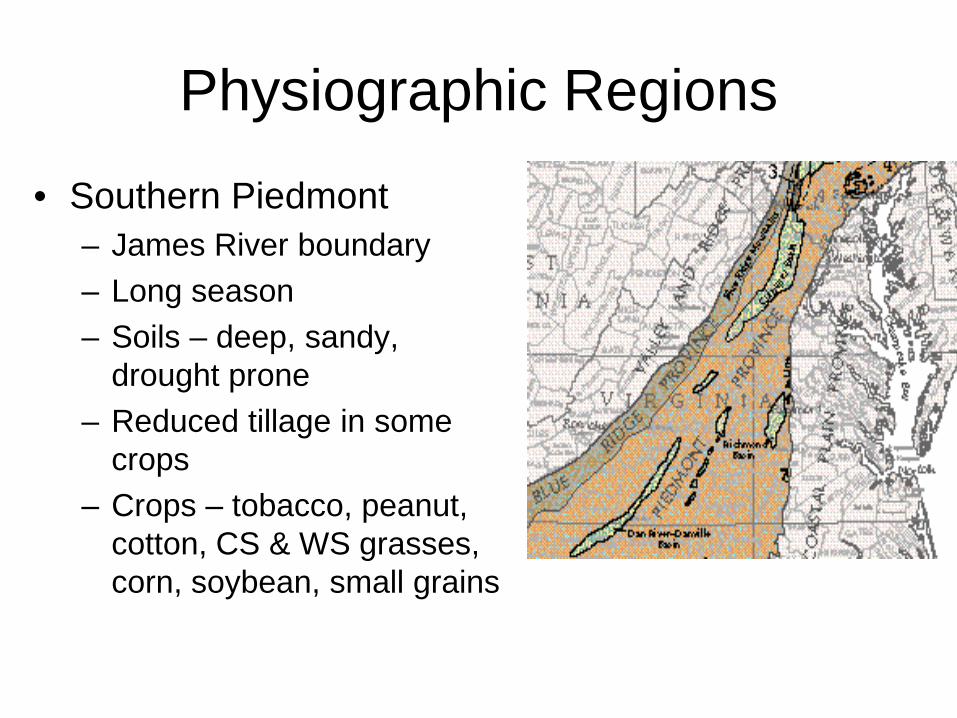
Physiographic Regions
• Southern Piedmont – James River boundary – Long season – Soils – deep, sandy,
drought prone – Reduced tillage in some
crops – Crops – tobacco, peanut,
cotton, CS & WS grasses, corn, soybean, small grains

Physiographic Regions
• Coastal Plain – Begins at fall line on west – Long season – Soils – v.deep, high in
sand, low clay and OM, drought prone
– Reduced tillage in most crops
– Crops – corn, soybean, small grains, vegetables


Harvested Acres, 2000-2011
0
200
400
600
800
1000
1200
1400
1600H
arve
sted
Acr
es (1
000'
s)
Barley
Corn For Grain
Corn For Silage
Cotton
Alfalfa hay
Grass Hay
Peanuts
Soybeans
Tobacco
Wheat

Harvested Acres, 2000-2011
0
100
200
300
400
500
600
Har
vest
ed A
cres
(100
0's) Barley
Corn For Grain
Corn For Silage
Cotton
Peanuts
Soybeans
Tobacco
Wheat
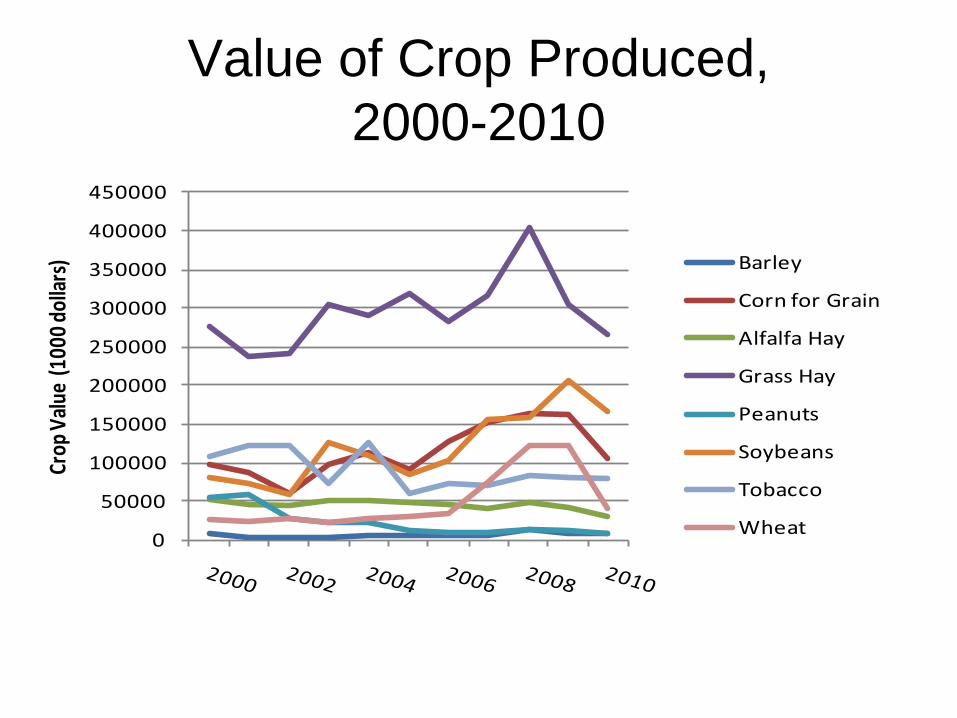
Value of Crop Produced, 2000-2010
0
50000
100000
150000
200000
250000
300000
350000
400000
450000
Crop
Val
ue (1
000
dolla
rs) Barley
Corn for Grain
Alfalfa Hay
Grass Hay
Peanuts
Soybeans
Tobacco
Wheat
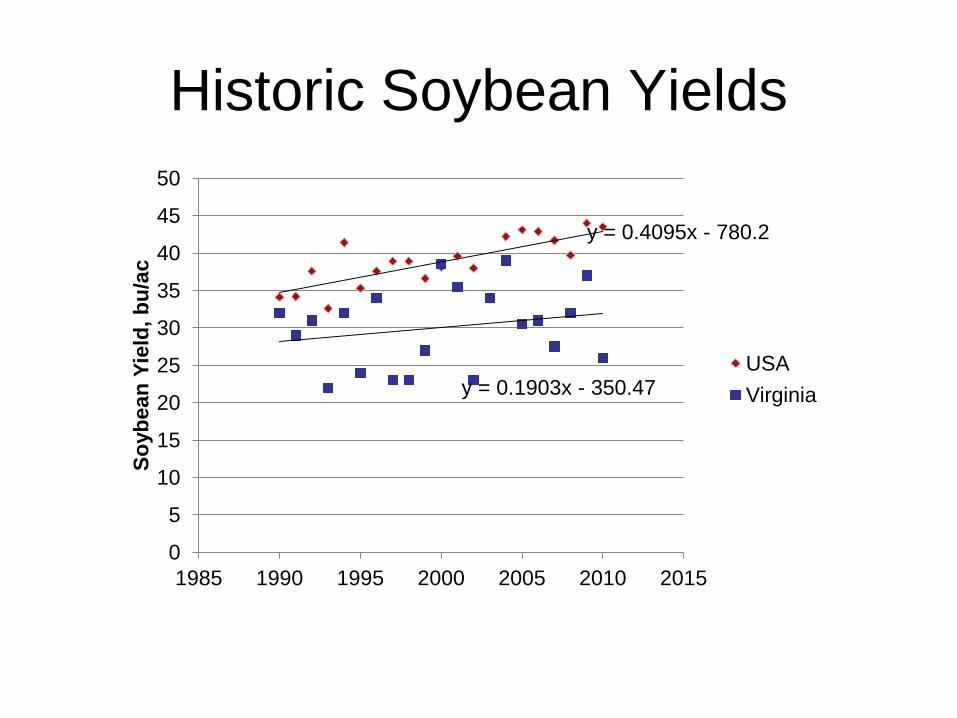
Historic Soybean Yields
y = 0.4095x - 780.2
y = 0.1903x - 350.47
0
5
10
15
20
25
30
35
40
45
50
1985 1990 1995 2000 2005 2010 2015
Soyb
ean
Yiel
d, b
u/ac
USA Virginia
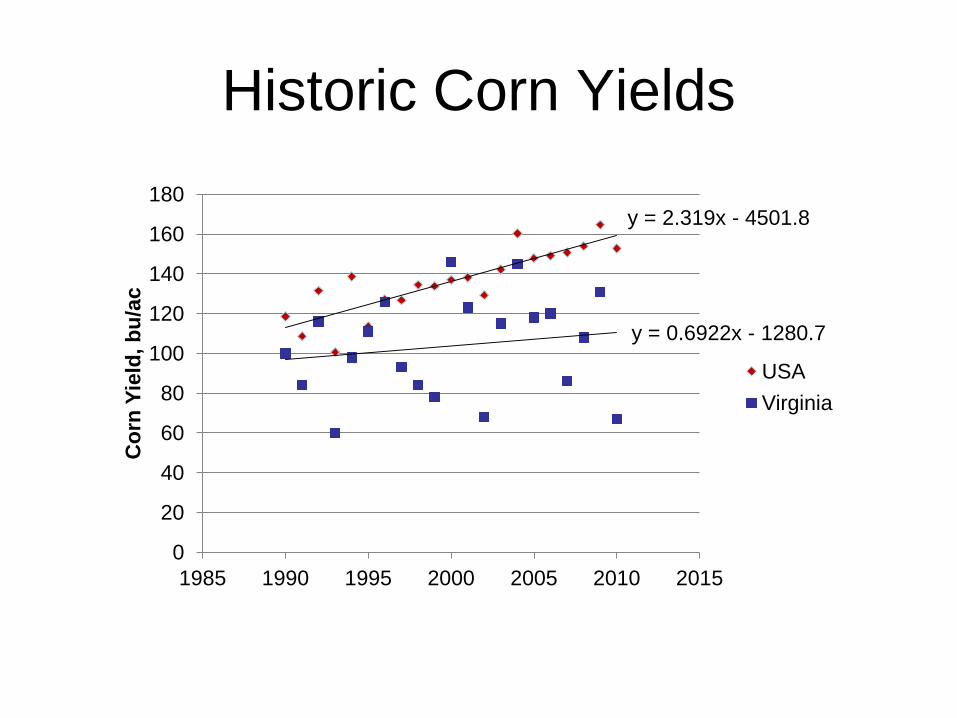
Historic Corn Yields
y = 2.319x - 4501.8
y = 0.6922x - 1280.7
0
20
40
60
80
100
120
140
160
180
1985 1990 1995 2000 2005 2010 2015
Cor
n Yi
eld,
bu/
ac
USA Virginia

Historic Wheat Yields
y = 0.3629x - 685.35
y = 0.4636x - 869.75
0
10
20
30
40
50
60
70
80
1985 1990 1995 2000 2005 2010 2015
Whe
at Y
ield
, bu/
ac
USA Virginia
What Drives Emergence and Vegetative Growth in Most Plants?
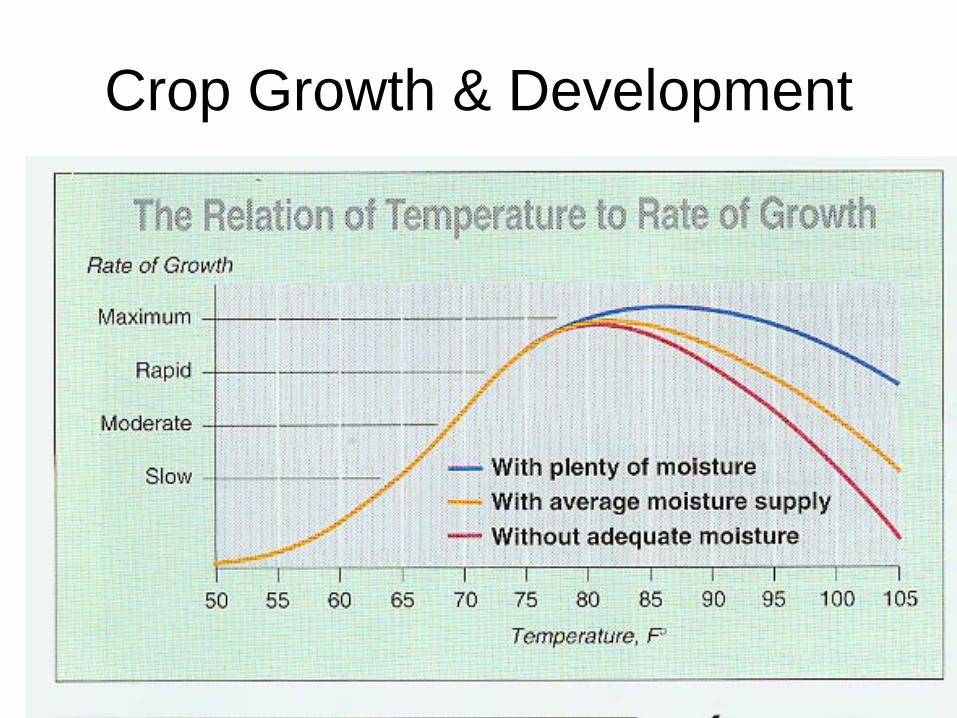
Crop Growth & Development
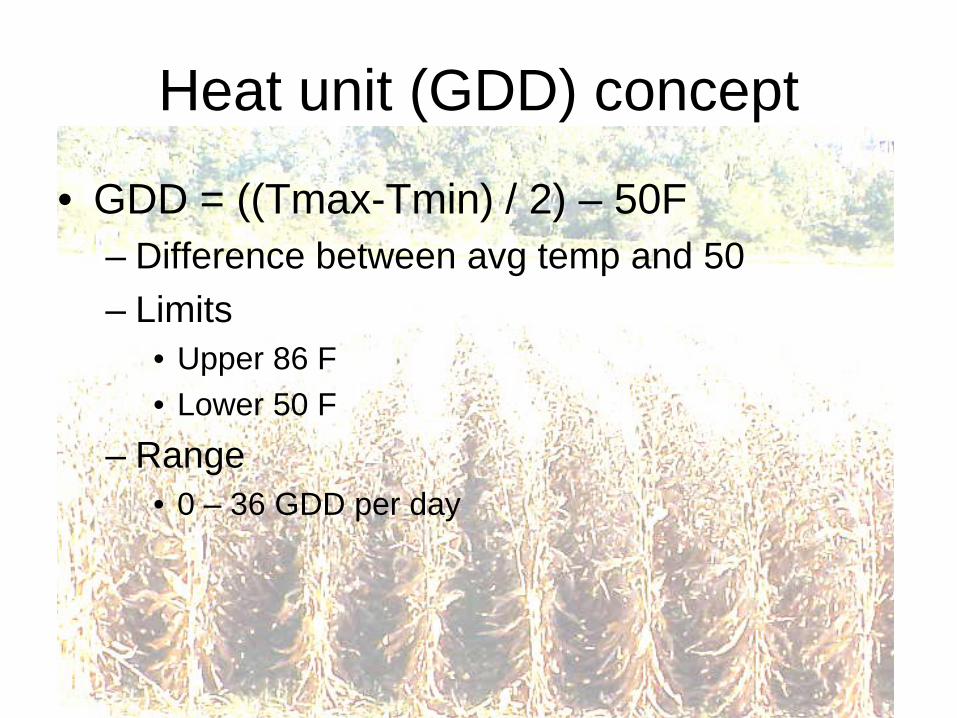
Heat unit (GDD) concept
• GDD = ((Tmax-Tmin) / 2) – 50F – Difference between avg temp and 50 – Limits
• Upper 86 F • Lower 50 F
– Range • 0 – 36 GDD per day
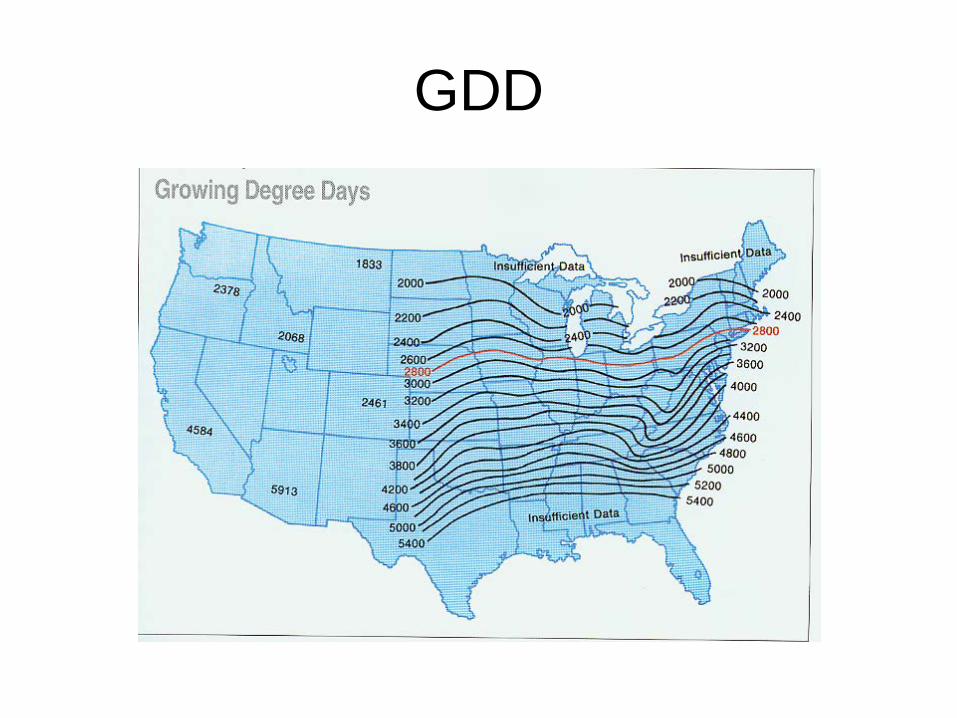
GDD
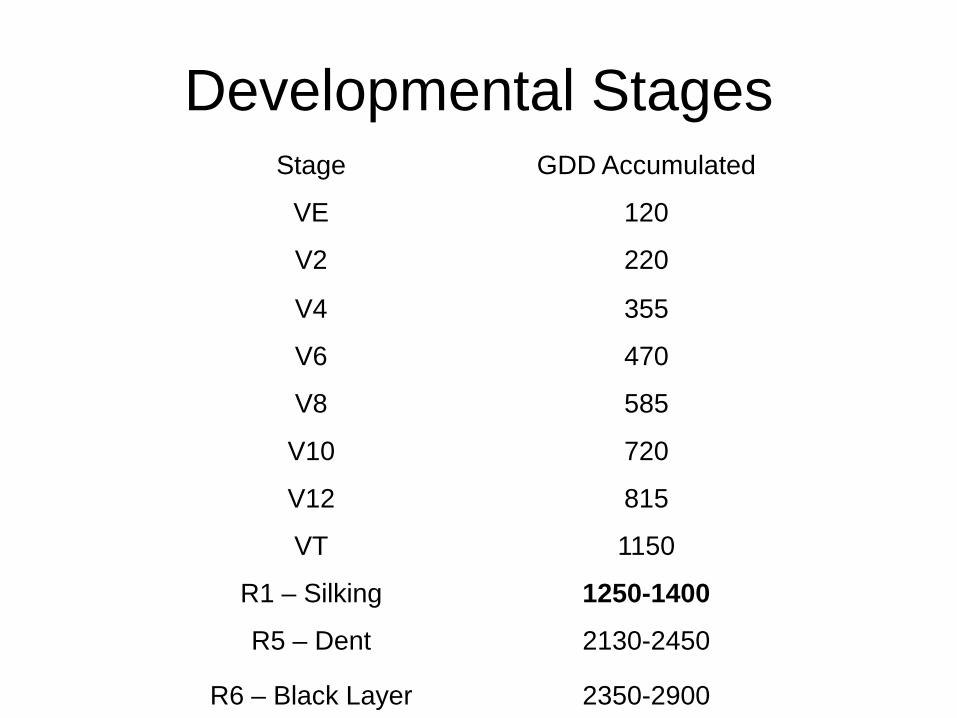
Developmental Stages Stage GDD Accumulated
VE 120
V2 220
V4 355
V6 470
V8 585
V10 720
V12 815
VT 1150
R1 – Silking 1250-1400
R5 – Dent 2130-2450
R6 – Black Layer 2350-2900
Developmental Stages
• VE (emergence) • V1 (first leaf) • V2 (second leaf) • V3 (third leaf) • V(n) (nth leaf) • VT (tasseling)
• R1 (silking) • R2 (blister) • R3 (milk) • R4 (dough) • R5 (dent) • R6 (physiological
maturity)

Developmental Stages
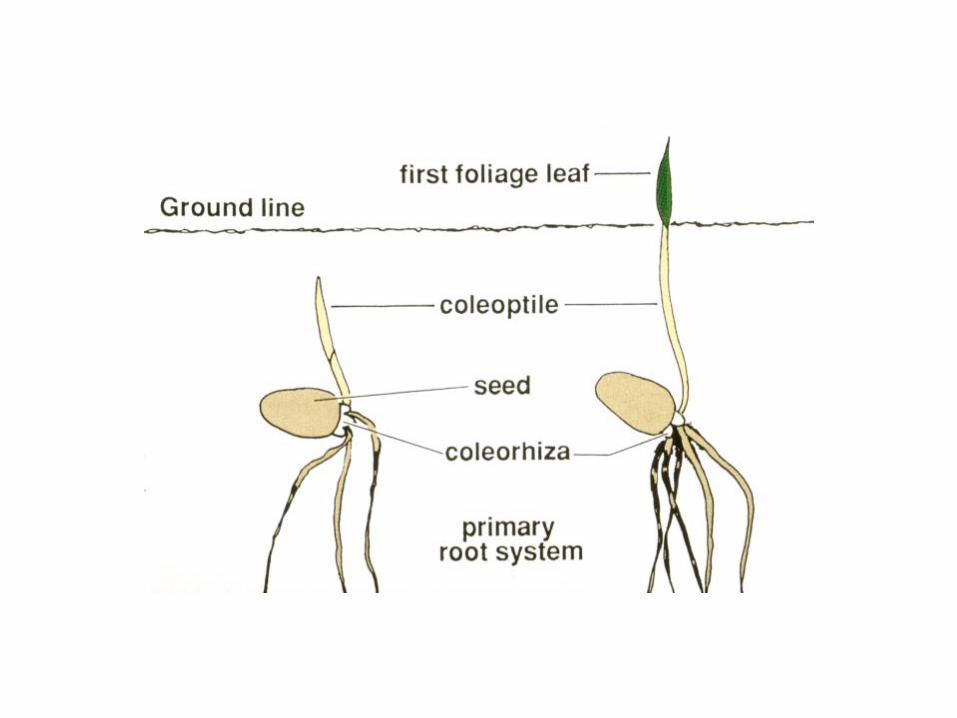
• VE - emergence
Developmental Stages
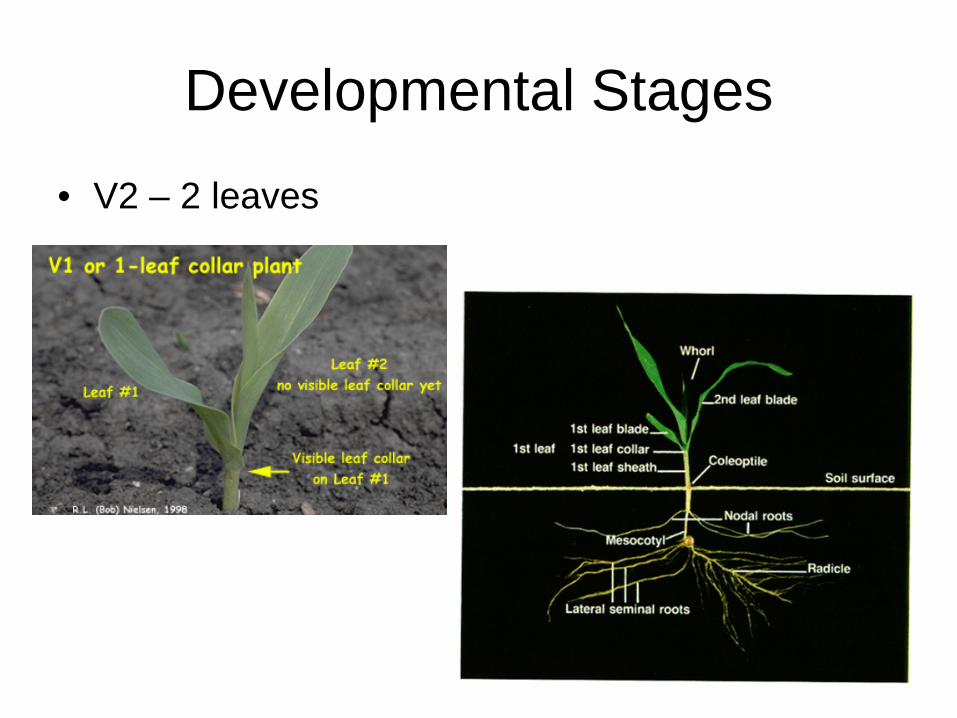
• V2 – 2 leaves
Developmental Stages
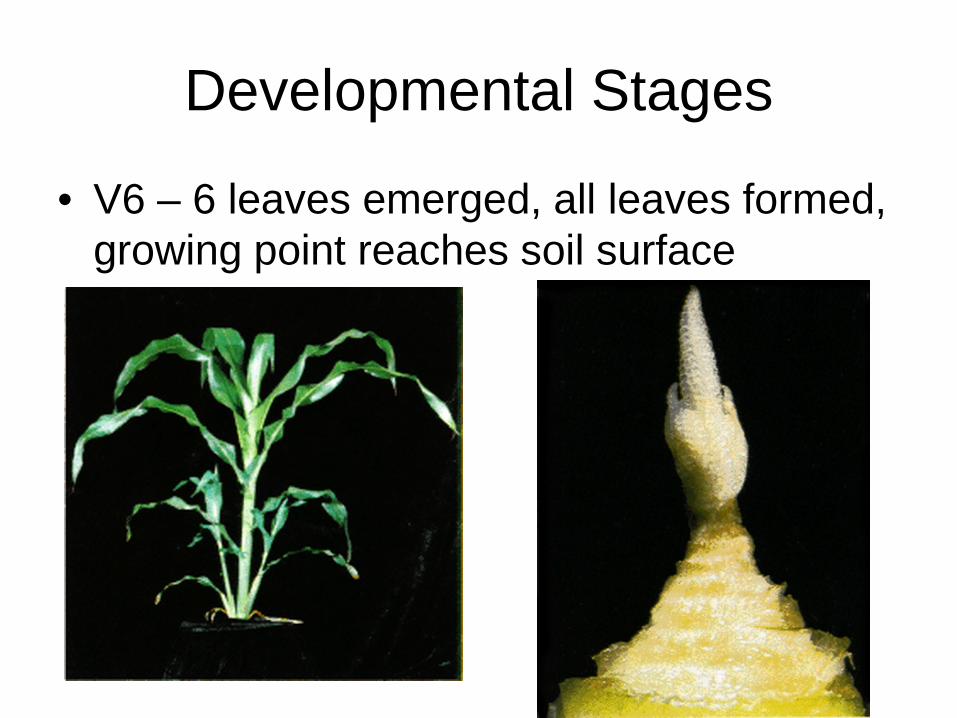
• V6 – 6 leaves emerged, all leaves formed, growing point reaches soil surface
Developmental Stages
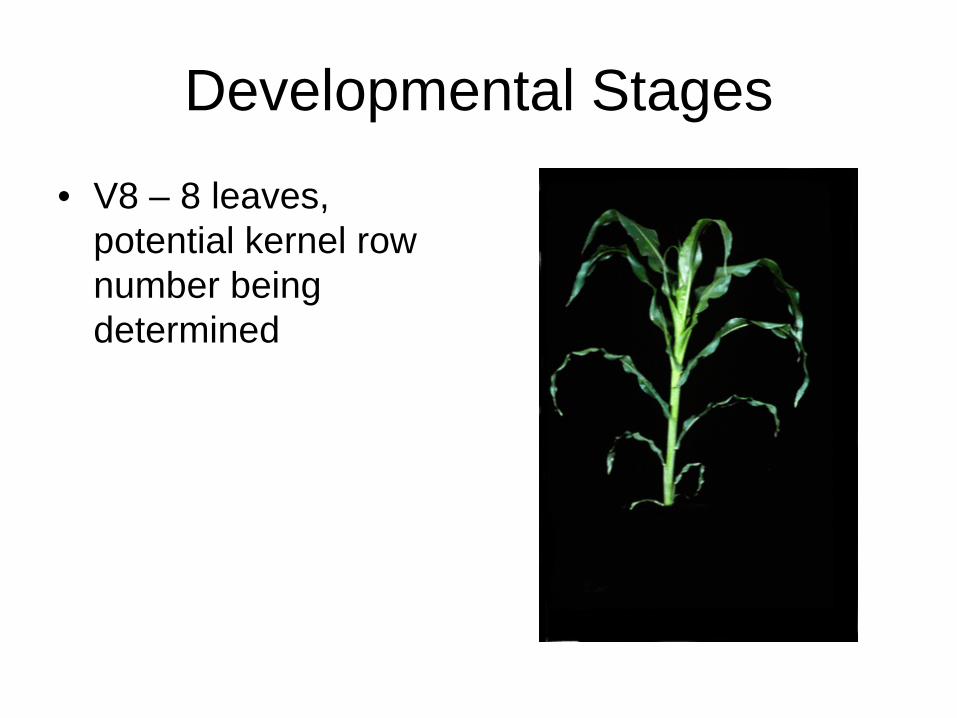
• V8 – 8 leaves, potential kernel row number being determined
Developmental Stages
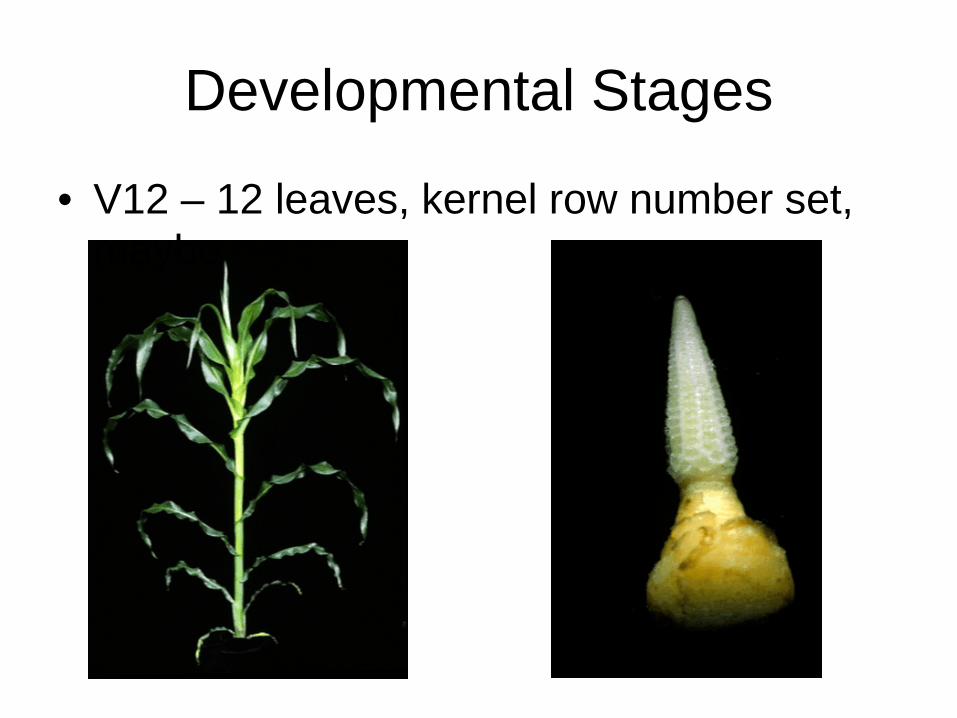
• V12 – 12 leaves, kernel row number set, maybe
Developmental Stages
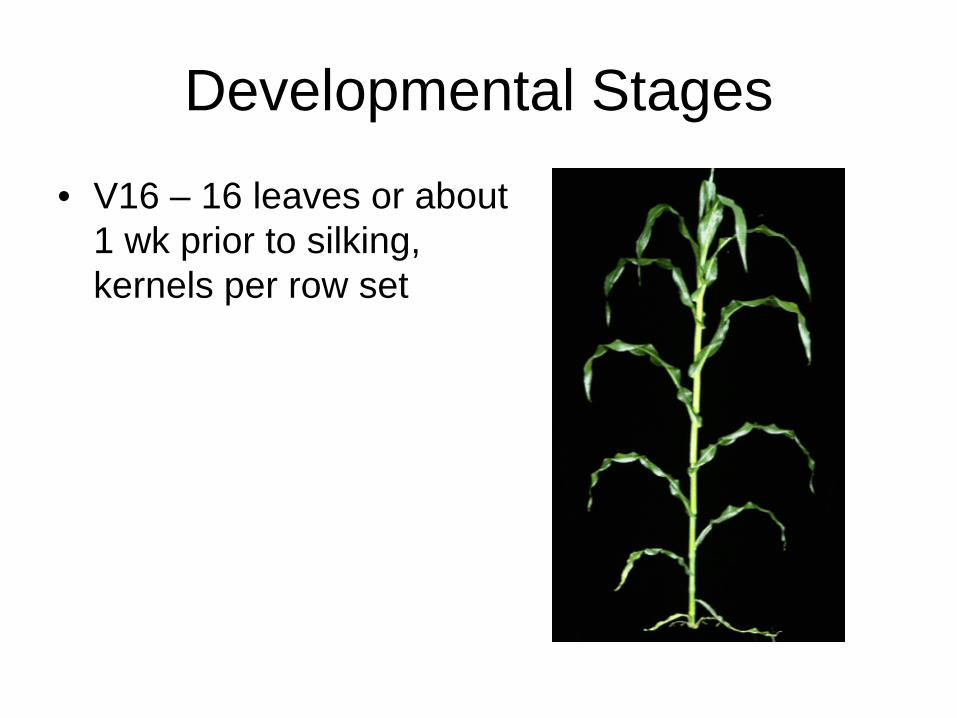
• V16 – 16 leaves or about 1 wk prior to silking, kernels per row set

Developmental Stages
• VT – Tasseling,

Developmental Stages
• R1 – Silking
• R2 - Blister

Developmental Stages
• R3 – Milk
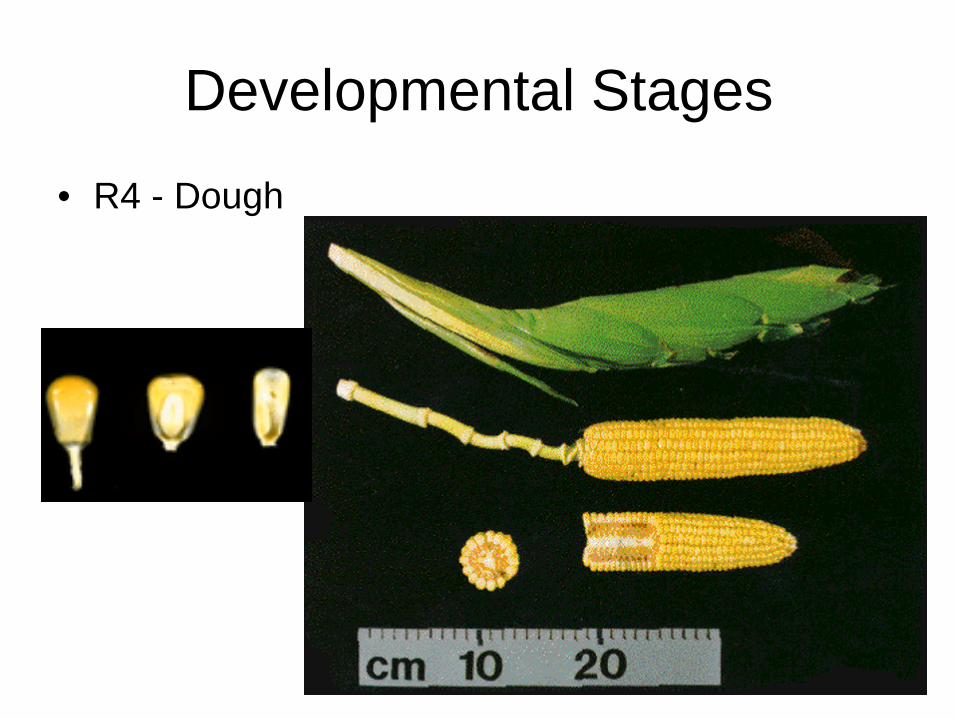
• R4 - Dough
Developmental Stages
• R4 - Dough
Developmental Stages
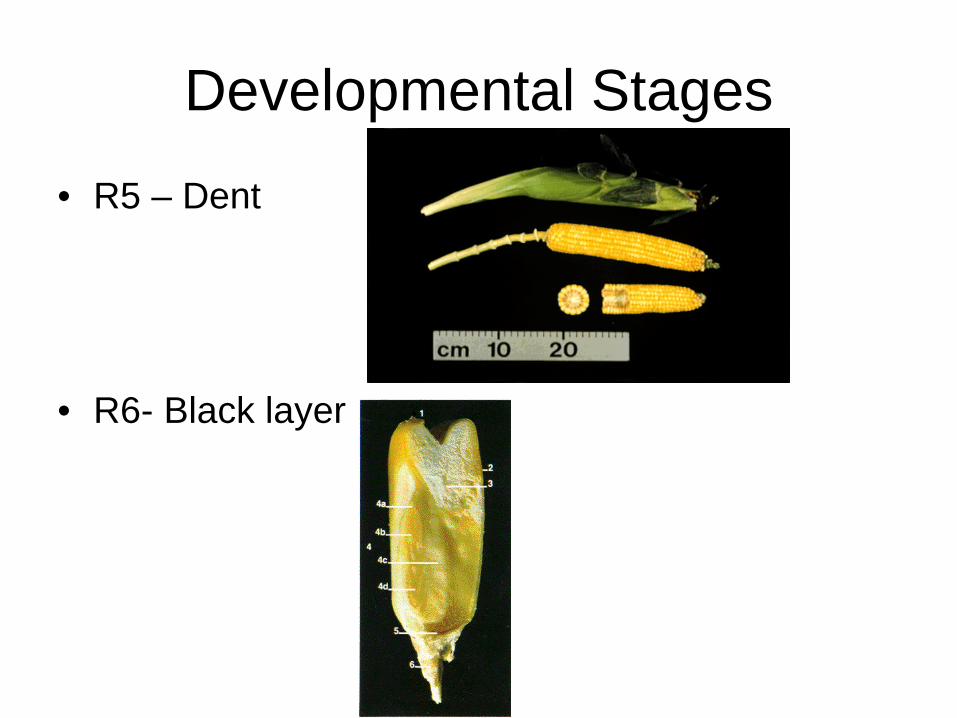
• R5 – Dent
• R6- Black layer
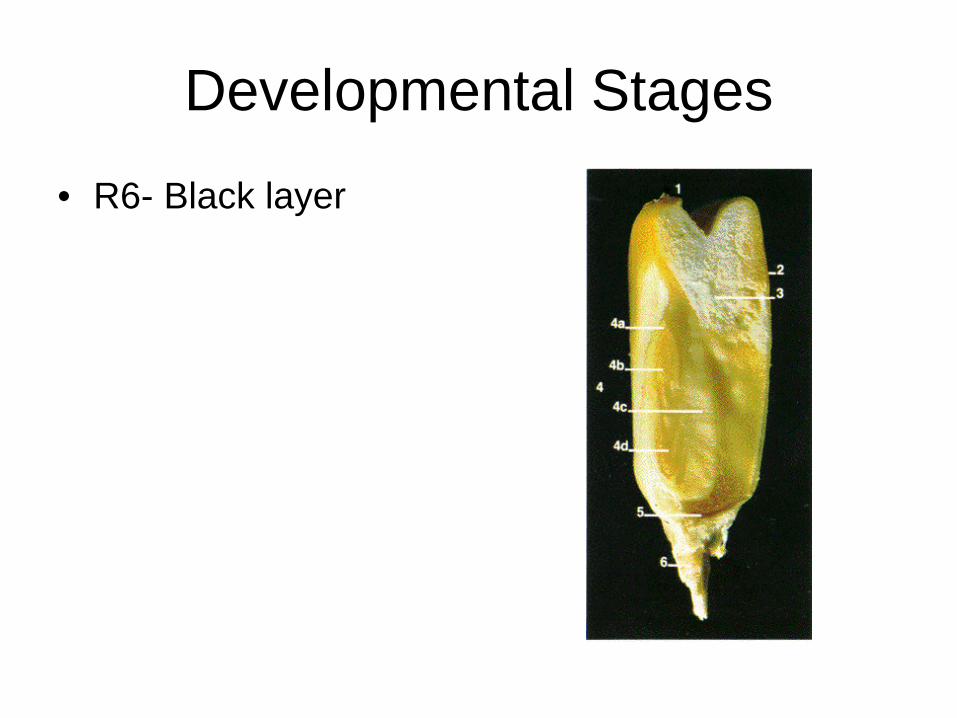
Developmental Stages
• R6- Black layer

Soybean Development Vegetative Stages • VE Emergence • VC Unrolled
unifoliate leaves
• V1 1st trifoliate • V2 2nd trifoliate • Vn nth trifoliate
Reproductive Stages • R1 Begin Flower • R2 Full Flower • R3 Begin Podding • R4 Full Pod • R5 Begin Seed • R6 Full Seed • R7 Begin Maturity • R8 Full Maturity
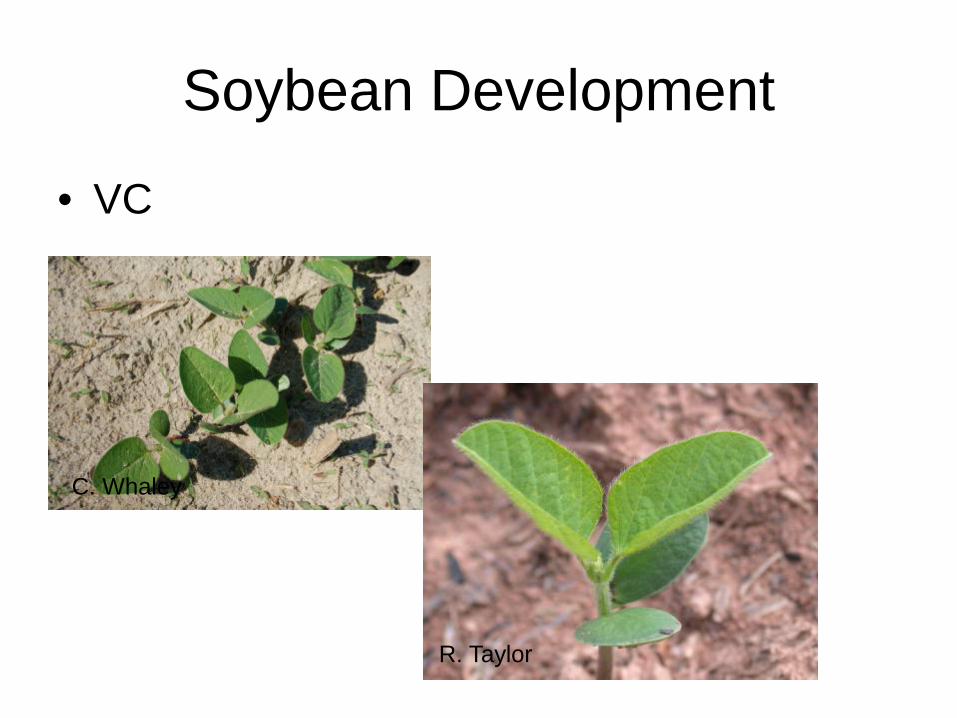
Soybean Development
• VC
C. Whaley
R. Taylor

• V1
Soybean Development
C. Whaley
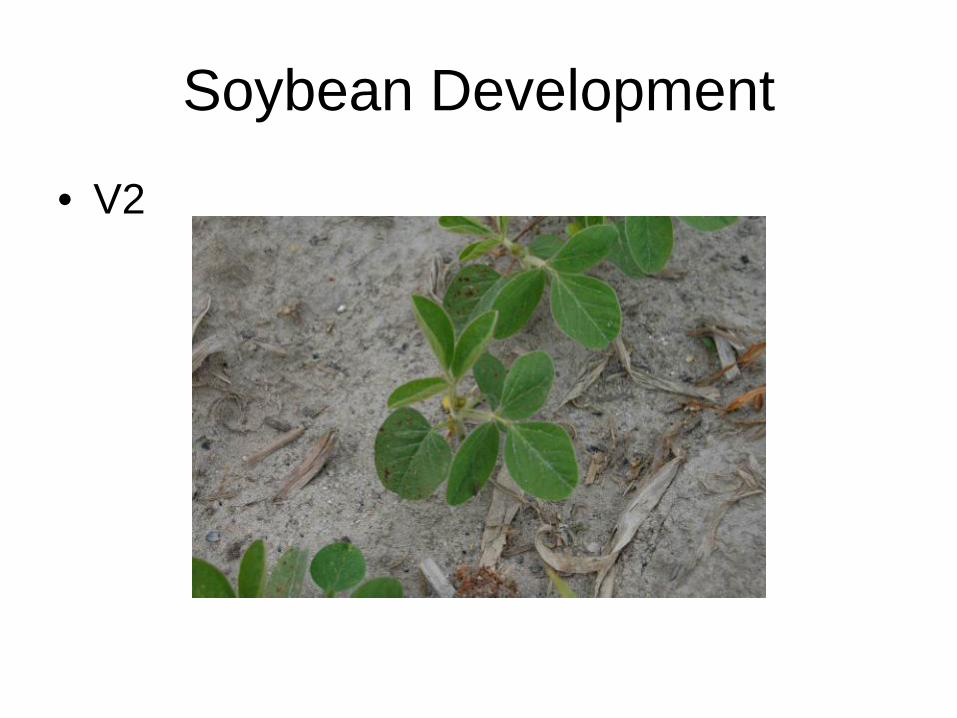
• V2
Soybean Development
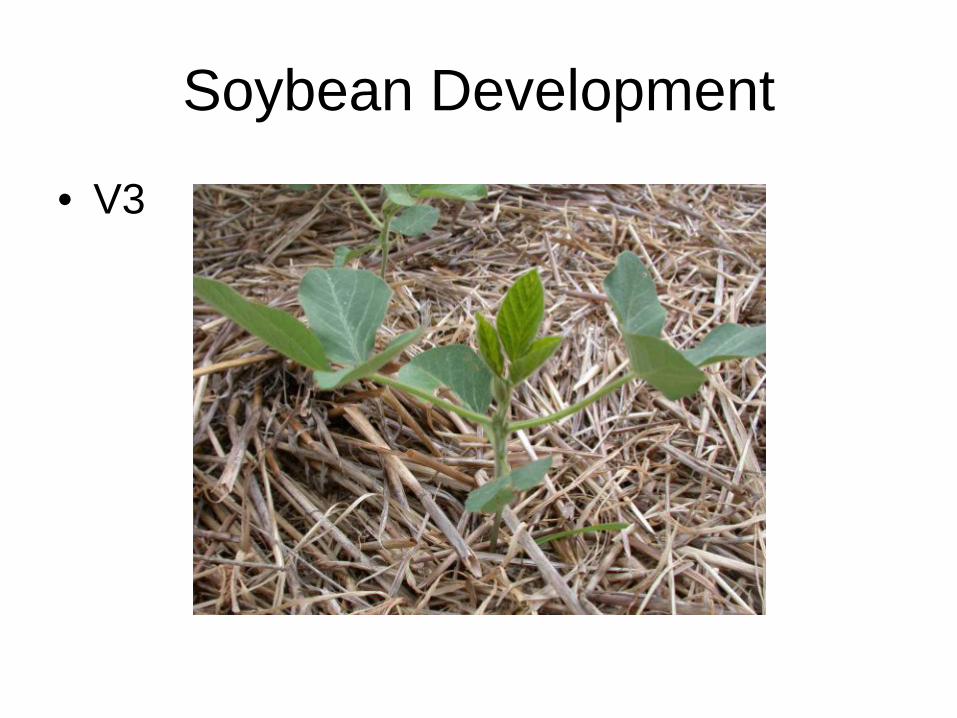
• V3
Soybean Development
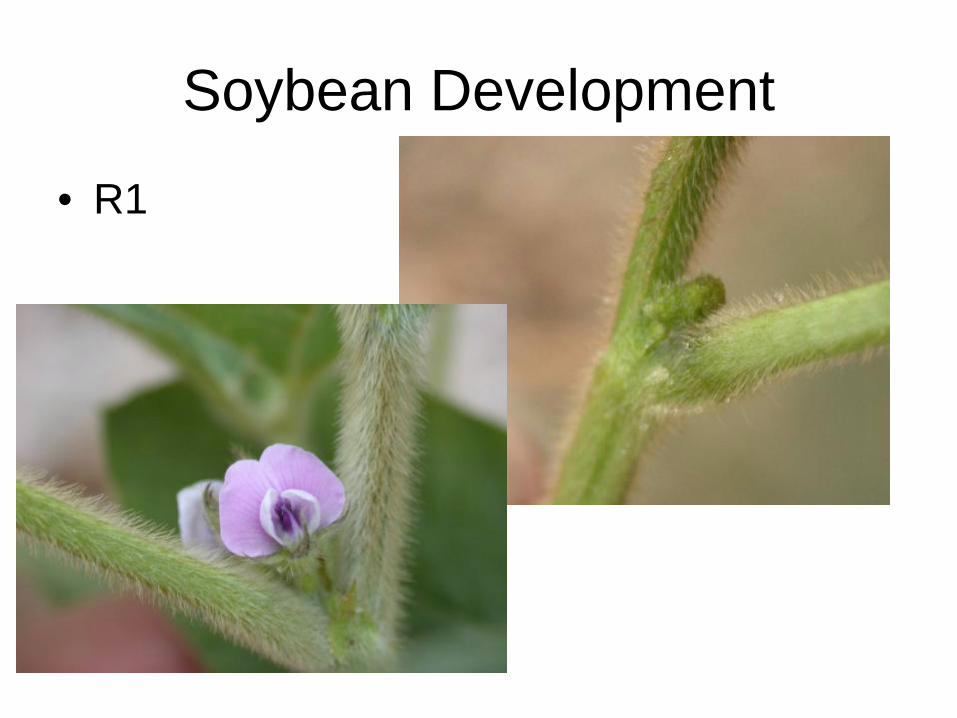
• R1
Soybean Development
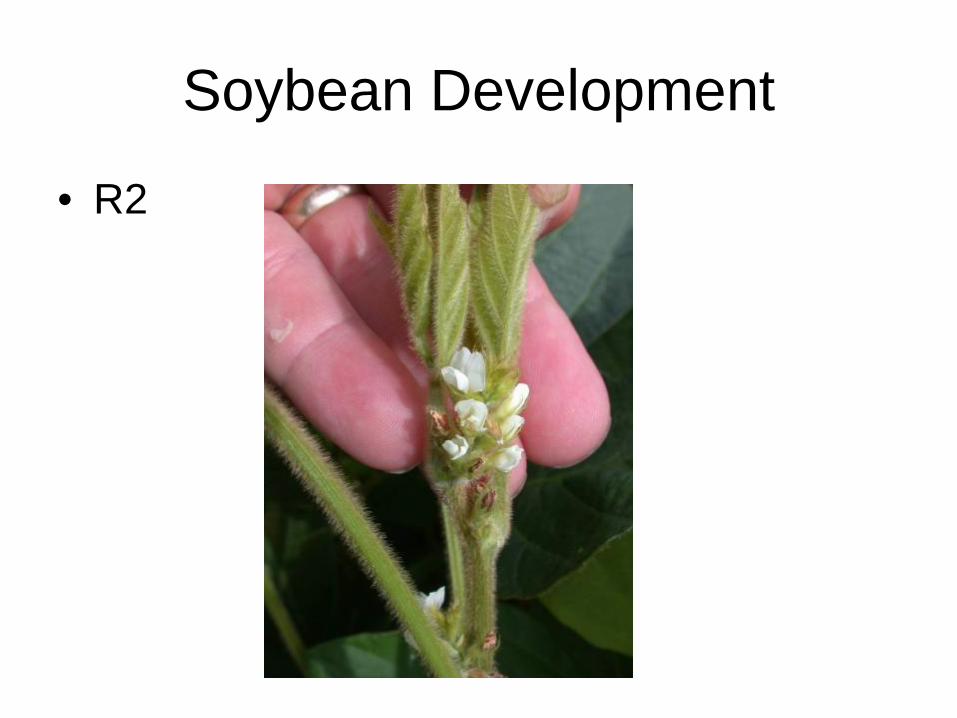
• R2
Soybean Development
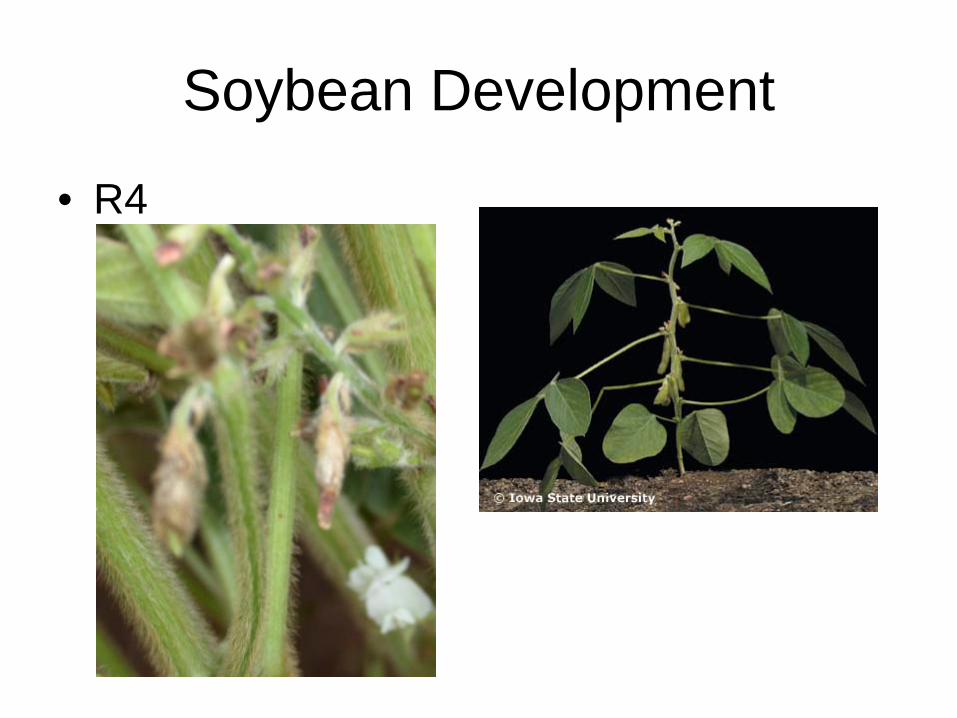
• R4
Soybean Development
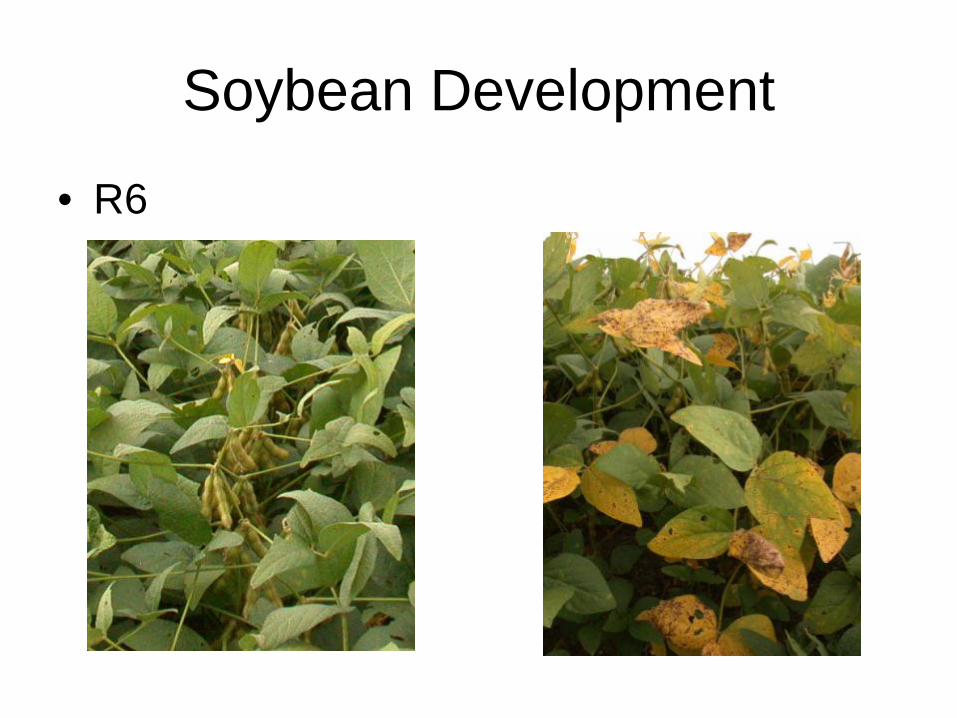
• R6
Soybean Development

• R7
Soybean Development
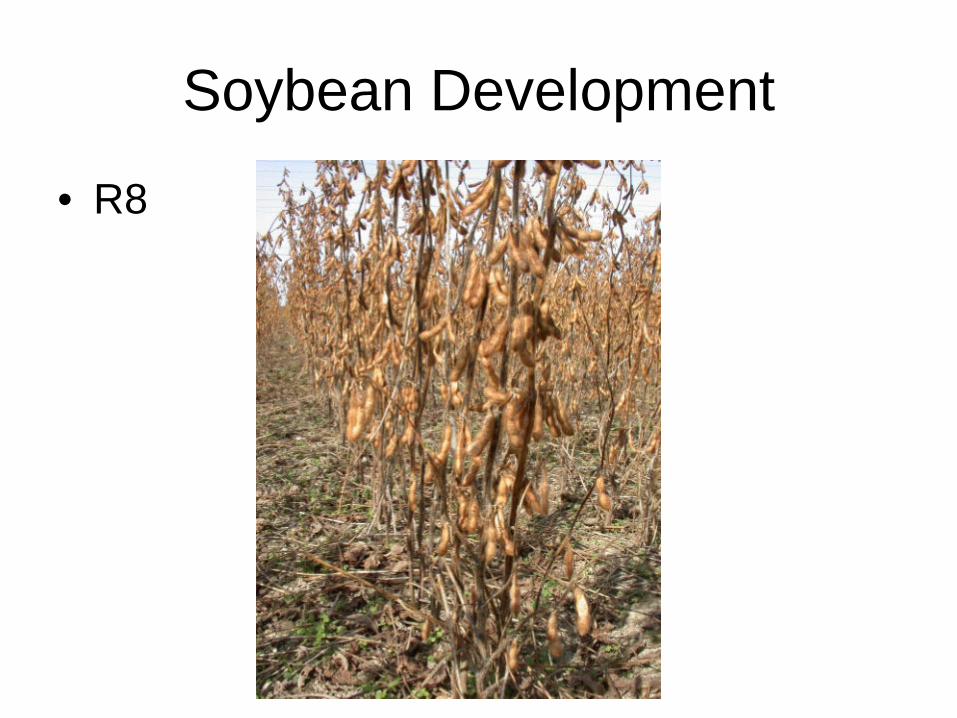
• R8
Soybean Development
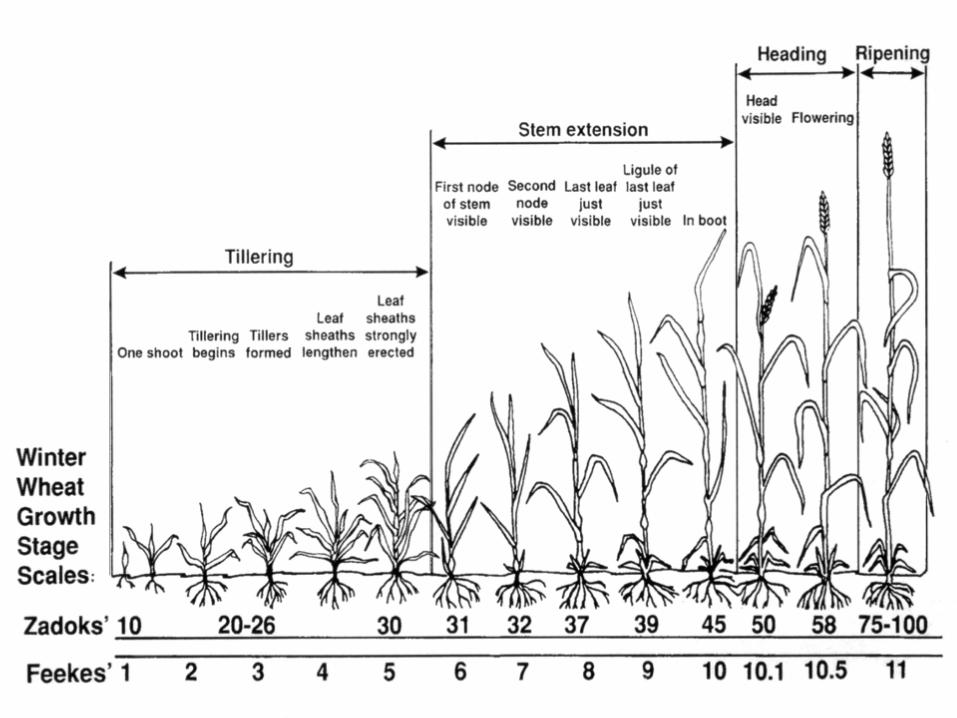
Split Apply N According to Growth Stage

Zadoks stage, in parenthesis
Estimated GDD (base 32ºF) Required to Reach Key Developmental Stages
235 550
950 1200
1350
2700
3550 3200

Wheat
• Daylength Sensitivity – What triggers the change from vegetative to
reproductive growth?
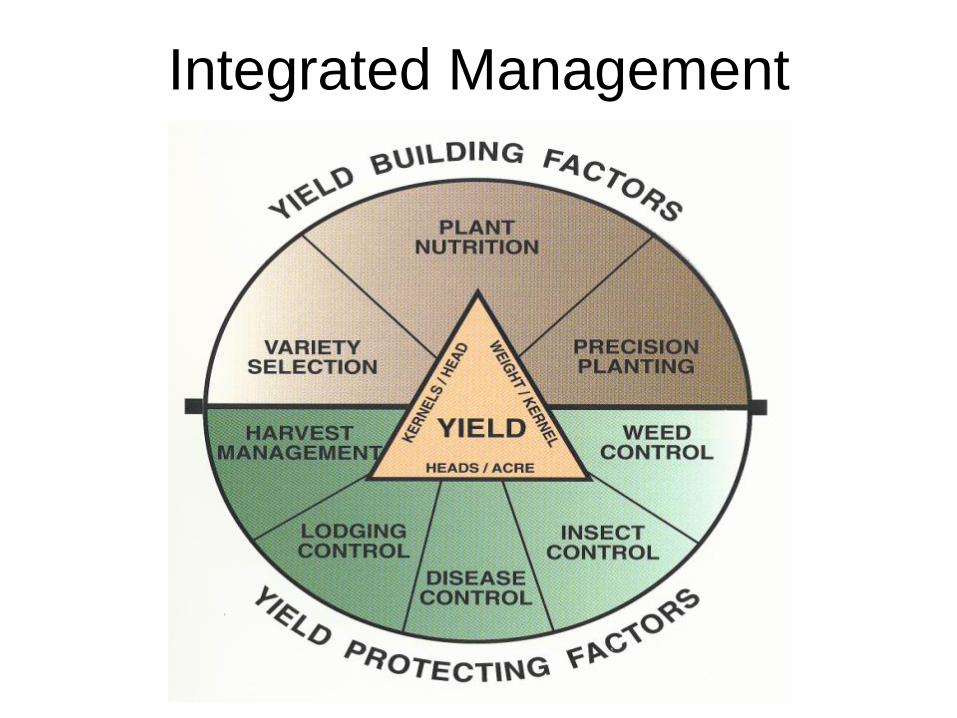
Integrated Management

Lack of
moisture
Possible production
Low fertility
Poor stand
Poor soil
conditions
Improper crop
variety
Weeds
Insects and
diseases
Factors Limiting Crop Production

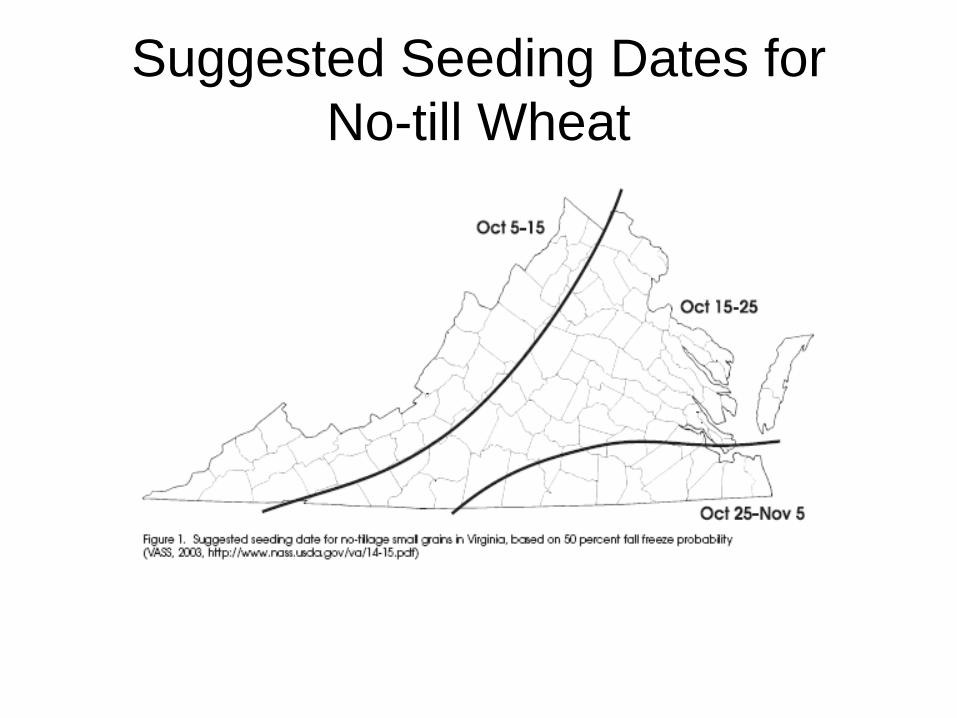
Suggested Seeding Dates for No-till Wheat
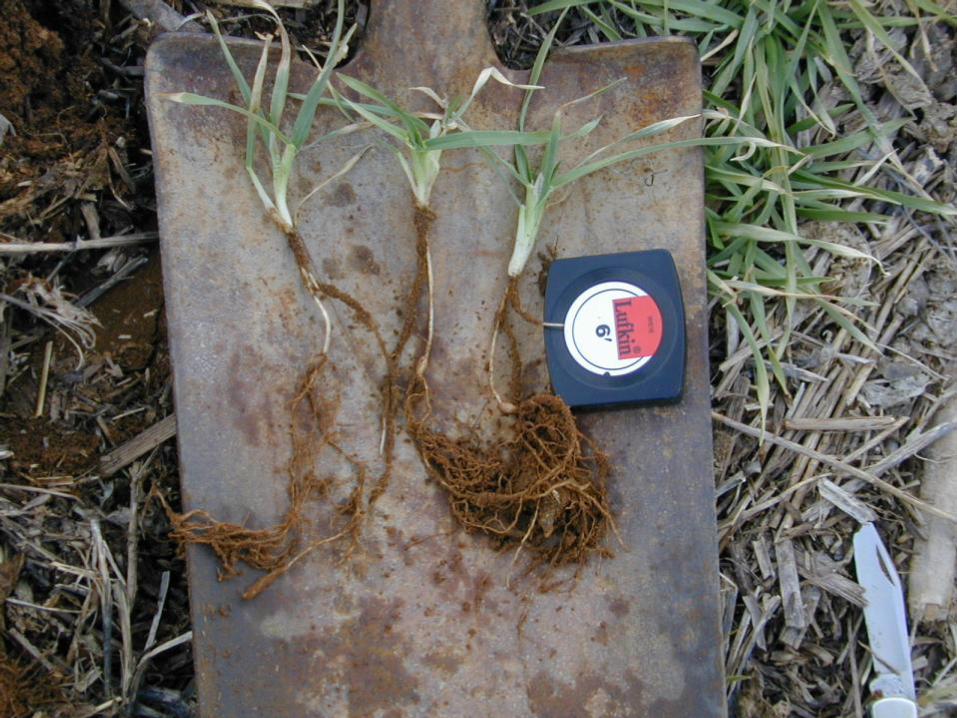
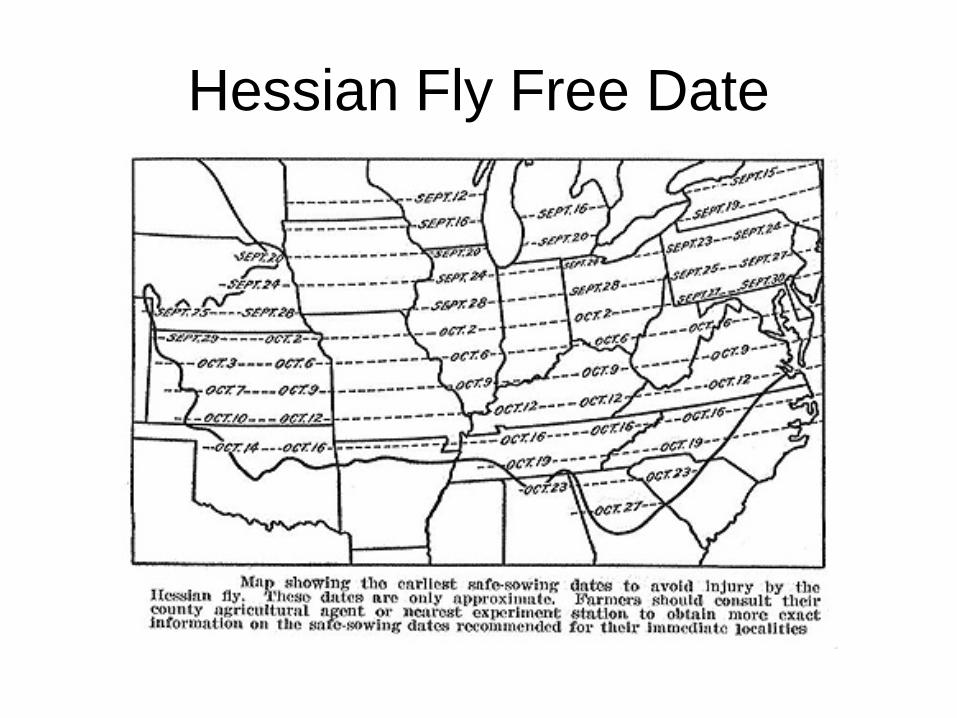
Hessian Fly Free Date
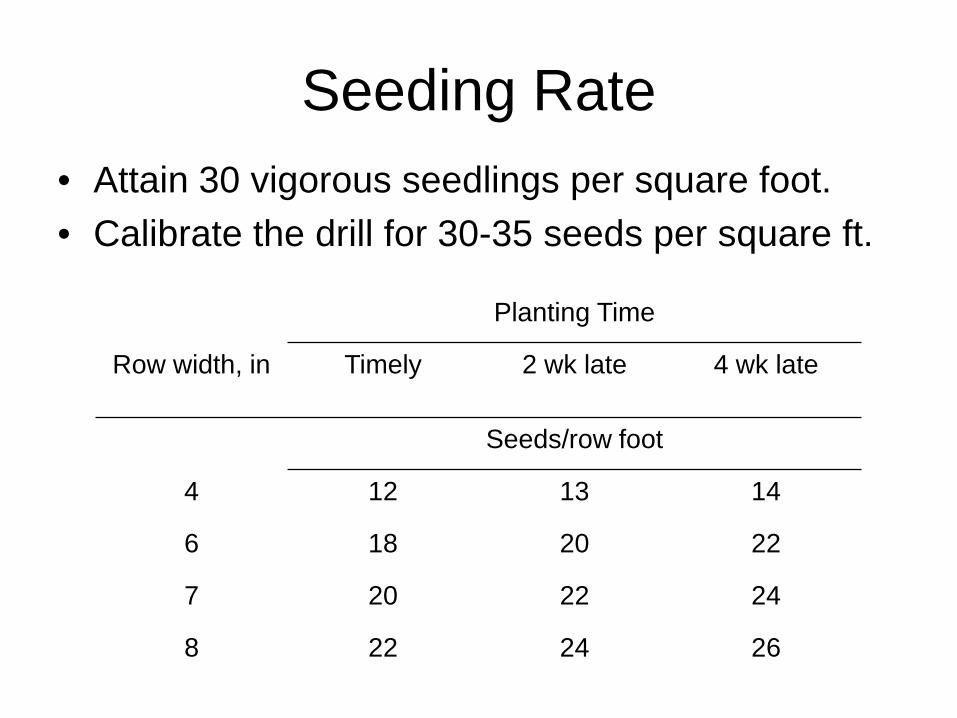
Seeding Rate • Attain 30 vigorous seedlings per square foot. • Calibrate the drill for 30-35 seeds per square ft.
Planting Time
Row width, in Timely 2 wk late 4 wk late
Seeds/row foot
4 12 13 14
6 18 20 22
7 20 22 24
8 22 24 26

Seed Size
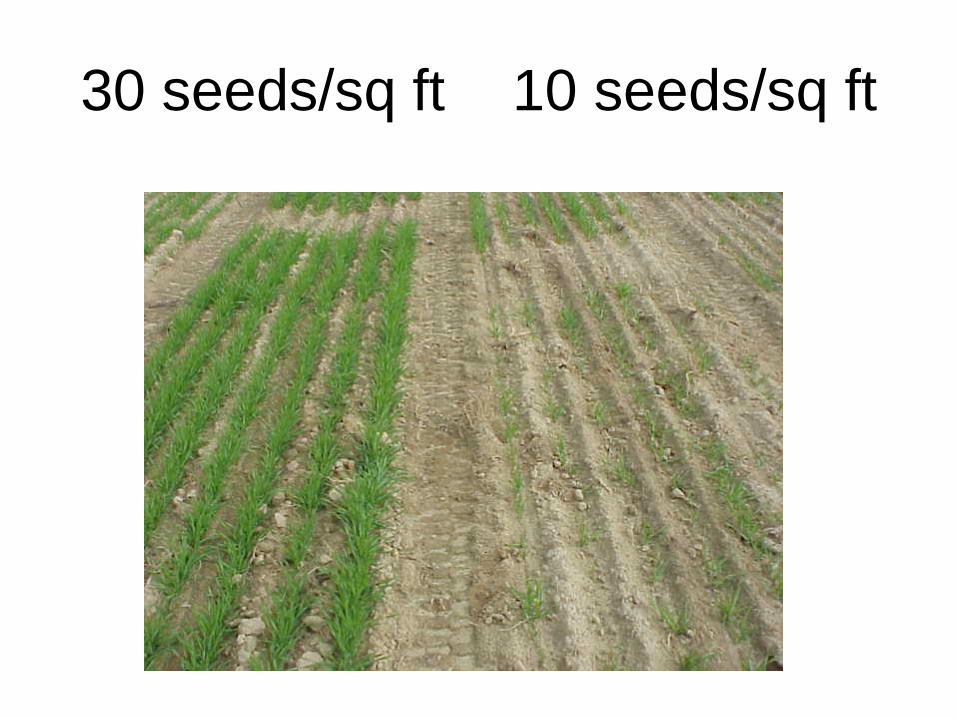
30 seeds/sq ft 10 seeds/sq ft
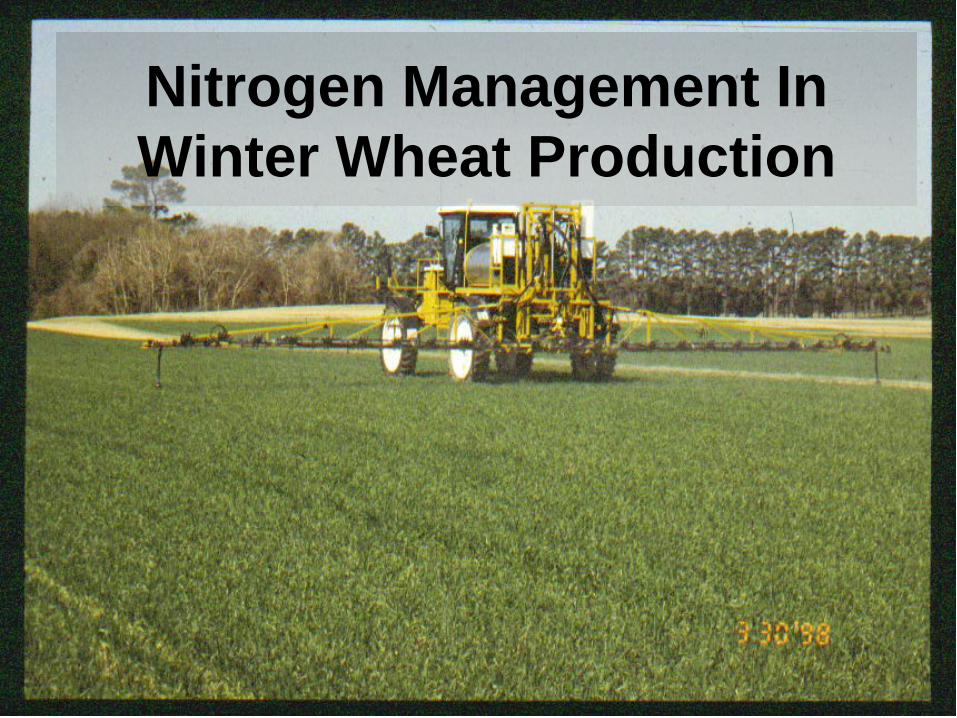
Nitrogen Management In Winter Wheat Production

Split Apply N According to Growth Stage
60% N Uptake After GS 30
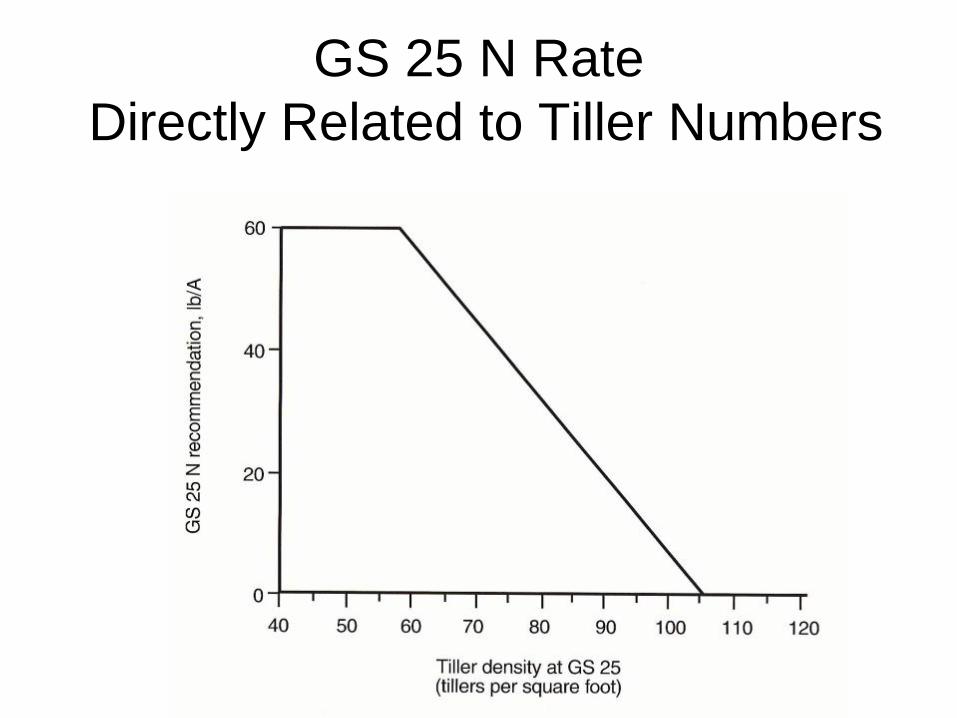
GS 25 N Rate Directly Related to Tiller Numbers
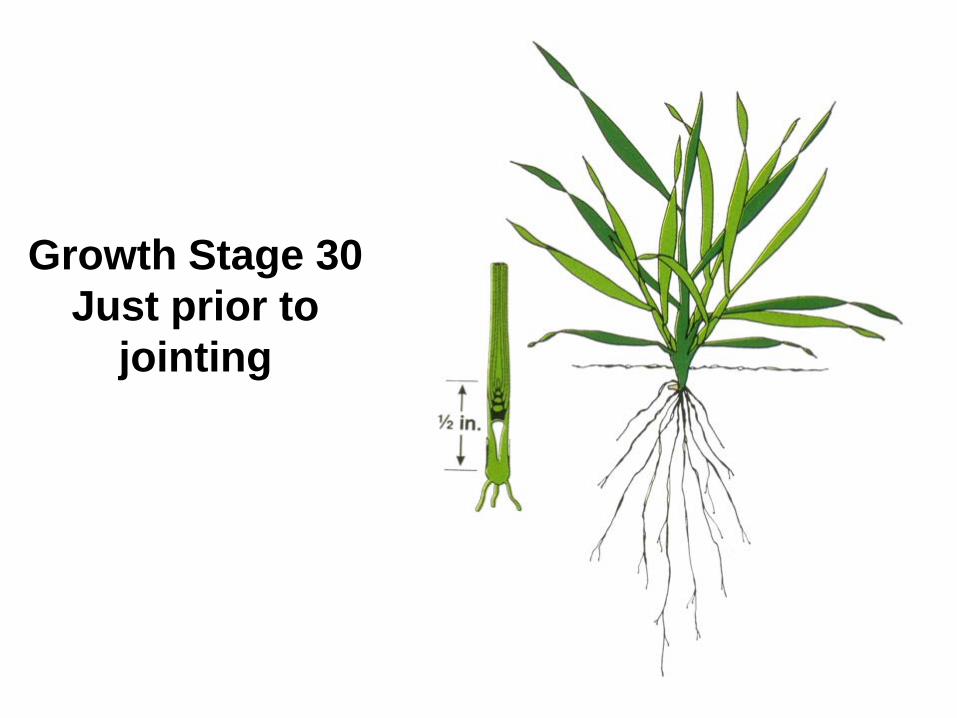
Growth Stage 30 Just prior to
jointing
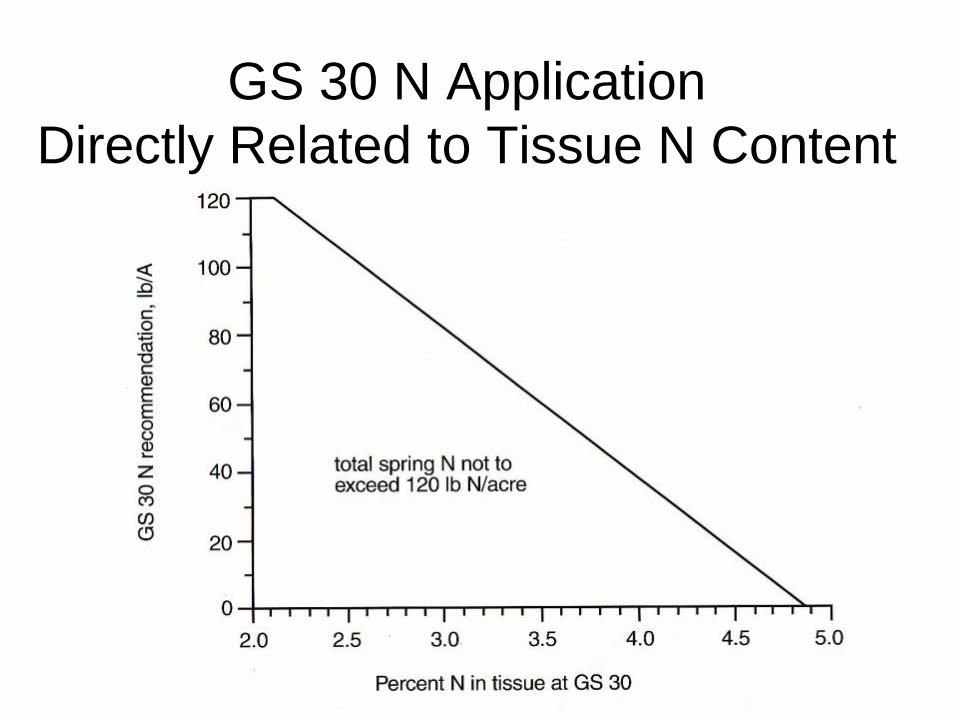
GS 30 N Application Directly Related to Tissue N Content
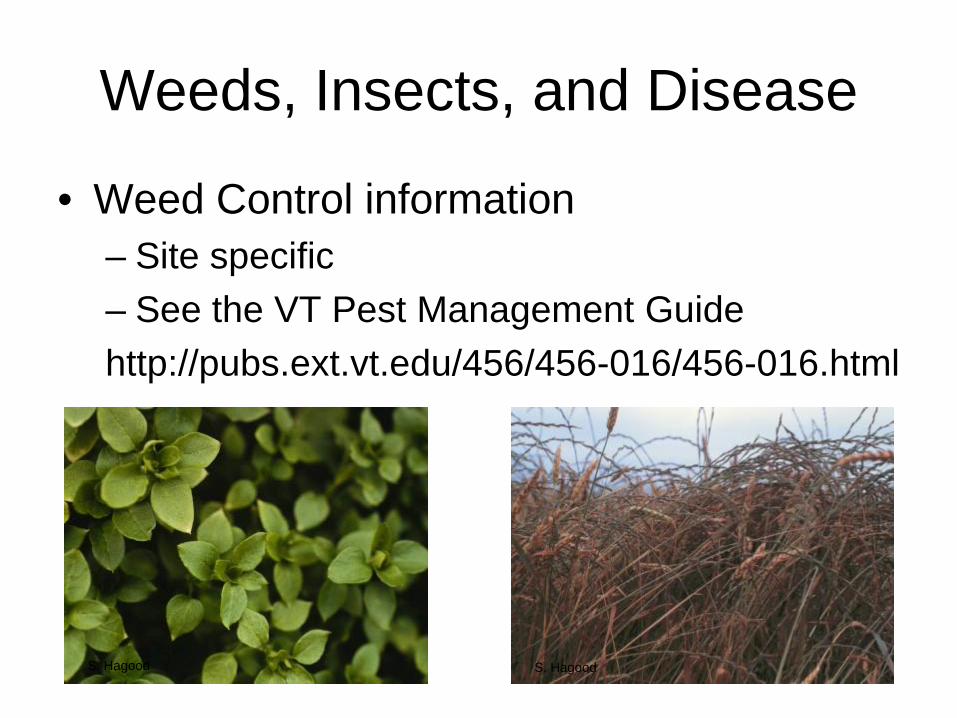
Weeds, Insects, and Disease
• Weed Control information – Site specific – See the VT Pest Management Guide http://pubs.ext.vt.edu/456/456-016/456-016.html
S. Hagood S. Hagood

Weeds, Insects, and Disease • Insects
– See the PMG – Aphids and BYDV
• Seed treatments • Scouting and in-season control
– Cereal Leaf Beetle • Scouting and thresholds, timing
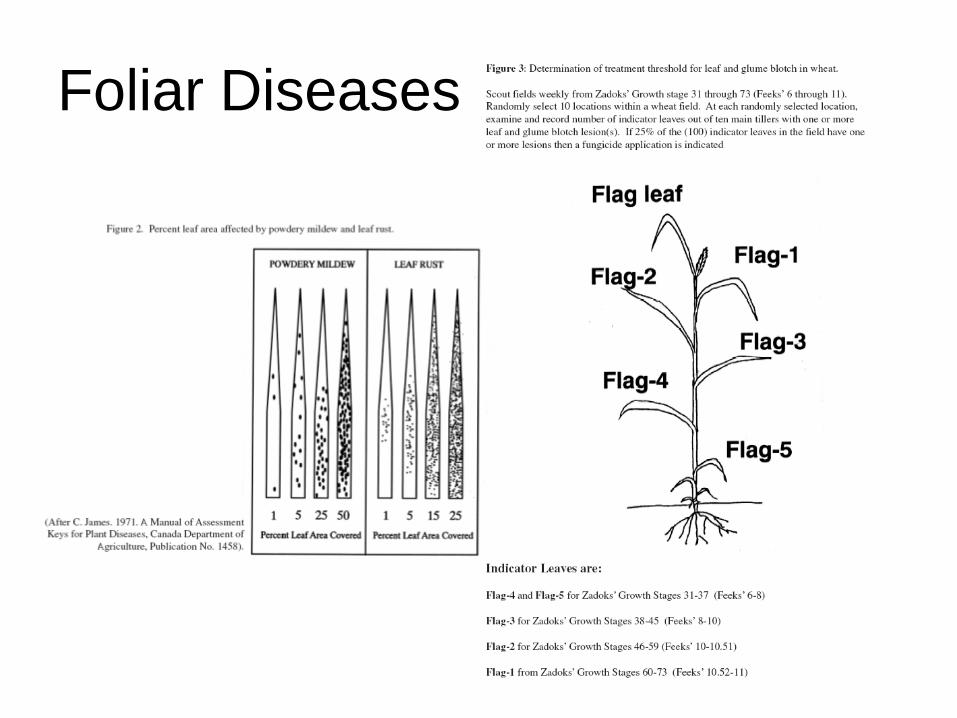
Foliar Diseases
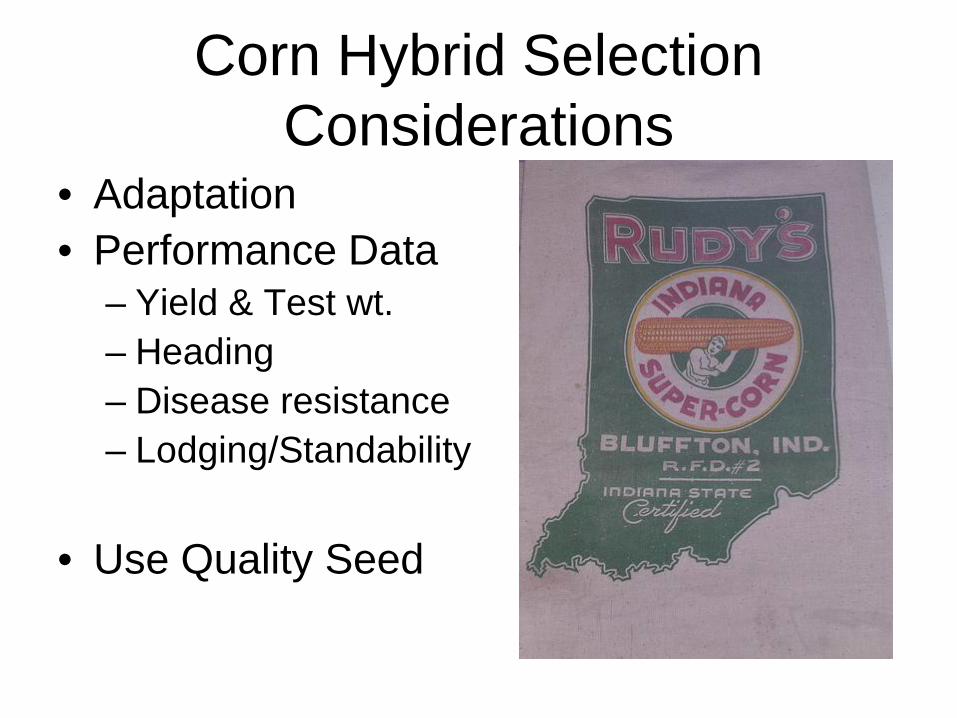
Corn Hybrid Selection Considerations
• Adaptation • Performance Data
– Yield & Test wt. – Heading – Disease resistance – Lodging/Standability
• Use Quality Seed

Corn Planting Date
0
5
10
15
20
25
30
April 1 April 15 April 29 May 13
Date
Tem
pera
ture
, °C
Westmoreland, 2004
Westmoreland, 2005
Charles City, 2004
Charles City, 2005
http://www.ext.vt.edu/pubs/grains/424-033/424-033.html http://www.ext.vt.edu/pubs/grains/424-032/424-032.html

Seeding Rate • Yield potential
– <90 bu/ac = 18,000-20,000 seeds – 90-120 bu/ac = 20,000-22,000 – >120 bu/ac = 22,000-26,000+
• “Stretch” hybrids – 18,000-20,000 seeds
• Planting >26,000 seeds only on soils w/ 4 plus
inches of available moisture and avg yields >125 bu/ac
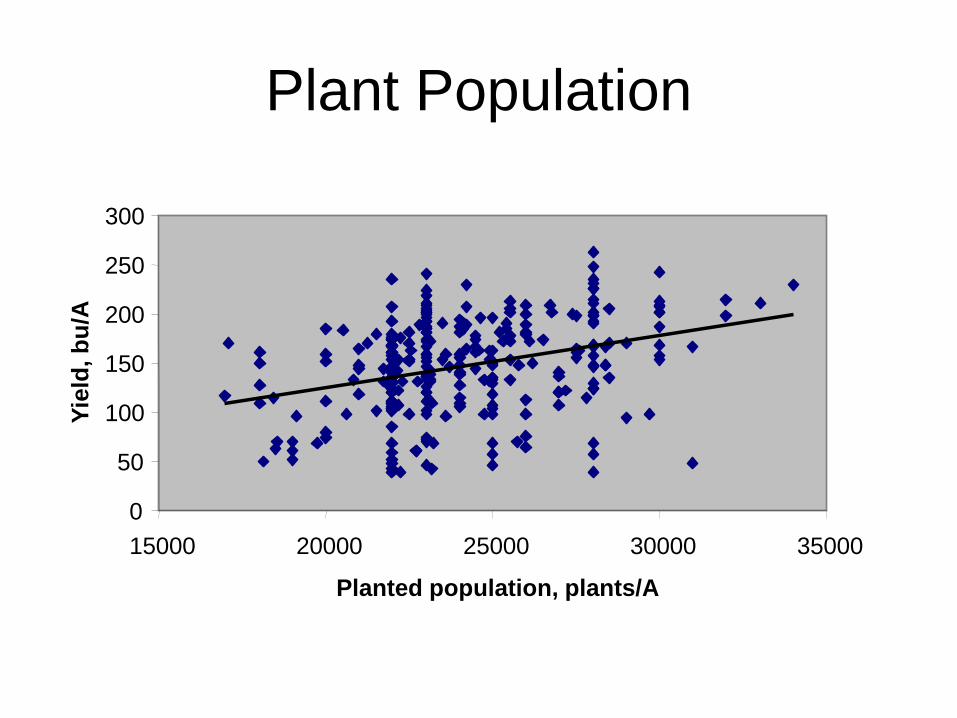
Plant Population
0
50
100
150
200
250
300
15000 20000 25000 30000 35000
Planted population, plants/A
Yiel
d, b
u/A

Row Width
• Why narrow rows should increase yields.

Row width
% yield change Location Experiments Row spacing (in) vs. 30 in. row Michigan 10 22 8.8 Minnesota 6 20 7.3 Purdue 9 15 2.7 Iowa 5 20 4.5 Pennsylvania
27,000 PPA 2 15 3.2 34,000 PPA 2 15 11
Kentucky 5 20 0 Tennessee 3 20 -4.3
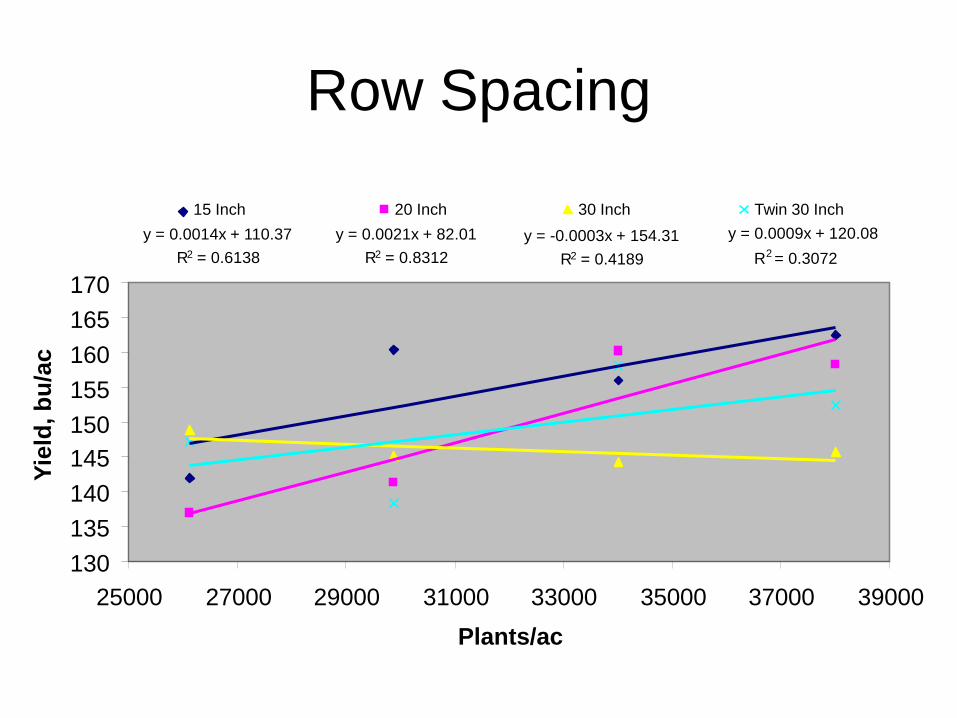
Row Spacing
y = 0.0014x + 110.37 R 2 = 0.6138
y = 0.0021x + 82.01 R 2 = 0.8312
y = -0.0003x + 154.31 R 2 = 0.4189
y = 0.0009x + 120.08 R 2 = 0.3072
130 135 140 145 150 155 160 165 170
25000 27000 29000 31000 33000 35000 37000 39000 Plants/ac
Yiel
d, b
u/ac
15 Inch 20 Inch 30 Inch Twin 30 Inch
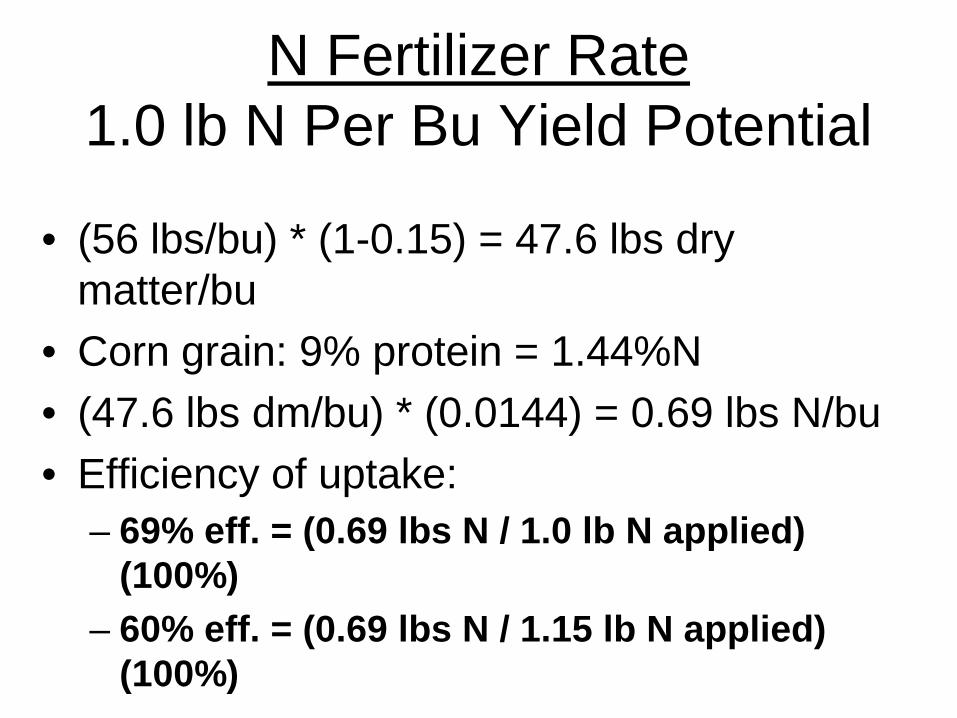
N Fertilizer Rate 1.0 lb N Per Bu Yield Potential
• (56 lbs/bu) * (1-0.15) = 47.6 lbs dry matter/bu
• Corn grain: 9% protein = 1.44%N • (47.6 lbs dm/bu) * (0.0144) = 0.69 lbs N/bu • Efficiency of uptake:
– 69% eff. = (0.69 lbs N / 1.0 lb N applied) (100%)
– 60% eff. = (0.69 lbs N / 1.15 lb N applied) (100%)

Nitrogen
Growing Degree Units
0 500 1000 1500 2000 2500
Dry
Mat
ter A
ccum
ulat
ion
(Mg
ha-1
)
0
5
10
15
20
N U
ptak
e (k
g ha
-1)
0
50
100
150
200
Dry MatterTotal N
V4 V8
VT
R2
TraditionalPreplant
N Application
Proposed N ApplicationWindow
May June July Aug Sept
R4
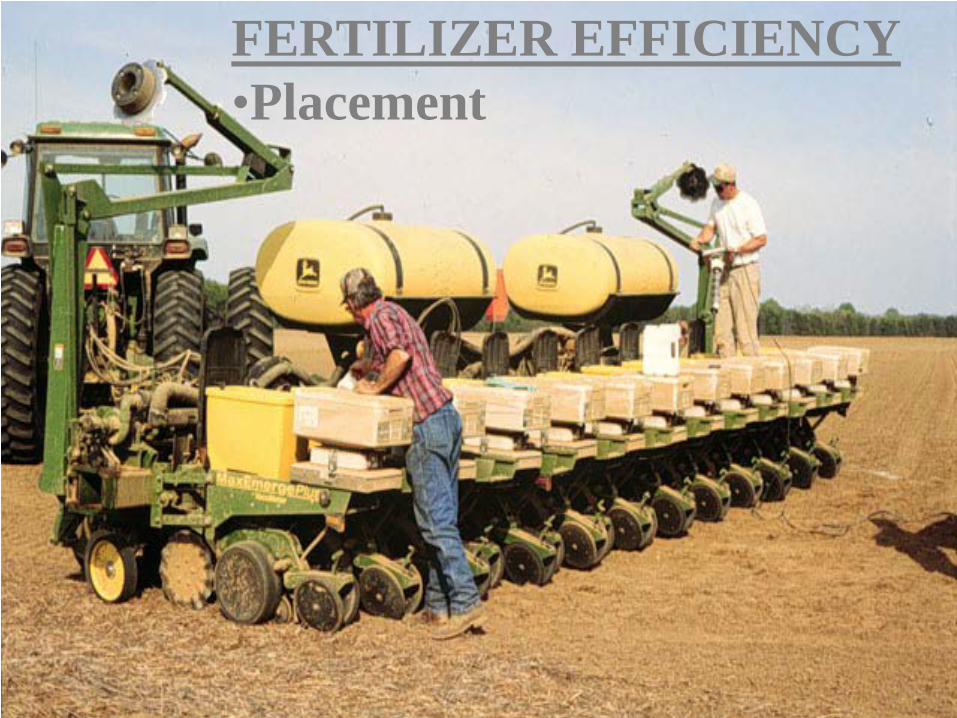
FERTILIZER EFFICIENCY •Placement
Yetter
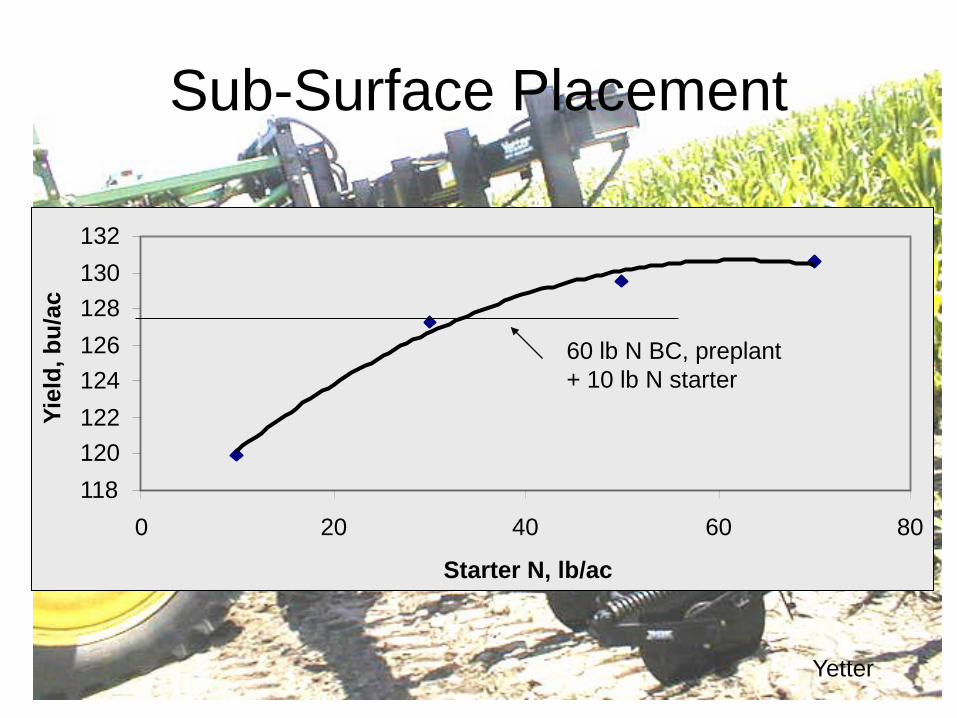
Sub-Surface Placement
118 120 122 124 126 128 130 132
0 20 40 60 80
Starter N, lb/ac
Yiel
d, b
u/ac
60 lb N BC, preplant + 10 lb N starter
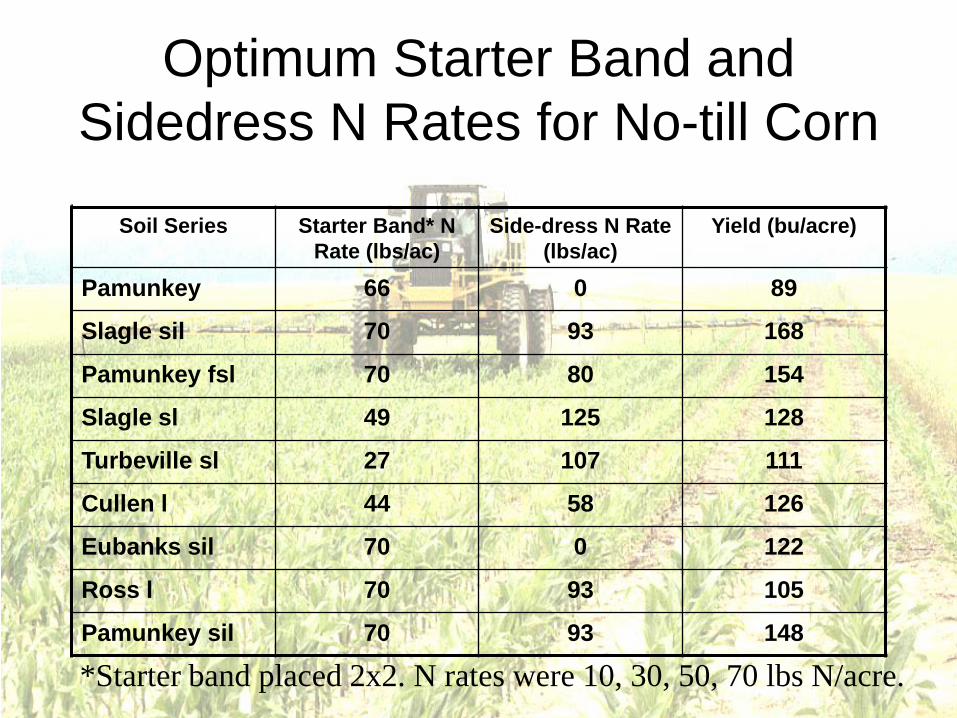
Optimum Starter Band and Sidedress N Rates for No-till Corn
Soil Series Starter Band* N Rate (lbs/ac)
Side-dress N Rate (lbs/ac)
Yield (bu/acre)
Pamunkey 66 0 89
Slagle sil 70 93 168
Pamunkey fsl 70 80 154
Slagle sl 49 125 128
Turbeville sl 27 107 111
Cullen l 44 58 126
Eubanks sil 70 0 122
Ross l 70 93 105
Pamunkey sil 70 93 148
*Starter band placed 2x2. N rates were 10, 30, 50, 70 lbs N/acre.
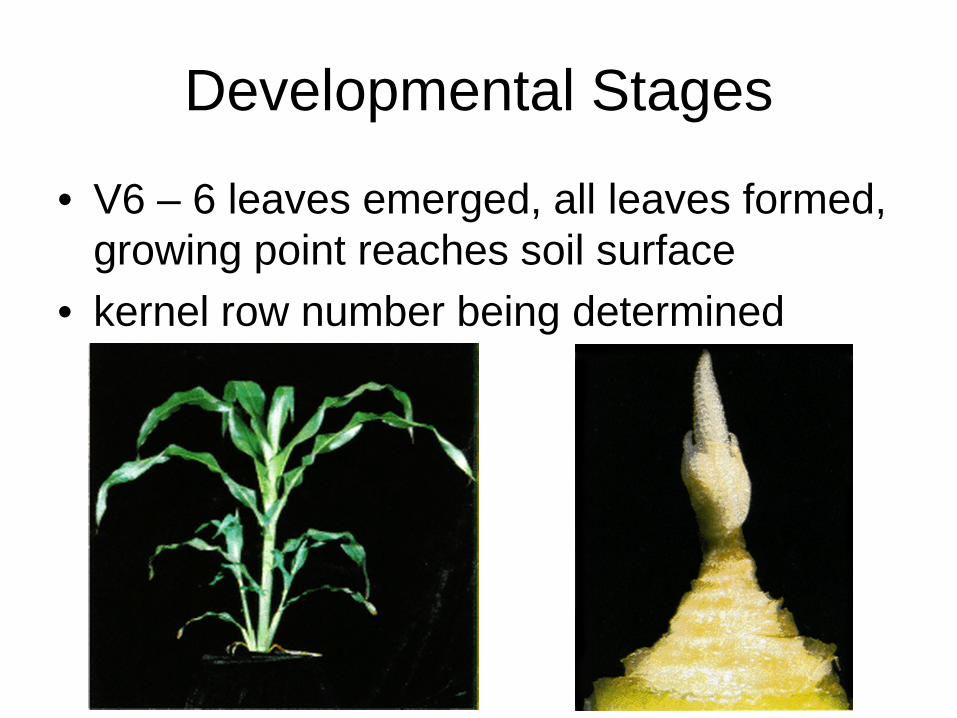
Developmental Stages
• V6 – 6 leaves emerged, all leaves formed, growing point reaches soil surface
• kernel row number being determined

Nitrogen
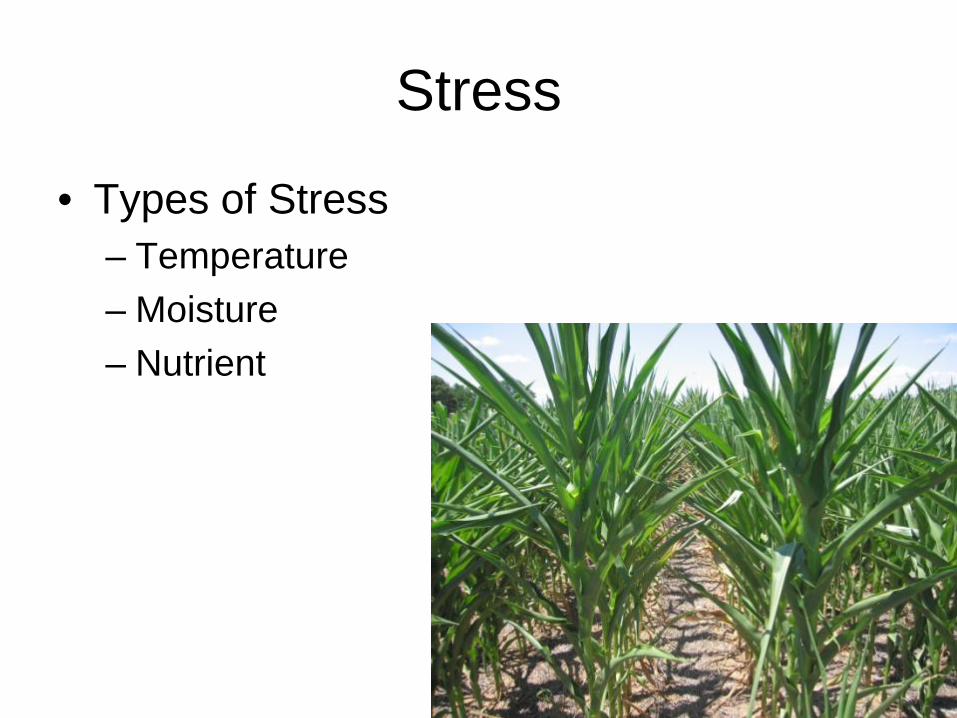
Stress
• Types of Stress – Temperature – Moisture – Nutrient

Critical Stages
• Early Vegetative • Tassel Emergence • Silking • Blister • Dough
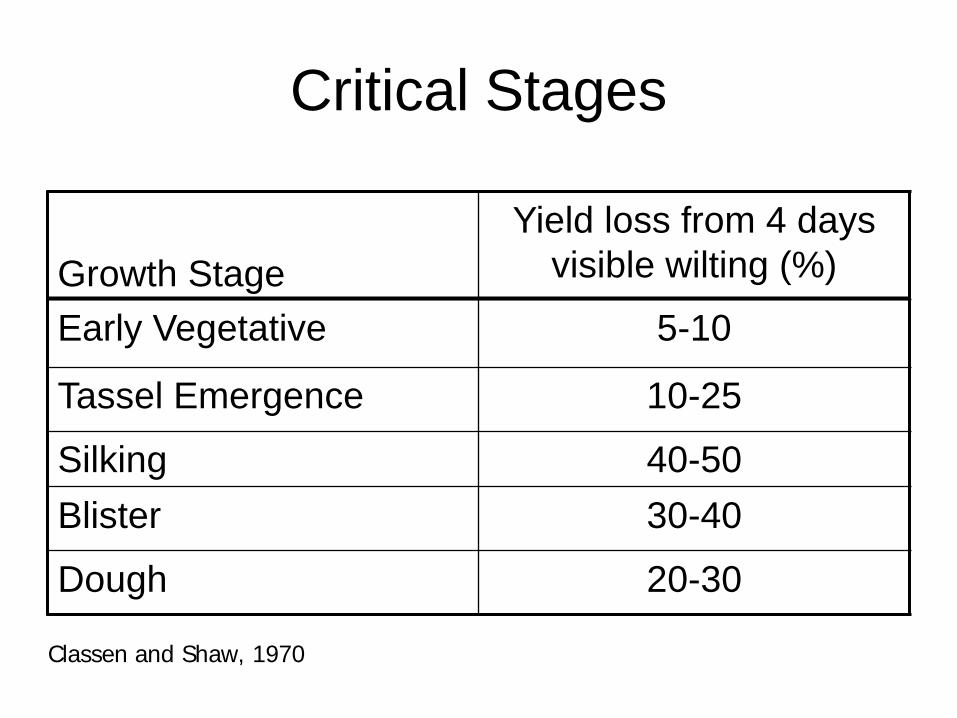
Critical Stages
Growth Stage
Yield loss from 4 days visible wilting (%)
Early Vegetative 5-10
Tassel Emergence 10-25
Silking 40-50 Blister 30-40
Dough 20-30
Classen and Shaw, 1970
Questions ?