Solar Ultraviolet Imager (SUVI) Thematic Maps Proving Ground


Martijn Tennekes
Creating thematic maps in R
OpenGeoHUB Summer School 2019 Münster

tmap: R package for thematic maps• A thematic map is a visualization where statistical information with a spatial component is
shown.
• Thematic maps can be also made with other R packages:
• plot (from the spatial method packages, e.g. sf and raster) Fast to plot spatial objects, but requires manual work to create thematic maps. Only static maps.
• ggplot2, Popular general data visualization package. Thematic maps can be made easily, but the layout requires some attention. Only static maps.
• leaflet, R interface to the popular Javascript library. Easy to produce maps of spatial objects, but requires manual work to create thematic maps. Only interactive maps.
• mapview, Excellent package to explore spatial objects quickly. Only interactive maps.
• The syntax of tmap is based on ggplot2 and the Grammar of Graphics, but works fluently with spatial objects from the sf, sp and raster packages.
• It supports two modes: plot (static maps) and view (interactive maps)
• Reference: Tennekes, M. (2018). tmap: Thematic Maps in R. Journal of Statistical Software, 84(6), 1-39.
• Development site http://github.com/mtennekes/tmap

4
The history of tmapPackage / version Date Description / new features
geoNL 2014 General functions to create thematic maps for theNetherlands
geo 2014-07 ggplot2 style approach to create thematic maps
tmap 0.6 2014-07 geo was accepted on CRAN, but had to be renamed…“geo” was too general
tmap 1.0 2015-05 First stable release of tmap
tmap 1.4 2016-03 View mode added (i.e. interactive maps)
tmap 1.11-2 2018-04 Version described in the JSS paper
tmap 2.0 2018-07 Migration from sp to sf
tmap 2.3 2019-07 shiny integration (with tmapOutput and renderTmap)
5
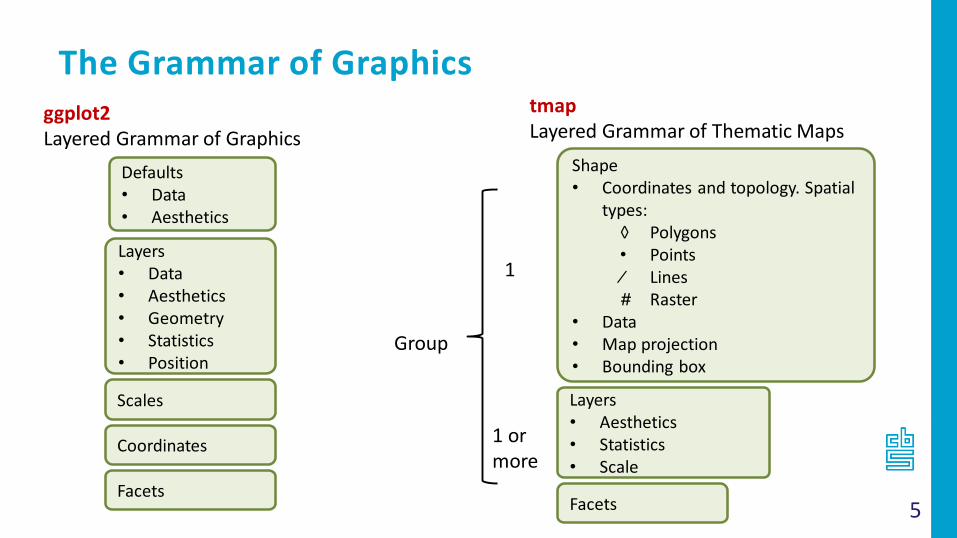
The Grammar of Graphics
Defaults• Data• Aesthetics
Coordinates
Scales
Layers• Data• Aesthetics• Geometry• Statistics• Position
Facets
Shape• Coordinates and topology. Spatial
types:◊ Polygons• Points⁄ Lines# Raster
• Data• Map projection• Bounding box
Layers• Aesthetics• Statistics• Scale
ggplot2Layered Grammar of Graphics
Facets
Group
1
1 or more
tmapLayered Grammar of Thematic Maps

6
Example: choropleth
# load example datasets
data("World")
# draw polygons
tm_shape(World) + tm_polygons()
# draw polygons with a specific color
tm_shape(World) + tm_polygons("blue")
# draw polygons colored by a data variable
# the result is called a choropleth
tm_shape(World) + tm_polygons("income_grp")

7
Example: a bubble map
# load example dataset
data("metro")
# draw dotstm_shape(metro) +
tm_dots()
# draw a bubble maptm_shape(metro) +
tm_bubbles(“pop2020")
# draw a colored bubble map
tm_shape(metro) +
tm_bubbles("pop2020", col = "growth") # combine choropleth with bubble map
tm_shape(World) +
tm_polygons("income_grp") +
tm_shape(metro) +
tm_bubbles("pop2020", col = "growth")

8
Example: choropleth with bubble map

9
tmap contains two modes:
plot: static maps, shown in graphics device window; can be exported to png, jpg, pdf, etc.
view: interactive maps, shown in the viewing window or in the browser; can be exported to standalone HTML files
Two modes: plot and view
# switch to plot mode:tmap_mode("plot")
# switch to view mode:tmap_mode("view")
# toggle between modes:ttm()

10
The last plot in view mode
# switch to view mode:tmap_mode("view")
# repeat the last plot (but now in view mode)tmap_last()

11
Change style
... +tm_style("classic")

12
Facets
# specify multiple variables
tm_shape(World) +
tm_polygons(c("HPI", "gdp_cap_est"))

13
Facets
tm_shape(crimes_city) +tm_dots() +tm_facets(by = "Crime.type", free.coords = FALSE)

14
Output functions
Create animation:
Save to image:tm_twitter <- tm_shape(NLD_muni) + tm_polygons() + tm_shape(NLD_twitter) + tm_dots()
tmap_save (tm_twitter, filename = "twitter.png", width = 600, height = 800)
tmap_animation(...)
Save to interactive website: tmap_save (tm_twitter, filename = "twitter.html")
15
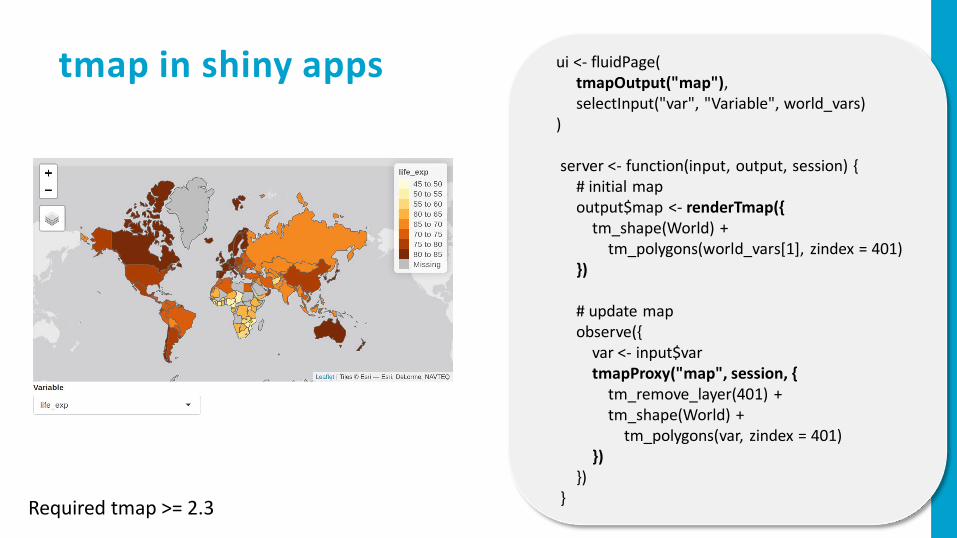
tmap in shiny apps ui <- fluidPage(tmapOutput("map"),selectInput("var", "Variable", world_vars)
)
server <- function(input, output, session) {# initial mapoutput$map <- renderTmap({
tm_shape(World) +tm_polygons(world_vars[1], zindex = 401)
})
# update mapobserve({
var <- input$vartmapProxy("map", session, {
tm_remove_layer(401) +tm_shape(World) +
tm_polygons(var, zindex = 401)})
})}
Required tmap >= 2.3

16
• If you familiar with ggplot2, and do not care about interactive maps, and do not prefer to learn yet another package? ggplot2
• Else if you want interactive maps as flexible as possible (albeit with more code)? leaflet
• Else if you just want to explore spatial objects of any sort interactively? mapview
• Else tmap
Which mapping package to use?

17
• tmap is a powerful package for spatial data visualization• It is based on the syntax of ggplot2, but tailored for maps• Other awesome mapping packages are ggplot2, leaflet, mapview• The key qualities of tmap are:
• Intuitive and easy to understand syntax (therefore very suitable for educational purposes)
• Many options to configure the map• Two modes: static and interactive maps
• The users are key in the development of software. Therefore, please to not hesitate to post questions, bug reports, or suggestions.
• Please use o StackOverflow for general questions, and o github for bug reports and suggestions.
Summary