THEMATIC MAPS BY PHOTOGRAMMETRIC TECNIQUES ON SATELLITE IMAGES · THEMATIC MAPS BY PHOTOGRAMMETRIC...
6
610 International Archives of Photogrammetry and Remote Sensing. Vol. XXXIII, Part B4. Amsterdam 2000. THEMATIC MAPS BY PHOTOGRAMMETRIC TECNIQUES ON SATELLITE IMAGES Eva Savina MALINVERNI*, Eliana Paola TONELLI** * Polytechnic of Milan, Place Leonardo da Vinci 32, 20133 Milan - Italy Tel. ++39-0223996505 Fax. ++39-0223996530 [email protected] ** National University of Sur Department of Geography (8000) Bahia Blanca - Buenos Aires - Argentina Working Group VI/3 KEY WORDS: Satellite Image, Digital Rectification, Thematic Map. ABSTRACT The idea of working on the cartographic production at scale 1: 100.000 comes from the real need of completing the cartographic information about the Natural Province Park called “BAHIA BLANCA, BAHIA FALSA Y BAHIA VERDE”, localized in the SW of Buenos Aires province, in Argentina. Following a simple photogrammetric approach, we did a digital rectification of a satellite image from LANDSAT, generated an important document for a good and up- to-date knowledge of the terrain and thematic maps describing quantitative and qualitative land information. 1 THE IMPORTANCE OF THE THEMATIC MAPS The monitoring of continuous changes in the environment is a subject of increasing interest not only in the scientific community. In the last period the particular attention for the environmental disasters and their interactions with the human activities has induced the geodetic and cartographic sciences to improve new instruments and new approaches for the analysis of these problems (Bellone, 1997). In fact is of general agreement the utility and the power of some technologies finalized to the land surveying (photogrammetry and remote sensing). These techniques can provide a new kind of instruments to observe and analyze the complex phenomena occurring on the earth. Moreover, thanks to the recent progress, data can be acquired and processed in a shorter time, so a fast cartographic production and a good updating can be achieved. The images used in photogrammetry and remote sensing are usually taken from satellite platforms, which provide continuous land information for a dynamic control of the evolution of the phenomena (Bellone, 1996b). The first elements that can be identified from raster satellite images are natural and human structures well identifiable on the land. In fact the sensors carried on the satellite platforms record the different energy coming from natural and human structures on the earth. The differences in the spectral firms describe the distinctive characteristics of the environment, that is, they represent a very important survey information. Due to the flight height, thematic maps obtained by satellite images are always at small scales. The scale reduction of a map is of big importance, because it influences the amount of elements that can be contained in the map. By means of photogrammetric techniques, it is possible to provide cartographic representations, using analytical instruments or new procedures implemented in digital systems. These may be of different types, according to the single applications (Bellone, 1996a). A technical map, in form of vector map, is a good way to represent the observed changes, but it is not always suitable to a dynamic control of the environment. On the other hand, other cartographic products, i.e. orthoimages, differential rectifications, planar rectifications, without or with the overlay of the vector elements, can achieve the task. These kind of maps, called raster maps, are an alternative but also a complementary representation to realize complete thematic maps, which describe different phenomena. A raster map contains all the elements that were contained in the original aerial or satellite image. It is very rich of information, sometimes too much, but it is necessary to realize a good thematic map. The thematic map can be overlaid on the raster rectified image, then other elements like toponyms, break lines, altimetry, …, can be added in order to provide a complete representation of the territory. Raster and vector data describing a territory can be collected in a GIS (Geographical Information System). Technical and thematic maps are important data set for a GIS; the data base, containing a lot of information about the Eva Savine Malinverni
Transcript of THEMATIC MAPS BY PHOTOGRAMMETRIC TECNIQUES ON SATELLITE IMAGES · THEMATIC MAPS BY PHOTOGRAMMETRIC...
610 International Archives of Photogrammetry and Remote Sensing. Vol. XXXIII, Part B4. Amsterdam 2000.
THEMATIC MAPS BY PHOTOGRAMMETRIC TECNIQUES ON SATELLITE IMAGES
Eva Savina MALINVERNI*, Eliana Paola TONELLI***Polytechnic of Milan,
Place Leonardo da Vinci 32, 20133 Milan - ItalyTel. ++39-0223996505Fax. ++39-0223996530
[email protected]**National University of SurDepartment of Geography
(8000) Bahia Blanca - Buenos Aires - Argentina
Working Group VI/3
KEY WORDS: Satellite Image, Digital Rectification, Thematic Map.
ABSTRACT
The idea of working on the cartographic production at scale 1: 100.000 comes from the real need of completing thecartographic information about the Natural Province Park called “BAHIA BLANCA, BAHIA FALSA Y BAHIAVERDE”, localized in the SW of Buenos Aires province, in Argentina. Following a simple photogrammetric approach,we did a digital rectification of a satellite image from LANDSAT, generated an important document for a good and up-to-date knowledge of the terrain and thematic maps describing quantitative and qualitative land information.
1 THE IMPORTANCE OF THE THEMATIC MAPS
The monitoring of continuous changes in the environment is a subject of increasing interest not only in the scientificcommunity. In the last period the particular attention for the environmental disasters and their interactions with thehuman activities has induced the geodetic and cartographic sciences to improve new instruments and new approachesfor the analysis of these problems (Bellone, 1997).In fact is of general agreement the utility and the power of some technologies finalized to the land surveying(photogrammetry and remote sensing). These techniques can provide a new kind of instruments to observe and analyzethe complex phenomena occurring on the earth. Moreover, thanks to the recent progress, data can be acquired andprocessed in a shorter time, so a fast cartographic production and a good updating can be achieved.The images used in photogrammetry and remote sensing are usually taken from satellite platforms, which providecontinuous land information for a dynamic control of the evolution of the phenomena (Bellone, 1996b).The first elements that can be identified from raster satellite images are natural and human structures well identifiableon the land. In fact the sensors carried on the satellite platforms record the different energy coming from natural andhuman structures on the earth. The differences in the spectral firms describe the distinctive characteristics of theenvironment, that is, they represent a very important survey information. Due to the flight height, thematic mapsobtained by satellite images are always at small scales. The scale reduction of a map is of big importance, because itinfluences the amount of elements that can be contained in the map.By means of photogrammetric techniques, it is possible to provide cartographic representations, using analyticalinstruments or new procedures implemented in digital systems. These may be of different types, according to the singleapplications (Bellone, 1996a).A technical map, in form of vector map, is a good way to represent the observed changes, but it is not always suitable toa dynamic control of the environment. On the other hand, other cartographic products, i.e. orthoimages, differentialrectifications, planar rectifications, without or with the overlay of the vector elements, can achieve the task. These kindof maps, called raster maps, are an alternative but also a complementary representation to realize complete thematicmaps, which describe different phenomena.A raster map contains all the elements that were contained in the original aerial or satellite image. It is very rich ofinformation, sometimes too much, but it is necessary to realize a good thematic map. The thematic map can be overlaidon the raster rectified image, then other elements like toponyms, break lines, altimetry, …, can be added in order toprovide a complete representation of the territory.Raster and vector data describing a territory can be collected in a GIS (Geographical Information System). Technicaland thematic maps are important data set for a GIS; the data base, containing a lot of information about the
Eva Savine Malinverni
Eva Savine Malinverni
611International Archives of Photogrammetry and Remote Sensing. Vol. XXXIII, Part B4. Amsterdam 2000.
environment, can generate thematic maps regarding not only the metric and morphologic aspects, but also qualitative,economic, social and political information.The thematic maps obtained by a direct survey regarding a specific characteristic of the environment are used as basicthematic maps. On the other hand, the thematic maps of synthesis are generated by an expert analysis of different kindsof land objects and collect more information.The qualitative aspect of an image is of great importance when a vector representation becomes sometimes a simple andrestricted map. In a GIS, raster information is connected or connect vector information.
2 A SIMPLE PHOTOGRAMMETRIC APPROACH
When digital rectification of a raster image is useful to survey the territory, a simple photogrammetric approach can beused. It becomes necessary to use a method the fastest and simplest as possible, in order to reduce production time andcosts, and to avoid highly qualified personnel.Photogrammetry is a technique that allows to survey 2D and 3D shaped real objects starting from the stereo - analysisof the images. It is mostly used to survey lands and to produce the cartographic database for a GIS.The data acquired by digital sensors (CCD camera - Three-Line Camera, Landsat, Spot) or analogue sensors (film) canbe transformed by analytical techniques in a basic document to study the reality: the map.The transformation from the image space to the object space, using photogrammetric techniques, produces 2D and 3Drepresentations of the reality (DEM, DTM, orthoimages, rectifications, etc.) (Albertella, 1998). These data are animportant instrument to obtain a good and up-to-date knowledge of the terrain.In the following we show a photogrammetric approach to produce a digital rectification of a satellite image over a flatland and, in a second time, a series of vector thematic maps at a small scale. We obtained a map using only one image,because the terrain was considered flat (sea level) and the omographic relations could be applied. In this case, simplerectifications can be easily generated with a straight-forward interactive procedure, just identifying control points with apointing device. On the other hand, if the object surface can not be approximated by a plane or by a sequence of parallelplanes, differential rectification must be used, and a DTM is required in order to generate an orthoimage. If even theorthoimage is not suited to the purpose, an alternative representation consists in the solid model of the object and in itstexture mapping (Malinverni, 1998). This is obviously the 3D full description of the object.The raster image can be constituted by a gray value matrix (a regular grid of picture elements called pixels) or by three-color matrices. The algorithms and procedures that can be apply to the image are: radiometric processing to improve thesemantics, recognition of morphologic characteristics (feature extraction) and automatic or semi-automatic correlationin stereo viewing to acquire metric information (image matching). It is also possible to use a multi-resolution procedureto have good results in short time.The digital rectification is not possible if the land is not geometrically flat or roughly flat. The shift from the planarity isdefined as a function of the acceptable error at the scale of the final map.The analytical expressions used to provide the rectification are the collinearity equations applied to the planar case (Zobject = 0), that is, an omographic relation with 8 parameters.
1111
++
++
=
vyux
cybxaX (1)
1222
++
++
=
vyux
cybxaY (2)
The solution can be calculated using one image and at least four control points, known in the object and in the imagesystem. By using more than four points, it is possible to obtain a least square solution, which is more reliable andconsistent.
3 THE APPLICATION
The idea of working on the production of cartographic maps at scale 1: 100.000 comes from the real need of completingthe cartographic information of the Natural Province Park called “ BAHIA BLANCA, BAHIA FALSA Y BAHIAVERDE” , founded in 1996. This region is localized in Argentina, on the Atlantic coast, in the SW of Buenos Airesprovince, approximately at 39º South latitude and 61º West longitude. Thanks to the amount of information containedand the techniques used, this cartographic work can be considered a starting point for future investigations: in fact thecomplete cartographic information doesn’t exist and if it does, it is not always available.
612 International Archives of Photogrammetry and Remote Sensing. Vol. XXXIII, Part B4. Amsterdam 2000.
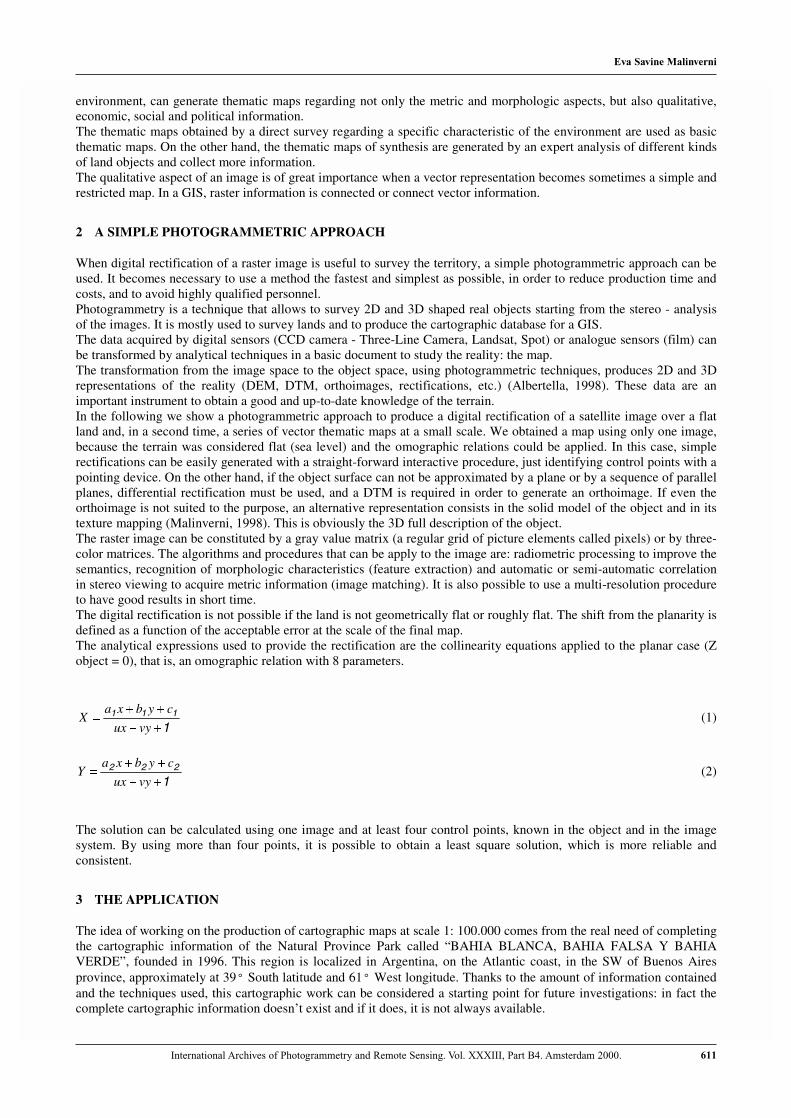
The cartographic information available at the beginning of the work consisted of the Map of I.G.M. (GeographicMilitary Institution in Argentina) at scale 1:100.000 of Bahia Blanca and Estancia El Algarrobo and the TopographicMap of I.G.M. at the scale 1: 500.000 of Bahia Blanca Region. The original image used to generate the thematic mapsis a LANDSAT scanner image at the scale of about 1:2.000.000, provided by IADO (Argentine Institute ofOceanography), with 16 millions colors and of 65µm (400 dpi) of geometric resolution (Figure 1).
Figure 1. The original satellite image
We transformed this image in a gray value image for the rectification. Then, after measuring 25 control points localizedon the image and recognized on the maps at different scales, the original image was transformed in a correct image mapat scale 1:100.000, by using the collinearity equations applied to the plane case. In fact the area, covering the coast ofthe Bahia and the saltworks, is flat, so the height is assumed approximately constant, referring to the sea level.The mathematical solution has been obtained using a software implemented at the DIIAR - Polytechnic of Milan (Italy)(Malinverni, 1996), based on a least square solution. The first solution of the 8 parameters of the omography is in table2; with s0 = 0.189780 km.
1a = 12906.7339
2a = -217.452185
1b =52.0979263
2b =13053.748
1c = -852509.058
2c = -855760.32
u = -9.4660043E-05v =-1.40032915E-05
Table 2. The omographic parameters of the first solution
In a second time, to obtain a better solution, we used the same observations, but with different weights: theobservations, whose residuals were higher than a threshold value (t), equal to 10 meters (half the graphic error for a mapat a scale of 1:100.000), were under-weighted. So in the new solution the weight was calculated as:
tiv if p £=1 (3)
tv if t
vp i
i>= (4)
Eva Savine Malinverni
Eva Savine Malinverni
613International Archives of Photogrammetry and Remote Sensing. Vol. XXXIII, Part B4. Amsterdam 2000.
The solution was good (see table 3) with s0 = 0.039302 km.
1a = 12937.4603
2a = -211.875195
1b =50.8291291
2b = 13083.7958
1c = -855277.08
2c =-860506.208
u =-9.26556231E-05v = -1.02941106E-05
Table 3. The omographic parameters of the second solution
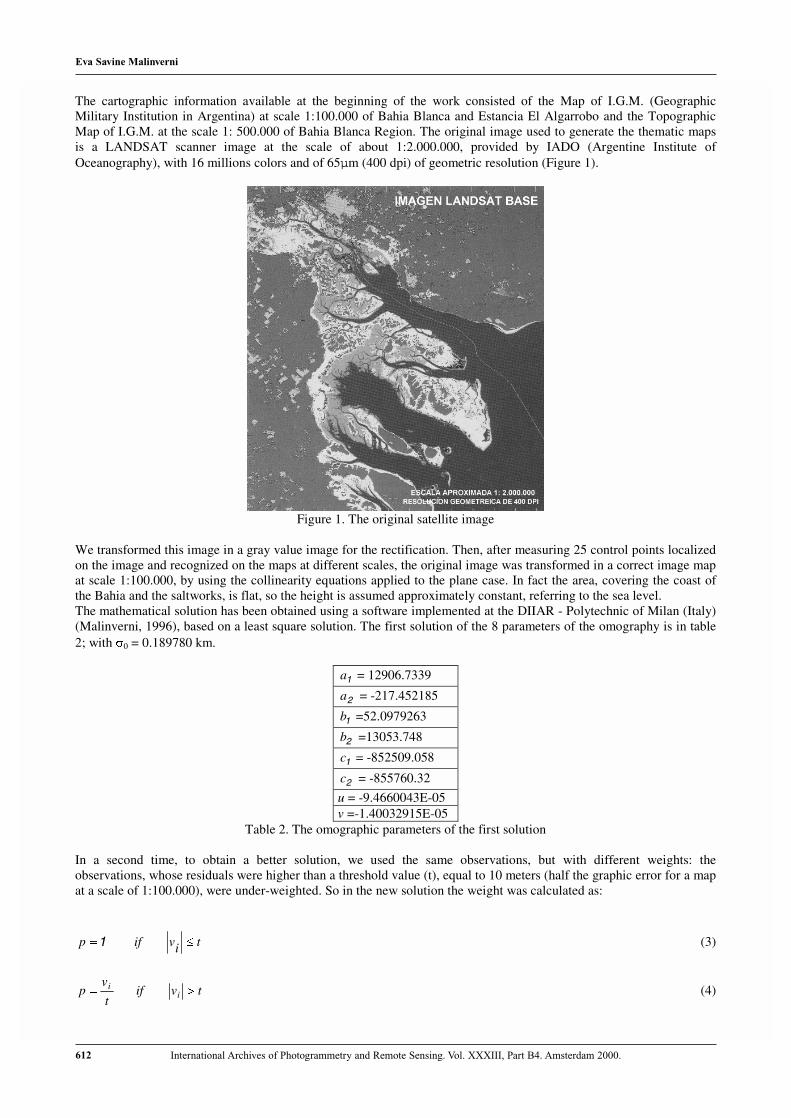
The values are still high for the production of a map at scale 1:100.000, but they are good result if we consider that thesatellite image was at scale 1:2.000.000.The estimated parameters of the omographic transformation have been used for the digital rectification of the originalimage. The distortion adjustment has been provided by assigning to each pixel its correct geometric position and a newradiometric value, calculated from a linear interpolation of the four neighboring pixels, localized in the original imageby means the inverse omographic expressions:
� �� � � �� �� �� � � �� �uYavXbuXavYb
cYvXbcXvYbx
-----
-----
=
2112
2112 (5)
� �� � � �� �� �� � � �� �vYbuXavXbuYa
cYuXacXuYay
-----
-----
=
2112
2112 (6)
The rectified image is at scale 1:100.000 (Figure 4).
Figure 4. The rectified image
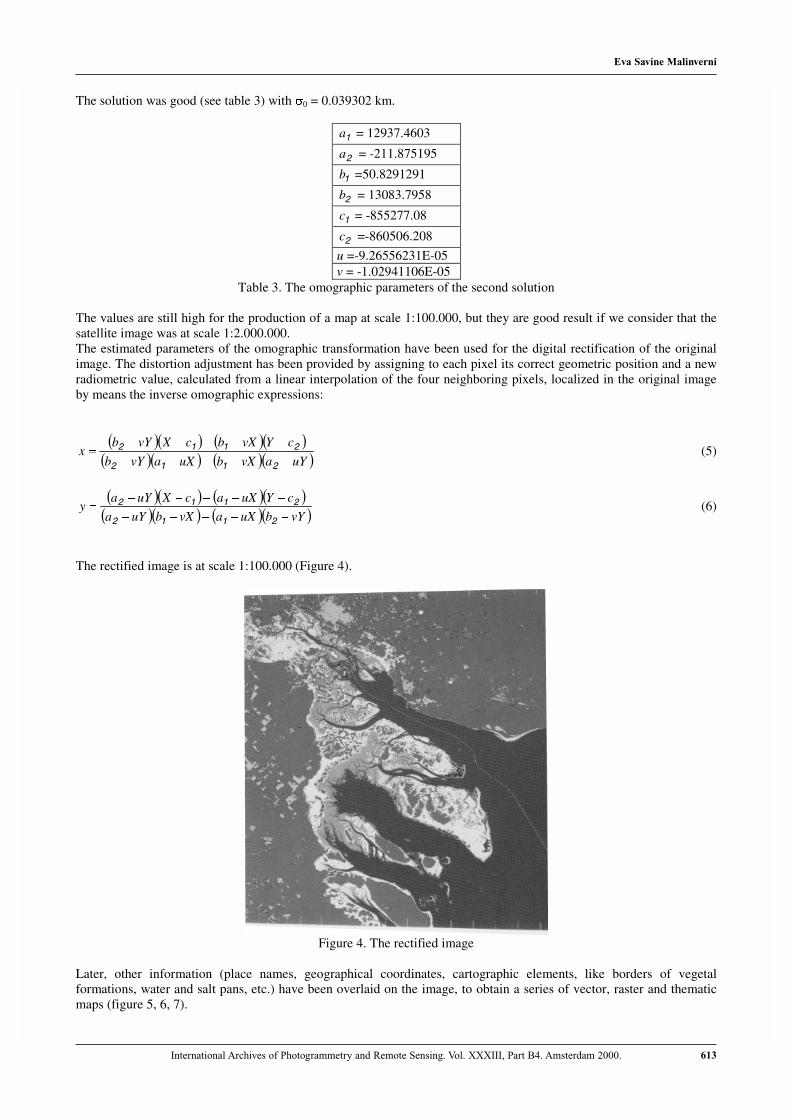
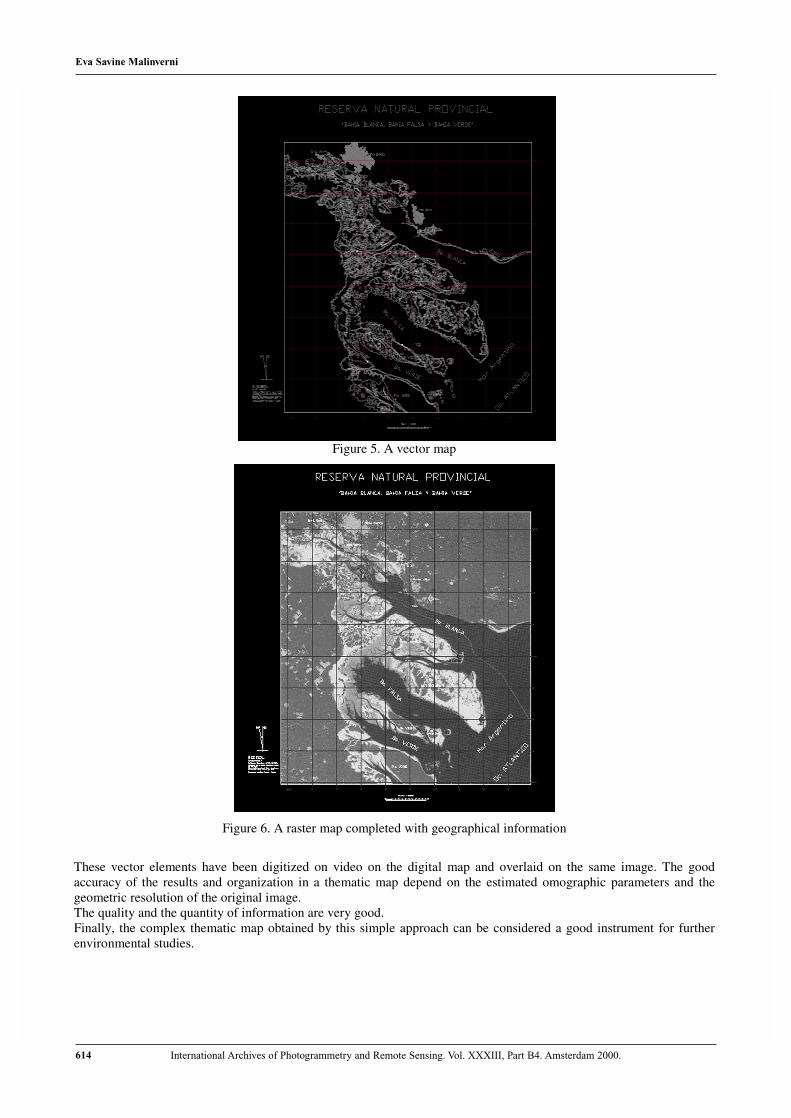
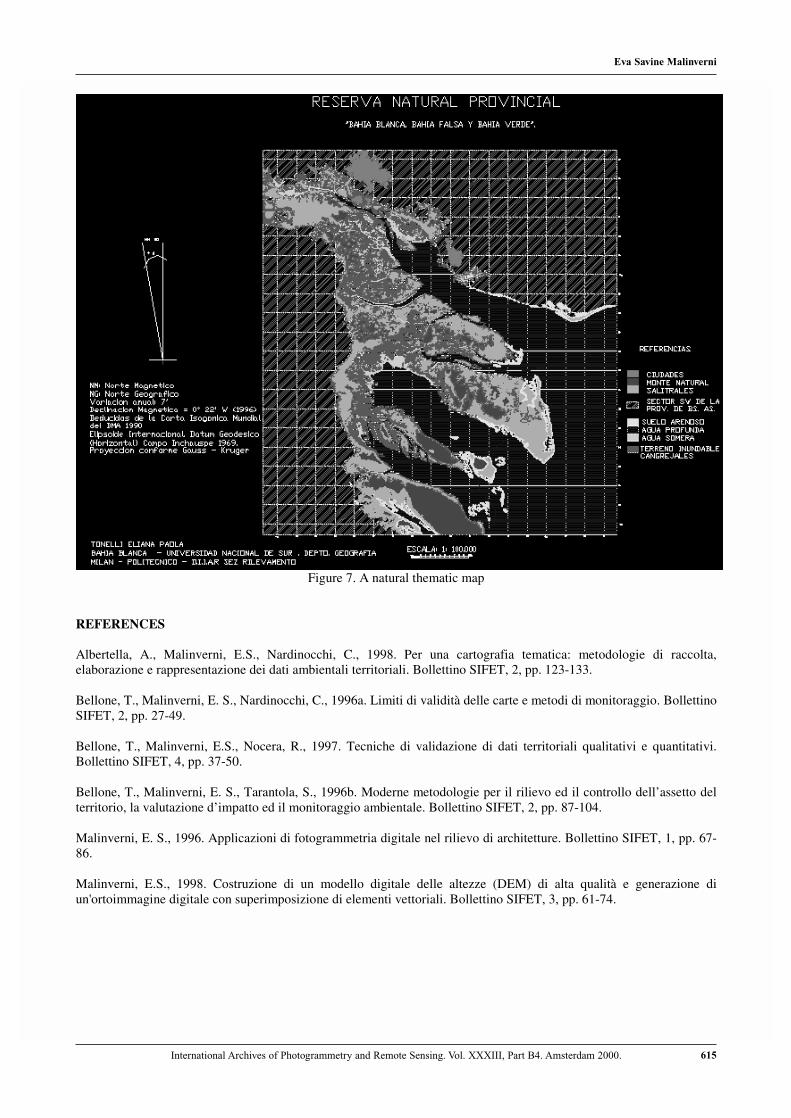
Later, other information (place names, geographical coordinates, cartographic elements, like borders of vegetalformations, water and salt pans, etc.) have been overlaid on the image, to obtain a series of vector, raster and thematicmaps (figure 5, 6, 7).
614 International Archives of Photogrammetry and Remote Sensing. Vol. XXXIII, Part B4. Amsterdam 2000.
Figure 5. A vector map
Figure 6. A raster map completed with geographical information
These vector elements have been digitized on video on the digital map and overlaid on the same image. The goodaccuracy of the results and organization in a thematic map depend on the estimated omographic parameters and thegeometric resolution of the original image.The quality and the quantity of information are very good.Finally, the complex thematic map obtained by this simple approach can be considered a good instrument for furtherenvironmental studies.
Eva Savine Malinverni
Eva Savine Malinverni
615International Archives of Photogrammetry and Remote Sensing. Vol. XXXIII, Part B4. Amsterdam 2000.
Figure 7. A natural thematic map
REFERENCES
Albertella, A., Malinverni, E.S., Nardinocchi, C., 1998. Per una cartografia tematica: metodologie di raccolta,elaborazione e rappresentazione dei dati ambientali territoriali. Bollettino SIFET, 2, pp. 123-133.
Bellone, T., Malinverni, E. S., Nardinocchi, C., 1996a. Limiti di validità delle carte e metodi di monitoraggio. BollettinoSIFET, 2, pp. 27-49.
Bellone, T., Malinverni, E.S., Nocera, R., 1997. Tecniche di validazione di dati territoriali qualitativi e quantitativi.Bollettino SIFET, 4, pp. 37-50.
Bellone, T., Malinverni, E. S., Tarantola, S., 1996b. Moderne metodologie per il rilievo ed il controllo dell’assetto delterritorio, la valutazione d’impatto ed il monitoraggio ambientale. Bollettino SIFET, 2, pp. 87-104.
Malinverni, E. S., 1996. Applicazioni di fotogrammetria digitale nel rilievo di architetture. Bollettino SIFET, 1, pp. 67-86.
Malinverni, E.S., 1998. Costruzione di un modello digitale delle altezze (DEM) di alta qualità e generazione diun'ortoimmagine digitale con superimposizione di elementi vettoriali. Bollettino SIFET, 3, pp. 61-74.