Creating Competitive Advantage by Rethinking B2B Software ...
123
Creating Competitive Advantage by Rethinking B2B Software Pricing CARL ADELSTRAND EMIL BROSTEDT Master of Science Thesis Stockholm, Sweden 2016
Transcript of Creating Competitive Advantage by Rethinking B2B Software ...

Creating Competitive Advantage by
Rethinking B2B Software Pricing
CARL ADELSTRAND
EMIL BROSTEDT
Master of Science Thesis
Stockholm, Sweden 2016

This page intentionally left blank
Creating Competitive Advantage by Rethinking
B2B Software Pricing
”Innovation in pricing may be a company’s most powerful—and, in many cases, least
explored—source of competitive advantage”
(Hinterhuber & Liozu 2014, p.1)
Carl Adelstrand, Emil Brostedt
Stockholm, Sweden, June 02, 2016
Industrial Engineering and Management
ITM
Royal Institute of Technology

This page intentionally left blank

Examensarbete INDEK 2016:12
Skapa konkurrensfördel genom att utvärdera B2B-prissättning
av mjukvara
Carl AdelstrandEmil Brostedt
Godkänt
2016-06-02Examinator
Esmail Salehi-SangariHandledare
Henrik BlomgrenUppdragsgivare
N/AKontaktperson
N/A
Master of Science ThesisINDEK 2016:12
Creating Competitive Advantage by Rethinking B2B Software Pricing
Carl AdelstrandEmil Brostedt
Approved
2016-06-02Examiner
Esmail Salehi-SangariSupervisor
Henrik BlomgrenCommissioner
N/AContact person
N/A
Abstract
The choice of pricing model for software products is a complex procedure
due to the di↵erent characteristics compared to physical products. This thesis
investigates and compares software pricing models in a B2B setting, and de-
scribes how KAM plays a role in executing a pricing model. The research has
been conducted as an opportunist case study on Adebro, a technology com-
pany in the B2B sector. The thesis have come to the following conclusions,
with data from interviews and literature:
• Perpetual license is, and will continue to be, an attractive pricing model
for Adebro. However, a subscription-based usage independent pricing
model is also attractive for the future.
• Implications of switching pricing model would be largest when changing
between a perpetual and subscription model, where revenue will have
the most visual impact.
• The most important task for KAM is to communicate the change to
current and new customers. KAM and the pricing model must also be
structured to support each other to be successful.
The thesis contributes to science by providing research on pricing models for
manufacturing related software. However, studies concerning the weighting of
importance for di↵erent pricing parameters would be of interest for the future.
Key Words: Pricing Models, Pricing, Software, Key Account Management,
Perpetual license, Subscription, SaaS, CAM, GD&T, SPC, Metrology
i

This page intentionally left blank
ii
Examensarbete INDEK 2016:12
Skapa konkurrensfördel genom att utvärdera B2B-prissättning
av mjukvara
Carl AdelstrandEmil Brostedt
Godkänt
2016-06-02Examinator
Esmail Salehi-SangariHandledare
Henrik BlomgrenUppdragsgivare
N/AKontaktperson
N/A
Master of Science ThesisINDEK 2016:12
Creating Competitive Advantage by Rethinking B2B Software Pricing
Carl AdelstrandEmil Brostedt
Approved
2016-06-02Examiner
Esmail Salehi-SangariSupervisor
Henrik BlomgrenCommissioner
N/AContact person
N/A
Sammanfattning
Valet av prismodell for mjukvaror ar en komplex procedur pa grund av
dess olika egenskaper jamfort med fysiska produkter. Detta examensarbete
undersoker och jamfor prismodeller for mjukvara i B2B sammanhang, och
beskriver vilken roll KAM har i genomforandet av en prismodell. Studien
genomfordes som en opportunistisk case studie pa Adebro, ett teknikforetag
inom B2B sektorn. Uppsatsen har kommit till foljande slutsatser, baserat pa
data fran intervjuer och litteratur:
• Perpetual-licenser ar, och kommer fortsatta att vara, en attraktiv pris-
modell for Adebro. Dock ar prenumerationsbaserade prismodeller, med
pris oberoende av anvandande, attraktiva for framtiden.
• De storsta e↵ekterna fran ett prismodellsbyte kommer nar man byter
mellan perpetual-licenser och prenumerationslicenser, dar det kommer
bli mest synligt pa intakterna.
• Den viktigaste uppgiften for KAM ar att kommunicera prismodellen
till kunderna. KAM och prismodellen maste ocksa vara strukturerade
pa ett sadant satt att de stodjer varandra for att na hogst potential.
Uppsatsen bidrar till vetenskapen genom att bista med forskning om pris-
modeller for tillverkningsrelaterade mjukvaror. Framover vore det intressant
att se vidare forskning som utreder vikten av de olika parametrarna av en
prismodell.
Nyckelord: Prismodeller, Prissattning, Mjukvara, Key Account Manage-
ment, Perpetual-licens, Prenumeration, SaaS, CAM, GD&T, SPC, Matteknik
iii

This page intentionally left blank
iv

Declaration
’We declare that all material in this thesis is entirely our own work and
has not been previously submitted to this or any other institution. All material
in this thesis that is not our own work has been acknowledged and we have
stored all material used in this research, including research data, preliminary
analysis, notes, interviews, and drafts, and can produce them on request.’
Carl Adelstrand
Signature
June 02, 2016Date
Emil Brostedt
Signature
June 02, 2016Date
v

This page intentionally left blank
vi

Acknowledgements
First of all, we are grateful to have been given the opportunity to write
this thesis, which will be the end of a five year journey towards a degree.
We would like to thank our supervisor at KTH, Associate Professor Dr.
Henrik Blomgren, who always encouraged us to learn more and see things
from a di↵erent perspective.
We would also like to express our gratitude to our supervisor at Adebro,
OP, for guiding us throughout the work and providing access to data points
and interview objects when needed. We would also like to thank OJ for
proofreading and commenting on the content.
Additionally, we would like to record our sincere thanks to the opponents
who have read the thesis and given us feedback on what could be improved.
Finally, we wish to express sincere and deep gratitude to all the people
involved in this thesis, especially all interviewees who we could not have
finished the thesis without.
vii

This page intentionally left blank
viii
Contents
1 Introduction 1
1.1 Background . . . . . . . . . . . . . . . . . . . . . . . . . . . . . . . 1
1.2 Problem Formulation . . . . . . . . . . . . . . . . . . . . . . . . . . 2
1.3 Purpose and Aim . . . . . . . . . . . . . . . . . . . . . . . . . . . . 3
1.4 Research Questions . . . . . . . . . . . . . . . . . . . . . . . . . . . 4
1.5 Delimitations . . . . . . . . . . . . . . . . . . . . . . . . . . . . . . 4
1.6 Contribution to Science . . . . . . . . . . . . . . . . . . . . . . . . . 5
1.7 Disposition . . . . . . . . . . . . . . . . . . . . . . . . . . . . . . . 5
2 Literature Review 7
2.1 General Pricing . . . . . . . . . . . . . . . . . . . . . . . . . . . . . 7
2.2 Software Pricing . . . . . . . . . . . . . . . . . . . . . . . . . . . . . 13
2.3 Key Account Management . . . . . . . . . . . . . . . . . . . . . . . 23
2.4 Summary of Literature Review . . . . . . . . . . . . . . . . . . . . 30
3 Method 33
3.1 Research Approach . . . . . . . . . . . . . . . . . . . . . . . . . . . 33
3.2 Research Process . . . . . . . . . . . . . . . . . . . . . . . . . . . . 34
3.3 Quality of the Research Design . . . . . . . . . . . . . . . . . . . . 39
3.4 Ethics of Methods Used . . . . . . . . . . . . . . . . . . . . . . . . 40
4 Findings 43
4.1 RQ1: What software pricing models are attractive for Adebro in
terms of market trends, customer preferences, and internal capabilities? 43
4.2 RQ2: What are the implications of switching pricing model? . . . . 54
4.3 RQ3: What role plays KAM in regards to implementation and exe-
cution of software pricing models? . . . . . . . . . . . . . . . . . . . 64
ix

5 Discussion 69
5.1 Value-Based Price Setting . . . . . . . . . . . . . . . . . . . . . . . 69
5.2 Formulation of the Pricing Model . . . . . . . . . . . . . . . . . . . 70
5.3 Investor Relations . . . . . . . . . . . . . . . . . . . . . . . . . . . . 74
5.4 The Role of KAM . . . . . . . . . . . . . . . . . . . . . . . . . . . . 75
5.5 Sustainability . . . . . . . . . . . . . . . . . . . . . . . . . . . . . . 76
6 Conclusion 77
6.1 Connection to Research Questions . . . . . . . . . . . . . . . . . . . 77
6.2 Contribution to Science . . . . . . . . . . . . . . . . . . . . . . . . . 79
6.3 Limitations and Further Research . . . . . . . . . . . . . . . . . . . 80
6.4 Final Words . . . . . . . . . . . . . . . . . . . . . . . . . . . . . . . 82
References 83
A Appendix - Overview of Interviewees 91
B Appendix - Interview Guide 93
B.1 Experts . . . . . . . . . . . . . . . . . . . . . . . . . . . . . . . . . 93
B.2 Vendors . . . . . . . . . . . . . . . . . . . . . . . . . . . . . . . . . 94
B.3 Buyers . . . . . . . . . . . . . . . . . . . . . . . . . . . . . . . . . . 95
C Appendix - Financial Projections 97
C.1 Assumptions . . . . . . . . . . . . . . . . . . . . . . . . . . . . . . . 97
C.2 Payback and CAGR . . . . . . . . . . . . . . . . . . . . . . . . . . 97
C.3 Plots . . . . . . . . . . . . . . . . . . . . . . . . . . . . . . . . . . . 98
x

List of Figures
1 Evolutionary Steps of Who the Owner is . . . . . . . . . . . . . . . 3
2 The Pricing Capability Grid . . . . . . . . . . . . . . . . . . . . . . 8
3 Five Levels of World-Class Pricing . . . . . . . . . . . . . . . . . . . 10
4 A Roadmap for Innovation in Pricing . . . . . . . . . . . . . . . . . 12
5 The Six Parameters of Software Pricing . . . . . . . . . . . . . . . . 15
6 The SBIFT Model . . . . . . . . . . . . . . . . . . . . . . . . . . . 16
7 The Relational Development Model . . . . . . . . . . . . . . . . . . 28
8 Overview of the Research Process . . . . . . . . . . . . . . . . . . . 34
9 Overlapping Stages in Qualitative Data Analysis . . . . . . . . . . . 37
10 Price Development of Software and Hardware (2000-2014) . . . . . 44
11 Financial Projection of a Transition to Subscription . . . . . . . . . 59
12 Financial Projection of Running Two Pricing Models . . . . . . . . 59
13 Autodesk’s own Projected Revenue and Operating Margin . . . . . 61
14 Autodesk’s Share Price Development . . . . . . . . . . . . . . . . . 62
15 Aras’ Relative Number of Downloads per Month . . . . . . . . . . . 63
C.1 Financial Projection Case 1 . . . . . . . . . . . . . . . . . . . . . . 98
C.2 Financial Projection Case 2 . . . . . . . . . . . . . . . . . . . . . . 98
C.3 Financial Projection Case 3 . . . . . . . . . . . . . . . . . . . . . . 99
C.4 Financial Projection Case 4 . . . . . . . . . . . . . . . . . . . . . . 99
xi

This page intentionally left blank
xii
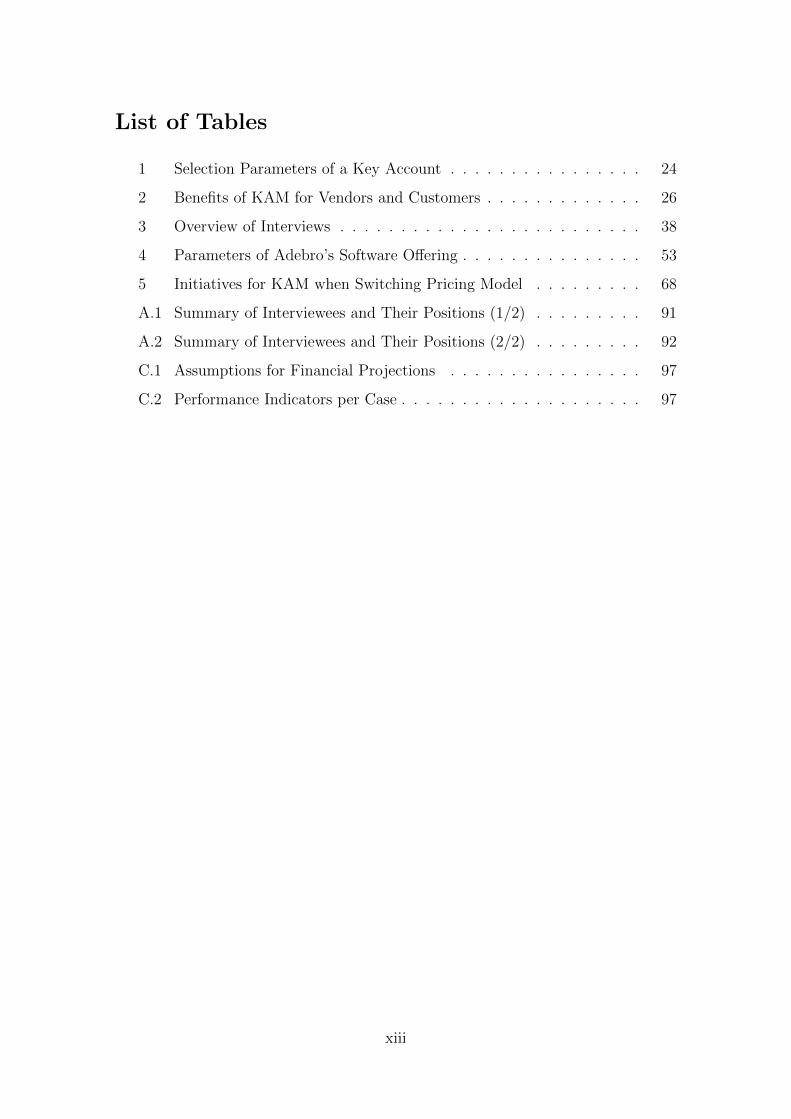
List of Tables
1 Selection Parameters of a Key Account . . . . . . . . . . . . . . . . 24
2 Benefits of KAM for Vendors and Customers . . . . . . . . . . . . . 26
3 Overview of Interviews . . . . . . . . . . . . . . . . . . . . . . . . . 38
4 Parameters of Adebro’s Software O↵ering . . . . . . . . . . . . . . . 53
5 Initiatives for KAM when Switching Pricing Model . . . . . . . . . 68
A.1 Summary of Interviewees and Their Positions (1/2) . . . . . . . . . 91
A.2 Summary of Interviewees and Their Positions (2/2) . . . . . . . . . 92
C.1 Assumptions for Financial Projections . . . . . . . . . . . . . . . . 97
C.2 Performance Indicators per Case . . . . . . . . . . . . . . . . . . . . 97
xiii

This page intentionally left blank
xiv
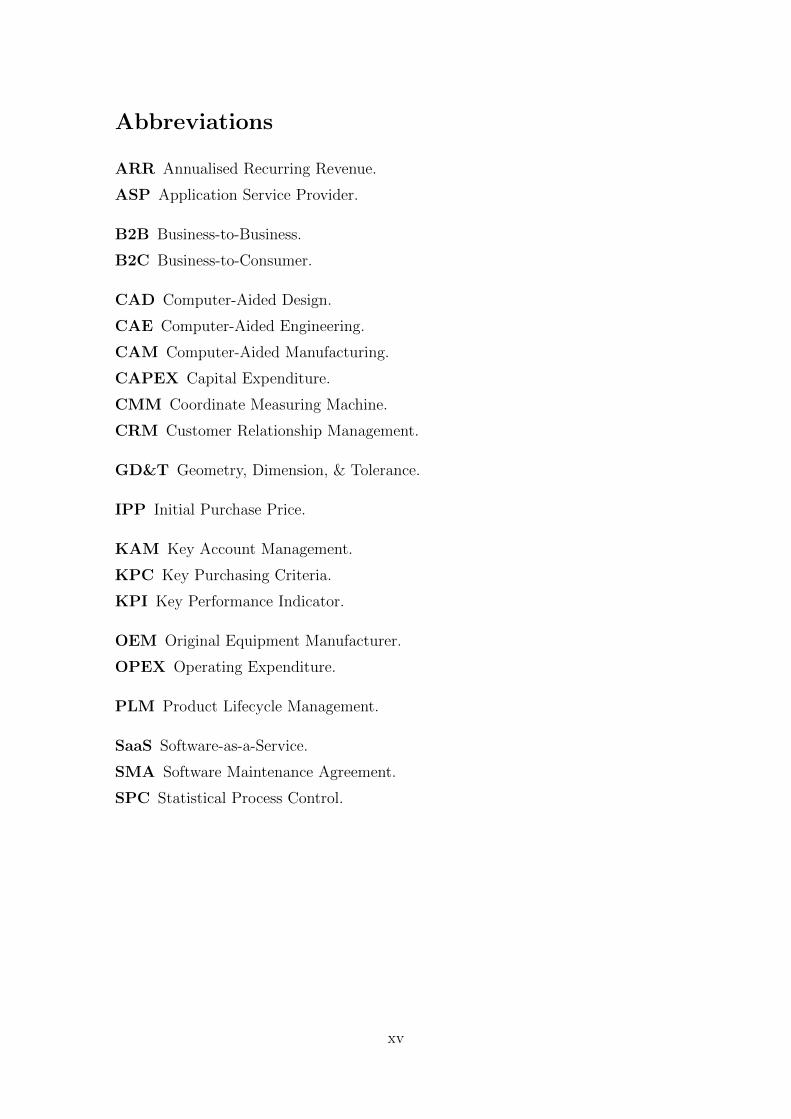
Abbreviations
ARR Annualised Recurring Revenue.
ASP Application Service Provider.
B2B Business-to-Business.
B2C Business-to-Consumer.
CAD Computer-Aided Design.
CAE Computer-Aided Engineering.
CAM Computer-Aided Manufacturing.
CAPEX Capital Expenditure.
CMM Coordinate Measuring Machine.
CRM Customer Relationship Management.
GD&T Geometry, Dimension, & Tolerance.
IPP Initial Purchase Price.
KAM Key Account Management.
KPC Key Purchasing Criteria.
KPI Key Performance Indicator.
OEM Original Equipment Manufacturer.
OPEX Operating Expenditure.
PLM Product Lifecycle Management.
SaaS Software-as-a-Service.
SMA Software Maintenance Agreement.
SPC Statistical Process Control.
xv

This page intentionally left blank
xvi
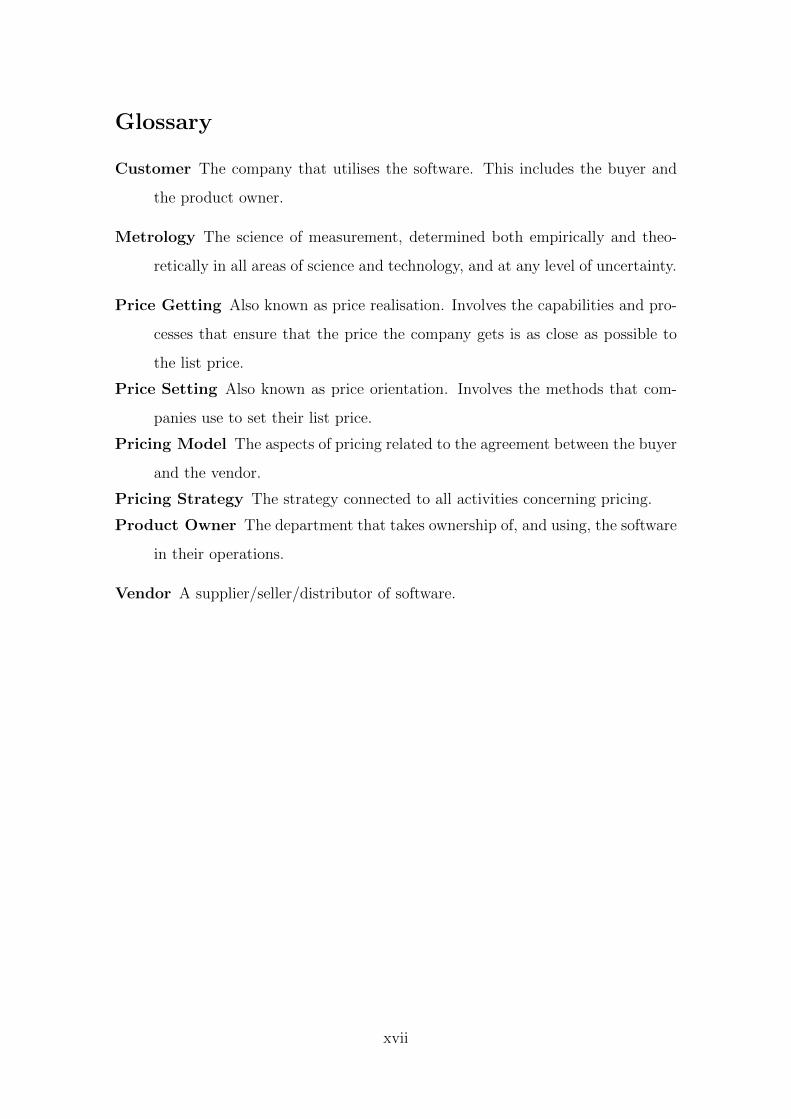
Glossary
Customer The company that utilises the software. This includes the buyer and
the product owner.
Metrology The science of measurement, determined both empirically and theo-
retically in all areas of science and technology, and at any level of uncertainty.
Price Getting Also known as price realisation. Involves the capabilities and pro-
cesses that ensure that the price the company gets is as close as possible to
the list price.
Price Setting Also known as price orientation. Involves the methods that com-
panies use to set their list price.
Pricing Model The aspects of pricing related to the agreement between the buyer
and the vendor.
Pricing Strategy The strategy connected to all activities concerning pricing.
Product Owner The department that takes ownership of, and using, the software
in their operations.
Vendor A supplier/seller/distributor of software.
xvii

This page intentionally left blank
xviii
1 Introduction
This chapter introduces the research, where it presents the background and the re-
search problem. It then follows with the purpose and the aim, the research questions,
the delimitations of the research as well as what the contribution to science is. It
ends with the disposition of the thesis.
1.1 Background
”Innovation in pricing may be a company’s most powerful—and, in
many cases, least explored—source of competitive advantage”
(Hinterhuber & Liozu 2014, p.1)
The choice of pricing model for software products is a complex procedure due
to di↵erent characteristics compared to physical products. It becomes even more
complex with the development of IT-technology, since it generates new possibilities
of both payment as well as delivery of the software and thus, new pricing models
are developed continuously (Harmon et al. 2009, Cusumano 2008, Bontis & Chung
2000, Choi et al. 1997).
This thesis investigates and compares software pricing models and describes
how Key Account Management (KAM) plays a role in executing a pricing model.
It focuses on pricing models and KAM of the software products o↵ered by Adebro,
a technology company in the Business-to-Business (B2B) sector.
Adebro is a company that o↵ers a comprehensive range of products and ser-
vices, both hardware and software, for various industrial applications. Adebro is a
developer of Geometry, Dimension, & Tolerance (GD&T), Computer-Aided Man-
ufacturing (CAM), Statistical Process Control (SPC), and visualisation software
and has a large product portfolio of both in-house developed and acquired software
packages. The software packages can be customised to meet customer demand and
deliver intelligent and e�cient data collection as well as analysis, management and
presentation of collected data. The GD&T software packages interacts with Co-
ordinate Measuring Machines (CMMs), and also interface with vision machines,
1

portable measuring arms, laser-trackers as well as equipment bought in from other
manufacturers.
Adebro is looking to integrate quality control into the manufacturing process by
centralising collected data from metrology applications to provide insights, analytics
and intelligent management systems to increase productivity. This has lead to a
strategic shift towards a more software oriented business. That is one of the reasons
why Adebro has, during the last couple of years, acquired several software companies
to strengthen their software portfolio.
1.2 Problem Formulation
It has been, and still is, an undergoing change in the market for enterprise software
where established vendors are embracing services due to declining product revenues.
This will have major implications for both users and developers of software products
or services (Cusumano 2008).
”In general, since 2000 or so, we’ve seen many enterprises and individ-
ual customers rebel against paying a lot of money for standardized or
commodity-type software products”
(Cusumano 2008, p.20)
Although Cusumano (2008) proposed this in 2008, the change is still undergoing
where players in the software market are changing their pricing models towards
subscription based pricing models (Miller 2016). The transition to subscription may
generate new possibilities to increase revenue, something that Adobe, a software
company that made the transition to subscription in 2013, can verify. However,
this is something a lot of companies struggle with (Miller 2016).
Adebro has built a software portfolio mainly from acquiring software companies
where all had its own strategy regarding pricing models. The acquired companies
have been kept fairly independent and not forced into a predetermined set of op-
erations. Thus, Adebro is selling software with inherited pricing models and have
not yet revised these models and aligned them to the overall strategy.
2
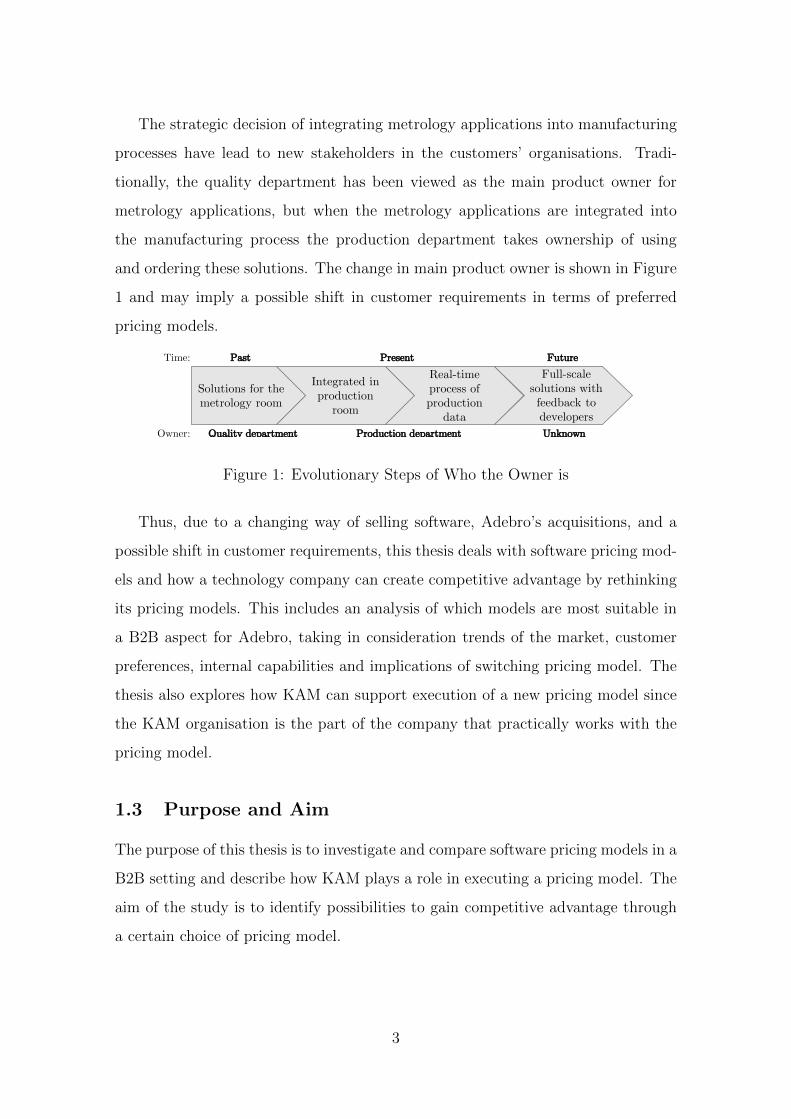
The strategic decision of integrating metrology applications into manufacturing
processes have lead to new stakeholders in the customers’ organisations. Tradi-
tionally, the quality department has been viewed as the main product owner for
metrology applications, but when the metrology applications are integrated into
the manufacturing process the production department takes ownership of using
and ordering these solutions. The change in main product owner is shown in Figure
1 and may imply a possible shift in customer requirements in terms of preferred
pricing models.
Integrated in production
roomSolutions for the metrology room
Real-time process of production
data
Past Present Future
Quality department Production department
Time:
Owner: Unknown
Full-scale solutions with feedback to developers
Figure 1: Evolutionary Steps of Who the Owner is
Thus, due to a changing way of selling software, Adebro’s acquisitions, and a
possible shift in customer requirements, this thesis deals with software pricing mod-
els and how a technology company can create competitive advantage by rethinking
its pricing models. This includes an analysis of which models are most suitable in
a B2B aspect for Adebro, taking in consideration trends of the market, customer
preferences, internal capabilities and implications of switching pricing model. The
thesis also explores how KAM can support execution of a new pricing model since
the KAM organisation is the part of the company that practically works with the
pricing model.
1.3 Purpose and Aim
The purpose of this thesis is to investigate and compare software pricing models in a
B2B setting and describe how KAM plays a role in executing a pricing model. The
aim of the study is to identify possibilities to gain competitive advantage through
a certain choice of pricing model.
3
1.4 Research Questions
To be able to fulfil the purpose and the aim of the study, the research theme is
defined as follows:
How should Adebro structure its pricing model/s for the software packages?
The research theme has been divided into three parts with separate research
questions:
• What software pricing models are attractive for Adebro in terms of market
trends, customer preferences, and internal capabilities?
• What are the implications of switching pricing model?
• What role plays Key Account Management (KAM) in regards to implemen-
tation and execution of software pricing models?
1.5 Delimitations
This study purely focuses on pricing models related to the B2B software industry,
and therefore we are not going to investigate pricing models that neither cannot
be fitted into a software environment nor in a B2B setting. Since this study is
conducted in collaboration with Adebro, results have been derived in reference to
Adebro’s o↵erings and markets. However, the research have mainly focused on the
markets in developed countries.
The study focuses on manufacturing related software: CAM, SPC, and GD&T
software but the market research and the literature review have considered other
software markets like Computer-Aided Design (CAD), Computer-Aided Engineer-
ing (CAE), and Product Lifecycle Management (PLM) for inspiration and trend
analysis.
The study has been conducted under the confidential policy of the case company,
Adebro, as well as a request from some of the interviewees, and therefore neither
Adebro’s real name nor the real names of the interviewees have been presented and
real numbers have been altered in the thesis.
4
1.6 Contribution to Science
Past studies conducted on pricing have often been related to general pricing, where
specific theory about pricing software packages has only been a minor part. The
literature has often been more focused on covering a holistic approach to software
pricing models. There is a lack of research focusing on a specific product or company
and investigating what pricing model is best applied onto that setting. Therefore,
this thesis contributes to the area of research on how to best apply a certain pricing
model onto a technology company. This have generated an outside-in perspective
rather than an inside-out perspective.
From a theoretical perspective, this study contributes with knowledge to the
pricing literature by providing research on pricing strategies in the context of specific
software packages in a hardware focused industry. By adding the aspect of how to
align KAM in such an environment, the study also contributes to the KAM area of
research.
From a managerial perspective, the results will provide insights into how a tech-
nology company that sells software can structure their software pricing models for
the future to generate competitive advantage.
1.7 Disposition
The thesis is structured as follows:
Introduction: This chapter introduces the research, where it presents the
background and the research problem. It then follows with the purpose and the
aim, the research questions, the delimitations of the research as well as what the
contribution to science is. It ends with the disposition of the thesis.
Literature review: This chapter presents a review of existing theoretical
frames, which is divided into three sections: General Pricing, Software Pricing
and Key Account Management.
Method: This chapter presents the chosen case study methodology and in-
cludes a description of the research approach and the research process. Moreover,
the chapter presents the chosen methods for data collection and analysis. It ends
5

with a reflection on the quality of the research design, as well as the ethics of
methods used.
Findings: This chapter presents the empirical findings together with an anal-
ysis of the collected data to fulfil the purpose of the study. Findings are presented
in the order of the research questions.
Discussion: This chapter discusses how the empirical findings relates to the
revised literature. It highlights and discusses major similarities and discrepancies
between the empirical findings and the literature.
Conclusion: This chapter concludes the research by answering the research
questions and discusses how the research contributes to knowledge. Furthermore, it
discusses the limitations of the research together with recommendations regarding
future research to expand the field of knowledge.
6
2 Literature Review
This chapter presents a review of existing theoretical frames, which is divided into
three sections: General Pricing, Software Pricing and Key Account Management.
2.1 General Pricing
This section presents an introduction to pricing. It also discusses di↵erent roads
towards pricing excellence as well as the importance of continuously evaluating the
pricing strategy.
2.1.1 Introduction to General Pricing
Pricing is one of the P’s in the four P marketing mix that was invented by McCarthy
(1960). However, it was Kotler that made the four P’s a known concept worldwide
a few years later. The four P’s are: Product, Price, Promotion, and Place, and
represents the marketing factors a company need to consider to be a successful
player in the market (Kotler 2015).
The price can be determined by taking into account the three C’s of pricing,
which are: Cost, Customers, and Competition (Mohr et al. 2010). These are the
three most fundamental factors that the price is dependent on. The three C’s
of pricing can then be formed into cost-, competition-, and value-based pricing.
Cost-based pricing takes the cost of developing the product and then setting a
mark-up, competition-based pricing sets the price according to competitors, and
value-based pricing sets the price according to the perceived value of the product
for the customer (Mohr et al. 2010).
It is important to align a buyer’s value realisation with the vendor’s business
objectives. Therefore, the pricing process must consider both sides of the market
transaction, which indicates a more collaborative customer relationship (Bontis &
Chung 2000). In general, vendors that do not treat their customers as partners in
value creation have higher risk of seeing competitors steal market shares and profits
(Bertini & Gourville 2012). Thus, it is important to have a flexible and value-based
pricing since it enables the vendors to respond to their customers’ needs and to
7
share value with them. Bontis & Chung (2000) although argues that as Internet
and web-based software continue to grow, new types of pricing models will, and
have, emerged and these new pricing models must also align the vendor’s and the
buyer’s value realisation to be a sustainable model. However, one must look beyond
the market conditions and also take the product design into consideration (Choi
et al. 1997).
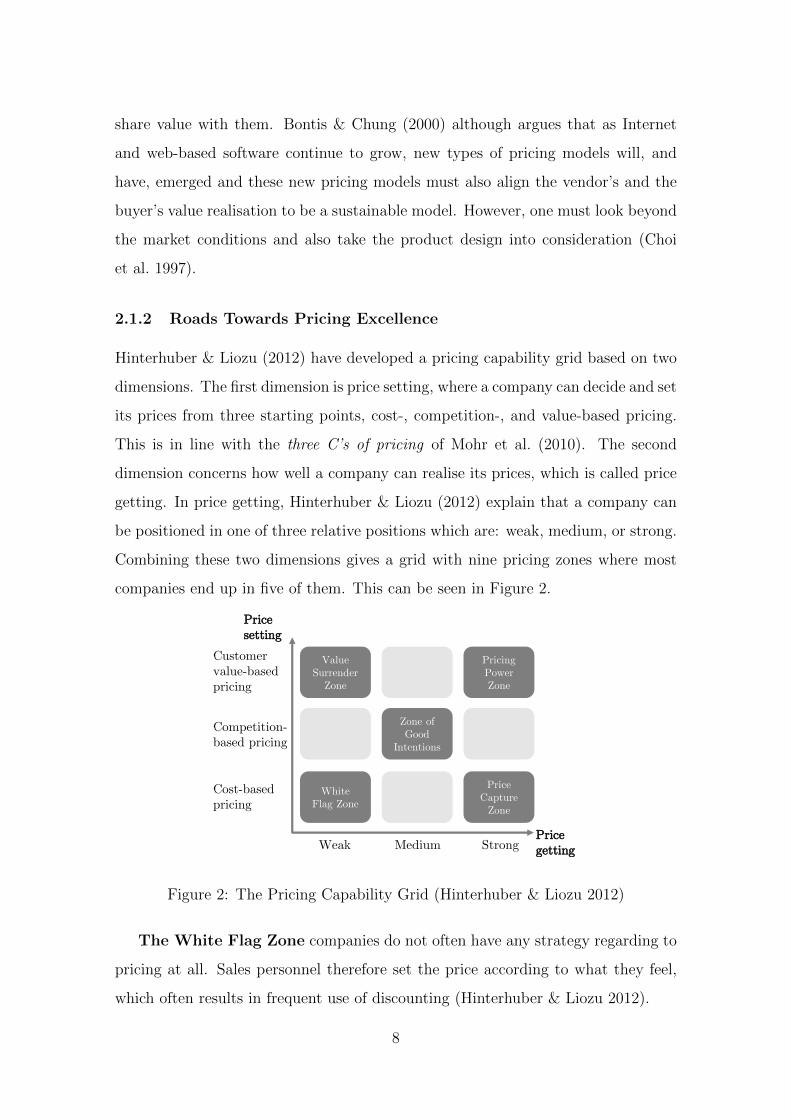
2.1.2 Roads Towards Pricing Excellence
Hinterhuber & Liozu (2012) have developed a pricing capability grid based on two
dimensions. The first dimension is price setting, where a company can decide and set
its prices from three starting points, cost-, competition-, and value-based pricing.
This is in line with the three C’s of pricing of Mohr et al. (2010). The second
dimension concerns how well a company can realise its prices, which is called price
getting. In price getting, Hinterhuber & Liozu (2012) explain that a company can
be positioned in one of three relative positions which are: weak, medium, or strong.
Combining these two dimensions gives a grid with nine pricing zones where most
companies end up in five of them. This can be seen in Figure 2.
Value Surrender
Zone
White Flag Zone
Zone of Good
Intentions
Pricing Power Zone
Price Capture
Zone
Price setting
Price gettingWeak Medium Strong
Cost-based pricing
Competition-based pricing
Customer value-based pricing
Figure 2: The Pricing Capability Grid (Hinterhuber & Liozu 2012)
The White Flag Zone companies do not often have any strategy regarding to
pricing at all. Sales personnel therefore set the price according to what they feel,
which often results in frequent use of discounting (Hinterhuber & Liozu 2012).
8
The Value Surrender Zone companies have list prices that reflect the cus-
tomer value well. This is however not realised since sales personnel are encouraged
to negotiate heavily, with no general guidelines for discounting, which results in
partly lost value during the negotiations (Hinterhuber & Liozu 2012).
The Zone of Good Intentions companies often have obsolete processes of
setting and working with the price. This is intended to limit the sales personnel’s
altering of the price and maximise value realisation from the past. These processes
may have been set according to past customer preferences or manufacturing pro-
cesses, and were inherited when the company moved to a new phase (Hinterhuber
& Liozu 2012).
The Price Capture Zone companies have developed processes that minimise
the deviation from list prices. However, the list prices are not set fully according to
their customer’s value perception, and thus some of the value is lost (Hinterhuber
& Liozu 2012).
The Pricing Power Zone often incorporates value-based pricing since compa-
nies here have high pricing power. They have specific roles associated with pricing,
e.g. chief pricing o�cer or head of revenue management. This role is responsible for
that the organisational setting is in line with price setting and price getting. The
price getting routine is often driven by the CEO, to ensure the employees that the
price is in line with the company’s vision and embrace organisational involvement
(Hinterhuber & Liozu 2012).
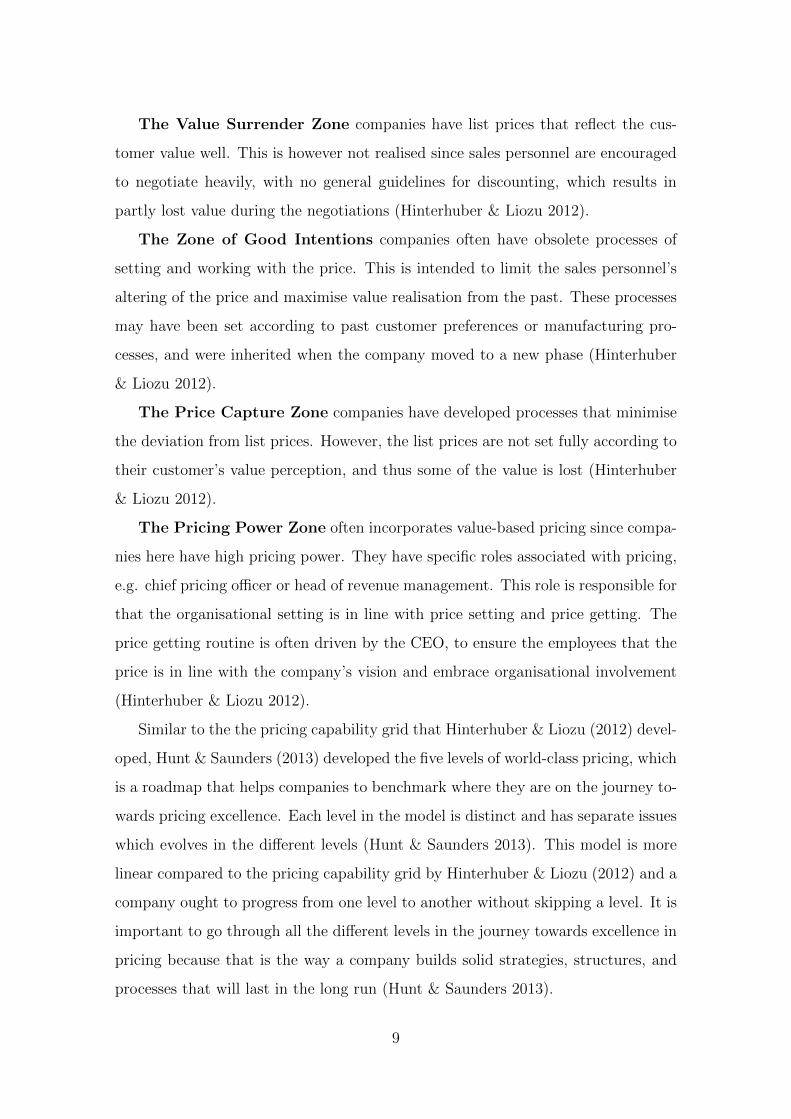
Similar to the the pricing capability grid that Hinterhuber & Liozu (2012) devel-
oped, Hunt & Saunders (2013) developed the five levels of world-class pricing, which
is a roadmap that helps companies to benchmark where they are on the journey to-
wards pricing excellence. Each level in the model is distinct and has separate issues
which evolves in the di↵erent levels (Hunt & Saunders 2013). This model is more
linear compared to the pricing capability grid by Hinterhuber & Liozu (2012) and a
company ought to progress from one level to another without skipping a level. It is
important to go through all the di↵erent levels in the journey towards excellence in
pricing because that is the way a company builds solid strategies, structures, and
processes that will last in the long run (Hunt & Saunders 2013).
9
Level 1Level 1
Level 2Level 3
Level 4Level 5
Ad HocControlled
Value BasedOptimised
Mastered
Figure 3: Five Levels of World-Class Pricing (Hunt & Saunders 2013)
Level 1 - Ad Hoc companies are characterised by ine↵ective baseline processes
where pricing is undisciplined and often reactive. Typically companies in this level
are using cost-based pricing that does not reflect customer values (Hunt & Saunders
2013).
Level 2 - Controlled companies are controlling their pricing processes by
controlling the discounting. A structure regarding pricing exists together with rules
on how to deal with customers, but the rules do not always make sense for the
customer. Level 2 companies do say no to deals rather than adjusting discounts
frequently (Hunt & Saunders 2013).
Level 3 - Value-Based companies have switched from an inside-out perspec-
tive to an outside-in perspective and are in the whole more customer centric. De-
cisions are made with the customers’ value in mind and prices are value-based.
Furthermore, customers are segmented according to their need rather than classifi-
cation, such as size or region (Hunt & Saunders 2013).
Level 4 - Optimised companies have a higher degree of precision around
pricing and decisions are based on better customer data. Companies use tools
such as choice-base conjoint analysis, pricing software, and multivariate regression
models in order to optimise the outcome (Hunt & Saunders 2013).
Level 5 - Mastered companies have an intense commitment to value, and
passion about pricing. They have integrated business systems and enjoy significant
financial returns from rethinking pricing. Furthermore, Key Performance Indica-
tors (KPIs) connected to pricing improvements and margins are frequently used to
evaluate sales personnel (Hunt & Saunders 2013).
10
2.1.3 Evaluate and Rethink the Pricing Strategy
Hinterhuber & Liozu (2014) estimate that only five percent of the leading companies
in U.S., Europe, and Asia have embraced the opportunity to evaluate or rethink
their pricing and thus, a lot of companies are missing out on a powerful source of
competitive advantage. This is due to the fact that most companies look at pricing
as a zero sum game or a win-lose relationship, where one party gains what the other
party loses (Hinterhuber & Liozu 2014).
Evaluating the pricing strategy can give companies great opportunities to di↵er-
entiate themselves from competitors, and there are especially two areas of impor-
tance when rethinking the pricing strategy (Hinterhuber & Liozu 2012). The first
area to consider is changing the fundamental way of setting the price. The second
area concerns price getting, the process of making list prices profitable. This may
require adding information systems, incentive schemes, controlling tools as well as a
sales force and a KAM-organisation that have confidence in the new pricing model.
Quantifiable results will come quickly after adding or improving any of these areas
according to Hinterhuber & Liozu (2012).
When changing the fundamental way of setting the price, it is important to
always keep the pricing strategy aligned, or in the best case ahead of, with how the
market is developing. A switch from cost-based to value-based can therefore be of
relevance when a product becomes of greater importance to the customer than it
was before. It is then not longer primarily about covering the cost associated with
the production, but instead taking the customers’ value perception into account
and ensuring that both parties are satisfied (Harmon et al. 2009).
Hinterhuber & Liozu (2012) argue that companies without rethinking of pricing
often practice cost-based or competition-based pricing together with heavy use of
discounts. Furthermore, these types of companies do not often have a specific
team that works with pricing. Therefore, Hinterhuber & Liozu (2014) proposed a
roadmap for innovation in pricing that exemplifies initiatives a company can take
in the field of pricing strategy, pricing tactics, and in the pricing organisation. This
roadmap is presented in Figure 4.
11
Strategy
Tactics
Organisation
No innovation
Roadmap for innovation
Cost- or competition-based pricing
Good-better-best market segmentation
Needs-based market
segmentation
Pay-for-performance
pricing
Pricing to drive
market expansion
New metrics
Zero as a special price
Participative pricing
Discounting Revenue management
Continent pricing Bundling Individual-
ised pricingFlat fees
Creative discounting
Psychological pricing
No pricing team
Dedicated pricing function
Centralising of the pricing
function
CEOs as pricing
championsConfidence
Company-wide pricing capabilities
Change management
Pricing as learning
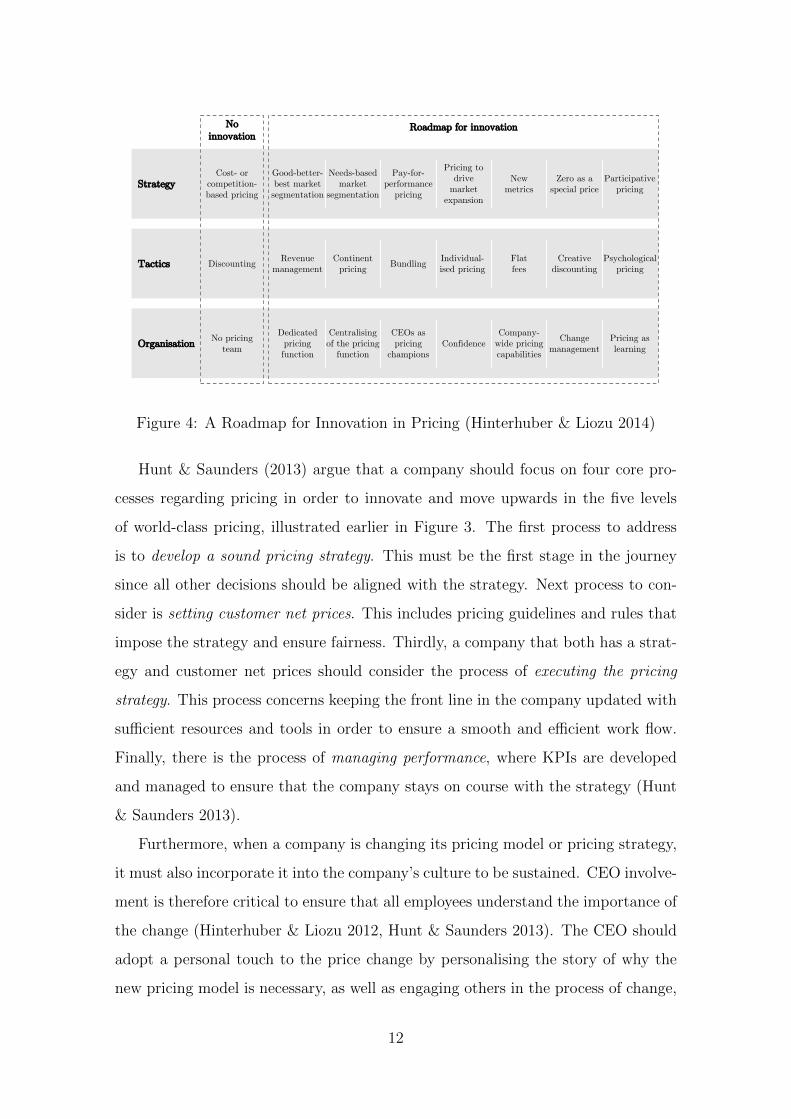
Figure 4: A Roadmap for Innovation in Pricing (Hinterhuber & Liozu 2014)
Hunt & Saunders (2013) argue that a company should focus on four core pro-
cesses regarding pricing in order to innovate and move upwards in the five levels
of world-class pricing, illustrated earlier in Figure 3. The first process to address
is to develop a sound pricing strategy. This must be the first stage in the journey
since all other decisions should be aligned with the strategy. Next process to con-
sider is setting customer net prices. This includes pricing guidelines and rules that
impose the strategy and ensure fairness. Thirdly, a company that both has a strat-
egy and customer net prices should consider the process of executing the pricing
strategy. This process concerns keeping the front line in the company updated with
su�cient resources and tools in order to ensure a smooth and e�cient work flow.
Finally, there is the process of managing performance, where KPIs are developed
and managed to ensure that the company stays on course with the strategy (Hunt
& Saunders 2013).
Furthermore, when a company is changing its pricing model or pricing strategy,
it must also incorporate it into the company’s culture to be sustained. CEO involve-
ment is therefore critical to ensure that all employees understand the importance of
the change (Hinterhuber & Liozu 2012, Hunt & Saunders 2013). The CEO should
adopt a personal touch to the price change by personalising the story of why the
new pricing model is necessary, as well as engaging others in the process of change,
12
to get a full perspective from the whole organisation of what may be the next best
practice (Aiken & Keller 2007, Hunt & Saunders 2013). Furthermore, involving
the entire organisation is far more complex than just changing list prices. New
pricing approaches often require new organisational structures, new capabilities,
new tools, and new processes. Moreover, it also requires di↵erent priorities, goals,
and incentive systems, which all is especially connected to the KAM organisation
(Hinterhuber & Liozu 2014).
2.2 Software Pricing
This section presents a review of the existing body of knowledge regarding software
pricing. It discusses theories about the development of pricing models as well as
the complexity in pricing software.
2.2.1 Introduction to Software Pricing
As mentioned by Choi et al. (1997), it is not only the market dimensions one need
to consider when setting the price, but also the product design. Therefore, pric-
ing software comes with additional issues in comparison to pricing commodities or
physical products due to its product design. The product design of software is dif-
ferent from physical products with fundamental characteristics as indestructibility,
transmutability and reproducibility. Thus, all these need to be taken into account
when setting the price for digital products (Choi et al. 1997).
The lack of costs associated with the physical characteristics of the products,
e.g. the cost of the medium the software is delivered on, makes it di�cult to use
well known cost-based concepts of margins and mark-ups in order to price software
(Bontis & Chung 2000). This is further emphasised by Harmon et al. (2009), who
argue that the software industry is maturing and is now generating higher value for
the customers, and thus is shifting towards value-based pricing. Moreover, since
the introduction of Software-as-a-Service (SaaS), companies’ cost structures have
changed and value-based pricing has become important to justify the gap between
the price and the marginal cost for adding a new customer (Baur et al. 2014).
13
Development of software is expensive, but on the other hand, variable costs
of sale is almost negligible. The total product cost is often fixed and therefore it
becomes crucial to reach a certain amount of minimum revenue in order to reach
break-even point. Furthermore, this makes software special since any additional
revenue beyond the break-even point is almost purely profit (Kittlaus & Clough
2009). This has lead to problems with having a reliable measure to value software
(Bontis & Chung 2000). However, Buxmann & Lehmann (2009) discuss that in
the case of support and service o↵ering, significant high variable cost incur. This
is particular important to take into account in the case of SaaS solutions, where
the o↵ering also includes the hosting and support services beside the software, and
in the case of complex products that require more service (Buxmann & Lehmann
2009). In general, companies that develop software require relatively little capital
and investments which implies that the market entry barriers are low (Kittlaus &
Clough 2009). This might di↵er depending on the type of software that is developed
and sold.
”Somewhere in this world, new software companies are founded daily –
and die daily”
(Kittlaus & Clough 2009, p.22)
This results in high innovation and adoption speed which further lower the
technical entry barriers and imply a very competitive market dynamic (Kittlaus &
Clough 2009). However, the law of increasing returns are strong in the software
market due to network e↵ects, increased switching costs for users, and increasing
trust in the market leaders (Kittlaus & Clough 2009). Kittlaus & Clough (2009)
argue that, because of the law of increasing returns, market leadership becomes a
very important competitive advantage. That is why software companies should have
market leadership as a short term goal instead of goals like revenue or profitability
(Kittlaus & Clough 2009).
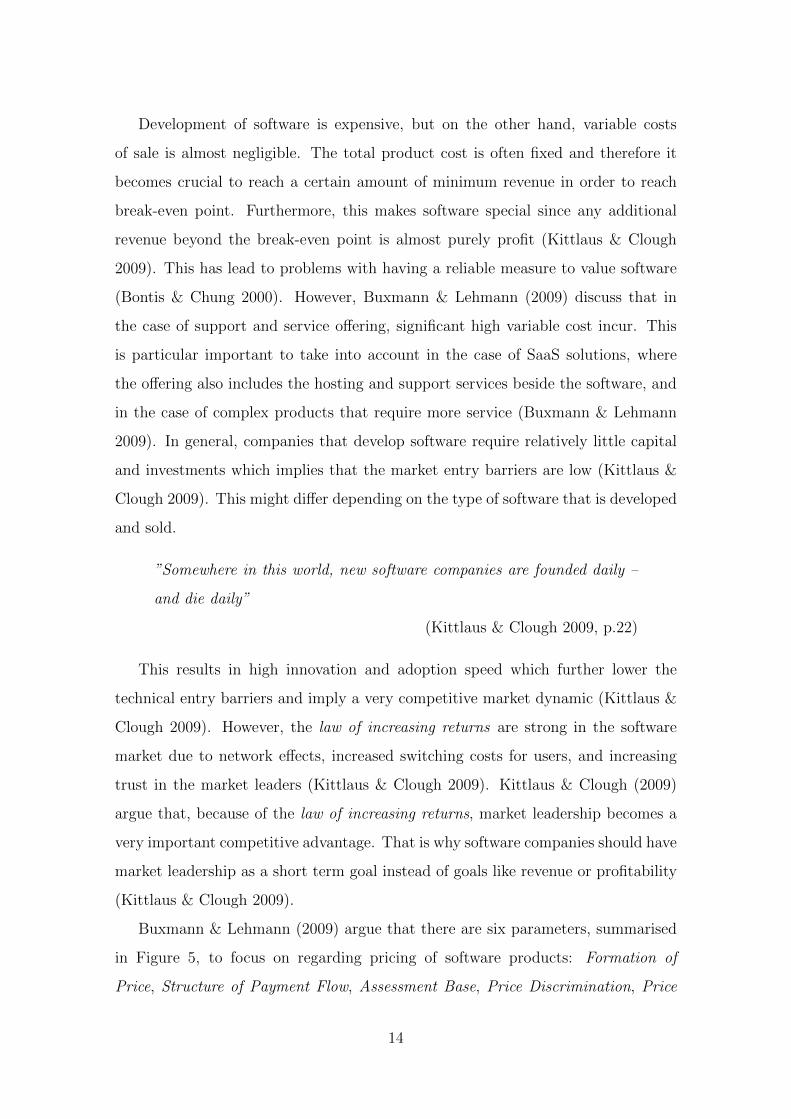
Buxmann & Lehmann (2009) argue that there are six parameters, summarised
in Figure 5, to focus on regarding pricing of software products: Formation of
Price, Structure of Payment Flow, Assessment Base, Price Discrimination, Price
14
Bundling, and Dynamic Pricing Strategy. The most specific parameter for soft-
ware developers is the design of the assessment base, since prices can either be
decided dependent on the usage of the software, or independent of usage (Buxmann
& Lehmann 2009).
The Six Parameters of Software Pricing
Formation of price
Structure of payment flow
Assessment base
Price discrimination Price bundling
Dynamic pricing
strategiesPrice determination• Cost based• Value based• Competition
oriented
Degree of interaction• Unilateral• Interactive
Single payment
Recurring payments• Frequency• Duration
Combination
Number of pricing components
Usage-dependent• Transaction• Memory
requirements• Time• .....
Usage-independent• Named user• Concurrent user• KPI• .....
1st degree
2nd degree• Quantity• Time• Versioning
3rd degree• Person-related• Region-related
Multidimensional
Offer• Pure bundling• Mixed• Unbundling
Product• Software• Maintenance• Service
Degree of integration• Complementary • Substitutive • Independent
Price level• Additive• Super additive• Sub additive
Penetration pricing
Follow-the-free Strategy
Skimming strategy
Figure 5: The Six Parameters of Software Pricing (Buxmann & Lehmann 2009)
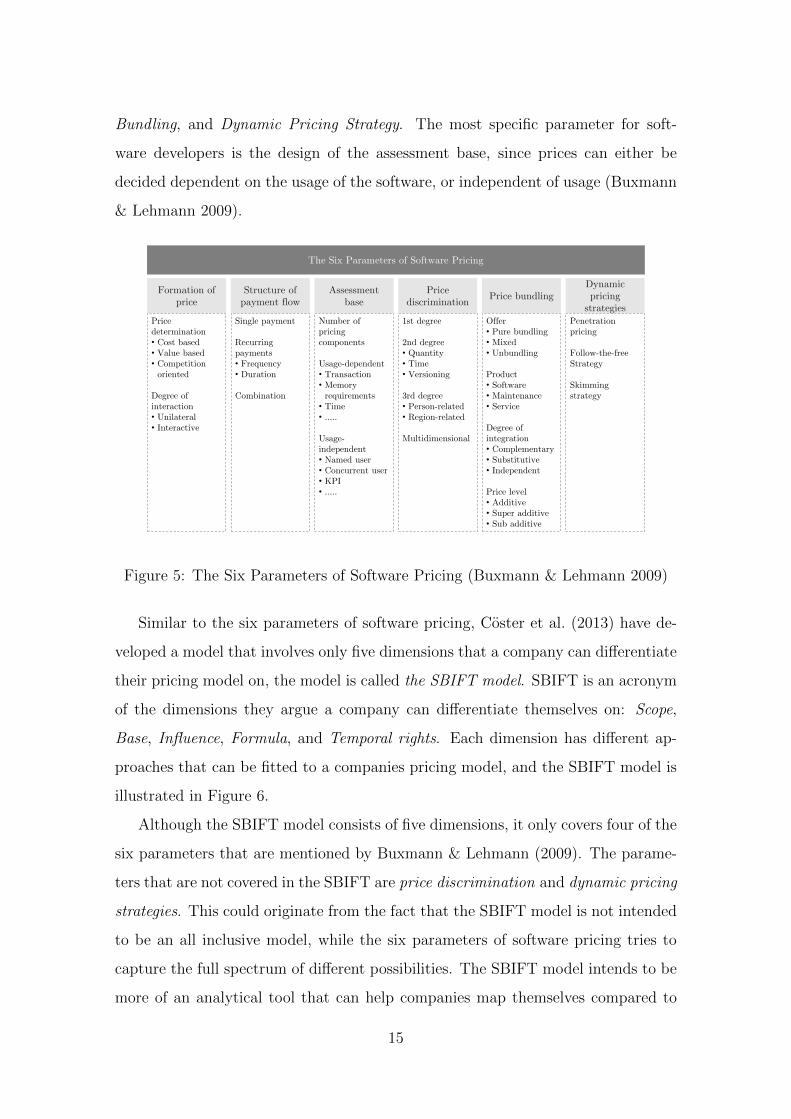
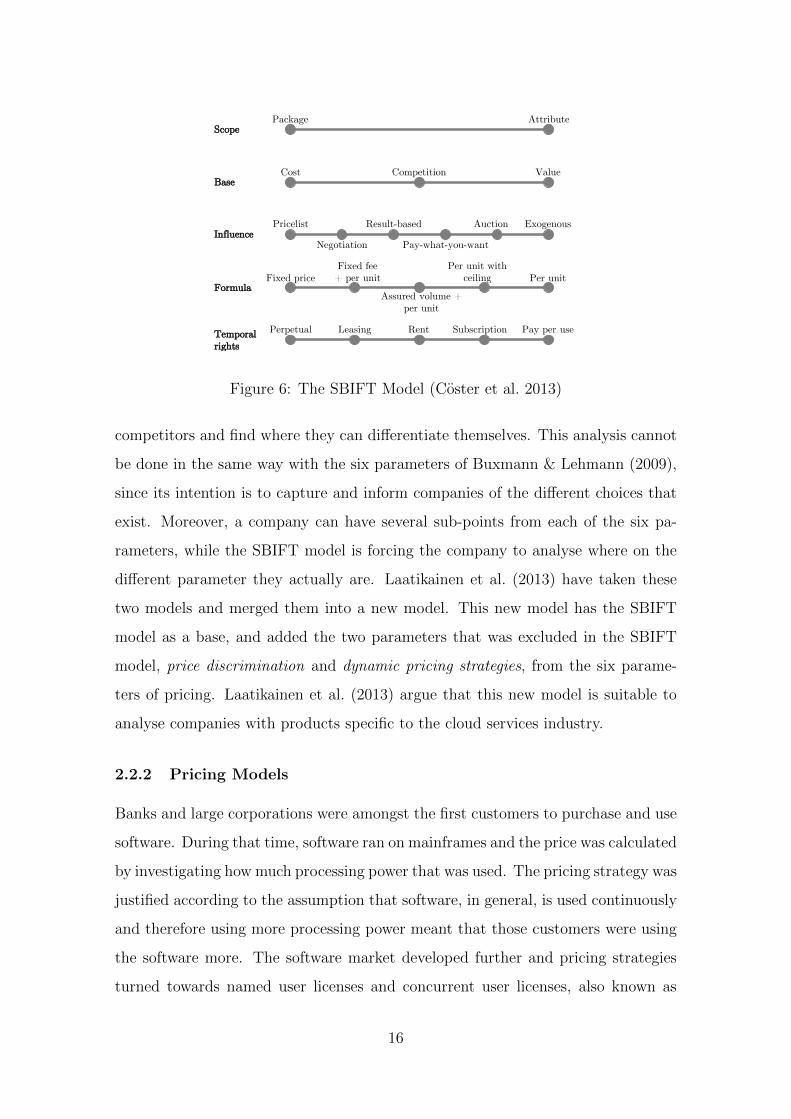
Similar to the six parameters of software pricing, Coster et al. (2013) have de-
veloped a model that involves only five dimensions that a company can di↵erentiate
their pricing model on, the model is called the SBIFT model. SBIFT is an acronym
of the dimensions they argue a company can di↵erentiate themselves on: Scope,
Base, Influence, Formula, and Temporal rights. Each dimension has di↵erent ap-
proaches that can be fitted to a companies pricing model, and the SBIFT model is
illustrated in Figure 6.
Although the SBIFT model consists of five dimensions, it only covers four of the
six parameters that are mentioned by Buxmann & Lehmann (2009). The parame-
ters that are not covered in the SBIFT are price discrimination and dynamic pricing
strategies. This could originate from the fact that the SBIFT model is not intended
to be an all inclusive model, while the six parameters of software pricing tries to
capture the full spectrum of di↵erent possibilities. The SBIFT model intends to be
more of an analytical tool that can help companies map themselves compared to
15
Package Attribute
Cost Value
Pricelist Exogenous
Pay-what-you-wantNegotiation
Result-based Auction
Fixed price Per unitAssured volume +
per unit
Fixed fee + per unit
Per unit withceiling
Perpetual Pay per useRentLeasing Subscription
Competition
Scope
Base
Influence
Formula
Temporal rights
Figure 6: The SBIFT Model (Coster et al. 2013)
competitors and find where they can di↵erentiate themselves. This analysis cannot
be done in the same way with the six parameters of Buxmann & Lehmann (2009),
since its intention is to capture and inform companies of the di↵erent choices that
exist. Moreover, a company can have several sub-points from each of the six pa-
rameters, while the SBIFT model is forcing the company to analyse where on the
di↵erent parameter they actually are. Laatikainen et al. (2013) have taken these
two models and merged them into a new model. This new model has the SBIFT
model as a base, and added the two parameters that was excluded in the SBIFT
model, price discrimination and dynamic pricing strategies, from the six parame-
ters of pricing. Laatikainen et al. (2013) argue that this new model is suitable to
analyse companies with products specific to the cloud services industry.
2.2.2 Pricing Models
Banks and large corporations were amongst the first customers to purchase and use
software. During that time, software ran on mainframes and the price was calculated
by investigating how much processing power that was used. The pricing strategy was
justified according to the assumption that software, in general, is used continuously
and therefore using more processing power meant that those customers were using
the software more. The software market developed further and pricing strategies
turned towards named user licenses and concurrent user licenses, also known as
16
floating licenses (Bontis & Chung 2000). Since then, prices have been going down
on processing power, storage capacity, and bandwidth and these have almost turned
into commodities. This have nurtured the trend towards cloud computing where
capacity considerations no longer are constraints (Kittlaus & Clough 2009).
The six parameters illustrated in Figure 5, as well as the SBIFT model illustrated
in Figure 6, can be combined to form di↵erent pricing models. These have all
di↵erent attributes and are suitable for di↵erent kind of businesses. Some of the
most common pricing models are described in this section.
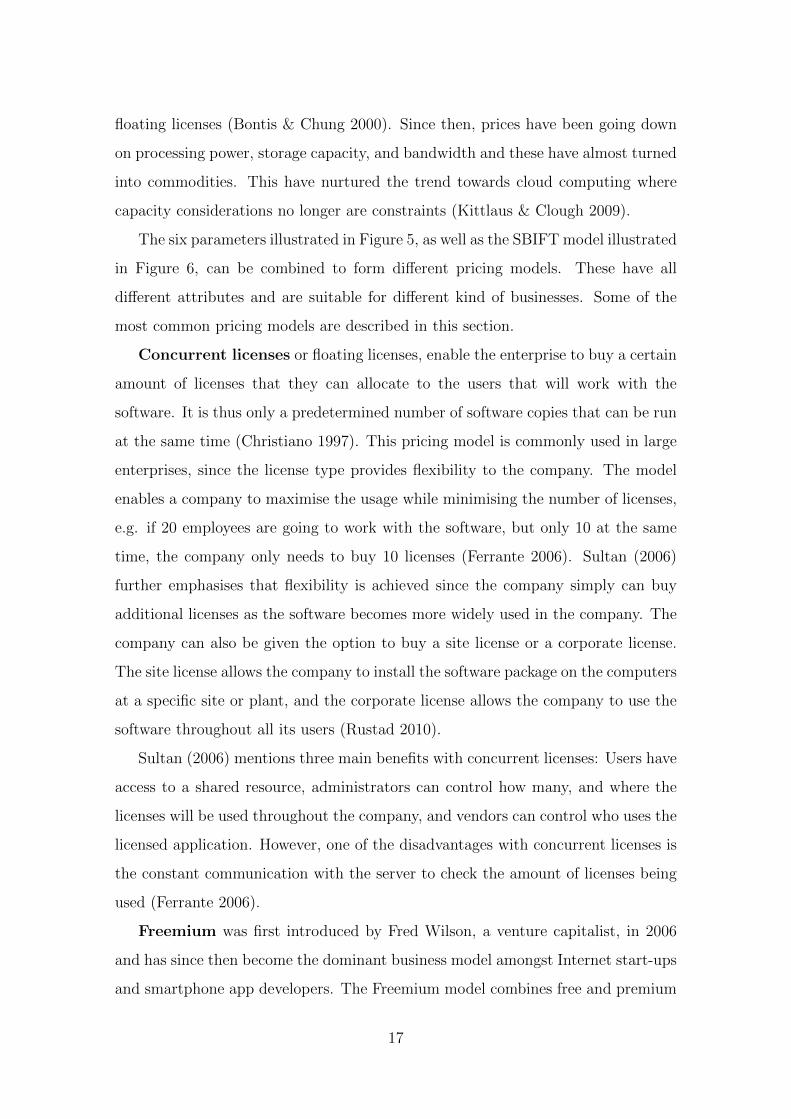
Concurrent licenses or floating licenses, enable the enterprise to buy a certain
amount of licenses that they can allocate to the users that will work with the
software. It is thus only a predetermined number of software copies that can be run
at the same time (Christiano 1997). This pricing model is commonly used in large
enterprises, since the license type provides flexibility to the company. The model
enables a company to maximise the usage while minimising the number of licenses,
e.g. if 20 employees are going to work with the software, but only 10 at the same
time, the company only needs to buy 10 licenses (Ferrante 2006). Sultan (2006)
further emphasises that flexibility is achieved since the company simply can buy
additional licenses as the software becomes more widely used in the company. The
company can also be given the option to buy a site license or a corporate license.
The site license allows the company to install the software package on the computers
at a specific site or plant, and the corporate license allows the company to use the
software throughout all its users (Rustad 2010).
Sultan (2006) mentions three main benefits with concurrent licenses: Users have
access to a shared resource, administrators can control how many, and where the
licenses will be used throughout the company, and vendors can control who uses the
licensed application. However, one of the disadvantages with concurrent licenses is
the constant communication with the server to check the amount of licenses being
used (Ferrante 2006).
Freemium was first introduced by Fred Wilson, a venture capitalist, in 2006
and has since then become the dominant business model amongst Internet start-ups
and smartphone app developers. The Freemium model combines free and premium
17

services, where the premium service often is a subscription-based fee for added
features. Freemium is the best suitable model for companies who want to reach a
big user-base, which is a big source of competitive advantage. Free features will
serve as a marketing tool, and will thus attract new customers with very little
marketing cost (Kumar 2014, Kittlaus & Clough 2009).
Pujol (2010) states that Freemium can be di↵erentiated by four strategies: vol-
ume, time, feature, or distribution. Volume di↵erentiation relies on sample distri-
bution, where the quantity of the product is limited. A more recent type of di↵er-
entiation have arisen along with the digitisation, which is the time-limited product.
Time di↵erentiation can either be availability for a limited time-period, availability
for a certain immature product, such as a beta version, or that free users will get
access to the product after a certain time period, which can be used in time-critical
data such as news. Feature di↵erentiation is when the functionality of the product
is changed between the free and the premium model. The free version has limited
functionality while the premium includes more advanced functionality, a model fre-
quently used by apps today. Another way of di↵erentiating the Freemium model is
through the distribution. It is the end-users choice on how to use the product that
will determine if it is free or costs money. Think-cell is a company that uses this
model for its software today, where non-profit organisations can use the software for
free, but if it is used for commercial use, the organisation must enter into a di↵erent
license agreement (Think-cell 8 February 2016).
The kind of di↵erentiations that is included in Freemium is however subjective,
and Kumar (2014) argues that Freemium is only di↵erentiated by functionality, and
does not include time-limited trials, which is often used as a sales tool.
Despite the Freemium model’s success, it has also lead to the failure of many
start-ups who were unsuccessful in converting the free users to be premium, and
therefore unable to generate revenue (Kumar 2014).
Pay Per Use or pay per transaction is based on the assumption that customers
who use the software more should also pay more and thus enables a match between
cost and usage. However, measuring usage of software accurately is hard and does
not allow for stable and reasonable cost estimates (Bontis & Chung 2000). This
18

pricing model gets support from Jiang et al. (2007), who emphasise that value is
not created by owning the software, value is created when using it. The model was
one of the first to be adopted but the full release model soon became used more
frequently. A reason for this was issues regarding how to measure usage, since it
can be measured e.g. in terms of data usage, number of users, and time (Bontis &
Chung 2000).
Research conducted by Jiang et al. (2007) point to that in a market with a
heterogeneous customer base and when there are strong network e↵ects, pay per
use is more profitable than full release licensing. Furthermore, Jiang et al. (2007)
argue that a pay per use architecture is an e↵ective protection against the risk of
piracy.
Successfully measuring usage makes it possible for a software supplier to more
e�ciently realise second degree price discrimination amongst their customers and
reach out to the whole spectrum of potential buyers, both light and heavy users
(Bontis & Chung 2000, Jiang et al. 2007, Zhang & Seidmann 2002).
Another advantage with pay per use licensing is that it is easier for a vendor
to collect usage information to help the development of the software and identify
which features are used the most and the least. A vendor can capitalise on this in a
number of ways e.g. o↵er individually structured promotions on existing products
and as well on new products and features (Jiang et al. 2007).
Perpetual License is the most traditional way of pricing software and also
known as a full release. The pricing strategy is structured with a one-time payment
per client and license. This model includes a buyout of all the functionality in
a software from the time of activating the license and forward. Full release gives
revenue a large upside potential while costs are capped for the supplier due to the
fact that the development costs are already payed for and there is no limit on how
many licenses one can sell (Bontis & Chung 2000). In this way, one can view a
full release model as buying any type of commodity or physical product. However
this has some disadvantages due to the fact that software products do not have the
same product design and characteristics as physical products (Choi et al. 1997).
Jiang et al. (2007) argue that full release models often come with increased risk
19
for piracy. Furthermore, full release licenses do often work fine when the customer
base is homogeneous and the usage level, user experience, and value created by
the software are roughly the same. But when the customer base is heterogeneous,
full release licenses become sub-optimal because vendors often choose to target the
heavy users and set the price accordingly, which leads to the value for light users
not being aligned with the price. This is a sign that the pricing model fails to align
both sides in the market transaction, which is very important according to Bontis
& Chung (2000) in order to develop a good pricing model. A sub-optimal pricing
model may also increase piracy levels since light users are not willing to purchase
the software and instead are downloading piracy versions (Jiang et al. 2007).
However, companies that use the full release licensing model are often combining
the software license with a service and maintenance contract. This could be done
by paying a fixed fee for a number of years or an ongoing subscription. This comes
with the advantage that the company first gets a single payment up front and later
annual payments, often of a fixed percentage of the license price, for service and
maintenance, which ensures future cash flow (Buxmann & Lehmann 2009).
Software-as-a-Service (SaaS) is a model that started to appear during the
late 1990s with the emergence of Customer Relationship Management (CRM) and
Application Service Providers (ASPs) (Cusumano 2008, Greschler & Mangan 2002,
Kenney 2007). SaaS is defined in several di↵erent ways, but the The Economist (20
Apr 2006) summarises it in an easy and understandable definition.
”The delivery of software as an Internet-based service via a web browser,
rather than as a product that must be purchased, installed and main-
tained”
(The Economist 20 Apr 2006)
Thus, SaaS is a pay-as-you-go pricing model that distributes the software through
Internet and is purchased on a subscription basis. The big di↵erence compared to
the pay per use model is that it is the provider of SaaS that is responsible for ev-
erything associated with the software, i.e. training, support, infrastructure, and
security risks (Sysmans 2006). This is further emphasised by Lasher (2008), who
20
says that all the end-user has to focus on is that the vendor gets paid and that
its users have web access. Therefore, the costs associated with providing SaaS can
be said to be proportional to the usage of the software, since more service will be
needed (Sysmans 2006).
If a customer is ready for SaaS or not, is dependent on the organisation’s func-
tional requirements. Lasher (2008) argues that SaaS can be a compelling option
if the need is process standardisation, data centralisation, or business intelligence.
However, the model is better suited for small and medium sized businesses, since
the SaaS support often is a contact center with undi↵erentiated service to the en-
tire customer base. This typical support model of SaaS does not provide any tools
for monitoring or tuning performance, which could also be a problem for larger
enterprises (Lasher 2008).
There are a lot of advantages with SaaS for the customer, and it may di↵er
depending on the industry. There are although some benefits that are mutual for
every industry: global access, significant cost reductions, and simplified operations
(St.Clair 2008). Furthermore, Duhon (2007) mentions five general cost benefits:
Low up-front capital investment required, no need to add server, quick roll-out and
ROI, eliminated maintenance costs, and updates can occur without disrupting the
organisation. However, Lasher (2008) argues that SaaS may not o↵er cost benefits
for organisations that will have the software over several years. The annual SaaS
subscription fee will then be higher than the maintenance fees for on-premise soft-
ware. Thus, Lasher (2008) argues that SaaS may only profitable as a short-term
solution, for less than 5-7 years.
Another advantage with SaaS is that SaaS licensing models lead to higher in-
vestments in product development, and quicker time-to-market for the software.
This is beneficial for both the vendor and the customer since it will lead to better
product quality and make the software more competitive in the market (Vidyanand
2007).
Unbundled pricing is a pricing model where the distributor sells a base soft-
ware with the option to add further components or features. This gives the buyer
flexibility and can thus choose to pay only for the functionality needed. The pricing
21
model developed in order to meet demand from customers that required the specific
flexibility from the model. The pay for only what you need aspect makes it easier
to align cost and value but one still has to align price and value for the up-front
purchase that is needed. Unbundled pricing is often a part of many other pricing
models. Sometimes it is used together with a perpetual license and sometimes it
can be combined with a subscription or SaaS model (Bontis & Chung 2000).
2.2.3 Business Implications When Switching
It is important to realise that a switch of pricing model also comes with business
implications. The business implications will be most visible when a company is
switching from up-front payment models to subscription-based models. Gruman
et al. (2012) mention four major business implications when a company is switching:
Revenue, cash available, sales, and valuation.
Revenue will have the most visible impact for companies that are switching
from up-front payment models to a subscription-based model with periodic pay-
ments. The revenue will at first drop and will then recover over time as the user
base grows. The periodic payments will however ensure constant in-flow of cash,
which will enhance predictions of future revenue. The periodic payments will also
reduce revenue variations due to economic cycles and budget constraints. It is not
only the annual revenue, but also the amount of cash available that will be im-
pacted in the short-term. With up-front payment models, companies have more cash
available at hand directly, which can be used to invest into other parts of the organ-
isation and build the business further. With a switch to a periodic payment model,
it is therefore instead crucial to build up a revenue reserve over time which can be
used for investments, since the cash available will be lower. Vendors that change
to a periodic model may therefore need to explore alternative financing options be-
fore its cash flow turns positive again (Gruman et al. 2012). However, Vidyanand
(2007) has a more long-term view and argues that with a subscription-based model
the company instead gets incentive to invest more into product development, since
present and future versions do not compete against each other. Thus, the company
can release new updates when they are ready, instead of waiting for the next ver-
22
sion, which makes the investments made into product quality directly visible for
the customers. Hence, Vidyanand (2007) argues that the quality delivered to the
customers will be higher with a subscription model.
It is not only the financial part of a business, but also the sales, otherwise
known as KAM in some organisations, that is impacted by a switch in pricing
model. KAM may need to change its sales strategy, as well as its incentives and
commission structure. A standard commission arrangement for a salesperson is a
fixed base salary together with a commission that is a percentage of sales or gross
profit. Thus, a new pricing model that a↵ects the up-front cost for the customer
will change the commission paid to the sales force. Therefore it is important to
align the commission structure to the pricing model so that sales personnel have
incentives to sell. At the same time, communication with the customer will increase
along with the frequency of payments, and it may therefore be of more importance
to establish a well functioning KAM organisation when payments happens more
often (Gruman et al. 2012).
Gruman et al. (2012) further emphasise that a switch in pricing model also may
a↵ect the valuation of public listed companies. These companies may experience
a decline in stock price if they switch to a model with more periodic payments,
e.g. a subscription based model. The stock price will most likely recover when the
company can prove the steady income that comes with subscriptions, and the stock
price will probably also then be less volatile due to a similar income across the years
(Gruman et al. 2012).
2.3 Key Account Management
This section presents a review of the existing body of knowledge regarding KAM.
As mentioned previously, Hinterhuber & Liozu (2014) emphasise that a new pricing
model comes with new requirements on the organisation, and especially in KAM.
Therefore this section intends to break down concepts, key success factors, as well
as the e↵ectiveness of a customer relationship.
23
2.3.1 Introduction to Key Account Management
KAM is the relational strategy adopted by a company with its key accounts. The
definition of a key account is widely spread and the term is ill-defined (Gosselin
& Heene 2000). Furthermore, there exist a lot of substitutes for the term key
account which are used by di↵erent researchers as well as practitioners. Terms
used instead of key account are e.g. Important Account, Large, Big or Major Ac-
count, National Account, Key Client, International Account, Global Key Account,
Worldwide Account, Multinational Account, Global Strategic Account, and, Strate-
gic Account (Gosselin & Heene 2000). The use of certain terms have changed over
time where the terms National Account or Major Account were frequently used in
the 80’s. Globalisation have been a major factor driving key account terms to in-
clude global or strategic (Gosselin & Heene 2000). Despite an ill-defined term, there
is a growing consensus regarding the definition of key account (McDonald et al.
1997, Montgomery et al. 1998, Pardo 1997). Millman & Wilson (1995) define a key
account as following:
”a customer in a business-to business market identified by a selling com-
pany as of strategic importance”
(Millman & Wilson 1995, p.9)
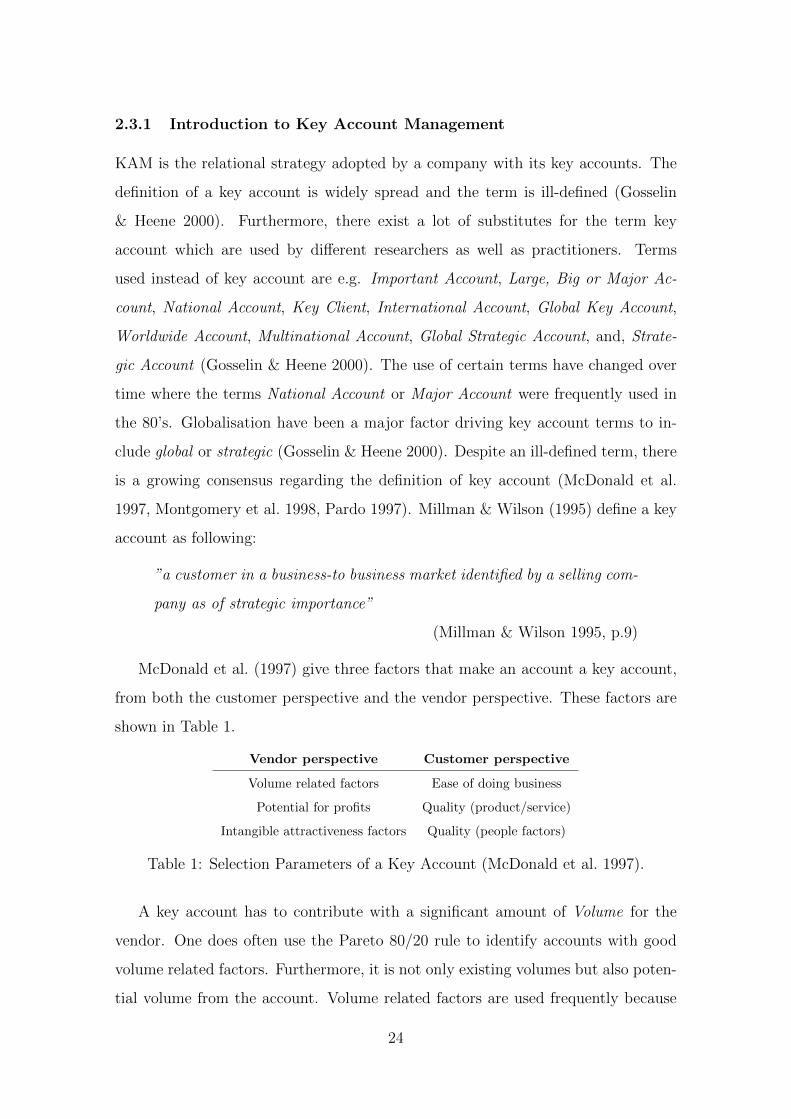
McDonald et al. (1997) give three factors that make an account a key account,
from both the customer perspective and the vendor perspective. These factors are
shown in Table 1.
Vendor perspective Customer perspective
Volume related factors Ease of doing business
Potential for profits Quality (product/service)
Intangible attractiveness factors Quality (people factors)
Table 1: Selection Parameters of a Key Account (McDonald et al. 1997).
A key account has to contribute with a significant amount of Volume for the
vendor. One does often use the Pareto 80/20 rule to identify accounts with good
volume related factors. Furthermore, it is not only existing volumes but also poten-
tial volume from the account. Volume related factors are used frequently because
24
it is easy to measure but one must not forget about profits. Potential for profits is
more di�cult to measure, but when a system for measuring profitability and po-
tential profits from accounts are in place it should be used with same weighting as
volume. Last for vendors there is the intangible attractiveness factors which include
status, relationships, potential for collaboration, and credibility. From the buying
organisation’s perspective, a key supplier is a supplier that is easy to do business
with. Here, factors that ease integration play a big role. Quality for both prod-
ucts/services and people are the next two factors for buyers. To be able to o↵er
an attractive product or service is in many cases a prerequisite for any buyer-seller
relationship to exist and develop. Quality in people is considering the personality
and commitment from the selling company. Honesty and integrity are often viewed
as valuable traits or behaviours (McDonald et al. 1997).
Theories regarding management of key accounts, called KAM, developed from
the first buyer-seller relationship research that was conducted in the 70’s (Abratt &
Kelly 2002). The field of relationship and relationship marketing has evolved over
time and according to Reid & Plank (2000) there is no real consensus or definition of
the terms, but most people seems to view it as: developing long-term relationships
with customers. Platzer (1984) found a number of conditions in the business envi-
ronment that acted as drivers for companies to change the sales approach on a few,
but large, customers who accounted for a large portion of the revenues. Increased
pressure from the buying organisations regarding service level, reduced costs, bet-
ter communication, together with a wider geographic spread of more sophisticated
buyers were main drivers for some companies to assign one responsible salesperson,
a key account manager, to manage a small number of large key customers (Bragg
1982, Maher 1984, Shapiro & Wyman 1981, Shapiro & Moriarty 1984a, Shapiro
& Posner 1976). This improved service and responsiveness and was later seen as
one of the Key Purchasing Criteria (KPC) for buyers (Weilbaker & Weeks 1997).
Wengler et al. (2006), on the other hand, argue that factors of competition intensity
and coordination intensity are the main drivers for KAM implementation.
A well functioned relationship with a customer aims to give a competitive ad-
vantage (Tzempelikos & Gounaris 2015). KAM is seen as especially important in a
25
B2B environment since the customers are fewer and more powerful, and the buyer-
seller relationship is more complex and interdependent compared to the Business-
to-Consumer (B2C) environment (Heide & John 1992). Relationships, in general,
evolve over time mainly due to two salient features: first, a shift from a transac-
tional relationship to a more collaborative one driven by increasing involvement and
complexity, and secondly, growing trust and commitment (McDonald et al. 1997).
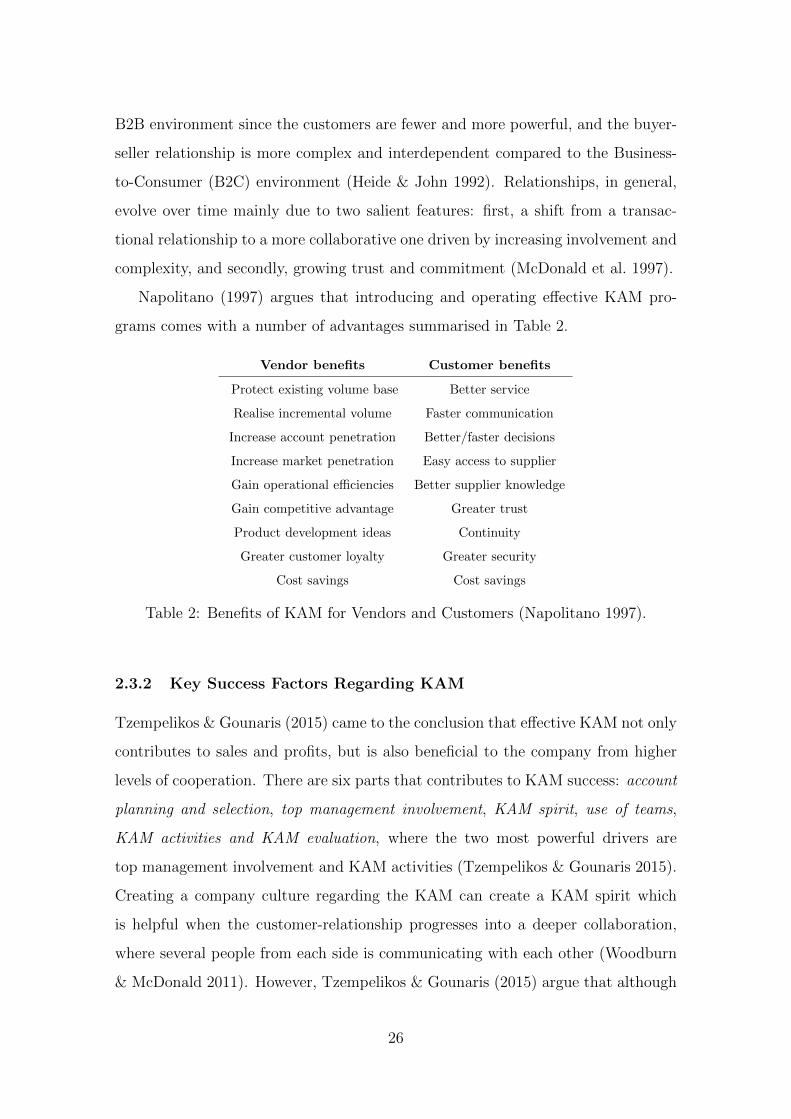
Napolitano (1997) argues that introducing and operating e↵ective KAM pro-
grams comes with a number of advantages summarised in Table 2.
Vendor benefits Customer benefits
Protect existing volume base Better service
Realise incremental volume Faster communication
Increase account penetration Better/faster decisions
Increase market penetration Easy access to supplier
Gain operational e�ciencies Better supplier knowledge
Gain competitive advantage Greater trust
Product development ideas Continuity
Greater customer loyalty Greater security
Cost savings Cost savings
Table 2: Benefits of KAM for Vendors and Customers (Napolitano 1997).
2.3.2 Key Success Factors Regarding KAM
Tzempelikos & Gounaris (2015) came to the conclusion that e↵ective KAM not only
contributes to sales and profits, but is also beneficial to the company from higher
levels of cooperation. There are six parts that contributes to KAM success: account
planning and selection, top management involvement, KAM spirit, use of teams,
KAM activities and KAM evaluation, where the two most powerful drivers are
top management involvement and KAM activities (Tzempelikos & Gounaris 2015).
Creating a company culture regarding the KAM can create a KAM spirit which
is helpful when the customer-relationship progresses into a deeper collaboration,
where several people from each side is communicating with each other (Woodburn
& McDonald 2011). However, Tzempelikos & Gounaris (2015) argue that although
26
a good relationship is important, the crucial characteristic of a successful KAM is
the handling of eventual conflicts.
Napolitano (1997) argues that top management involvement is the most critical
indicator of success, where a key account manager should report directly to the
highest level in a selling organisation. Furthermore, Napolitano (1997) suggests
that account planning and selection are important in order to increase the proba-
bility of a successful relationship. This is in line with the findings from Tzempelikos
& Gounaris (2015) that KAM programs that succeed do often prioritise their ac-
counts and assess the fit between the need of the key account and the supplier’s core
strengths. Napolitano (1997) emphasises that not all large-volume customers are
suitable as partners and therefore a company should conduct a thorough evaluation
of their large-volume accounts before they are appointed as key accounts. Another
key success factor is the selection of a key account manager with right qualifications.
A good key account manager should accordingly have enough conceptual and ana-
lytical skills to understand and relate to the key customers’ main issues, profit and
productivity goals, and be able to provide solutions to the customers that satisfy
their needs. But the most important skills a key account manager should posses
are high-level selling skills and relationship skills (Napolitano 1997).
Senqupta et al. (1997) give another view of success in KAM programs. Ac-
cording to their research, the performance of a key account manager could be seen
as inversely proportional to the number of accounts they manage. Therefore it is
important to not assign too many accounts to a successful key account manager.
Furthermore, accessible technology and compensation structure for employees in
the selling organisation also a↵ects KAM e↵ectiveness (Senqupta et al. 1997).
Abratt & Kelly (2002) found that vendors and buyers have the same perception
on what factors are most important to ensure a qualitative and successful KAM
program. Abratt & Kelly (2002) argues that both buyers and suppliers sees the
following as key success factors regarding KAM programs: A suitable key account
manager that has the ability to identify problems and provide solutions to the key
accounts, correctly identified key accounts from a strategic perspective rather than
only size and volume, knowledge and understanding of the customers’ business,
27

and finally a culture of customer commitment and satisfaction where the involved
individuals understand what key account customers expect and why a relationship
exists in its current form.
2.3.3 Key Account Relational Development Model
KAM is a strategic initiative with long-term benefits that evolve together with the
customer relationship. McDonald et al. (1997) mention that it can take up to 10
years from account identification until the relationship has reached full potential.
Selling companies with a rigorous KAM history show that KAM activities are exe-
cuted and planned in line with the overall marketing strategy and that the strategic
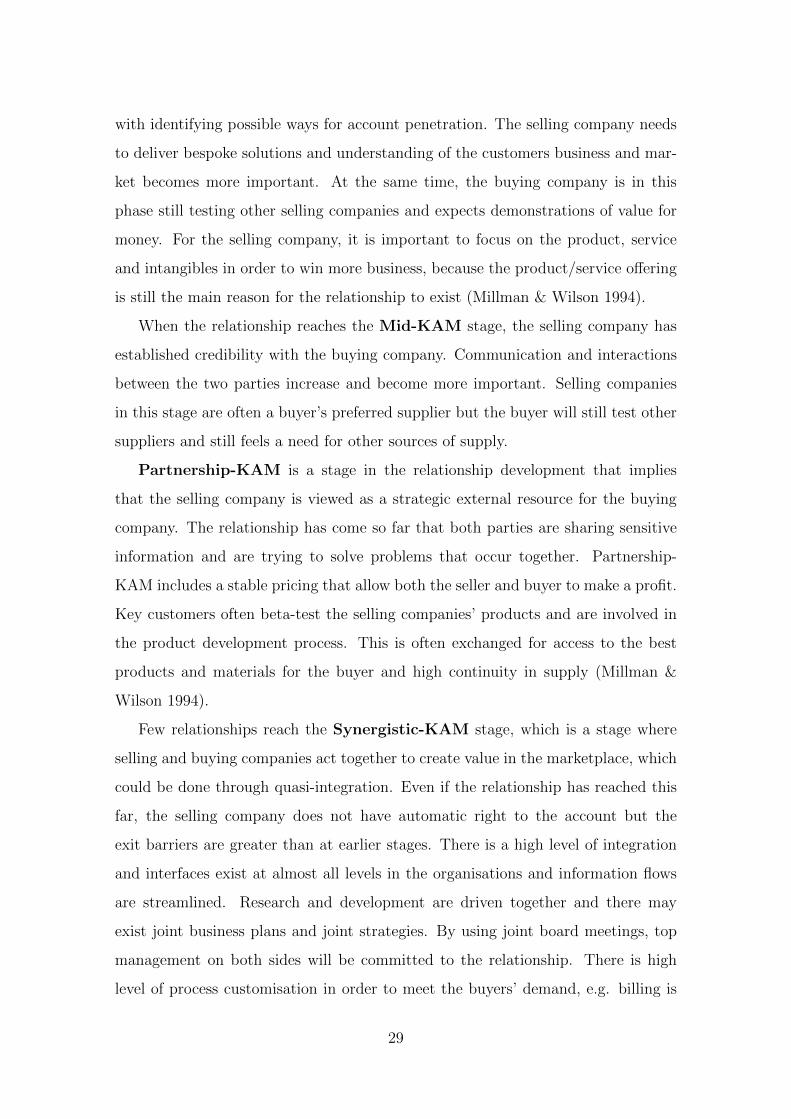
outlook is a minimum of three to five years (McDonald et al. 1997). Millman &
Wilson (1994) argue that there exist di↵erent maturities of KAM which match the
journey from a transactional relationship to the collaborative relationship. This
model is called the relational development model, visualised in Figure 7, and ex-
plained further below.
Nature of customer relationship
Level of involvement with customer
Transactional Collaborative
Simple
Complex
Early-KAM
Mid-KAM
Partnership-KAM
Synergistic-KAM
Pre-KAM
Figure 7: The Relational Development Model (Millman & Wilson 1994).
Pre-Kam is the stage before any business with a certain customer have oc-
cured. A potential key account is identified and the selling company is trying to
win business and analyse the customer in order to decide how attractive the account
is and how important it could be from a strategic point of view (Millman & Wilson
1994).
Early-KAM is a phase where the selling company starts to be more concerned
28
with identifying possible ways for account penetration. The selling company needs
to deliver bespoke solutions and understanding of the customers business and mar-
ket becomes more important. At the same time, the buying company is in this
phase still testing other selling companies and expects demonstrations of value for
money. For the selling company, it is important to focus on the product, service
and intangibles in order to win more business, because the product/service o↵ering
is still the main reason for the relationship to exist (Millman & Wilson 1994).
When the relationship reaches the Mid-KAM stage, the selling company has
established credibility with the buying company. Communication and interactions
between the two parties increase and become more important. Selling companies
in this stage are often a buyer’s preferred supplier but the buyer will still test other
suppliers and still feels a need for other sources of supply.
Partnership-KAM is a stage in the relationship development that implies
that the selling company is viewed as a strategic external resource for the buying
company. The relationship has come so far that both parties are sharing sensitive
information and are trying to solve problems that occur together. Partnership-
KAM includes a stable pricing that allow both the seller and buyer to make a profit.
Key customers often beta-test the selling companies’ products and are involved in
the product development process. This is often exchanged for access to the best
products and materials for the buyer and high continuity in supply (Millman &
Wilson 1994).
Few relationships reach the Synergistic-KAM stage, which is a stage where
selling and buying companies act together to create value in the marketplace, which
could be done through quasi-integration. Even if the relationship has reached this
far, the selling company does not have automatic right to the account but the
exit barriers are greater than at earlier stages. There is a high level of integration
and interfaces exist at almost all levels in the organisations and information flows
are streamlined. Research and development are driven together and there may
exist joint business plans and joint strategies. By using joint board meetings, top
management on both sides will be committed to the relationship. There is high
level of process customisation in order to meet the buyers’ demand, e.g. billing is
29

often bespoke to the buying company (Millman & Wilson 1994).
Moreover, Millman & Wilson (1994) argue that there exists a sixth stage in the
relationship model that is called Uncoupling-KAM. This phase is not occurring
as linear as the others because breakdowns in the relationship can occur at any stage
for a number of reasons. It is important to give attention to this stage and create
contingency plans before major breakdowns occur. Most breakdowns do occur
because of trust issues where it has been showed that buyers often feel vulnerable
and integrity amongst their suppliers is of great importance (McDonald et al. 1997).
2.4 Summary of Literature Review
The literature review presents an overview of general pricing, software pricing as
well as KAM with literature mainly from recent years, but reaching all the way
back to 1960 to capture basic concepts. The literature states that companies must
take into consideration both product design and market conditions when deter-
mining the pricing strategies, which is especially important for software since the
development of software is expensive where its upsides are from low variable cost
of production. The literature also argues that a dramatic shift has started in the
market for enterprise-software, due to declining product revenues, which will a↵ect
both users and developers of software. It also mentions that there are a lot of factors
that impact which pricing models to use, as well as a lot of di↵erent factors that
contributes to success in KAM.
By reviewing literature in the field of general pricing one can conclude that
alignment of both the vendor’s and the buyer’s business objectives gives certain
advantages in pricing. By considering both sides of the market transaction and
building a more collaborative relationship, a buyer and a vendor can both share
the increased value. Furthermore, it is more than just marketing factors to take
into account when determining the pricing, the product design is important as
well. However, to achieve pricing excellence, a company needs to go through a
development of its current pricing. Thus, to rethink ones pricing strategies and
pricing models could be a powerful source of competitive advantage.
The many software pricing models described in the literature review have a lot of
30
similarities, but all models have their own specific characteristics. This comes down
to deciding on how to align the six parameters described by Buxmann & Lehmann
(2009) and illustrated in Figure 5. Another model that the literature presents is
the SBIFT model by Coster et al. (2013), that takes five parameters into account.
The SBIFT model and the six parameters of pricing are very similar in content.
The SBIFT model is more of a tool for evaluating current pricing models and
comparing them to competitors while the six parameters of pricing can be used as
an analytical tool to design a pricing model. From our perspective, both models are
not fully completed and a combination of them, although not the same combination
that Laatikainen et al. (2013) present in their article due to their constraint to the
cloud services industry, could be useful when analysing companies’ pricing models.
SaaS-like models, that have an IT-architecture that forces the customer to con-
nect to a main server, come with the benefit that they could potentially reduce
piracy levels. Furthermore, a fixed price in a market with a heterogeneous cus-
tomer base may increase piracy since some users are not willing to purchase the
software. Hence, what the literature is lacking, is an investigation of how many of
the piracy-users that will transfer to paid users if a company is about to introduce
a pricing model which requires connection to a main server or if the company is
able to align the pricing model to their entire customer base.
Previous research conducted in the field of key success factors for KAM pro-
gram have shown consistency in terms of identifying what factors are important
to achieve an e↵ective KAM. Involvement of top level management, understanding
of customers’ business, good communication, compensation structures and good
key account managers are all mentioned as key success factors in previous litera-
ture. Furthermore, we can conclude that buyers and sellers seem to have the same
perception of what factors to be considered as key success factors.
There are di↵erences in maturity between customer-supplier relationships and
the literature seems to agree that a more collaborative relationship is better. How-
ever, it may not be entirely true since some companies may be better o↵ with a
more transactional relationship if it is more aligned to their strategy. Here there
could be a possible gap in the existing body of knowledge.
31

Although both pricing models and KAM are factors for business excellence for
companies, we have not identified earlier research that explored this relation in
a software B2B context. This is a literature gap that can potentially be covered
somewhat by this thesis.
32
3 Method
This chapter presents the chosen case study methodology and includes a description
of the research approach and the research process. Moreover, the chapter presents
the chosen methods for data collection and analysis. It ends with a reflection on the
quality of the research design, as well as the ethics of methods used.
3.1 Research Approach
The purpose of this thesis is to investigate and compare software pricing models in
a B2B setting and describe how KAM plays a role in executing a pricing model.
An exploratory research approach has been used in accordance with Voss (2002)
to cope with the various paths that the research could have taken. Furthermore, a
literature review has been conducted to enhance the understanding of the empirical
findings that have been derived concerning the identified problem.
The research has been conducted with an interpretivist paradigm as a case
study, where a single phenomenon in a specific context and natural setting has been
explored. The interpretivist paradigm has been adopted since the study assumes
that social reality is highly subjective. Moreover, a case study is suitable when
control of behavioural events is not required (Yin 2009). Since it has not been
required in this thesis, a case study is suitable. The case study has been formed
as an opportunist case study which, according to Otley & Berry (1994), is a good
choice when you have specific access to internal work flow and personnel. Although
this approach gives a limited view of the full landscape, the approach solved a
problem for Adebro and contributed to research in the area of software pricing and
KAM. The choice of the case company was therefore of natural selection due to the
access to Adebro’s internal channels.
A challenge of the research approach was to to combine theoretical and empirical
information to enhance one another. The selected information was merged together
by continuously analysing it and putting it into context. By continuously testing
theories, and applying them to the case, Jorgensen (1992) suggests that problem
areas can be found and remedies can be identified.
33

3.2 Research Process
The idea of the research originated from Adebro, who saw a need of revising its
pricing models. Adebro wanted to get a better understanding of the latest pricing
model trends and how KAM could be used to support the implementation and
execution of pricing models.
After getting deeper knowledge of the subject, by reviewing some of the latest
literature and discussing the topic together with the supervisors at KTH and Ade-
bro, a reasonable problematisation and research questions were established, which
later were revised throughout the research. The data collection began once a satis-
fying research theme was achieved. It consisted of an extensive literature review and
interviews to increase knowledge in the fields of General Pricing, Software Pricing
and Key Account Management. The collected data was then revised and analysed
on a rolling basis to only include relevant parts, which enhanced a continuous re-
flective learning from the thesis. When the data collection and data analysis were
finalised, the research process ended with a discussion and conclusion. The research
process is visualised in Figure 8.
•Problem formulation
•Research questionsLiterature
review
Data collection• Interviews• Observations
Data analysis Conclusions
Continuous discussion with supervisors
Figure 8: Overview of the Research Process
3.2.1 Literature Review
To be able to justify and analyse software pricing concepts, a literature review
was conducted to review the existing body of knowledge and to gain information
concerning the software pricing area of research together with the KAM area of
research. The literature review identifies what pricing models are available today
and in which settings they are most suitable, as well as key success factors regarding
KAM. The literature review was later used in the investigation process as a frame
of reference, which is advised by Collis & Hussey (2014).
34
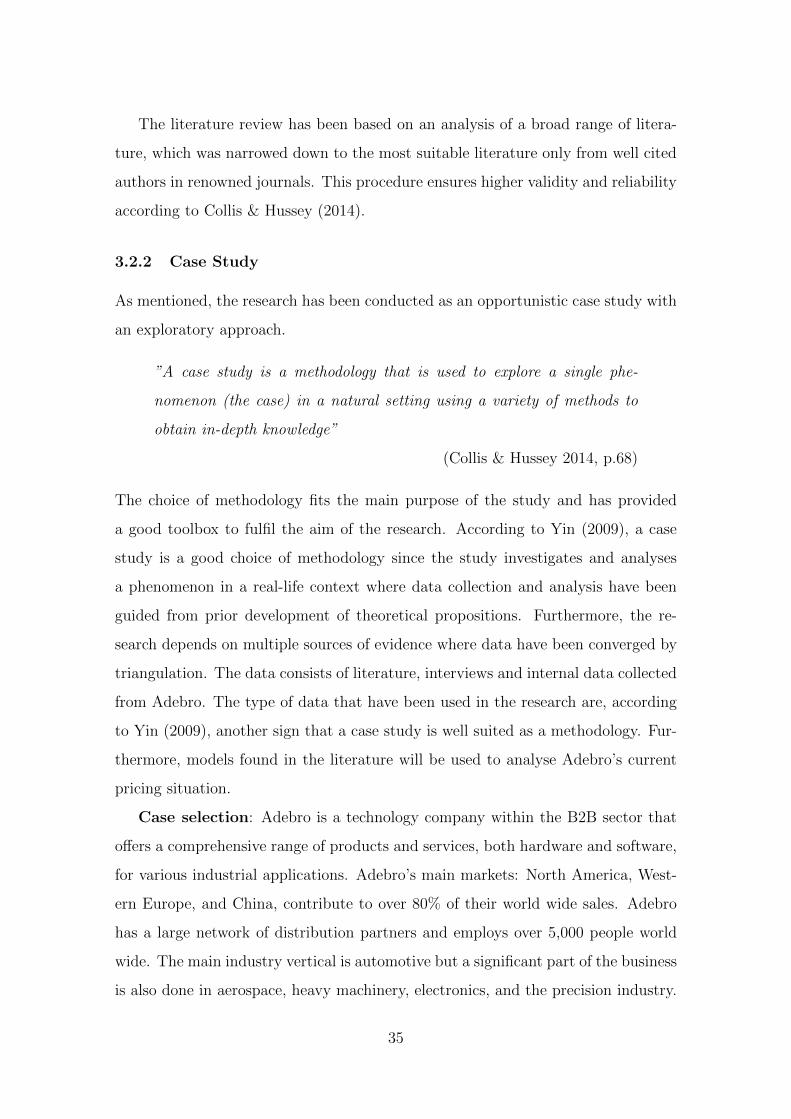
The literature review has been based on an analysis of a broad range of litera-
ture, which was narrowed down to the most suitable literature only from well cited
authors in renowned journals. This procedure ensures higher validity and reliability
according to Collis & Hussey (2014).
3.2.2 Case Study
As mentioned, the research has been conducted as an opportunistic case study with
an exploratory approach.
”A case study is a methodology that is used to explore a single phe-
nomenon (the case) in a natural setting using a variety of methods to
obtain in-depth knowledge”
(Collis & Hussey 2014, p.68)
The choice of methodology fits the main purpose of the study and has provided
a good toolbox to fulfil the aim of the research. According to Yin (2009), a case
study is a good choice of methodology since the study investigates and analyses
a phenomenon in a real-life context where data collection and analysis have been
guided from prior development of theoretical propositions. Furthermore, the re-
search depends on multiple sources of evidence where data have been converged by
triangulation. The data consists of literature, interviews and internal data collected
from Adebro. The type of data that have been used in the research are, according
to Yin (2009), another sign that a case study is well suited as a methodology. Fur-
thermore, models found in the literature will be used to analyse Adebro’s current
pricing situation.
Case selection: Adebro is a technology company within the B2B sector that
o↵ers a comprehensive range of products and services, both hardware and software,
for various industrial applications. Adebro’s main markets: North America, West-
ern Europe, and China, contribute to over 80% of their world wide sales. Adebro
has a large network of distribution partners and employs over 5,000 people world
wide. The main industry vertical is automotive but a significant part of the business
is also done in aerospace, heavy machinery, electronics, and the precision industry.
35
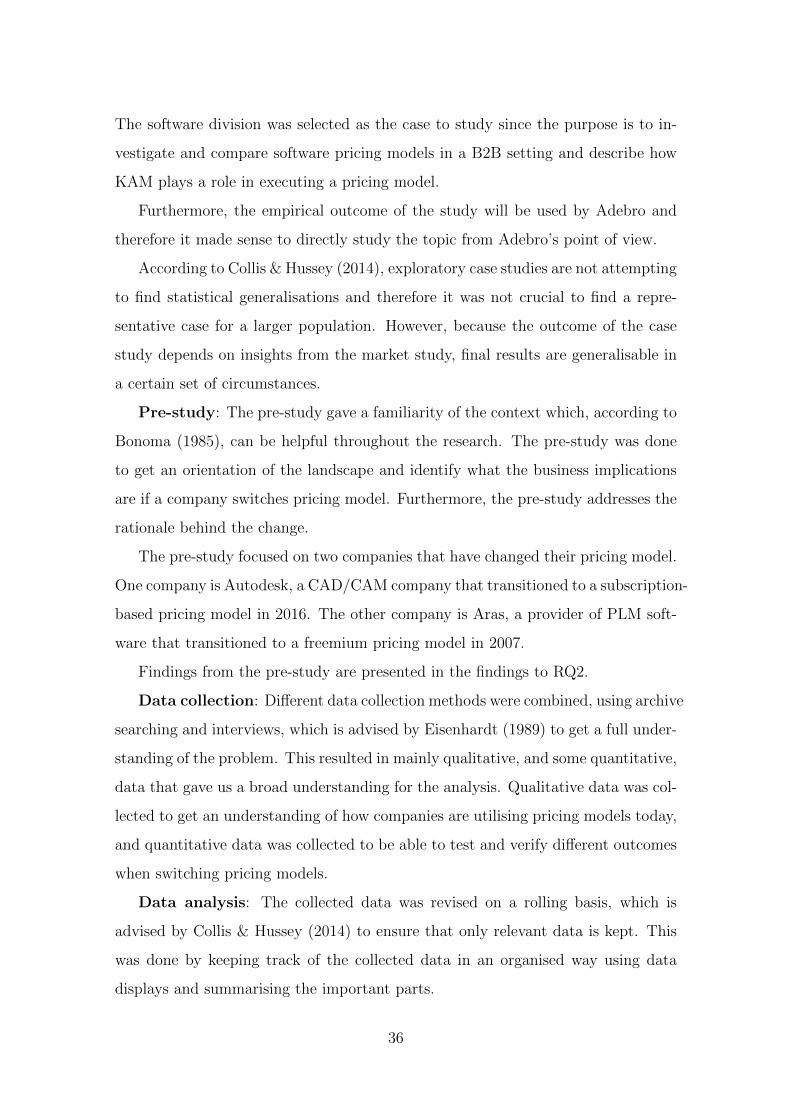
The software division was selected as the case to study since the purpose is to in-
vestigate and compare software pricing models in a B2B setting and describe how
KAM plays a role in executing a pricing model.
Furthermore, the empirical outcome of the study will be used by Adebro and
therefore it made sense to directly study the topic from Adebro’s point of view.
According to Collis & Hussey (2014), exploratory case studies are not attempting
to find statistical generalisations and therefore it was not crucial to find a repre-
sentative case for a larger population. However, because the outcome of the case
study depends on insights from the market study, final results are generalisable in
a certain set of circumstances.
Pre-study: The pre-study gave a familiarity of the context which, according to
Bonoma (1985), can be helpful throughout the research. The pre-study was done
to get an orientation of the landscape and identify what the business implications
are if a company switches pricing model. Furthermore, the pre-study addresses the
rationale behind the change.
The pre-study focused on two companies that have changed their pricing model.
One company is Autodesk, a CAD/CAM company that transitioned to a subscription-
based pricing model in 2016. The other company is Aras, a provider of PLM soft-
ware that transitioned to a freemium pricing model in 2007.
Findings from the pre-study are presented in the findings to RQ2.
Data collection: Di↵erent data collection methods were combined, using archive
searching and interviews, which is advised by Eisenhardt (1989) to get a full under-
standing of the problem. This resulted in mainly qualitative, and some quantitative,
data that gave us a broad understanding for the analysis. Qualitative data was col-
lected to get an understanding of how companies are utilising pricing models today,
and quantitative data was collected to be able to test and verify di↵erent outcomes
when switching pricing models.
Data analysis: The collected data was revised on a rolling basis, which is
advised by Collis & Hussey (2014) to ensure that only relevant data is kept. This
was done by keeping track of the collected data in an organised way using data
displays and summarising the important parts.
36
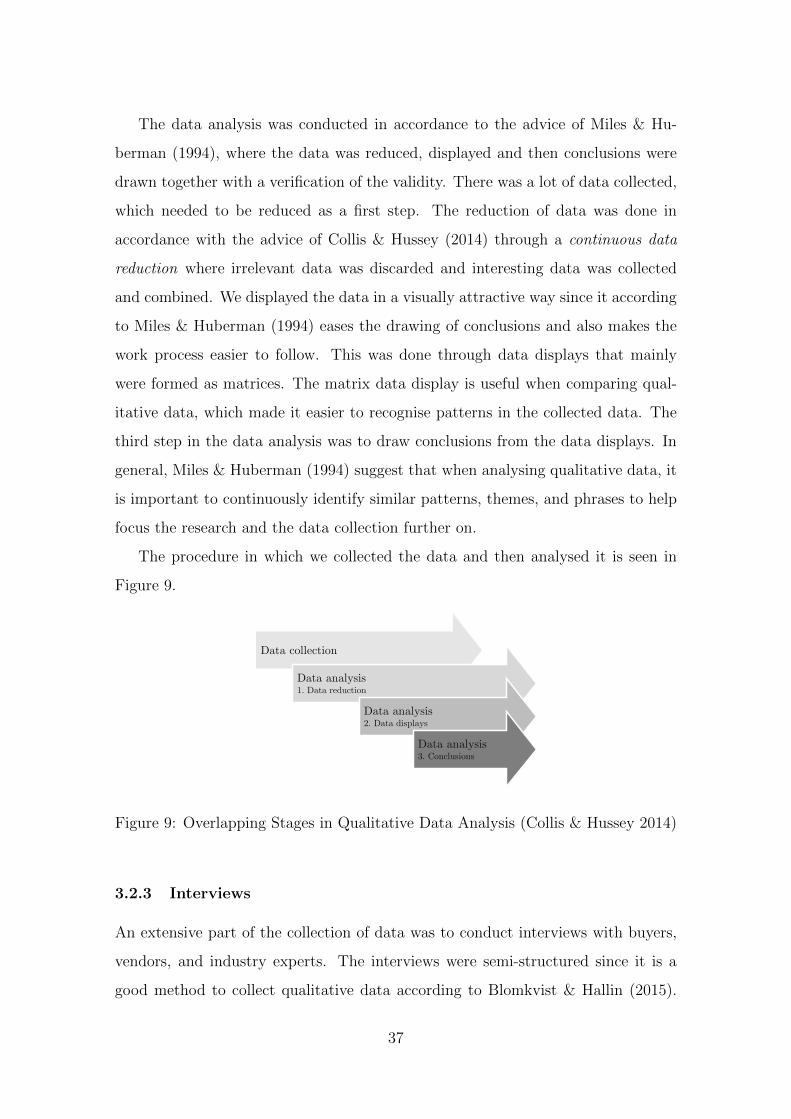
The data analysis was conducted in accordance to the advice of Miles & Hu-
berman (1994), where the data was reduced, displayed and then conclusions were
drawn together with a verification of the validity. There was a lot of data collected,
which needed to be reduced as a first step. The reduction of data was done in
accordance with the advice of Collis & Hussey (2014) through a continuous data
reduction where irrelevant data was discarded and interesting data was collected
and combined. We displayed the data in a visually attractive way since it according
to Miles & Huberman (1994) eases the drawing of conclusions and also makes the
work process easier to follow. This was done through data displays that mainly
were formed as matrices. The matrix data display is useful when comparing qual-
itative data, which made it easier to recognise patterns in the collected data. The
third step in the data analysis was to draw conclusions from the data displays. In
general, Miles & Huberman (1994) suggest that when analysing qualitative data, it
is important to continuously identify similar patterns, themes, and phrases to help
focus the research and the data collection further on.
The procedure in which we collected the data and then analysed it is seen in
Figure 9.
Data collection
Data analysis1. Data reduction
Data analysis2. Data displays
Data analysis3. Conclusions
Figure 9: Overlapping Stages in Qualitative Data Analysis (Collis & Hussey 2014)
3.2.3 Interviews
An extensive part of the collection of data was to conduct interviews with buyers,
vendors, and industry experts. The interviews were semi-structured since it is a
good method to collect qualitative data according to Blomkvist & Hallin (2015).
37
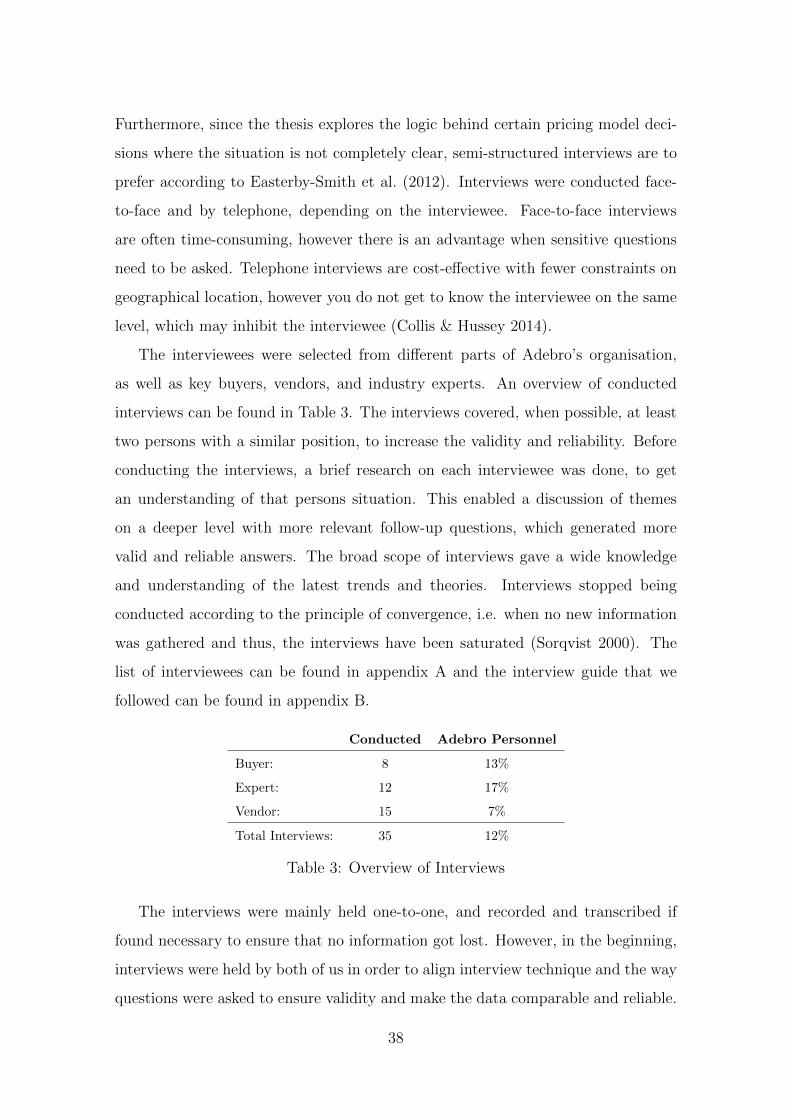
Furthermore, since the thesis explores the logic behind certain pricing model deci-
sions where the situation is not completely clear, semi-structured interviews are to
prefer according to Easterby-Smith et al. (2012). Interviews were conducted face-
to-face and by telephone, depending on the interviewee. Face-to-face interviews
are often time-consuming, however there is an advantage when sensitive questions
need to be asked. Telephone interviews are cost-e↵ective with fewer constraints on
geographical location, however you do not get to know the interviewee on the same
level, which may inhibit the interviewee (Collis & Hussey 2014).
The interviewees were selected from di↵erent parts of Adebro’s organisation,
as well as key buyers, vendors, and industry experts. An overview of conducted
interviews can be found in Table 3. The interviews covered, when possible, at least
two persons with a similar position, to increase the validity and reliability. Before
conducting the interviews, a brief research on each interviewee was done, to get
an understanding of that persons situation. This enabled a discussion of themes
on a deeper level with more relevant follow-up questions, which generated more
valid and reliable answers. The broad scope of interviews gave a wide knowledge
and understanding of the latest trends and theories. Interviews stopped being
conducted according to the principle of convergence, i.e. when no new information
was gathered and thus, the interviews have been saturated (Sorqvist 2000). The
list of interviewees can be found in appendix A and the interview guide that we
followed can be found in appendix B.
Conducted Adebro Personnel
Buyer: 8 13%
Expert: 12 17%
Vendor: 15 7%
Total Interviews: 35 12%
Table 3: Overview of Interviews
The interviews were mainly held one-to-one, and recorded and transcribed if
found necessary to ensure that no information got lost. However, in the beginning,
interviews were held by both of us in order to align interview technique and the way
questions were asked to ensure validity and make the data comparable and reliable.
38
Questions were presented in a logical order and moved from general to specific
topics. The types of questions used were mainly open questions followed up with
probes, but sometimes also closed and comparison questions were used. However,
summary questions were used at the end of the interview to get the full picture
and ensure that nothing had been misunderstood. When an interviewee mentioned
something that was very di↵erent from the previous interviews, i.e. an anomaly,
the interview shifted focus to try and understand that person’s paradigm, and to
investigate the reason behind that anomaly.
3.3 Quality of the Research Design
To maintain a high quality of research, it is important to ensure validity and reli-
ability throughout the study. Validity is to make sure that the research is about
the right thing, and reliability is to make sure that the research is conducted in
the right way (Blomkvist & Hallin 2015). Good validity and reliability makes the
research appealing and ensures that if the research would be replicated, then the
results would be the same (Collis & Hussey 2014).
To ensure validity and reliability of the study, the four dimensions of validity and
reliability presented by Gibbert et al. (2008) were adapted. The four dimensions
are: internal validity, construct validity, external validity and reliability.
Internal validity tests the causal relationship between the variables and the
results. Triangulation of data and theories throughout the data gathering was used
which, according to Easterby-Smith et al. (2012), minimises the causal relationship.
However, the choice of having an exploratory research approach, limits the thesis
to be based on mainly qualitative information instead of quantitative. The inter-
pretation of the findings then risks being judgemental, and not purely data based
as it would have been in the case of quantitative data. Therefore, there is a risk
that even triangulated data are a↵ected and the internal validity is thus lowered.
Construct validity tests how much of the initial problem the study actually
investigates. Interviews could potentially be a problem, since they may be mis-
leading. It was therefore important that the initial research path was maintained
during the interviews to ensure that they did not become misleading, which they
39
might become if the research path is deviated according to Gibbert et al. (2008).
External validity, which may be referred to as generalisability, is how much
the study can be replicated in other markets and contexts. Since the case study
investigates a particular subject in a particular environment, it lowers the general-
isability. However a clear and structured method was followed, which other studies
can adapt on similar companies in a similar context, and thus, Gibbert et al. (2008)
argue that this approach makes a thesis generalisable in a certain set of circum-
stances.
Reliability refers to the absence of random error, which makes it easier for
other authors to come to the same conclusion as this thesis. It was therefore impor-
tant to achieve transparency and replication. A high transparency throughout the
study was maintained by keeping track of the work through journals and spread-
sheets, which were gathered into a database. According to Yin (2009), a database
can then later be used to facilitate retrieval for new investigators, which makes the
transparency higher. The literature review consists of literature from high-ranked
journals, and interviews were conducted with individuals with specific knowledge
of the problem, which according to Gibbert et al. (2008), ensures reliability. Since
the thesis has been conducted under an interpretivist paradigm, the reliability of
findings have been considered high if they could be verified from multiple sources.
However, this statement can be questioned since interviewees could have been cho-
sen to get similar answers. This was not the case in this study, where interviewees
were chosen from di↵erent industries and positions. Moreover, the reliability of
findings could further be questioned since findings are based on the assumption
that interviewees are always telling the truth and are consistent in their answers in
this, and other, research. Finally, it is in general di�cult to separate people from
the context in interviewees. Therefore, interviewees have been seen as individuals
with personal opinions during, and after, interviews.
3.4 Ethics of Methods Used
The research has been conducted in collaboration with Adebro, who has shared a
lot of valuable and sensitive information. Therefore, respecting confidentiality and
40

anonymity has been important. Sensitive information that could not be published
has been altered, but been kept relatively the same in the research to maintain the
validity.
Since the main parts of the thesis are based on interviews, Bell & Bryman (2007)
argue that there may be a risk of falsely reporting data as a result of misunder-
standings. To avoid this, vague information was actively clarified and answers from
the interviews have been repeated to ensure that no data is falsely reported.
Furthermore, personal opinions have not been included, and individuals have not
been exposed without their consent. Moreover, all interviewees have been informed
about the purpose of the research in order to avoid a situation where the interviewees
felt forced to answer or have been tricked into giving away information.
A�liation is another principle of ethic that have been handled. By this, Bell &
Bryman (2007) mean that a researcher needs to declare the personal or professional
a�liation that may influence the study. This includes conflicts of interest and
sponsorship that influenced the research since the thesis has been conducted in
collaboration with Adebro.
As support for the ethical decision, open discussions have been held with both
the supervisor from Adebro and the academic supervisor. Furthermore, the general
guidelines from KTH regarding research ethics have been the basis of ethical deci-
sions. This includes a sustainability discussion as well as no tolerance for plagiarism
and research misconduct.
41

This page intentionally left blank
42

4 Findings
This chapter presents the empirical findings together with an analysis of the collected
data to fulfil the purpose of the study. Findings are presented in the order of the
research questions.
4.1 RQ1: What software pricing models are attractive for
Adebro in terms of market trends, customer prefer-
ences, and internal capabilities?
4.1.1 Market Trends
Most interviewed experts and vendors are unanimous concerning that hardware
itself is becoming a commodity with decreasing prices and pressured margins. This
statement gets support by data from the Bureau of Economic Analysis, presented
in Figure 10, that shows chain-type price index development from year 2000 to
2014 for computer systems design and related service (software) and computer and
electronic products (hardware) in the US. It is a clear trend that prices of hardware
are dropping significantly compared to software which implies that software will
play a bigger part in the hardware-software relationship.
Interviews suggest that, as the CAM and GD&T markets are fragmented, com-
petition is strong. This puts pressure on vendors and price becomes a strong com-
petitive factor since communicating the value of a specific software is rather di�cult.
However, as the SPC market is more consolidated, vendors are not forced on the
same way to compete with price.
The pricing model that is most commonly used to price industrial technology
software, including CAD/CAM, SPC, and GD&T, today is a perpetual license
followed by a Software Maintenance Agreement (SMA) with yearly payments. These
yearly agreements include all updates related to the software at a cost of around
10-20% of the Initial Purchase Price (IPP) of the perpetual licence. Each of the
interviewed vendors have had a perpetual model since the foundation of its company,
since it traditionally was the best way to sell software. However, with new digital
43
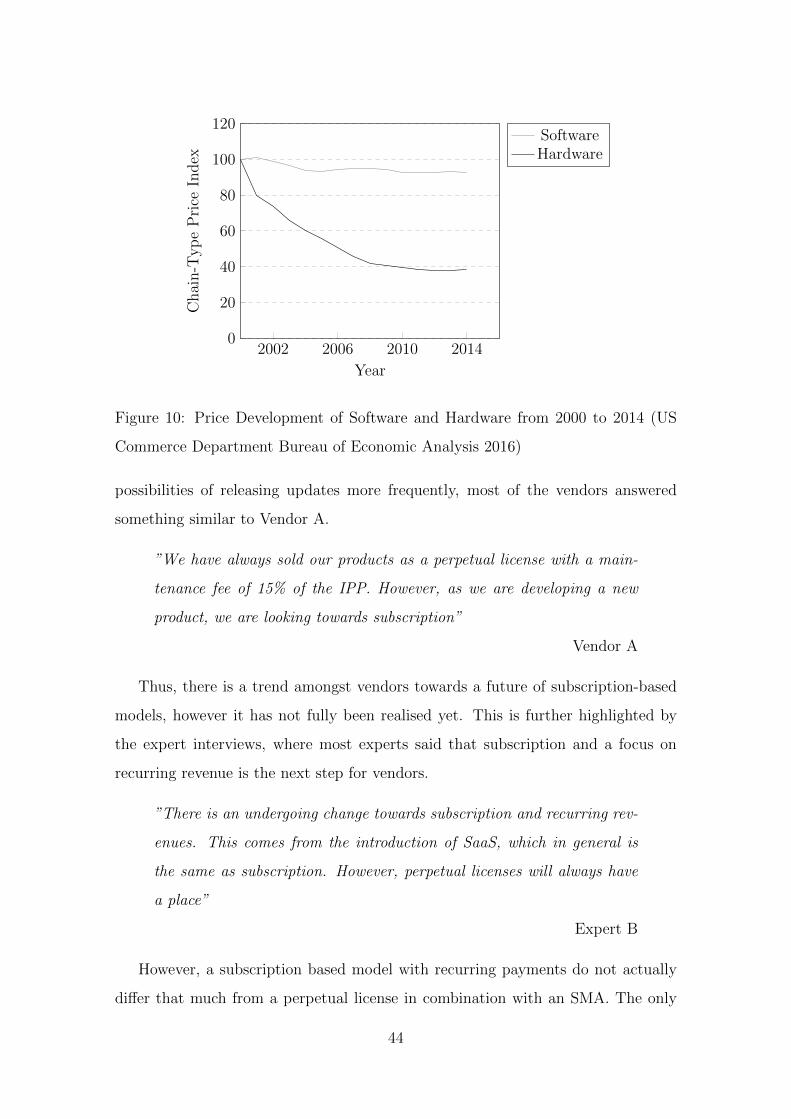
2002 2006 2010 20140
20
40
60
80
100
120
Year
Chain-T
ypePrice
Index
SoftwareHardware
Figure 10: Price Development of Software and Hardware from 2000 to 2014 (US
Commerce Department Bureau of Economic Analysis 2016)
possibilities of releasing updates more frequently, most of the vendors answered
something similar to Vendor A.
”We have always sold our products as a perpetual license with a main-
tenance fee of 15% of the IPP. However, as we are developing a new
product, we are looking towards subscription”
Vendor A
Thus, there is a trend amongst vendors towards a future of subscription-based
models, however it has not fully been realised yet. This is further highlighted by
the expert interviews, where most experts said that subscription and a focus on
recurring revenue is the next step for vendors.
”There is an undergoing change towards subscription and recurring rev-
enues. This comes from the introduction of SaaS, which in general is
the same as subscription. However, perpetual licenses will always have
a place”
Expert B
However, a subscription based model with recurring payments do not actually
di↵er that much from a perpetual license in combination with an SMA. The only
44
real di↵erence for the customer is the issue regarding ownership and the up-front
cost which will be higher for a perpetual license while the recurring fee is higher
for a subscription compared to the maintenance fee. The choice between these two
models is dependent on the customer preference and which model aligns best with
how the customer generates value from the product, and therefore the models will
not replace each other fully.
A market example of the trend towards subscription based models is a player in
the CAD/CAM market, Autodesk, that recently switched their pricing model for all
their products towards a complete cloud-based subscription model, which could be
viewed as a SaaS. Furthermore, Dassault Systemes, another player in the market,
has launched a fully browser-based CAD product as well. This is not as clear in
the other two markets, SPC and GD&T, where market players still are o↵ering
perpetual license as their main pricing model. This is due to di↵erent product
characteristics and consumer behaviours, GD&T software for stationary CMMs are
often sold in combination with the hardware and thus, pure software pricing models
do not apply since it is not sold as a software product.
As we can see from the competitors recent pricing model change, they are not
only changing towards subscription, but also into cloud-based and SaaS-like models.
This is further accentuated by Expert E.
”There are a few di↵erent trends out in the market today, where the
most obvious one is the move towards cloud-based solutions”
Expert E
However, a move towards cloud-based solutions is more a question of owner-
ship rather than pricing model, but cloud-based solutions are often associated with
subscription-based pricing models. Furthermore, companies may have their internal
cloud and thus using cloud-solutions already today. The question is then regarding
data security laws and if companies are comfortable with trusting an external party
with business critical data or not.
To conclude, we can see that although experts state that it is a common trend
towards subscription in general, the interviewees have been clear about the lack of
45
a common best practice in the software industry and said something in line with
Expert B.
”There is no best practice in the software industry”
Expert B
4.1.2 Customer Preference
Most of the interviewees mentioned that the pricing model must not only be aligned
with customer preferences, but also aligned with how the customer’s business is
formed. The pricing model should be based on how the customer generates value
from the software itself. If a software product or solution increases productivity and
save costs associated with individuals, then the pricing model should be user based
or seat based. On the other hand, if the software o↵ers overall e�ciency, then either
a monthly or a transactional model independent on number of users would work.
Therefore, it is important to understand the customer. Customers will be di↵erent
from each other and that is one reason why one model will not replace another.
Most of the experts that have been interviewed said something in line with Expert
D.
”SaaS will not replace on premise software, it is just another flavour in
your bucket”
Expert D
Adebro serves both global Original Equipment Manufacturers (OEMs) and local
subcontractors, which means that the customer base can be quite heterogeneous in
terms of size and purchasing power. This is especially clear for customers that are
buying the CAM software o↵erings.
”Our customers range from OEMs, like Boeing and Airbus, to smaller
subcontractors in your neighbourhood”
Vendor E
When it comes to the structure of the pricing model, buyers of software prefer
simple models where they understand what they are paying for and why they are
46
being billed a certain amount. Larger companies expressed that they preferred
partnerships with their suppliers and that they expect transparency in the pricing
methodology.
The interviews also point out that customers, who are buying CAM software, are
more likely to have project based operations. A subscription-based model will then
be favourable since it makes it easier to sign up to a number of licenses depending
on their need. These subscriptions can later be cancelled when the project is over.
This makes it easier for customers to allocate costs between projects and also easier
to budget upcoming costs depending on the need of software.
”Our customers are mainly working in projects, and when we asked them
about their preferences regarding pricing models they said that a sub-
scription would be beneficial for them”
Vendor G
For customers buying GD&T or SPC software it is a bit di↵erent. Most of the
GD&T software are sold together with stationary hardware as mentioned before.
In these cases, the customer is mainly buying the hardware, but needs a software
on the side. The cost of software is then only a minor part of the entire cost and
thus, the entire deal is often classified as a Capital Expenditure (CAPEX). The
SPC software o↵ered by Adebro are mainly bought by customers because they need
it and there is a lack of better products in the market, emphasised by Vendor B,
an SPC-vendor.
”The main purchasing reason for the customers is that they really need
it to ensure quality and we are the best in the market”
Vendor B
Buyers have during interviews stated that pay for usage is a preference and
thus, a perpetual license can be considered obsolete. Nonetheless, some of the
interviewees mentioned that usage dependent models sound like the optimal choice
in theory. However, having a usage dependent price, will most likely decrease the
overall usage of the product and it could also lead to unexpected temporary cost
47
peaks if one is not aware of the fact that extra usage will cost. A subscription with
a usage independent price could therefore be a good compromise.
”I don’t prefer complex models like the ones that counts number of CPUs
or memory used, no one understand those kind of models”
Buyer A
Findings from interviews with buyers of software suggest that price is one of the
most important KPC. When buyers were asked how a vendor can generate more
value to a customer, almost all buyers mentioned a decrease in price. This may
imply that customers are struggling to understand why software is expensive and
what value it can create. Furthermore, findings from interviews with vendors point
to that software, especially concerning GD&T and SPC software, are mainly viewed
as an extra cost in the customer’s organisation. Simplicity, flexibility, user interface,
time to market, and potential to save costs were further mentioned as KPC by the
buyers.
When buying software with a perpetual license, companies often see this as a
capital investment much like any other product they buy, and therefore the cost
will be classified as a CAPEX. The buying company needs to have enough money
up-front to be able to purchase the perpetual license, but can depreciate the cost
over time. On the other hand, when buying software with a subscription based
model, the payment will often instead be classified as an Operating Expenditure
(OPEX). If a company prefer CAPEX or OPEX could change over time and it is
tightly linked to the business cycle and the current state of the business as Buyer
B explains.
”CAPEX/OPEX investment choices depend on the state of the business.
Sometimes it is better with CAPEX and sometimes with OPEX”
Buyer B
Buyer B further explains that the choice of pricing model can simplify the corpo-
rate budgeting for a customer. A subscription with a fixed price simplifies budgeting
since they will know the costs for the software. Furthermore, interviews with buyers
48

highlighted that customers sometimes prefer to pay a premium to get a recurring
fixed price and keep away from temporary cost peaks due to increased usage of the
software. This speaks against pay per use models where the price depends on e.g.
memory used or data tra�c. Furthermore, buying licenses trough a subscription is
simple according to buyers and thus, they can focus more on their core business in-
stead of managing licenses. One buyer stated that a reasonable annual subscription
price could be 25-35% of the IPP for a perpetual license.
The buyer’s willingness to pay a premium to get a recurring fixed price was also
to secure themselves from unpredictable new costly versions, not included in the
SMA. Some customers expressed that they felt that SMAs not often contributes
with any real value. It is only minor updates and patches that are delivered and
the cost for an SMA can thus be quite high. Whenever there is a larger upgrade
they have to make a new up-front investment and therefore they are not feeling that
an SMA contribute to any real value. Buyers at larger companies expressed that
an SMA only creates value the first two or three years. After that, it is common
for larger companies to have organised their own internal service team.
The vendors’ perception of how customers view cloud-based services di↵er from
the experts’ view. Whilst the experts were convinced that SaaS and cloud solutions
are what to be preferred now, the industrial technology software vendors are not
fully devoted to that. They believe that customers want security and certainty
of functionality at all time and therefore want to have the software on their own
machine instead of in the cloud. This is more in line with what the interviewed
buyers said, which was something similar to Buyer B.
”Cloud solutions are not interesting right now because of security issues.
It may however be relevant in the future”
Buyer B
The main reason for this is issues regarding data security and data security laws,
according to interviews. One of the interviewed buyers from a heavy equipment
manufacturer explained that when they are about to transfer data from countries
in EU to North America, they need to ensure that the data is protected. EU has
49
strong privacy laws that forbid movement of citizens’ data outside the EU. To get
around this, companies have to set up so called safe harbour agreements which
ensure that data is transferred to a location with adequate privacy protection. This
is often a time consuming, complex, and costly process for companies (The Guardian
2015).
Another reason for this reluctance to the cloud, according to the vendors, is that
most of the decision-makers are from the pre-digital generation. They are not used
to, or comfortable with, storing sensitive information at a third party server. For
most of their business life, software have been installed locally on the computer and
that have given some comfort. However, the vendors are foreseeing that with the
new digital generation, companies will not be as reluctant to having the software in
the cloud, since their new personnel are used to handling software in that way. New
technology will also enable an even more stable Internet environment, which will
ensure constant connectivity. This generation shift is, according to some vendors,
happening right now since companies have realised that it is harder to attract good
employees if they are stuck in old ways of working with IT.
”Young talents don’t want to go out to a job and go back in time tech-
nology wise and that is why the changes are happening right now. Com-
panies must adapt, otherwise they will lose good future employees”
Vendor H
Buyers of software expressed their concern regarding di�culties of comparing
software. This is mainly due to di↵erent features, abilities, GUI, complex pricing
models, and previous user experience. Comparing software was mentioned to be
much more di�cult than comparing hardware specifications.
Finally, most buyers found it hard to pinpoint which pricing model is a prefer-
ence, since it is changing along with the business cycle and personal preferences of
the product owner.
”It is hard to say what pricing model we prefer, it is changing all the
time depending on the software and the situation”
Buyer H
50

This is further emphasised by Expert L, who worked with software pricing for
over 20 years in multiple industries.
”We have found no reason why someone prefers a certain model. It
doesn’t correlate with size, industry, ownership, it doesn’t correlate with
anything”
Expert L
4.1.3 Internal Capabilities and Structure of Software O↵ering
Adebro looks to provide insights, analytics, and intelligent management systems to
enhance productivity, and the main competitive advantage for Adebro is that they
can provide fully integrated and complete solutions by themselves. Therefore, the
goal is to be able to connect all software products to each other, which will come
with some limitations regarding how to work with licensing. It would be favourable
to have similar pricing models and licensing structures across the software o↵erings,
but it may be tough to do so. Software products are today sold from the subsidiaries
via Adebro’s sales channels, external resellers, and via direct sales. Thus, having
one model in Adebro’s sales channel while a subsidiary supply Adebro with another
model is therefore not beneficial since it will increase complexity.
”Selling a package of di↵erent software where each one have a di↵erent
pricing model is very complicated for the customer. I can’t see how it
would work with di↵erent models internally and externally”
Buyer A
Analysing Adebro with the pricing capability grid, visualised earlier in Figure 2,
we conclude that Adebro would be placed in the ”Zone of Good Intentions” since
interviews with internal personnel at Adebro and Adebro’s subsidiaries show that
Adebro mostly is using competition based pricing. Furthermore, Adebro is using
discounts frequently in the sales process, so Adebro is placed as a medium company
in terms of price getting. To be able to move to the ”Pricing Power Zone”, Adebro
has to work mainly with price getting but also move to a more value based pricing.
51
Analysing customer preferences and choosing a pricing model that is more aligned
to the customers’ business and value creation will most likely result in a more value
centric price and pricing model.
A move to a more value centric pricing may imply that Adebro could transition
from being a ”Level 2” company to a ”Level 3” company in terms of the five levels
of word class pricing by Hunt & Saunders (2013). Adebro is currently positioned
as a ”Level 2” company since pricing processes are controlled by controlling the
discounting. In a ”Level 3” company, decisions are made with the customers’ value
in mind and prices are value-based.
Price setting of Adebro’s software o↵erings are today di↵erent depending on the
product, since all subsidiaries were completely independent companies before Ade-
bro acquired them. CAM software have been priced according to the competition-
base, which also is the case of the GD&T o↵erings, except that GD&T o↵erings have
been somewhat influenced by the created value since customers are very dependent
on the software. The SPC o↵ering is however di↵erent with a value-based formation
of price, due to the lack of competition in the market. Vendor E emphasises that
individual software licenses are lacking a break even point since the marginal cost
of producing a license is almost negligible. This could be a further explanation why
software vendors find it very tempting to reduce prices to win business.
”We are selling our CAM products at a price that is lower than the
actual value it delivers to customers due to the competitors low price”
Vendor E
The structure of payment is the same across the di↵erent software o↵erings,
where the customers are paying a single up-front payment for a perpetual license,
together with an optional recurring fee for an SMA after a year. However, the as-
sessment base, the license type, and what the final price depends on di↵er for SPC
where the o✏ine connected SPC version sometimes is o↵ered with a usage indepen-
dent concurrent license, and the online version, i.e. connected to the manufacturing
process, must be available at all times and is sold as a regular usage independent
perpetual license. Otherwise, CAM and GD&T products are priced based on the
52

number of components, or features, included in the product, and often sold as a
usage independent perpetual site license.
Price discrimination is mostly the same across the products, where the customers
are getting a higher discount if they buy a higher quantity of the product. However,
the CAM software are also o↵ered with discount depending on the geographic region.
All o↵erings are sold as a bundled package with software together with an SMA.
However, GD&T software are mainly bundled together with hardware, a physical
CMM, and is therefore not mainly sold as a software itself, but can also be sold as
retrofit. This bundling sets a limitation on what pricing models that can be used
for the software, since it depends on how the hardware is sold.
”The CMM vendors finds it hard to change pricing model for their soft-
ware, since it is not sold as a stand alone software product”
Expert F
Both the CAM and GD&T market are fairly fragmented while the SPC market
is consolidated and often industry specific. Adebro are a top player in all of the
three markets. A comparison of the parameters of pricing for Adebro’s software
o↵erings is visualised in Table 4.
CAM GD&T SPC
Formation of Price: Competition-based Competition-& Value-based Value-based
Payment Flow: Single + optional recurring Single + optional recurring Single + optional recurring
Assessment Base: Usage independent compo-
nents
Usage independent compo-
nents
Usage independent compo-
nents
Price Discrim.: 2nd/3rd degree 2nd degree 2nd degree
Bundling: SW+SMA SW+SMA, HW+SW SW+SMA
Product Maturity: High High High
Distribution: Own & reseller Own & reseller Own & reseller
Market Conditions: Top player in fragmented
market not related to PLM
Top player in fragmented
market
Consolidated market,
industry-specific market
leader
Table 4: Parameters of Adebro’s Software O↵ering
53
4.2 RQ2: What are the implications of switching pricing
model?
4.2.1 Customer Implications
Implications of switching pricing models will directly a↵ect revenue and the cus-
tomers, and indirectly a↵ect business operations, including sta↵ and distribution
channels. The implications for the customer will mainly depend on what type of
pricing model the vendor switches to. However, customers will always have the
option to either accept the new pricing model, or renegotiate with other software
suppliers. Thus, a new pricing model that is not a fit to the customer, may imply
that the customer could change software provider. Switching to a new software
supplier must however generate substantial advantage for the customer, since they
have invested a lot of time and money in the current software.
”If we would change software supplier, the money we put into training
and support for our current software would be lost. Thus, the alternative
cost is huge!”
Buyer E
What type of pricing model a vendor chooses will also impact on how often the
customer will receive major updates. Certain pricing models, e.g. subscription,
generally releases major updates more frequently compared to an SMA agreement.
Thus, the time-to-market will di↵er, and therefore indirectly the quality of the
software for the customer.
”We don’t feel that we are getting any new value from the SMA after
2-3 years. Major updates are instead released as new licenses”
Buyer B
Additionally, a pricing model where the customer never really own the software,
will enable more focus for the customer on its core business, instead of managing
the licenses.
54
”Our core business is not to own and develop software. We are a man-
ufacturer and just want our core operation to run smoothly”
Buyer F
A new pricing model may also impact the customers’ financials. The financial
structure will mainly depend on how the license is payed for, if it is usage dependent
or independent, and if there will be up-front or recurring payment. Whether one
model for the customer is more financially attractive than the other, depends on
what time span the customer will use the product. Furthermore, as mentioned in
RQ1, the pricing model of the software can also determine what type of investment
the customer categorises the software, either as CAPEX or OPEX. Thus, the choice
of pricing model will have an impact on the accounting side of the buying company,
and therefore the pricing model should be aligned with the characteristics of the
customers’ business and their preferences regarding corporate budgeting.
”It is important to take the customers’ corporate budgeting into account
when deciding a pricing model”
Expert B
However, even if the choice of pricing model a↵ects the customers’ corporate
budgeting, interviews suggest that it is not a good idea to base the choice of pricing
model on whether the customer has OPEX or CAPEX as a preference at that,
specific, point in time since that could easily change within the business cycle.
4.2.2 Business Implications
A new pricing model may lead to new internal positions in the company, hence it will
impact current sta↵ where some personnel may need to switch to new positions. If
the company would have a transition period where it operates two di↵erent models,
it will most likely require more internal work and increased complexity.
”If a company would operate two di↵erent pricing models at the same
time, it would double the work and significantly increase costs”
Vendor G
55
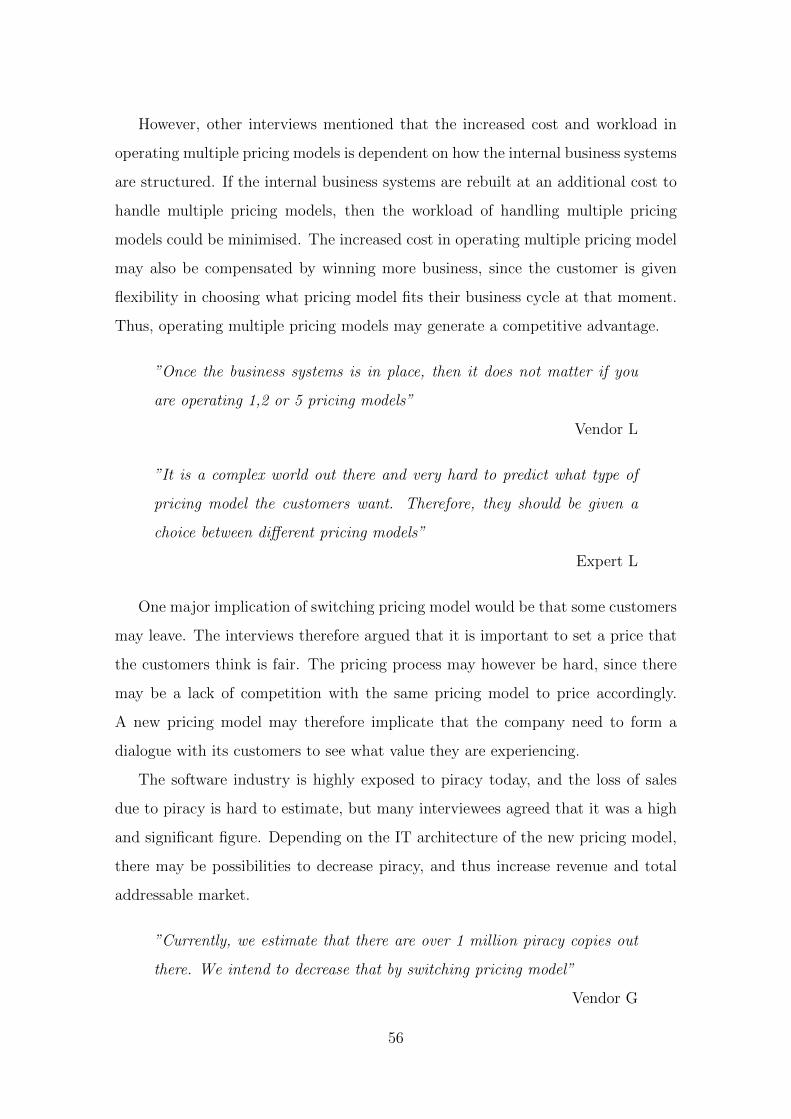
However, other interviews mentioned that the increased cost and workload in
operating multiple pricing models is dependent on how the internal business systems
are structured. If the internal business systems are rebuilt at an additional cost to
handle multiple pricing models, then the workload of handling multiple pricing
models could be minimised. The increased cost in operating multiple pricing model
may also be compensated by winning more business, since the customer is given
flexibility in choosing what pricing model fits their business cycle at that moment.
Thus, operating multiple pricing models may generate a competitive advantage.
”Once the business systems is in place, then it does not matter if you
are operating 1,2 or 5 pricing models”
Vendor L
”It is a complex world out there and very hard to predict what type of
pricing model the customers want. Therefore, they should be given a
choice between di↵erent pricing models”
Expert L
One major implication of switching pricing model would be that some customers
may leave. The interviews therefore argued that it is important to set a price that
the customers think is fair. The pricing process may however be hard, since there
may be a lack of competition with the same pricing model to price accordingly.
A new pricing model may therefore implicate that the company need to form a
dialogue with its customers to see what value they are experiencing.
The software industry is highly exposed to piracy today, and the loss of sales
due to piracy is hard to estimate, but many interviewees agreed that it was a high
and significant figure. Depending on the IT architecture of the new pricing model,
there may be possibilities to decrease piracy, and thus increase revenue and total
addressable market.
”Currently, we estimate that there are over 1 million piracy copies out
there. We intend to decrease that by switching pricing model”
Vendor G
56

It is not only the business itself that will be impacted, but also everyone in
the company’s network, including its distribution channels. In the case of selling
through resellers, it may prove hard to change pricing model since the new pricing
model must make sense to the reseller as well. If the resellers do not approve the
new pricing model, and decide to sell a competitors product instead, the company
may not only lose sales but also its support team, since regional resellers often also
operate as the support team today. This was emphasised during the interviews
where many said something in line with Expert F.
”Resellers don’t often have any connection to the product itself, if the
reseller will make more money selling another product, they will”
Expert F
The resellers must not only approve the new pricing model, but they must also
be prepared for a new proposed allocation of the revenue that comes from the sales,
between the company and its resellers since the new pricing model may lead to some
financial impact. Thus, the company must also make the resellers understand that
the financial impact will be similar for them as for the company.
4.2.3 Profitability and Financial Implications
The interviewees were convinced that a new pricing model will, depending on the
model, impact the company’s profitability. The pricing model change that will have
the most direct impact is the change from perpetual to subscription. This mean
that the vendor will receive monthly payments instead of a lump sum of the IPP.
Thus, the accumulated revenue generated from subscription-based models will take
a few years before it becomes larger than the accumulated revenue from perpetual
licenses.
”If the payment structure is changed, it will a↵ect both the buyer’s and
the vendor’s financials”
Expert G
Some of the interviewees said that the change in revenue may have an impact on
the shareholders, since the drop in revenue could be seen as a weakness the share
57
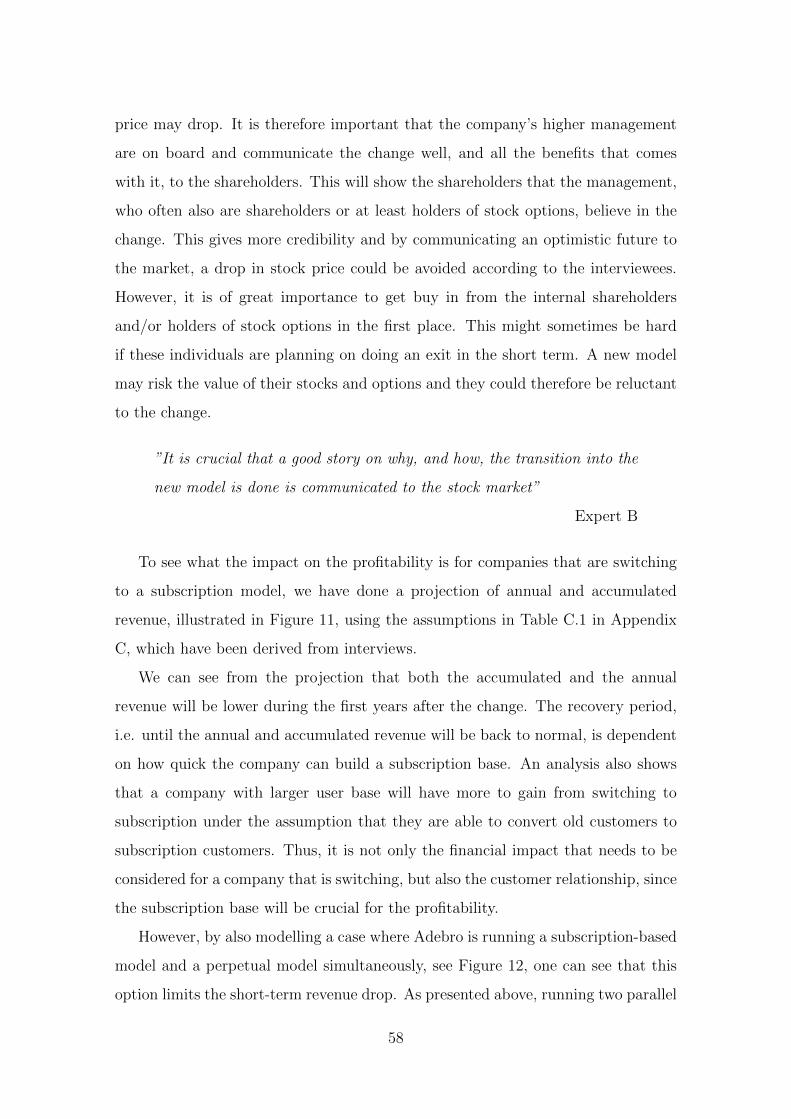
price may drop. It is therefore important that the company’s higher management
are on board and communicate the change well, and all the benefits that comes
with it, to the shareholders. This will show the shareholders that the management,
who often also are shareholders or at least holders of stock options, believe in the
change. This gives more credibility and by communicating an optimistic future to
the market, a drop in stock price could be avoided according to the interviewees.
However, it is of great importance to get buy in from the internal shareholders
and/or holders of stock options in the first place. This might sometimes be hard
if these individuals are planning on doing an exit in the short term. A new model
may risk the value of their stocks and options and they could therefore be reluctant
to the change.
”It is crucial that a good story on why, and how, the transition into the
new model is done is communicated to the stock market”
Expert B
To see what the impact on the profitability is for companies that are switching
to a subscription model, we have done a projection of annual and accumulated
revenue, illustrated in Figure 11, using the assumptions in Table C.1 in Appendix
C, which have been derived from interviews.
We can see from the projection that both the accumulated and the annual
revenue will be lower during the first years after the change. The recovery period,
i.e. until the annual and accumulated revenue will be back to normal, is dependent
on how quick the company can build a subscription base. An analysis also shows
that a company with larger user base will have more to gain from switching to
subscription under the assumption that they are able to convert old customers to
subscription customers. Thus, it is not only the financial impact that needs to be
considered for a company that is switching, but also the customer relationship, since
the subscription base will be crucial for the profitability.
However, by also modelling a case where Adebro is running a subscription-based
model and a perpetual model simultaneously, see Figure 12, one can see that this
option limits the short-term revenue drop. As presented above, running two parallel
58
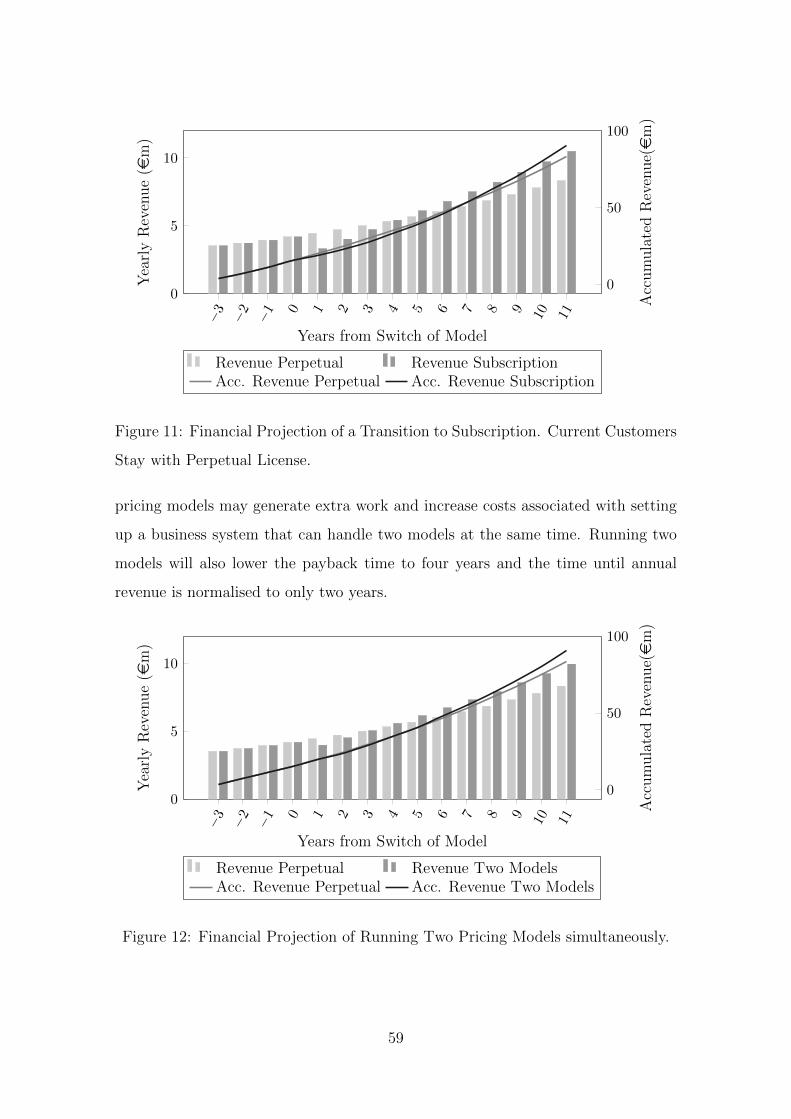
�3 �2 �1 0 1 2 3 4 5 6 7 8 9 10 11
0
5
10
Years from Switch of Model
YearlyRevenue(e
m)
0
50
100
AccumulatedRevenue(em)
Revenue Perpetual Revenue SubscriptionAcc. Revenue Perpetual Acc. Revenue Subscription
Figure 11: Financial Projection of a Transition to Subscription. Current Customers
Stay with Perpetual License.
pricing models may generate extra work and increase costs associated with setting
up a business system that can handle two models at the same time. Running two
models will also lower the payback time to four years and the time until annual
revenue is normalised to only two years.
�3 �2 �1 0 1 2 3 4 5 6 7 8 9 10 11
0
5
10
Years from Switch of Model
YearlyRevenue(e
m)
0
50
100AccumulatedRevenue(em)
Revenue Perpetual Revenue Two ModelsAcc. Revenue Perpetual Acc. Revenue Two Models
Figure 12: Financial Projection of Running Two Pricing Models simultaneously.
59
4.2.4 Autodesk’s Transition to Subscription
Autodesk is a company that makes 3D design software for a various number of
industries. Main focus has been on CAD software but Autodesk has strengthened
its presence in the CAM market by acquiring DELCAM in 2014, making Autodesk
a competitor to Adebro.
On February 4, 2015, Autodesk announced that all of its software o↵erings will
only be available by desktop subscription after 2016. This transition is supposed
to provide their customers with a simpler product management and roll-out experi-
ence. Furthermore, it intends to make it easier for Autodesk to introduce new tools
and technology into the work flow. This will also lower the up-front cost for the
customers as they get an opportunity to pay as you go (Autodesk, Inc. 2015b).
Autodesk is giving customers that purchased a perpetual license before January
31, 2016 or July 31, 2016, dependent on the product, the option to continue their
full usage right. Customers that are on an SMA, will still receive updates and
upgrades during their renewal period, however no major updates will be released
after 2018 (Autodesk, Inc. 2016).
Switching to only subscription will lower revenue that comes from the up-front
investment the customer makes. This will a↵ect revenue negatively in the short-
term, followed by an increase from an expected CAGR of 20% in the number of
subscriptions. On the other hand, the transition to subscription will increase An-
nualised Recurring Revenue (ARR) directly. Furthermore, Autodesk expects their
traditional financial metrics to be normalised by the year of 2020 (Autodesk, Inc.
2015c). See Autodesk’s own projection of revenue and EBIT for the upcoming years
in Figure 13. This projection does not however compare what the revenue would
have been if they kept their old model.
Autodesk has added new metrics that better reflect the new business model in
order to support the transition to subscription. Mainly it is new metrics concern-
ing billings and subscriptions that have been added to the executive o�cers’ cash
incentive programs (Autodesk, Inc. 2015a).
Autodesk has experienced a number of years with rather flat revenue develop-
60
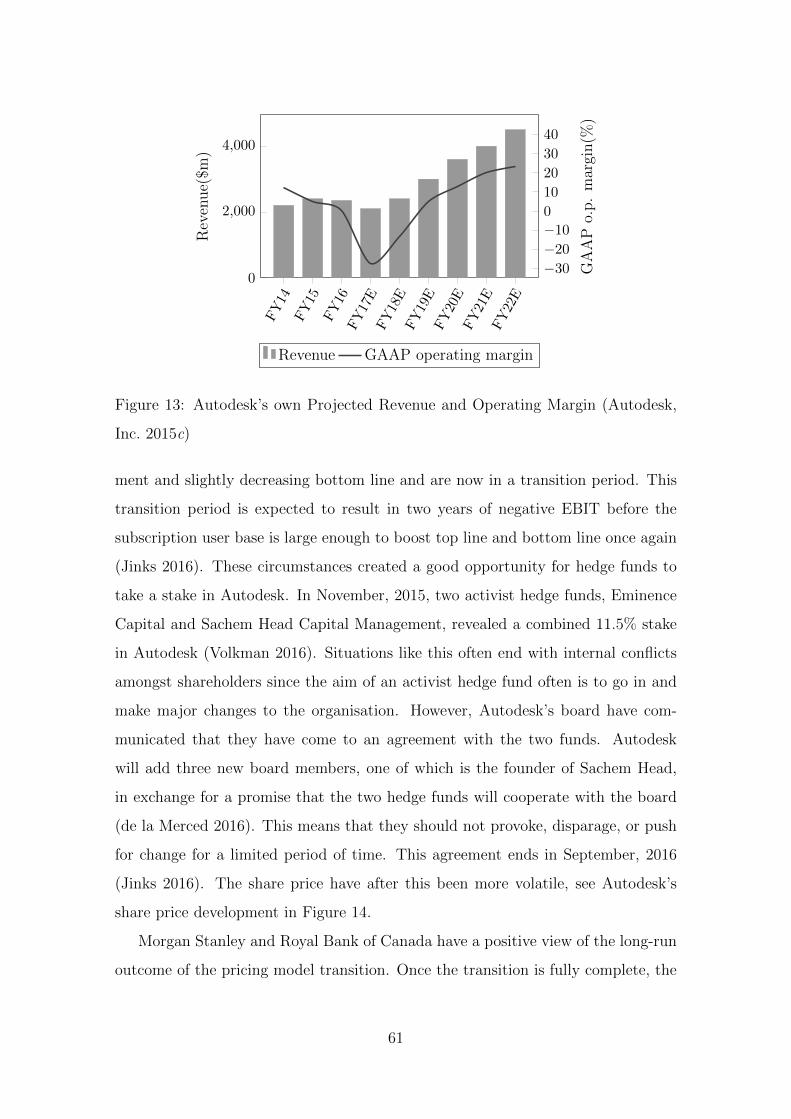
FY14
FY15
FY16
FY17E
FY18E
FY19E
FY20E
FY21E
FY22E
0
2,000
4,000
Revenue(
$m)
�30�20�10010203040
GAAPo.p.margin(%
)
Revenue GAAP operating margin
Figure 13: Autodesk’s own Projected Revenue and Operating Margin (Autodesk,
Inc. 2015c)
ment and slightly decreasing bottom line and are now in a transition period. This
transition period is expected to result in two years of negative EBIT before the
subscription user base is large enough to boost top line and bottom line once again
(Jinks 2016). These circumstances created a good opportunity for hedge funds to
take a stake in Autodesk. In November, 2015, two activist hedge funds, Eminence
Capital and Sachem Head Capital Management, revealed a combined 11.5% stake
in Autodesk (Volkman 2016). Situations like this often end with internal conflicts
amongst shareholders since the aim of an activist hedge fund often is to go in and
make major changes to the organisation. However, Autodesk’s board have com-
municated that they have come to an agreement with the two funds. Autodesk
will add three new board members, one of which is the founder of Sachem Head,
in exchange for a promise that the two hedge funds will cooperate with the board
(de la Merced 2016). This means that they should not provoke, disparage, or push
for change for a limited period of time. This agreement ends in September, 2016
(Jinks 2016). The share price have after this been more volatile, see Autodesk’s
share price development in Figure 14.
Morgan Stanley and Royal Bank of Canada have a positive view of the long-run
outcome of the pricing model transition. Once the transition is fully complete, the
61
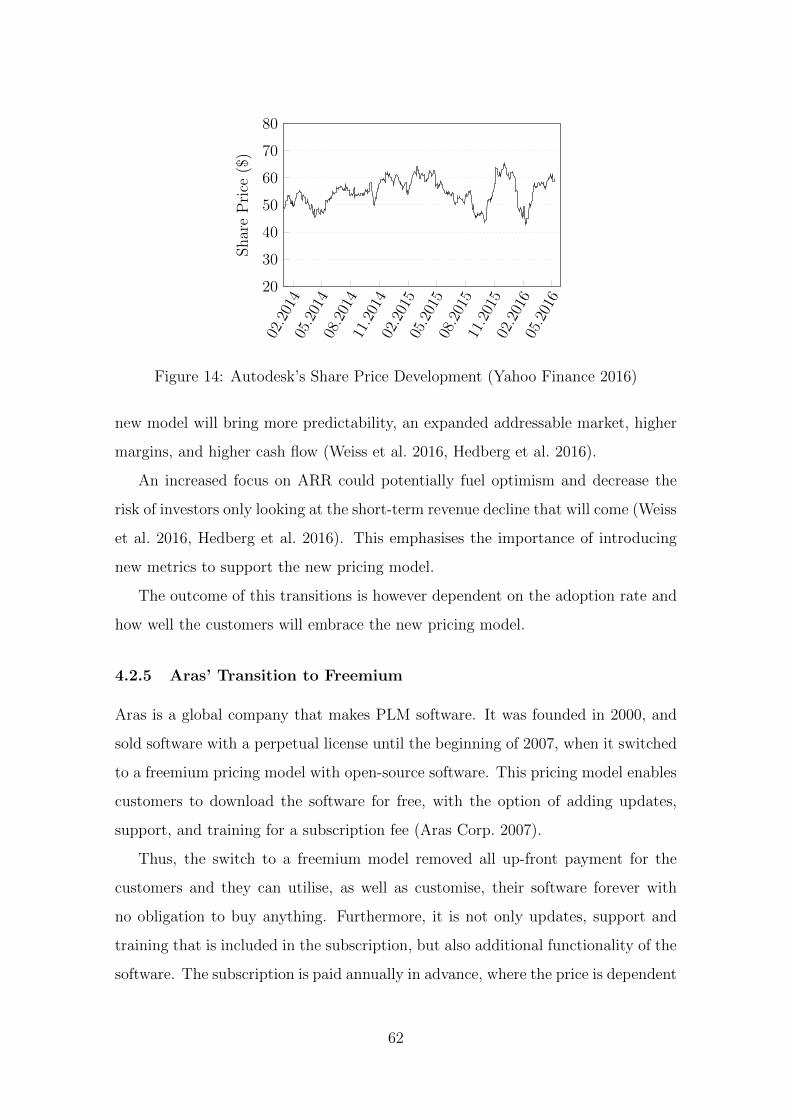
02.2014
05.2014
08.2014
11.2014
02.2015
05.2015
08.2015
11.2015
02.2016
05.2016
20
30
40
50
60
70
80
SharePrice
($)
Figure 14: Autodesk’s Share Price Development (Yahoo Finance 2016)
new model will bring more predictability, an expanded addressable market, higher
margins, and higher cash flow (Weiss et al. 2016, Hedberg et al. 2016).
An increased focus on ARR could potentially fuel optimism and decrease the
risk of investors only looking at the short-term revenue decline that will come (Weiss
et al. 2016, Hedberg et al. 2016). This emphasises the importance of introducing
new metrics to support the new pricing model.
The outcome of this transitions is however dependent on the adoption rate and
how well the customers will embrace the new pricing model.
4.2.5 Aras’ Transition to Freemium
Aras is a global company that makes PLM software. It was founded in 2000, and
sold software with a perpetual license until the beginning of 2007, when it switched
to a freemium pricing model with open-source software. This pricing model enables
customers to download the software for free, with the option of adding updates,
support, and training for a subscription fee (Aras Corp. 2007).
Thus, the switch to a freemium model removed all up-front payment for the
customers and they can utilise, as well as customise, their software forever with
no obligation to buy anything. Furthermore, it is not only updates, support and
training that is included in the subscription, but also additional functionality of the
software. The subscription is paid annually in advance, where the price is dependent
62
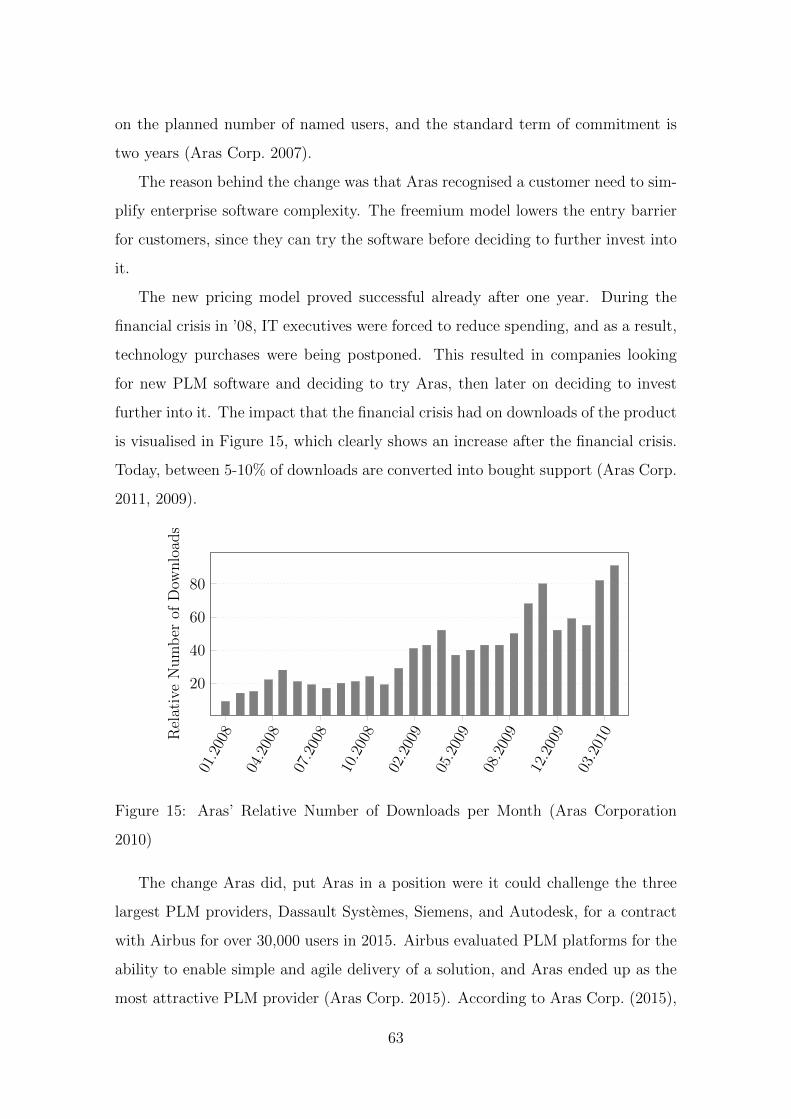
on the planned number of named users, and the standard term of commitment is
two years (Aras Corp. 2007).
The reason behind the change was that Aras recognised a customer need to sim-
plify enterprise software complexity. The freemium model lowers the entry barrier
for customers, since they can try the software before deciding to further invest into
it.
The new pricing model proved successful already after one year. During the
financial crisis in ’08, IT executives were forced to reduce spending, and as a result,
technology purchases were being postponed. This resulted in companies looking
for new PLM software and deciding to try Aras, then later on deciding to invest
further into it. The impact that the financial crisis had on downloads of the product
is visualised in Figure 15, which clearly shows an increase after the financial crisis.
Today, between 5-10% of downloads are converted into bought support (Aras Corp.
2011, 2009).
01.2008
04.2008
07.2008
10.2008
02.2009
05.2009
08.2009
12.2009
03.2010
20
40
60
80
RelativeNumber
ofDow
nload
s
Figure 15: Aras’ Relative Number of Downloads per Month (Aras Corporation
2010)
The change Aras did, put Aras in a position were it could challenge the three
largest PLM providers, Dassault Systemes, Siemens, and Autodesk, for a contract
with Airbus for over 30,000 users in 2015. Airbus evaluated PLM platforms for the
ability to enable simple and agile delivery of a solution, and Aras ended up as the
most attractive PLM provider (Aras Corp. 2015). According to Aras Corp. (2015),
63

coverage of expected scope, open architecture, included services and upgrades, sim-
ple integration, and low total cost of ownership were the main reasons for Airbus to
choose Aras as PLM provider. Thus, it was mainly Aras’ new pricing model that
enabled a win of this contract.
The Vice President of Engineering Solutions at Airbus mentioned that the
unique SaaS subscription business model that Aras o↵er is very compelling since it
eliminates up-front license costs and also includes system upgrades with customi-
sations (Aras Corp. 2015).
4.3 RQ3: What role plays KAM in regards to implementa-
tion and execution of software pricing models?
4.3.1 Connection to the Pricing Model
KAM plays a big role for companies in selling the software and keeping up with
customer relations. It is the KAM organisation that is the company’s contact with
the customer, and it is therefore important to have the KAM aligned with the
pricing model since it is the customer that will be most a↵ected by the pricing
model. KAM is thus an important factor for a company when switching pricing
model.
”KAM is the most crucial factor when it comes to changing a pricing
model”
Expert B
The role of KAM in the pricing model is proportional to the need of customer
interaction with that pricing model. Therefore, a switch to a pricing model that
needs more interaction with the customer will also increase the importance of the
KAM organisation. The KAM organisation will thus need to move to a more
collaborative relationship since customer interaction will happen more frequently.
This is in line with what Adebro strives for today, where Adebro wants to move
from a transactional way of selling to a more collaborative one.
64
We can also see that the key success factors are similar for both a successful
KAM and a successful pricing model, where top management involvement and
understanding of the customers’ business are crucial factors for success. KAM
and the pricing model must therefore, both be aligned with each other to ensure
success, especially since KAM is the function that executes the pricing model in
practice and receives customer opinions.
Furthermore, during the transition period when a vendor is about to switch
pricing model, KAM plays a big role. Interviewed buyers emphasised that KAM
should be present and act as a coach for the customer during the transition period
and explain pricing methodologies in a pedagogical way. Buyers stated the impor-
tance for KAM to get the buyer to understand what they are paying for and why
they are billed a certain amount. Furthermore, the integration and transition could
potentially cause problem for the customer and therefore it is even more important
to have a KAM organisation that fully understands the customer and can be there
as support.
To conclude, KAM comes down to be the customers main channel to interact
with the vendor. The role of KAM can therefore simply be stated as Vendor F said.
”The KAM organisation is the carrier of the message and receiver of
the feedback”
Vendor F
4.3.2 Initiatives to Support a New Pricing Model
The interviewed experts and vendors agreed that there are several factors the KAM
organisation need to consider when a pricing model is changed. They need to
completely understand the new model and all its characteristics, to be able to
answer all questions that the customers may have regarding it.
”It is important for the KAM organisation to understand how they are
selling, otherwise the customer won’t understand it”
Expert E
65
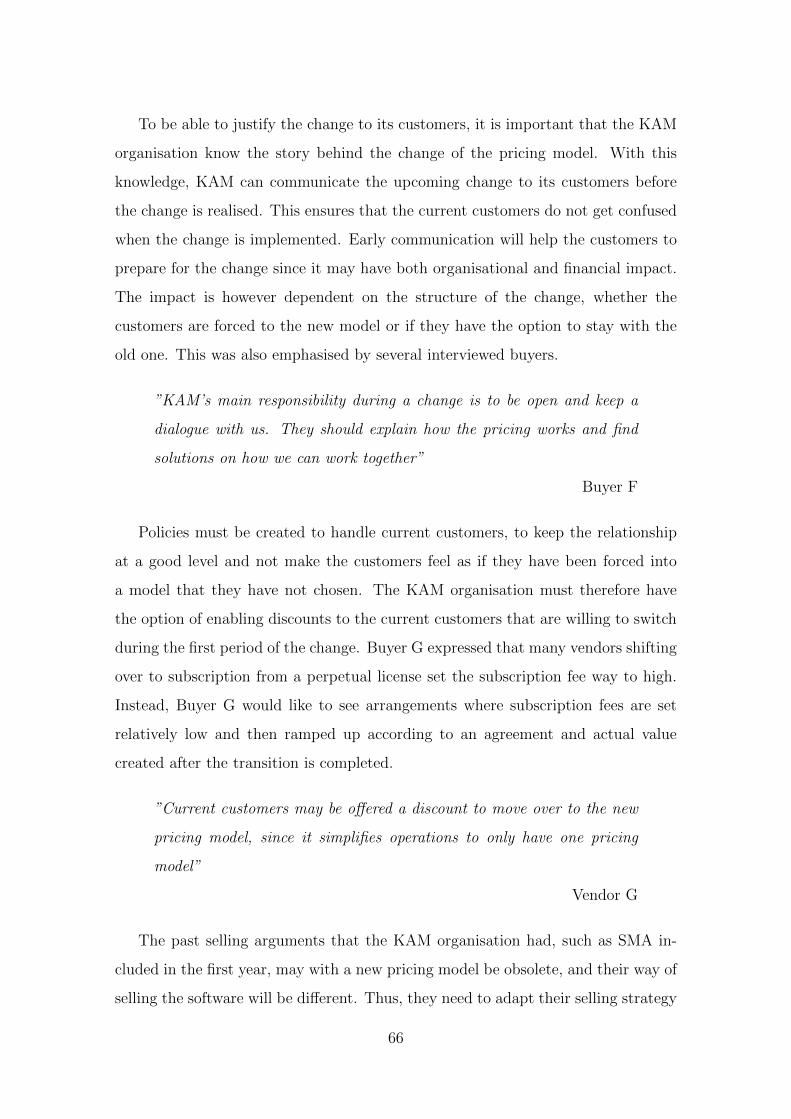
To be able to justify the change to its customers, it is important that the KAM
organisation know the story behind the change of the pricing model. With this
knowledge, KAM can communicate the upcoming change to its customers before
the change is realised. This ensures that the current customers do not get confused
when the change is implemented. Early communication will help the customers to
prepare for the change since it may have both organisational and financial impact.
The impact is however dependent on the structure of the change, whether the
customers are forced to the new model or if they have the option to stay with the
old one. This was also emphasised by several interviewed buyers.
”KAM’s main responsibility during a change is to be open and keep a
dialogue with us. They should explain how the pricing works and find
solutions on how we can work together”
Buyer F
Policies must be created to handle current customers, to keep the relationship
at a good level and not make the customers feel as if they have been forced into
a model that they have not chosen. The KAM organisation must therefore have
the option of enabling discounts to the current customers that are willing to switch
during the first period of the change. Buyer G expressed that many vendors shifting
over to subscription from a perpetual license set the subscription fee way to high.
Instead, Buyer G would like to see arrangements where subscription fees are set
relatively low and then ramped up according to an agreement and actual value
created after the transition is completed.
”Current customers may be o↵ered a discount to move over to the new
pricing model, since it simplifies operations to only have one pricing
model”
Vendor G
The past selling arguments that the KAM organisation had, such as SMA in-
cluded in the first year, may with a new pricing model be obsolete, and their way of
selling the software will be di↵erent. Thus, they need to adapt their selling strategy
66
to the new pricing model, to ensure that it is in line with what the customers are
requiring from the KAM. This also includes how often the KAM interacts with the
customer.
”When changing pricing model, KAM must reconsider their fundamental
way of selling”
Vendor A
When changing their fundamental way of selling, the KAM organisation must
also be prepared to be measured in other ways. When selling perpetual licenses,
KAM success is often measured on the revenue generated from each sale. With a
new type of pricing model, this indicator will be di↵erent since the revenue generated
will not be the same. The interviewees proposed that with a subscription model it
can be good to measure the KAM on the number of sales instead of the generated
revenue. For this new measurement system to work, it is important that the budget
is aligned to that. Hence, it will also be important to change the internal budgeting
of the company.
When a new pricing model is introduced to the KAM organisation, they must
also want to and learn how to sell the new pricing model. Some pricing models
require more collaboration with the customer and thus, the transactional habits of
the KAM organisation must change. To get the KAM and sales people to want
to sell a new pricing model, the incentives must be changed to favour that new
model. This is because sales people often try to maximise their own income and
thus, selling a model that generates better benefits for them is a preference. This
was emphasised by some of the vendors, who mentioned something in line with
Vendor H.
”It is easy to get sales people to sell other pricing models, just change
their compensation plans”
Vendor H
Furthermore, some pricing models can have characteristics that the users are
not so familiar with today, e.g. solutions in the cloud. One of the interviewed
67
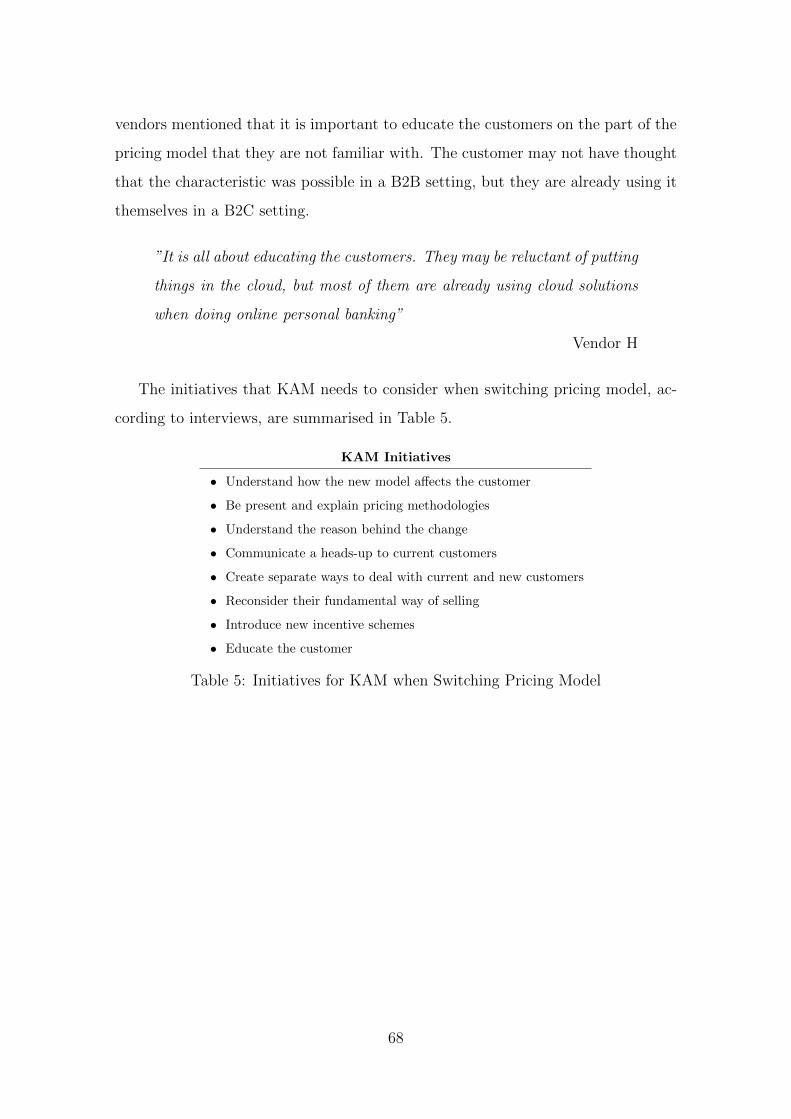
vendors mentioned that it is important to educate the customers on the part of the
pricing model that they are not familiar with. The customer may not have thought
that the characteristic was possible in a B2B setting, but they are already using it
themselves in a B2C setting.
”It is all about educating the customers. They may be reluctant of putting
things in the cloud, but most of them are already using cloud solutions
when doing online personal banking”
Vendor H
The initiatives that KAM needs to consider when switching pricing model, ac-
cording to interviews, are summarised in Table 5.
KAM Initiatives
• Understand how the new model a↵ects the customer
• Be present and explain pricing methodologies
• Understand the reason behind the change
• Communicate a heads-up to current customers
• Create separate ways to deal with current and new customers
• Reconsider their fundamental way of selling
• Introduce new incentive schemes
• Educate the customer
Table 5: Initiatives for KAM when Switching Pricing Model
68
5 Discussion
This chapter discusses how the empirical findings relates to the revised literature. It
highlights and discusses major similarities and discrepancies between the empirical
findings and the literature.
5.1 Value-Based Price Setting
Our findings point to the conclusion of a widely spread use of competition-based
price setting in Adebro’s organisation. Especially for GD&T and CAM software,
prices have been pushed down by the competitors, since price is still one of the most
important KPC for the buyer. Furthermore, Kittlaus & Clough (2009) emphasise
that the software market in general is highly competitive with high innovation and
adoption speed, which lowers entry barriers. This has led to much of the business
being won by having the best price. However, for the SPC software o↵ered by
Adebro, our findings point to a more value-based price setting since there is a lack
of competitors that can push down the prices. Thus, price itself, and competition-
based pricing, can generate a lot of value for the customers. Therefore, competition-
based pricing might be considered as value-based pricing in the end. But on the
other hand, generating as much value as possible is not the goal with value-based
pricing. The goal is to set the price according to what the value is, according to
the customer.
Empirical findings suggest that it is easier to be value-based in the pricing pro-
cess when there is a lack of competition. This is especially clear in the B2B software
market for two reasons. First, since the marginal cost of selling an extra license of
a software is almost negligible, it becomes easy and tempting for a competitor to
lower the price in order to win business (Cusumano 2008, Choi et al. 1997, Bontis &
Chung 2000, Baur et al. 2014). This phenomenon is not as clear for physical prod-
ucts, since they have a clear break even point, which individual software licences
do not have. Second, findings from interviews suggest that it is more di�cult to
compare two software products than comparing two physical products. A physical
product may have specifications and characteristics that make it easier for a cus-
69
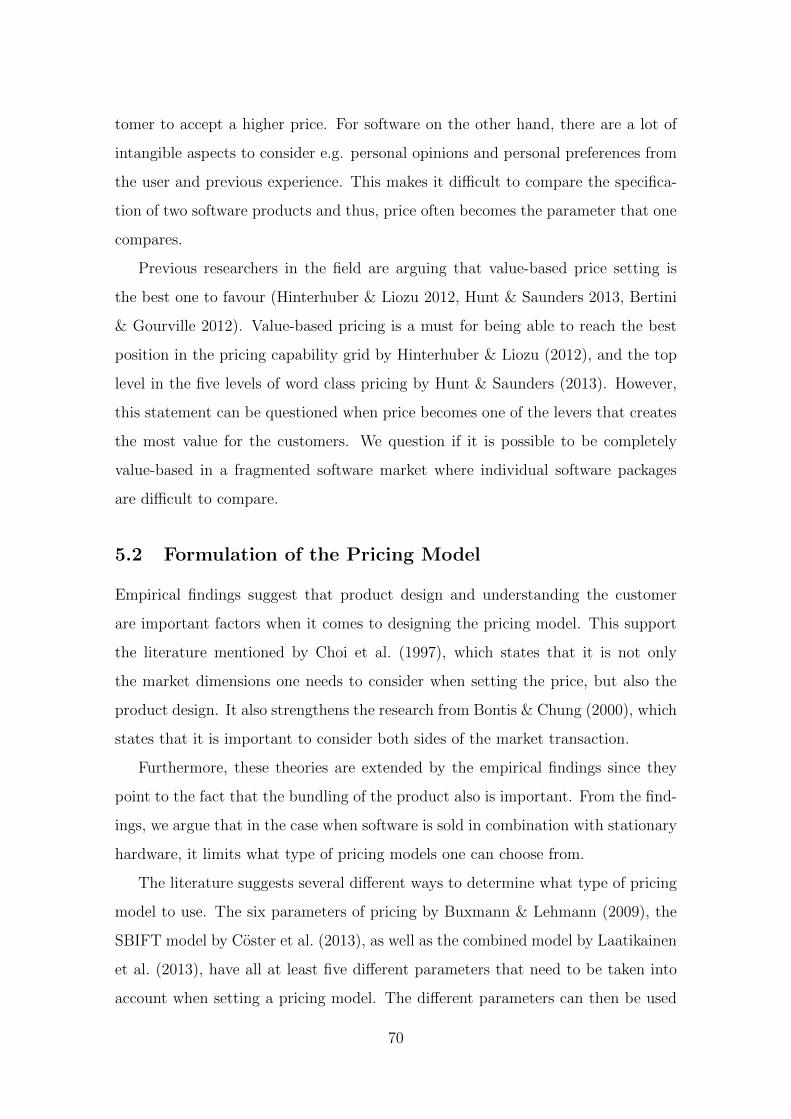
tomer to accept a higher price. For software on the other hand, there are a lot of
intangible aspects to consider e.g. personal opinions and personal preferences from
the user and previous experience. This makes it di�cult to compare the specifica-
tion of two software products and thus, price often becomes the parameter that one
compares.
Previous researchers in the field are arguing that value-based price setting is
the best one to favour (Hinterhuber & Liozu 2012, Hunt & Saunders 2013, Bertini
& Gourville 2012). Value-based pricing is a must for being able to reach the best
position in the pricing capability grid by Hinterhuber & Liozu (2012), and the top
level in the five levels of word class pricing by Hunt & Saunders (2013). However,
this statement can be questioned when price becomes one of the levers that creates
the most value for the customers. We question if it is possible to be completely
value-based in a fragmented software market where individual software packages
are di�cult to compare.
5.2 Formulation of the Pricing Model
Empirical findings suggest that product design and understanding the customer
are important factors when it comes to designing the pricing model. This support
the literature mentioned by Choi et al. (1997), which states that it is not only
the market dimensions one needs to consider when setting the price, but also the
product design. It also strengthens the research from Bontis & Chung (2000), which
states that it is important to consider both sides of the market transaction.
Furthermore, these theories are extended by the empirical findings since they
point to the fact that the bundling of the product also is important. From the find-
ings, we argue that in the case when software is sold in combination with stationary
hardware, it limits what type of pricing models one can choose from.
The literature suggests several di↵erent ways to determine what type of pricing
model to use. The six parameters of pricing by Buxmann & Lehmann (2009), the
SBIFT model by Coster et al. (2013), as well as the combined model by Laatikainen
et al. (2013), have all at least five di↵erent parameters that need to be taken into
account when setting a pricing model. The di↵erent parameters can then be used
70

to form lots of di↵erent pricing models. However, all interviews came down to a
discussion regarding the parameter of payment structure, if it should be a subscrip-
tion or a perpetual model. Thus, the models from Buxmann & Lehmann (2009)
and Coster et al. (2013) may be too holistic, since they try to cover software pricing
models in every spectrum of the software industry. Furthermore, when Laatikainen
et al. (2013) merged the two models together to specify a model fitted into a cloud
solutions environment, they managed to complicate the pricing process. Addition-
ally, in the literature, there is no discussion regarding the weighting of the di↵erent
pricing parameters compared to each other. Thus, there exist a risk that companies
using the mentioned models are focusing too little on the structure of the payment
flow, which the empirical findings suggest is the most important parameter for the
customer.
5.2.1 Structure of Payment Flow
There seems to be some misconceptions concerning the financial implications when
switching the pricing model and then further invest into the business. The liter-
ature from Gruman et al. (2012) states that subscription-based payment models
will decrease investment into the business, since it will decrease the cash available
to the company compared to a up-front payment model. However, the research
of Vidyanand (2007) states that recurring revenue from a subscription model will
increase incentives to invest further into the business. The decreased availability
of cash in a subscription model that Gruman et al. (2012) mention, contradicts
the financial projections from the findings, where a subscription-based model actu-
ally will generate more cash available in the long term. One can therefore argue
that Gruman et al. (2012) only think of the short-term implications, and not the
implications that come in the long-term.
Although the literature of Gruman et al. (2012) and Vidyanand (2007) are
inconsistent in what type of pricing model generates the most investment into the
business, they both agree that the quality for the customer will be better with their
respective choice of pricing model. However, this conflicts with the interviews, who
all were convinced that the choice of pricing model will in no way a↵ect the quality
71
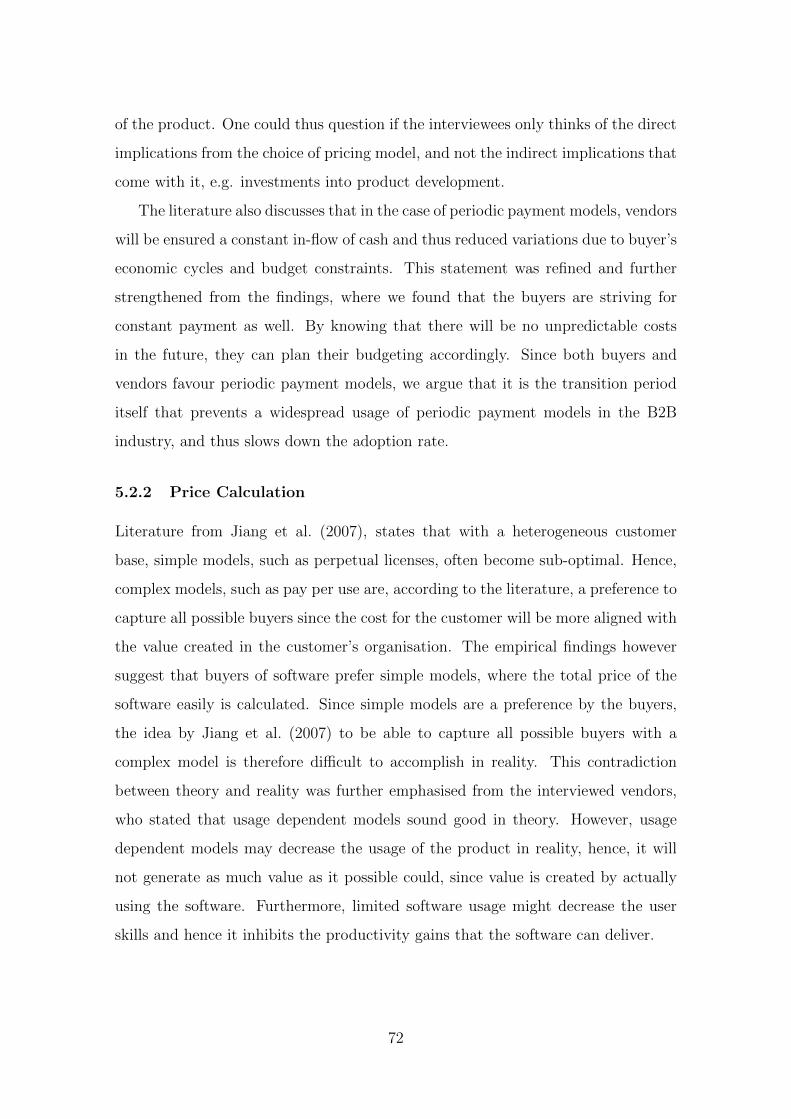
of the product. One could thus question if the interviewees only thinks of the direct
implications from the choice of pricing model, and not the indirect implications that
come with it, e.g. investments into product development.
The literature also discusses that in the case of periodic payment models, vendors
will be ensured a constant in-flow of cash and thus reduced variations due to buyer’s
economic cycles and budget constraints. This statement was refined and further
strengthened from the findings, where we found that the buyers are striving for
constant payment as well. By knowing that there will be no unpredictable costs
in the future, they can plan their budgeting accordingly. Since both buyers and
vendors favour periodic payment models, we argue that it is the transition period
itself that prevents a widespread usage of periodic payment models in the B2B
industry, and thus slows down the adoption rate.
5.2.2 Price Calculation
Literature from Jiang et al. (2007), states that with a heterogeneous customer
base, simple models, such as perpetual licenses, often become sub-optimal. Hence,
complex models, such as pay per use are, according to the literature, a preference to
capture all possible buyers since the cost for the customer will be more aligned with
the value created in the customer’s organisation. The empirical findings however
suggest that buyers of software prefer simple models, where the total price of the
software easily is calculated. Since simple models are a preference by the buyers,
the idea by Jiang et al. (2007) to be able to capture all possible buyers with a
complex model is therefore di�cult to accomplish in reality. This contradiction
between theory and reality was further emphasised from the interviewed vendors,
who stated that usage dependent models sound good in theory. However, usage
dependent models may decrease the usage of the product in reality, hence, it will
not generate as much value as it possible could, since value is created by actually
using the software. Furthermore, limited software usage might decrease the user
skills and hence it inhibits the productivity gains that the software can deliver.
72
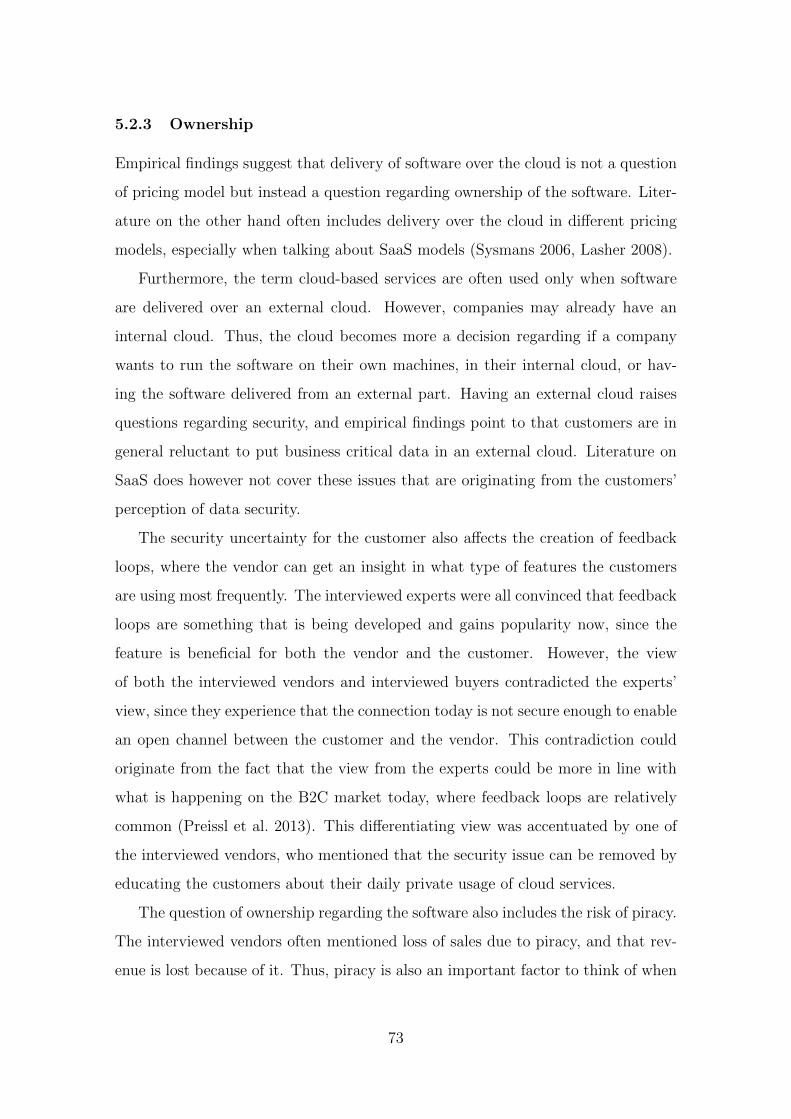
5.2.3 Ownership
Empirical findings suggest that delivery of software over the cloud is not a question
of pricing model but instead a question regarding ownership of the software. Liter-
ature on the other hand often includes delivery over the cloud in di↵erent pricing
models, especially when talking about SaaS models (Sysmans 2006, Lasher 2008).
Furthermore, the term cloud-based services are often used only when software
are delivered over an external cloud. However, companies may already have an
internal cloud. Thus, the cloud becomes more a decision regarding if a company
wants to run the software on their own machines, in their internal cloud, or hav-
ing the software delivered from an external part. Having an external cloud raises
questions regarding security, and empirical findings point to that customers are in
general reluctant to put business critical data in an external cloud. Literature on
SaaS does however not cover these issues that are originating from the customers’
perception of data security.
The security uncertainty for the customer also a↵ects the creation of feedback
loops, where the vendor can get an insight in what type of features the customers
are using most frequently. The interviewed experts were all convinced that feedback
loops are something that is being developed and gains popularity now, since the
feature is beneficial for both the vendor and the customer. However, the view
of both the interviewed vendors and interviewed buyers contradicted the experts’
view, since they experience that the connection today is not secure enough to enable
an open channel between the customer and the vendor. This contradiction could
originate from the fact that the view from the experts could be more in line with
what is happening on the B2C market today, where feedback loops are relatively
common (Preissl et al. 2013). This di↵erentiating view was accentuated by one of
the interviewed vendors, who mentioned that the security issue can be removed by
educating the customers about their daily private usage of cloud services.
The question of ownership regarding the software also includes the risk of piracy.
The interviewed vendors often mentioned loss of sales due to piracy, and that rev-
enue is lost because of it. Thus, piracy is also an important factor to think of when
73
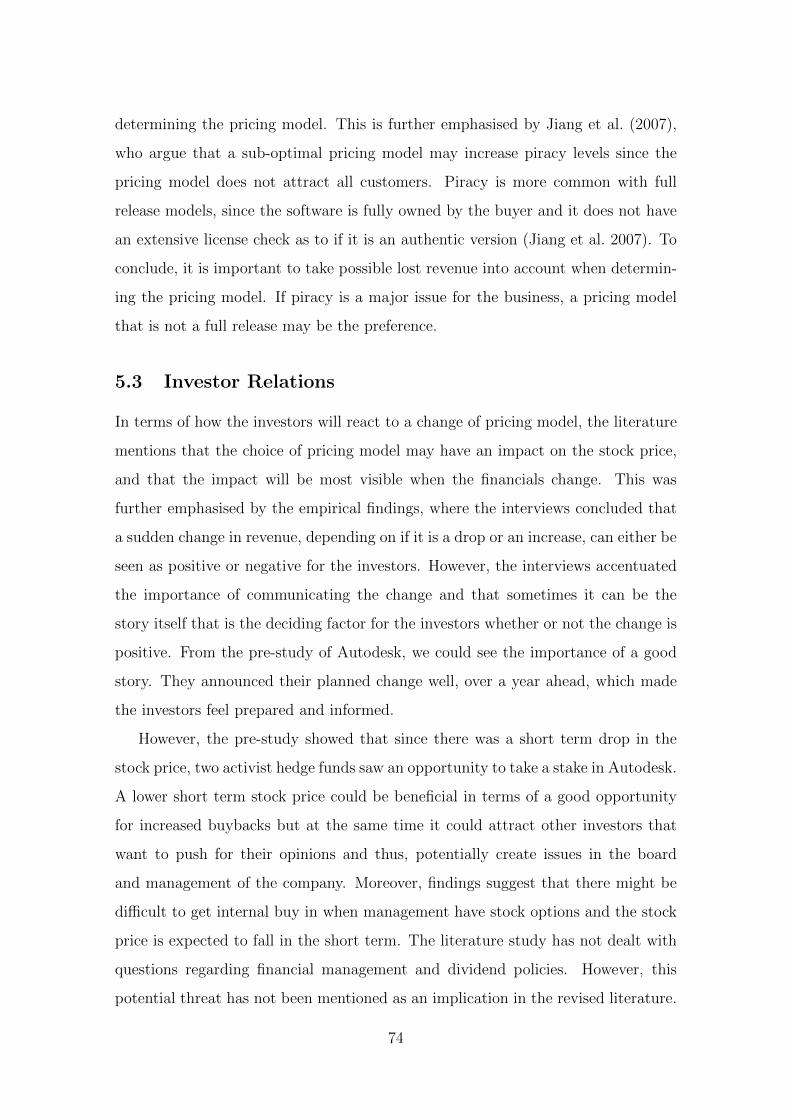
determining the pricing model. This is further emphasised by Jiang et al. (2007),
who argue that a sub-optimal pricing model may increase piracy levels since the
pricing model does not attract all customers. Piracy is more common with full
release models, since the software is fully owned by the buyer and it does not have
an extensive license check as to if it is an authentic version (Jiang et al. 2007). To
conclude, it is important to take possible lost revenue into account when determin-
ing the pricing model. If piracy is a major issue for the business, a pricing model
that is not a full release may be the preference.
5.3 Investor Relations
In terms of how the investors will react to a change of pricing model, the literature
mentions that the choice of pricing model may have an impact on the stock price,
and that the impact will be most visible when the financials change. This was
further emphasised by the empirical findings, where the interviews concluded that
a sudden change in revenue, depending on if it is a drop or an increase, can either be
seen as positive or negative for the investors. However, the interviews accentuated
the importance of communicating the change and that sometimes it can be the
story itself that is the deciding factor for the investors whether or not the change is
positive. From the pre-study of Autodesk, we could see the importance of a good
story. They announced their planned change well, over a year ahead, which made
the investors feel prepared and informed.
However, the pre-study showed that since there was a short term drop in the
stock price, two activist hedge funds saw an opportunity to take a stake in Autodesk.
A lower short term stock price could be beneficial in terms of a good opportunity
for increased buybacks but at the same time it could attract other investors that
want to push for their opinions and thus, potentially create issues in the board
and management of the company. Moreover, findings suggest that there might be
di�cult to get internal buy in when management have stock options and the stock
price is expected to fall in the short term. The literature study has not dealt with
questions regarding financial management and dividend policies. However, this
potential threat has not been mentioned as an implication in the revised literature.
74

5.4 The Role of KAM
Findings from interviews suggest that KAM has a very prominent role in terms
of implementation and execution of pricing models or pricing strategy in general.
However, even if we argue that KAM’s role is of great importance for a successful
transition, there is a lack of previous research on this topic. We have however found
a lot of similarities between key success factors for both KAM and pricing models.
Empirical findings suggest that top management involvement is crucial in order
to, not only be able to start a pricing model transition, but also to succeed with the
transition. If top management are involved and are promoting the story behind the
change, then it may become easier to communicate the story to the shareholders
in a convincing and authentic way. Findings further suggest that top management
involvement is also crucial for the KAM organisation. This is in line with, and
supports the theories concerning key success factors for both pricing models and
KAM, presented by Abratt & Kelly (2002), Hinterhuber & Liozu (2012), Hunt &
Saunders (2013) and Napolitano (1997).
Moreover, understanding the customers’ business has, from the interviews, been
pointed out as one of the most important key success factors for both pricing models
and KAM. Abratt & Kelly (2002) argue that vendors and buyers have the same
perception of key success factors for KAM. We can conclude that our findings
strengthen this proposition by Abratt & Kelly (2002).
The similarities of key success factors for both KAM and pricing models are
clear, but the relationship is still vague. However, in order to succeed with a
pricing model, one needs to have a KAM or a sales team that are on board and can
communicate and work with this model. Otherwise the risk for failure is increased.
If there is no pricing model that is aligned with the customers’ business, or there is
a model that the customer will not accept, then KAM will find it di�cult to move
forward and do a good job. Therefore, we argue that KAM and pricing model must
support each other and work together to be successful.
75

5.5 Sustainability
Software pricing and KAM connected to software have no direct a↵ect on the envi-
ronment since the product itself is intangible. However, sustainability is much more
than just the environment. Social and economic sustainability are also important
to consider.
From an economic point of view, subscription-based pricing models may be more
sustainable for vendors in the future due to lower uncertainties and more constant
cash flows. This will reduce complexity in the process of planning the business, and
the waste due to this complexity.
Socially, a flourishing business will most likely nurture the community it serves.
It will o↵er job opportunities, contribute with tax, and create demand that feeds
other suppliers. In this way, certain pricing models may be more socially sustainable
since they are more profitable and secure in the long run.
Finally, the choice of pricing model can be one of the factors for a company to
survive and flourish during certain macroeconomic conditions. This statement is
supported by our analysis of Aras’ transition to freemium.
76
6 Conclusion
This chapter concludes the research by answering the research questions and dis-
cusses how the research contributes to knowledge. Furthermore, it discusses the
limitations of the research together with recommendations regarding future research
to expand the field of knowledge.
6.1 Connection to Research Questions
The purpose of the thesis has been to investigate and compare software pricing
models in a B2B setting and describe how KAM plays a role in executing a pricing
model. This purpose has been fulfilled by interviewing in total 35 di↵erent buyers,
vendors, and experts. The research theme was divided into three research questions
RQ1, RQ2, and RQ3. The answers to these research questions together answer the
overall research theme — How should Adebro structure its pricing model/s for the
software packages?
6.1.1 RQ1: What software pricing models are attractive for Adebro
in terms of internal capabilities, market trends, and customer
preferences?
Perpetual license is, and will continue to be, an attractive pricing model for Adebro’s
current o↵erings, due to its simplicity, current IT architecture, and sales strategy.
However, a subscription-based usage independent pricing model is also attractive,
and will become even more attractive over time, due to its flexibility and low up-
front cost for the customer.
For GD&T software, the perpetual model will continue to be the most attractive
one since the product is not sold as a software itself. The SPC o↵ering has today
such prominent market position that a pricing model change could be done easier
since customers are limited in regards to substitutes. Therefore, subscription will be
more attractive to Adebro’s SPC o↵ering since it generates more recurring revenue.
Furthermore, CAM customers are more keen to be project driven and thus, a flexible
model like a subscription-based one, will create extra value for the customers.
77
6.1.2 RQ2: What are the implications of switching pricing model?
The largest implications for Adebro would occur if they change to subscription-
based pricing models. Depending on how the transition is handled, the implications
will vary, but we can see that revenue would take a big hit during the transition
period. The short-term revenue drop may impact investors, which could lead to a
drop in share price, which will most likely be recovered by the increased recurring
revenue over the upcoming years. However, running a subscription-based model
and a perpetual model simultaneously may lower the short-term revenue drop sig-
nificantly. This may on the other hand generate extra work and increased costs
associated with setting up a business system that can handle two pricing models.
Moreover, to support the new model, there will be a need for new financial
metrics and sales incentives in the organisation. Furthermore, the distribution
network must be prepared for the change since they will be a↵ected to the same
degree as Adebro.
6.1.3 RQ3: What role plays KAM in regards to implementation and
execution of software pricing models?
KAM plays a big role in implementing and executing software pricing models since
the KAM organisation is responsible for the customer interaction. Understanding
of the customers’ business is a key success factor for both KAM and pricing models
and thus, they should be structured to support each other.
To support a new pricing model, KAM needs to consider several factors to
prepare both the customer, as well as internally, for the change. Two crucial factors
are that the KAM needs to understand that they may be measured in di↵erent ways,
as well as they need to communicate a heads-up of the change to current customers.
Thus, KAM and pricing models must exist to support each other in a more of a
symbiotic relationship.
78
6.1.4 How should Adebro structure its pricing model/s for the software
packages?
Subscription will be requested more often from the customers and Adebro should
therefore start using a subscription-based pricing model for the software o↵erings.
However, since perpetual licenses still will be attractive for some customers, Ade-
bro should o↵er that model as well. Thus, by operating these two pricing models
simultaneously it may generate a competitive advantage since customers are given
a choice to decide what pricing model that fits them. Moreover, it is important for
Adebro to communicate to its customers what the pricing model looks like, what
choice customers have, and how the pricing methodology works. In this process,
KAM has a significant role to play.
6.2 Contribution to Science
The thesis contributes both theoretically and managerially to the science by pro-
viding research on software pricing models for manufacturing related software.
From a theoretical perspective, we argue that the current market landscape
of manufacturing related software is moving towards subscription-based models,
however, perpetual licenses will not disappear and will continue to play an important
role for several players in the market. To add to the theory, we have found that the
parameters in the models presented by Buxmann & Lehmann (2009), Coster et al.
(2013), and Laatikainen et al. (2013) have di↵erent weighting of importance when
talking to the customers, who mostly focus on the structure of payment flow.
Furthermore, we have contributed with theoretical knowledge on how to price
software that are bundled with hardware, where we have come to the conclusion
that di↵erentiated pricing models for the hardware and software is not preferable.
We have also added new theoretical insights on how KAM is aligned to the pricing
model, where we have seen that neither KAM nor pricing model can be successful
without each other, which especially is important when implementing a new pricing
model.
From a managerial perspective, we have found that there is a certain set of
79
initiatives that KAM can take to support a new pricing model. These initiatives
widen the the research of Napolitano (1997), who highlighted the advantages of
an implemented KAM program. The findings of the study also contribute to the
managerial perspective by narrowing down the number of pricing models that are a
fit to metrology related software, where we have seen that complex models should
not be used too extensively.
Lastly, we have also contributed to science by highlighting that the academic
paradigms di↵er from the business paradigm regarding the cloud technology in the
B2B software industry, in which academia believes the transition to cloud-based
services is happening quicker than business is allowing it to. This discrepancy can
be explained by the delimitation of only looking into the B2B industry, and that
most academics may be influenced by the B2C industry.
6.3 Limitations and Further Research
The aim of the research has been to identify possibilities to gain competitive ad-
vantage through the choice of pricing model. By interviewing buyers, vendors, and
experts we have managed to identify possibilities for Adebro to improve its pricing
and thus, gain competitive advantage in the long run. However, findings presented
are limited due the chosen approach and methodology with a case study. Findings
presented in this study are only generalisable in a certain set of circumstances and
for companies operating in a similar environment with similar operations as Adebro,
therefore the external validity is considered to be rather low in the end.
Since interviews have been semi-structured it has been di�cult to get exact and
comparable findings from all interviewees. Some interviewees had more knowledge
and experience concerning software pricing which have led to that the dept of dis-
cussion been far greater in some interviews. During some of the interviews, we felt
that interviewees had di↵erent time-horizons in their answers. One group, a group
of more operational interviewees, had a more short-term perspective and talked
more about direct consequences. The other group, mainly consistent of experts and
strategic personnel, were more long-term and discussed indirect consequences. It
has been di�cult to get all interviewees to reach the same depth without steering
80
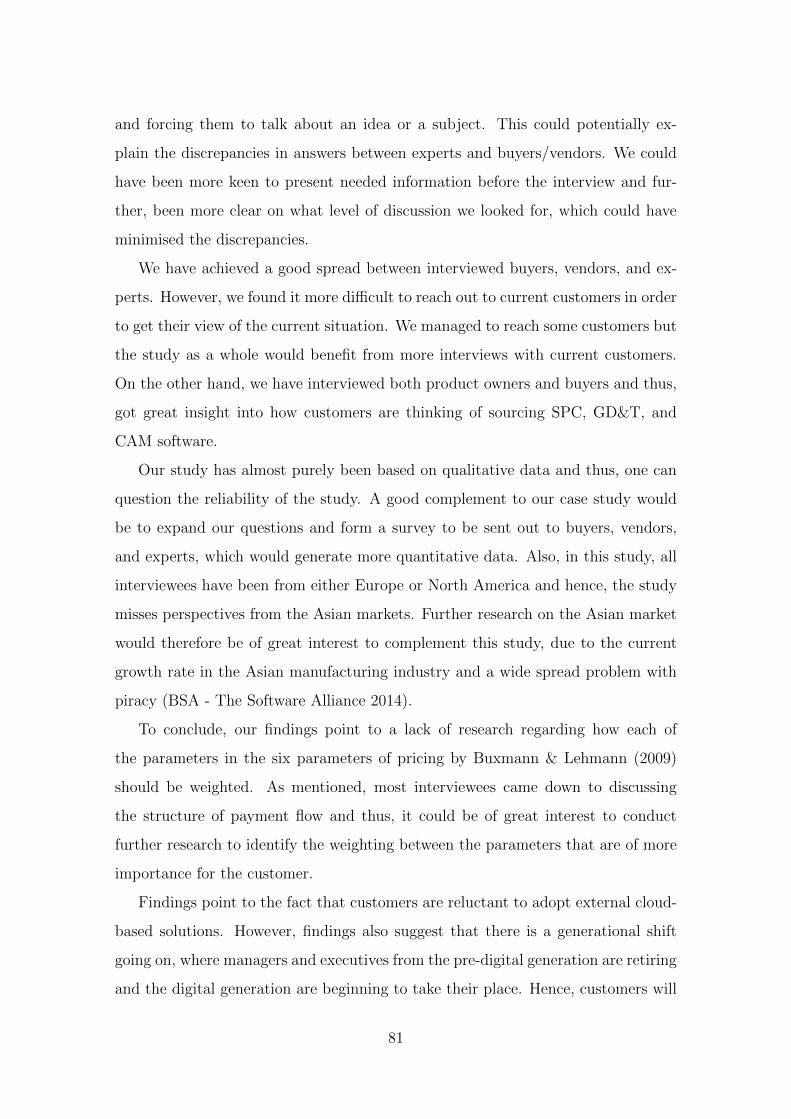
and forcing them to talk about an idea or a subject. This could potentially ex-
plain the discrepancies in answers between experts and buyers/vendors. We could
have been more keen to present needed information before the interview and fur-
ther, been more clear on what level of discussion we looked for, which could have
minimised the discrepancies.
We have achieved a good spread between interviewed buyers, vendors, and ex-
perts. However, we found it more di�cult to reach out to current customers in order
to get their view of the current situation. We managed to reach some customers but
the study as a whole would benefit from more interviews with current customers.
On the other hand, we have interviewed both product owners and buyers and thus,
got great insight into how customers are thinking of sourcing SPC, GD&T, and
CAM software.
Our study has almost purely been based on qualitative data and thus, one can
question the reliability of the study. A good complement to our case study would
be to expand our questions and form a survey to be sent out to buyers, vendors,
and experts, which would generate more quantitative data. Also, in this study, all
interviewees have been from either Europe or North America and hence, the study
misses perspectives from the Asian markets. Further research on the Asian market
would therefore be of great interest to complement this study, due to the current
growth rate in the Asian manufacturing industry and a wide spread problem with
piracy (BSA - The Software Alliance 2014).
To conclude, our findings point to a lack of research regarding how each of
the parameters in the six parameters of pricing by Buxmann & Lehmann (2009)
should be weighted. As mentioned, most interviewees came down to discussing
the structure of payment flow and thus, it could be of great interest to conduct
further research to identify the weighting between the parameters that are of more
importance for the customer.
Findings point to the fact that customers are reluctant to adopt external cloud-
based solutions. However, findings also suggest that there is a generational shift
going on, where managers and executives from the pre-digital generation are retiring
and the digital generation are beginning to take their place. Hence, customers will
81

most likely become more keen to adopt external cloud services in the near future.
Further research could therefore be done by mapping the generational shift and
investigate how it a↵ects the speed of adoption for external cloud-based services in
the B2B market.
6.4 Final Words
This research has been both an interesting journey and a learning experience for
us. We have increased our knowledge, not only in the field of software pricing and
KAM, but also in self-development and people management due to the interaction
with interviewees in the field. We also hope that our thesis will encourage other
researchers and students to pursue further research in the field of software pricing
and KAM.
To conclude, the choice of pricing model for software products is a complex pro-
cedure. However, it mostly comes down to how the pricing model is communicated
to the customers, and not what the literature and many companies mainly focus on
— how the pricing model is set up.
Finally, we would like to end by stating that rethinking ones pricing models is,
and will continue to be, a powerful source of competitive advantage for companies.
82

References
Abratt, R. & Kelly, P. M. (2002), ‘Customer-supplier Partnerships Perceptions of
a Successful KAM Program’, Industrial Marketing Management .
Aiken, C. & Keller, S. (2007), ‘The CEO’s role in leading transformation’, McKinsey
Insights and Publications .
Aras Corp. (2007), ‘Aras delivers microsoft-based open source enter-
prise solutions’, http://www.aras.com/news/ViewNewsItem.aspx?name=
Aras-Delivers-Microsoft-Based-Open-Source-Enterprise-PLM. Accessed:
2016-03-07.
Aras Corp. (2009), ‘Plm licensing must change’, http://www.aras.
com/Community/blogs/aras_corporate_blog/archive/2009/06/03/
plm-licensing-must-change.aspx. Accessed: 2016-03-07.
Aras Corp. (2011), ‘Understanding the economic advantages
of enterprise open source in plm’, http://www.aras.com/
Community/blogs/aras_corporate_blog/archive/2011/01/28/
understanding-the-economic-advantages-of-enterprise-open-source-in-plm.
aspx. Accessed: 2016-03-07.
Aras Corp. (2015), ‘Airbus and aras sign strategic partner agreement to use aras
innovator for enterprise-wide engineering business processes beyond 30,000 users’,
http://www.aras.com/news. Accessed: 2016-03-07.
Aras Corporation (2010), ‘Aras community event, 2010 international conference’.
Autodesk, Inc. (2015a), ‘Annual report fiscal year 2015’, http://investors.
autodesk.com/phoenix.zhtml?c=117861&p=irol-reportsAnnual. Accessed:
2016-03-18.
Autodesk, Inc. (2015b), ‘Autodesk details subscription transition for new
software licenses’, http://news.autodesk.com/press-release/archived/
autodesk-details-subscription-transition-new-software-licenses.
Accessed: 2016-03-17.
Autodesk, Inc. (2015c), ‘Driving transition and shareholder value’, http://
investors.autodesk.com/phoenix.zhtml?c=117861&p=irol-EventDetails&
83
EventId=5200180. Accessed: 2016-03-18.
Autodesk, Inc. (2016), ‘Perpetual license changes’, http://autodesk.com/
products/perpetual-licenses. Accessed: 2016-03-17.
Baur, A. W., Genova, A. C., Buhler, J. & Bick, M. (2014), ‘Customer is King? A
Framework to Shift from Cost-to Value-Based Pricing in Software as a Service:
The Case of Business Intelligence Software’, Digital Services and Information
Intelligence .
Bell, E. & Bryman, A. (2007), ‘The ethics of management research’, British Journal
of Management .
Bertini, M. & Gourville, J. (2012), ‘Pricing to create shared value’, Harvard business
review .
Blomkvist, P. & Hallin, A. (2015), Method for Engineering Students, Studentlitter-
atur.
Bonoma, T. (1985), ‘Case research in marketing: Opportunities, problems and a
process’, Journal of marketing research .
Bontis, N. & Chung, H. (2000), ‘The evolution of software pricing: from box licenses
to application service provider models’, Internet Research: Electronic Networking
Applications and Policy .
Bragg, A. (1982), ‘National Account Managers to the Rescue’, Sales & Marketing
Management .
BSA - The Software Alliance (2014), ‘The Compliance Gap: BSA Global Software
Survey’.
Buxmann, P. & Lehmann, S. (2009), ‘Pricing strategies of software vendors’, Busi-
ness and information systems engineering .
Choi, S., Stahl, D. & Whinston, A. (1997), The economics of electronic commerce:
The essential of doing business in the electronic marketplace, Macmillan, Indi-
anapolis, US.
Christiano, M. (1997), ‘License Management System for Software Applications’,
United States Patent .
Collis, J. & Hussey, R. (2014), Business Research: A practical guide for undergrad-
uate and postgraduate students, 4th ed., Palgrave Macmillan.
84

Cusumano, M. (2008), ‘The Changing Software Business: Moving from Products
to Services’, IEEE Computer Society, Massachusetts Institute of Technology .
Coster, M., Iveroth, E., Westelius, A., Petri, C.-J., Olve, N.-G. & Nilsson, F. (2013),
‘How to di↵erentiate by price: Proposal for a five-dimensional model’, European
Management Journal .
de la Merced, M. J. (2016), ‘Autodesk chooses peace with activist in-
vestors’, http://www.nytimes.com/2016/03/12/business/dealbook/
autodesk-chooses-peace-with-activist-investors.html?_r=0. Accessed:
2016-04-27.
Duhon, B. (2007), ‘Software as a Service: Why buy when you can rent?’, AIIM
E-doc magazine .
Easterby-Smith, M., Thorpe, R. & Jackson, P. (2012), Management research,
SAGE, London, UK.
Eisenhardt, K. (1989), ‘Building theories from case study research’, Academy of
Management Review .
Ferrante, D. (2006), ‘Software licensing models: What’s out there?’, IT Pro .
Gibbert, M., Ruigrok, W. & Wicki, B. (2008), ‘What passes as a rigorous case
study?’, Strategic management journal .
Gosselin, D.-P. & Heene, A. (2000), ‘A Competence-Based Analysis of Key account
management: Implications for a Customer-Focused Organization’, Proceedings of
the Fifth International Conference on Competence Based Management .
Greschler, D. & Mangan, T. (2002), ‘Networking Lessons in Delivering Software as
a Service.’, International Journal of Network Management .
Gruman, G., Morrison, A. & Retter, T. (2012), ‘Software Pricing Trends: How
Vendors Can Capitalize on the Shift to New Revenue Models’, PriceWaterhouse-
Coopers Connected Thinking .
Harmon, R., Demirkan, H., Hefley, B. & Auseklis, N. (2009), ‘Pricing strategies
for information technology services: A value-based approach’, Proceedings of the
42nd Hawaii International Conference on System Sciences .
Hedberg, M., MacMillan, R., Bergstrom, D. & Swanson, M. (2016), ‘Autodesk, Inc.
A somewhat paradoxical year ahead’, Royal Bank of Canada, Capital Markets .
85
Heide, J. & John, G. (1992), ‘Do norms matter in marketing relationships?’, Journal
of marketing .
Hinterhuber, A. & Liozu, S. (2012), ‘Is It Time to Rethink Your Pricing Strategy?’,
MIT Sloan Management Review .
Hinterhuber, A. & Liozu, S. (2014), ‘Is innovation in pricing your next source of
competitive advantage?’, Business Horizons .
Hunt, P. & Saunders, J. (2013), Word Class Pricing, IUniverse, Inc, Indianapolis,
USA.
Jiang, B.-J., yu Chen, P. & Mukhopadhyay, T. (2007), ‘Software Licensing: Pay-
Per-Use versus Perpetual’, Tepper School of Business .
Jinks, B. (2016), ‘Autodesk settles with activists sachem head, em-
inence’, http://www.bloomberg.com/news/articles/2016-03-11/
autodesk-settles-with-activists-sachem-head-eminence. Accessed:
2016-04-27.
Jorgensen, K. (1992), ‘Videnskabelige arbejdsparadigmer’, Institute of production .
Kenney, B. (2007), ‘Life Beyond CRM: SaaS Grows Up.’, Industry Week .
Kittlaus, H.-B. & Clough, P. N. (2009), Software Product Management and Pricing,
Springer, Berlin, Germany.
Kotler, P. (2015), Marketing Management, 15 edn, Prentice Hall, New Jersey, US.
Kumar, V. (2014), ‘Making ”Freemium” work’, Harvard Business Review .
Laatikainen, G., Ojala, A. & Mazhelis, O. (2013), ‘Cloud Services Pricing Models’,
International Conference on Software Business .
Lasher, D. (2008), ‘Are you ready for Saas?’, Customer relationship Management .
Maher, P. (1984), ‘National Account Marketing: An Essential Strategy or a Prima
Donna Selling ?’, Business Marketing .
McCarthy, J. (1960), Basic Marketing. A Managerial Approach, R.D. Irwin, Illinois,
US.
McDonald, M., Millman, T. & Rogers, B. (1997), ‘Key account management: The-
ory, practice and challenges’, Journal of Marketing Management .
Miles, M. & Huberman, A. (1994), Qualitative Data Analysis, SAGE, California,
US.
86
Miller, R. (2016), ‘Facing an array of challenges, autodesk shifts
to subscription pricing’, http://techcrunch.com/2016/02/11/
facing-an-array-of-challenges-autodesk-shifts-to-subscription-pricing.
Accessed: 2016-02-15.
Millman, A. & Wilson, K. (1994), ‘From Key Account Selling to Key Account
Management’, Tenth Annual Conference on Industrial Marketing and Purchasing,
University of Groningen .
Millman, A. & Wilson, K. (1995), ‘From Key Account Selling to Key Account
Management’, Journal of Marketing Practise .
Mohr, J., Sengupta, S. & Slater, S. (2010), Marketing of High-Technology Products
and Innovations, Prentice Hall, New Jersey, US.
Montgomery, D., Yip, G. & Villalonga, B. (1998), ‘Demand for and use of Global
Account Management’, Research Papers in Management Studies-University of
Cambridge .
Napolitano, L. (1997), ‘Customer-Supplier Partnering: A Strategy Whose Time
Has Come’, Journal of Personal Selling & Sales Management .
Otley, D. & Berry, A. (1994), ‘Case study research in management accounting and
control’, Management Accounting Research .
Pardo, C. (1997), ‘Key account management in the business-to-business Field: The
Key Account’s point of view’, Journal of personal Selling & Sales Management .
Platzer, L. (1984), ‘Managing National Accounts’, The Conference Board .
Preissl, B., Bouwman, H. & Steinfield, C. (2013), E-Life after the Dot Com Bust,
Physica-Verlag HD, Heidenberg, Germany.
Pujol, N. (2010), ‘Freemium: attributes of an emerging business model’, The social
science research network .
Reid, D. A. & Plank, R. E. (2000), ‘Business Marketing Comes of Age: A Com-
prehensive Review of the Literature’, Journal of Business-to-Business Marketing
.
Rustad, M. (2010), Software Licensing: Principles and Practical Strategies, OUP
USA, New York, US.
Senqupta, S., Krapfel, M. & Pusateri, M. (1997), ‘The strategic sales force: work-
87
load, compensation and technology all a↵ect key account management’, Market-
ing Management .
Shapiro, B. & Moriarty, R. (1984a), ‘Organizing the National Account Force’, Mar-
keting Science Institute, Cambridge .
Shapiro, B. & Posner, R. (1976), ‘Making the Major Sale’, Harvard Business Review
.
Shapiro, B. & Wyman, J. (1981), ‘New Ways to Reach Your Customers’, Harvard
Business Review .
Sorqvist, L. (2000), Kundtillfredstallelse och Kundmatningar, Studentlitteratur,
Lund, Swe.
St.Clair, G. (2008), ‘Software-as-a-Service (SaaS) Put the Focus on the
KM/Knowledge Services Core Function’, EOS International .
Sultan, S. (2006), ‘Floating License Management’, Digital rights management sem-
inar software protection techniques .
Sysmans, J. (2006), ‘Software as a Service: A Comprehensive Look at the Total
Cost of Ownership of Software Applications’, Software & Information Industry
Association SIIA .
The Economist (20 Apr 2006), ‘Proponents of ‘software-as-a-service’ say it will
wipe out traditional software.’, http://www.economist.com/node/6838606. Ac-
cessed: 2016-02-11.
The Guardian (2015), ‘What is ’safe harbour’ and why did the eucj just
declare it invalid?’, https://www.theguardian.com/technology/2015/oct/
06/safe-harbour-european-court-declare-invalid-data-protection. Ac-
cessed: 2016-04-28.
Think-cell (8 February 2016), Website.
Tzempelikos, N. & Gounaris, S. (2015), ‘Linking key account management practices
to performance outcomes’, Industrial marketing managemet .
US Commerce Department Bureau of Economic Analysis (2016), ‘Chain-type price
indexes for value added by industry (computer systems design and related ser-
vices, computer and electronic products)’. Accessed: 2016-03-16.
URL: http: // www. bea. gov/ industry/ gdpbyind_ data. htm
88
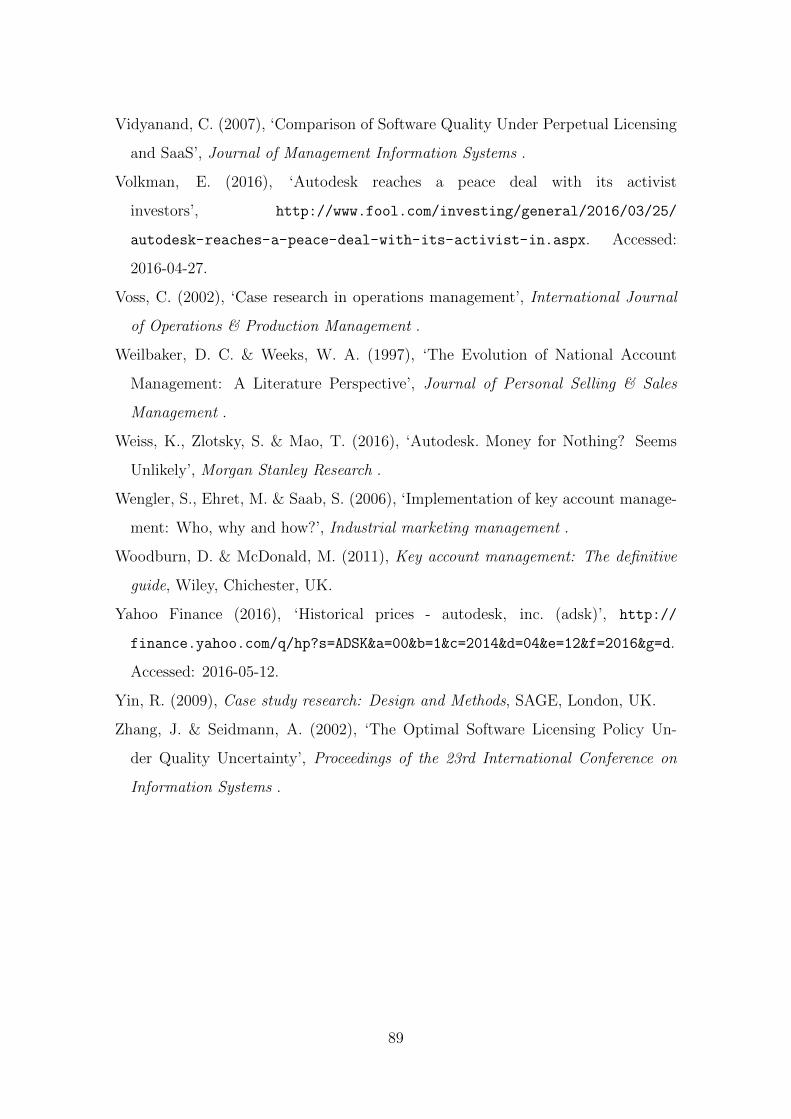
Vidyanand, C. (2007), ‘Comparison of Software Quality Under Perpetual Licensing
and SaaS’, Journal of Management Information Systems .
Volkman, E. (2016), ‘Autodesk reaches a peace deal with its activist
investors’, http://www.fool.com/investing/general/2016/03/25/
autodesk-reaches-a-peace-deal-with-its-activist-in.aspx. Accessed:
2016-04-27.
Voss, C. (2002), ‘Case research in operations management’, International Journal
of Operations & Production Management .
Weilbaker, D. C. & Weeks, W. A. (1997), ‘The Evolution of National Account
Management: A Literature Perspective’, Journal of Personal Selling & Sales
Management .
Weiss, K., Zlotsky, S. & Mao, T. (2016), ‘Autodesk. Money for Nothing? Seems
Unlikely’, Morgan Stanley Research .
Wengler, S., Ehret, M. & Saab, S. (2006), ‘Implementation of key account manage-
ment: Who, why and how?’, Industrial marketing management .
Woodburn, D. & McDonald, M. (2011), Key account management: The definitive
guide, Wiley, Chichester, UK.
Yahoo Finance (2016), ‘Historical prices - autodesk, inc. (adsk)’, http://
finance.yahoo.com/q/hp?s=ADSK&a=00&b=1&c=2014&d=04&e=12&f=2016&g=d.
Accessed: 2016-05-12.
Yin, R. (2009), Case study research: Design and Methods, SAGE, London, UK.
Zhang, J. & Seidmann, A. (2002), ‘The Optimal Software Licensing Policy Un-
der Quality Uncertainty’, Proceedings of the 23rd International Conference on
Information Systems .
89

This page intentionally left blank
90

A Appendix - Overview of Interviewees
Date Position Company Country
Buyer A 2016-03-17 Chief Information O�cer Adebro CH
Buyer B 2016-04-14 VP Engineering Solutions Aircraft Manufacturer FR
Buyer C 2016-04-18 Global Lead Buyer Software IT Company FR
Buyer D 2016-04-25 Simulation Engineer Adebro parent Company CH
Buyer E 2016-04-25 Lead Buyer IT Software Industrial Company DE
Buyer F 2016-04-26 Senior Project IT Buyer Heavy Equipment Manufacturer SE
Buyer G 2016-04-27 Global Category Manager Telecom Company SE
Buyer H 2016-05-09 Purchasing Manager Truck Manufacturer SE
Expert A 2016-03-09 SAP Consultant IT Consultancy SE
Expert B 2016-03-09 Founder and President Software Pricing Consultancy US
Expert C 2016-03-10 Director of Product Management IT Company US
Expert D 2016-03-11 Managing Director Software Licence Management NL
Expert E 2016-03-15 University Professor University SE
Expert F 2016-03-16 VP Business Development Software Adebro US
Expert G 2016-03-18 Pricing Researcher University SE
Expert H 2016-03-31 Manager Pricing Consultancy DE
Expert I 2016-04-01 Chief Executive O�cer Adebro Software Subsidiary NO
Expert J 2016-02-24 Business Development Manager Adebro UK
Expert K 2016-04-14 Chief Strategy O�cer Adebro Parent Company UK
Expert L 2016-05-04 Partner Management Consultancy DE
Table A.1: Summary of Interviewees and Their Positions (1/2)
91
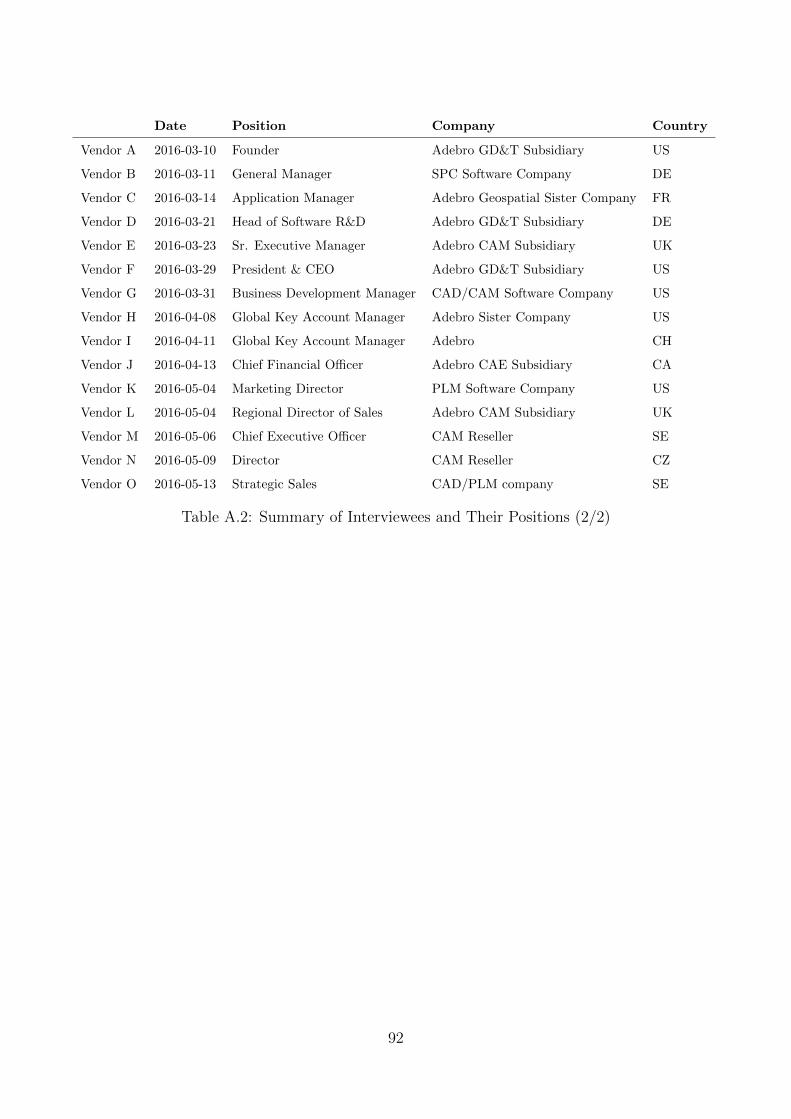
Date Position Company Country
Vendor A 2016-03-10 Founder Adebro GD&T Subsidiary US
Vendor B 2016-03-11 General Manager SPC Software Company DE
Vendor C 2016-03-14 Application Manager Adebro Geospatial Sister Company FR
Vendor D 2016-03-21 Head of Software R&D Adebro GD&T Subsidiary DE
Vendor E 2016-03-23 Sr. Executive Manager Adebro CAM Subsidiary UK
Vendor F 2016-03-29 President & CEO Adebro GD&T Subsidiary US
Vendor G 2016-03-31 Business Development Manager CAD/CAM Software Company US
Vendor H 2016-04-08 Global Key Account Manager Adebro Sister Company US
Vendor I 2016-04-11 Global Key Account Manager Adebro CH
Vendor J 2016-04-13 Chief Financial O�cer Adebro CAE Subsidiary CA
Vendor K 2016-05-04 Marketing Director PLM Software Company US
Vendor L 2016-05-04 Regional Director of Sales Adebro CAM Subsidiary UK
Vendor M 2016-05-06 Chief Executive O�cer CAM Reseller SE
Vendor N 2016-05-09 Director CAM Reseller CZ
Vendor O 2016-05-13 Strategic Sales CAD/PLM company SE
Table A.2: Summary of Interviewees and Their Positions (2/2)
92
B Appendix - Interview Guide
B.1 Experts
Introduction
• Brief background concerning project and key terms
• Tell me more about you and your position?
– Role today/previous? Expert areas?
Products
• Tell me more about the software that you are specialised in?
– Characteristics?
– Learning curve for the user?
– Switching cost?
– What are the KPC?
Pricing models and strategies
• How have pricing of software developed?
– What are the trends?
– What is best practice today?
• How does the choice of pricing model a↵ect quality?
• How to incorporate SMA in pricing models?
Change management
• What is the impact on current business if the pricing model is changed?
– What role plays KAM in the execution?
– What are the problem areas that may occur?
• What is the impact on customer relations if the model is changed?
– How sensitive is the customer? When do they ”leave”?
Future value proposition
• How can software suppliers create value for a buyer in the future?
– e.g. cloud-based, feedback loops, add-ons, modularity
93
B.2 Vendors
Introduction
• Brief background concerning project and key terms
• Tell me more about you and your position?
– Role today/previous? Expert areas?
Products
• Tell me more about the software that you sell?
– Characteristics? Price points?
– Learning curve for the user? Switching cost?
– What are the KPC?
– Biggest customers?
Pricing models and strategies
• Status quo - Which models are used today?
– Why are they used? History?
– How is the price determined?
– Structure of payment flow? Assesment base?
– Price discrimination? Bundling?
• What do you think about your pricing model and other models?
– Which models do you prefer?
Change management
• What is the impact on current business if the pricing model is changed?
– What role plays KAM in the execution?
– What are the problem areas that may occur?
• What is the impact on customer relations if the model is changed?
– How sensitive is the customer? When do they ”leave”?
KAM/sales
• How do you work with KAM/sales today?
– How is the customer relationship?
– Have the KAM/sales changed over time?
• How is KAM/sales measured today?
– What are the KPIs? Scorecards?
• How much freedom do the KAM/sales have?
• KAM/sales role in implementing and execution of pricing models?
94
B.3 Buyers
Introduction
• Brief background concerning project and key terms
• Tell me more about you and your position?
– Role today/previous? Expert areas?
Sourcing
• Status quo - How is the sourcing process today?
– Which products/software do you buy today?
• How often do you change product/software supplier?
– What is the switching cost?
• Which are the most important KPC?
• What is an optimal buyer-seller relationship?
– Where are you today?
Pricing models
• Which pricing model do you prefer?
– Are you buying software with di↵erent models?
• How are the current SMA structured?
– How would you like it to be?
• How are you a↵ected if a vendor change pricing model?
– How would you react?
• How does the choice of pricing model a↵ect quality?
Future value proposition
• How can software suppliers create value for a buyer in the future?
– e.g. cloud-based, feedback loops, add-ons, modularity
95

This page intentionally left blank
96
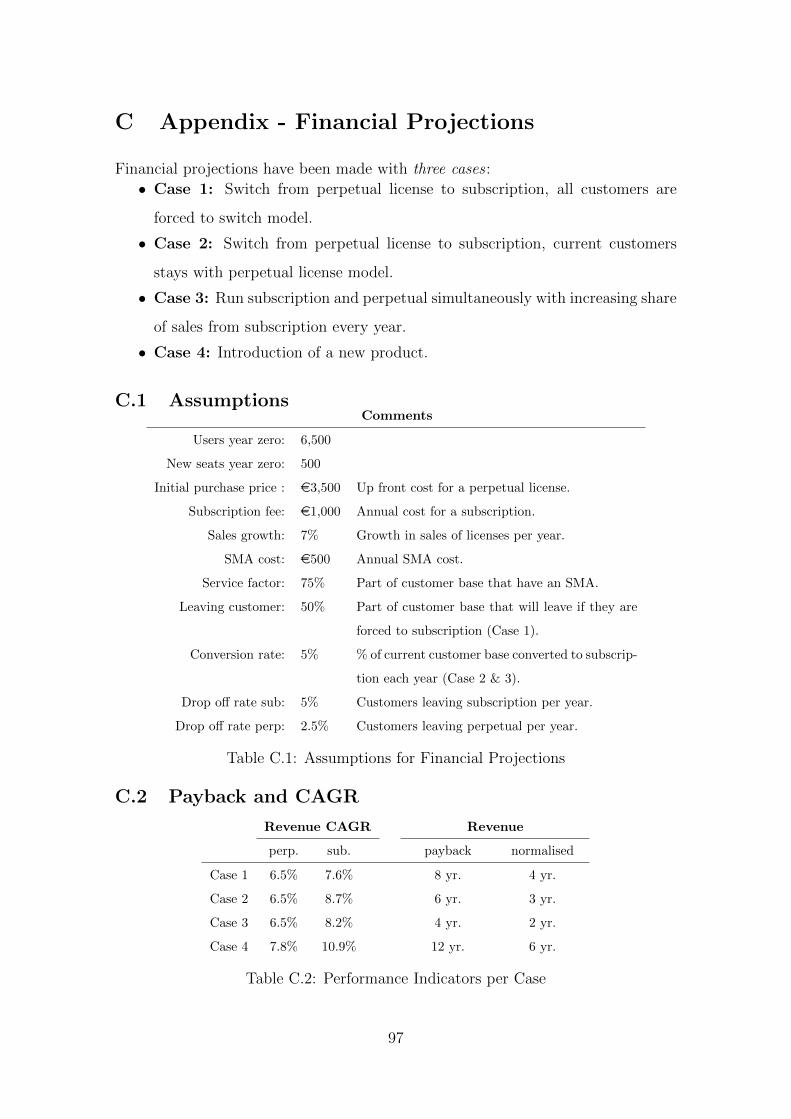
C Appendix - Financial Projections
Financial projections have been made with three cases :• Case 1: Switch from perpetual license to subscription, all customers are
forced to switch model.
• Case 2: Switch from perpetual license to subscription, current customers
stays with perpetual license model.
• Case 3: Run subscription and perpetual simultaneously with increasing share
of sales from subscription every year.
• Case 4: Introduction of a new product.
C.1 AssumptionsComments
Users year zero: 6,500
New seats year zero: 500
Initial purchase price : e3,500 Up front cost for a perpetual license.
Subscription fee: e1,000 Annual cost for a subscription.
Sales growth: 7% Growth in sales of licenses per year.
SMA cost: e500 Annual SMA cost.
Service factor: 75% Part of customer base that have an SMA.
Leaving customer: 50% Part of customer base that will leave if they are
forced to subscription (Case 1).
Conversion rate: 5% % of current customer base converted to subscrip-
tion each year (Case 2 & 3).
Drop o↵ rate sub: 5% Customers leaving subscription per year.
Drop o↵ rate perp: 2.5% Customers leaving perpetual per year.
Table C.1: Assumptions for Financial Projections
C.2 Payback and CAGR
Revenue CAGR Revenue
perp. sub. payback normalised
Case 1 6.5% 7.6% 8 yr. 4 yr.
Case 2 6.5% 8.7% 6 yr. 3 yr.
Case 3 6.5% 8.2% 4 yr. 2 yr.
Case 4 7.8% 10.9% 12 yr. 6 yr.
Table C.2: Performance Indicators per Case
97
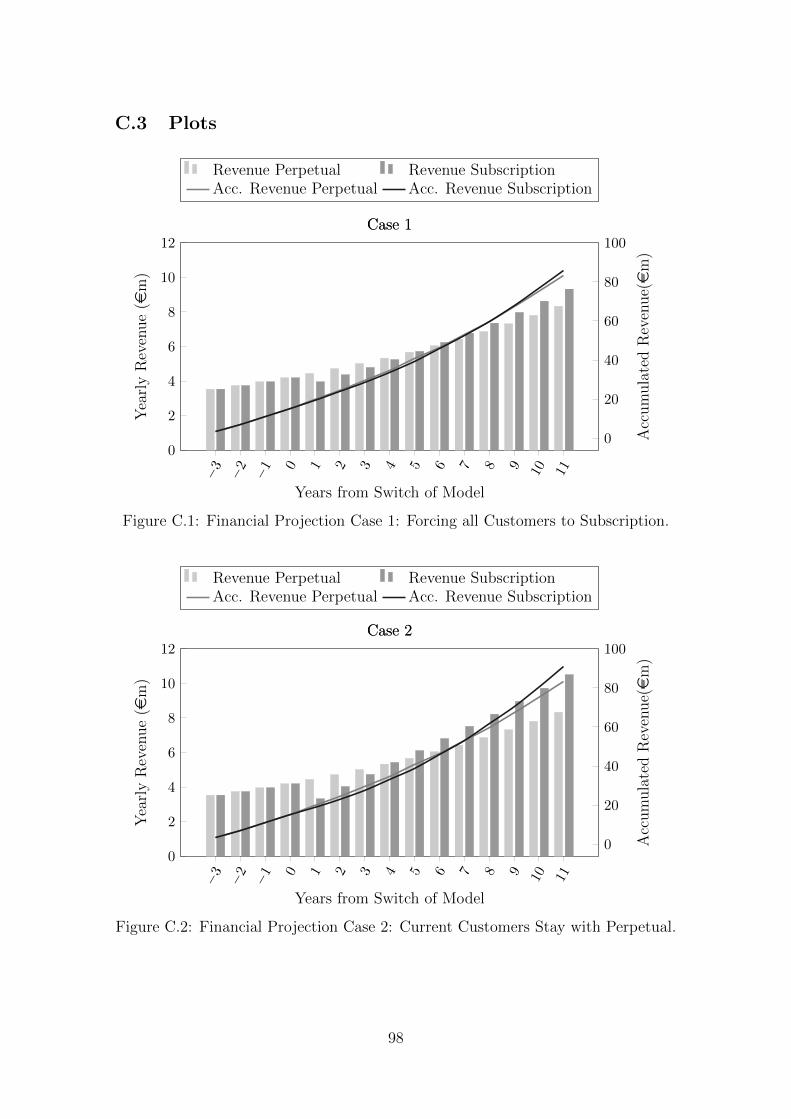
C.3 Plots
�3 �2 �1 0 1 2 3 4 5 6 7 8 9 10 11
0
2
4
6
8
10
12
Years from Switch of Model
YearlyRevenue(e
m)
Case 1
0
20
40
60
80
100
AccumulatedRevenue(em)
Case 1
Revenue Perpetual Revenue SubscriptionAcc. Revenue Perpetual Acc. Revenue Subscription
Figure C.1: Financial Projection Case 1: Forcing all Customers to Subscription.
�3 �2 �1 0 1 2 3 4 5 6 7 8 9 10 11
0
2
4
6
8
10
12
Years from Switch of Model
YearlyRevenue(e
m)
Case 2
0
20
40
60
80
100AccumulatedRevenue(em)
Case 2
Revenue Perpetual Revenue SubscriptionAcc. Revenue Perpetual Acc. Revenue Subscription
Figure C.2: Financial Projection Case 2: Current Customers Stay with Perpetual.
98

�3 �2 �1 0 1 2 3 4 5 6 7 8 9 10 11
0
2
4
6
8
10
12
Years from Switch of Model
YearlyRevenue(e
m)
Case 3
0
20
40
60
80
100
AccumulatedRevenue(em)
Case 3
Revenue Perpetual Revenue Two ModelsAcc. Revenue Perpetual Acc. Revenue Two Models
Figure C.3: Financial Projection Case 3: Run subscription and perpetual simulta-
neously with increasing share of sales from subscription every year.
1 2 3 4 5 6 7 8 9 10 11 12 13 14 15
0
1
2
3
Years from Introduction
YearlyRevenue(e
m)
Case 4
0
5
10
15
20
AccumulatedRevenue(em)
Case 4
Revenue Perpetual Revenue SubscriptionAcc. Revenue Perpetual Acc. Revenue Subscription
Figure C.4: Financial Projection Case 4: Introducing a New Product.
99

This page intentionally left blank
100