Structural performance of pretensioned member with Ultra ...
Crack and DeflectionControl of PretensionedPrestressed Beams
Edward G. NawyProfessor of Civil EngineeringRutgers—The State Universityof New JerseyPiscataway, New Jersey
P. T. HuangSenior Structural Engineer
Gibbs & HillConsulting Engineers
New York, N.Y.
Based on a series of laboratory tests onprecast prestressed T and I beams, theauthors propose crack width and deflectionformulas for evaluating the serviceability ofsuch members. Several numerical examplesshow the applicability of the recommendedcrack width equations.
T he primary objective of this investi-gation was to study the serviceabil-
ity of pretensioned prestressed I and Tbeams through an analytical and exper-imental investigation of their flexuralcracking and deflection behavior up tofailure.
Available experimental data on crack-ing in prestressed concrete members is
limited. 1 -5 Formulas on crack widthprediction from previous researches, ingeneral, were based on two differentconcepts. The first concept, proposedby Ferry-Borges, 6 Nawy-Potyondy,2 -3
Holmberg,7 , 8 and CEB9 is to relatecrack width to the stress or strain in thereinforcement.
Another concept, originated by
30

YIELD STRENGTH 8Y
0.2% SET METHOD
% AREA 0.0356 IN2/ ULT. STRENGTH=9600 LBS
^ Eg
V.VVO V.V I' u.V V
STRAIN (IN/IN)
250
20C
0
y 15CU)wrcU)
IOC
50
00.000
Abeles 1 ° proposed the crack width tobe related to the flexural tensile stressin the concrete. The analytical equa-tions proposed in this investigation arebased on the first concept.
Tests on four series were conductedon 20 simply supported beams of 9-ftspan and four two-span continuousbeams of effective 9-ft spans. The ma-jor controlling parameters were the var-iations in the steel reinforcement per-centages of the prestressing tendonsand the non-prestressed reinforcement.
The prestressing tendons were 1/4 in.nominal diameter 7-wire strand, 250ksi elements. The mild steel reinforce-ment was either #3 or #4 deformedhigh strength bars of yield strengthvarying between 79 and 84 ksi and ulti-mate strength between 100 and 110ksi. The total steel percentage was var-ied from 0.17 to 1.08 percent.
This paper proposes analytical ex-pressions for evaluating the crackwidths in such members at workingand overload loading levels in terms ofthe controlling parameters. The investi-gation also correlates the deflection re-
suits with the expected computed de-flections. Several numerical examplesare included to show the applicabilityof the proposed crack width formulas.
Test Program
This section describes the propertiesof the materials used in the experiment-al program and gives the details of fab-rication of the beam specimens and thetesting procedure.
MaterialsThe mix was proportioned for a nomi-
nal 28-day compressive strength of approx-imately 4000 psi (281 kg/cm2). The wa-ter-cement ratio varied between 5.4 and7.1 gal. per sack of cement. The coarseaggregate used was crushed stone of a/s in.(9.35 mm) maximum size; while the fineaggregate was natural local sand. Theslump varied between 5 and 71/2 in. (12.7and 19.1 cm) as given in Table 1.
Uncoated, stress-relieved, 250 ksi seven-wire 1/4-in, strands were used for pre-stressing. The strand nominal area was0,0356 sq in. (0.234 cm2) and the ma-terial had a unit elongation of 0.65 percent
Fig. 1. Typical stress-strain relation of prestressing steel.
PCI JOURNAL/May-June 1977 31

Table 1. Properties of concrete in beam specimens.
Age at Compressive Tensile Water-Cement Avg.
Beam Test Strength (psi) Splitting Ratio Slump
(days) Strength (gals/sack) (in.)
3 Days At Test (psi)
1 2 3 4 5 6 7
B1-64 28 3080 4780 650 5.4 5
B5-B6 29 2920 4100 545 6.2 6i
B7-B8 31 2920 4350 555 6.3 6',.
69-610 33 1850 2915 470 7.1 9
611-612 35 3100 4740 705 5.8 5
B13-B14 27 2900 4200 650 6.4 7
615-B16 29 2670 4130 660 6.6 7
B17-B18 34 2650 4925 695 5.5 7z
619-620 34 1850 3010 470 7.1 9
B21 37 3100 4720 730 5.8 5
B22 36 2900 4350 660 6.4 7
B23 39 2670 4150 670 6.6 7
B24 33 2655 4385 620 5.5 7%,
at 70 percent of the ultimate. The materialsatisfied ASTM A-416 specifications andhad a typical stress-strain relation as shownin Fig. 1.
Non-prestressed #3 and #4 deformedbars were used as supplementary reinforce-ment at the tension side in all specimensexcept Beams B-1 to B-6. A typical stress-strain diagram for the deformed bars isshown in Fig. 2. Table 2 gives the detailsof the reinforcement used for the beams inthis test program, and Fig. 3 gives typicalcross sections of the test beams.
Fabrication and testing
Twenty single-span and four continuousbeams were fabricated i and tested. Thesimply supported single-span beams wereas follows:
(1) Beams B-1 to B-6 were T sectionswith pretensioned prestressing tendonsonly.
(2) Beams B-7 to B-18 were also Tsections reinforced with both pretensionedprestressed tendons and non-prestressedmild steel.
Table 2. Geometrical properties of beam specimens.
Compres. WebBeam Size Longitudinal Tensile Steel Steel Reinforcement
Beam Sect. Total Eff. Flange Web No. No. No. As As, Size SpacingDepth Depth Width Thick- of of of p p of
ness 1/4-in. #3 #4 BarTendons Bars Bars (5) (5)
(s9 (s9(in.) (in.) (in.) (in.) in.) in.) (in.)
1 2 3 4 5 6 7 8 9 10 11 12 13 14 15
B-1 T 10 8.00 8 3 3 - - .108 0.17 .22 .34 #3 6
B-2 T 10 7.75 8 3 4 - - .144 0.23 .22 .35 #3 6B-3 T 10 7.30 8 3 5 - - .180 0.31 .22 .38 #3 6B-4 T 10 7.00 8 3 6 - - .216 0.39 .22 .39 #3 6B-5 T 10 6.57 8 3 7 - - .252 0.48 .22 .42 #3 4
B-6 T 10 6.25 8 3 8 - .288 0.58 .22 .44 #3 4
B-7 T 10 8.80 8 3 3 2 - .328 0.47 .22 .31 #3 6
B-8 T 10 8.80 8 3 3 2 - .328 0.47 .22 .31 #3 6
6-9 T 10 8.65 8 3 4 2 - .364 0.53 .22 .32 #3
0-10 T 10 8.65 8 3 4 2 - .364 0.53 .22 .32 #3 6B-11 T 10 8.37 8 3 5 2 - .400 0.60 .22 .33 #3 4
B-12 T 10 8.37 8 3 5 2 - .400 0.60 .22 .33 #3 4
B-13 T 10 8.46 8 3 6 - 2 .616 0.91 .22 .33 #3 4
8-14 T 10 8.46 8 3 6 - 2 .616 0.91 .22 .33 #3 4
B-15 T 10 8.22 8 3 7 - 2 .652 0.99 .22• .33 #3 4B-16 T 10 8.22 8 3 7 - 2 .652 0.99 .22 .33 #3 4
0-17 T 10 8.00 8 3 8 - 2 .688 1.08 .22 .34 #3 4B-18 T 10 8.00 8 3 8 2 .688 1.08 .22 .34 #3 4
B-19 I 10 9.00 6 3 3 2 - .328 0.61 .22 .41 #3B-20 I 10 9.00 6 3 4 2 ,544 1.01 .22 .41 #3 4
8-21 I 10 9.00 6 3 3 2 - ,328 0.61 .22 .41 #3 4B-22 I 10 9.00 6 3 3 2 - .328 0.61 .22 .41 #3 4
8-23 I 10 9.00 6 3 4 - 2 ,544 1.01 .22 .41 #3 4
B-24 I 10 9.00 6 3 4 - 2 .544 1.01 .22 .41 #3 4
32

0)Y
y
W
h
Fig. 2. Typical stress-strain relation of non-prestressing steel.
(3) Beams B-19 and B-20 were I sec-tions with both prestressed and non-pre-stressed reinforcement.
Beams B-21 through B-24 were I sec-tions continuous on two spans reinforcedwith both pretensioned prestressed tendonsand mild steel reinforcement. Straightstrand profiles were used in all beams.
For continuous beams, strands were in-serted into plastic hoses in the compressionregions to achieve zero bond between con-
crete and strands. Before testing, thosestrands in the compression regions werecut through to eliminate the effectivenessof strands in these zones.
All beams were 10 in. (25 cm) deep asshown in Table 1. They were all over-de-signed to resist diagonal tension. Deformedclosed stirrups (#3 bars) at 6 in. (15 cm)center-to-center were used throughout thespan for beams with a low tensile steelreinforcement percentage and 4 in. (10
(a) T - SECTION (b) I - SECTION
Fig. 3. Geometric beam cross -sectional dimensions for T and I sections.
PCI JOURNAL/May-June 1977 33

cm) for beams containing a high percent-age of tensile reinforcement (see Table 4).Pretensioning frames previously designedfor the work reported in References 2 and.3 were used in this investigation. Eachframe provided an independent unit with60,000 lb (13,6 tons) axial capacity.
All reinforcement was instrumented withelectric strain gages at critical locations.
Readings were taken of the change instrain at all the necessary stages of pm-stressing and loading. In addition, de-mountable mechanical gages were used tomeasure the variation of strain on the con-crete faces of the beams.
Mechanical dial gages having 2 in. (5em) travel and 0.001. in, (0.025 mm) ac-curacy were used to measure the change in
Table 3, Measured and calculated cracking and ultimatemoments of simply supported beam specimens.
Meas. Mcr Calc, M Mcr Meas. M. Calc. Mu Meas. M. Mode of
Ca--r FailureCal c.Mu
(in.-kips) (in.-kips) (in.-kips) (in. -kips)
1 2 3 4 5 6 7 8
B-1 137.0 136.9. 1.00 258.3 219.74 1.175 TensionB-2 164.0 159.7 1.03 310.8 277.30 1.121 TensionB-3 178.2 170..6 1..04 344.4 299.73. 1.149. Tension8 -4 189.0 183.6 7.03 390.6 330.68 1.181 : TensionB-5 1,83.0 186.7 0,98. 4.17.9, 935,999; 1..240 Compression6-6 193,2, 103,4; 1.,03 430.5. 345.59 1.240 Compression8-7 126.0 137.6 0.92 336.0 296.10 1.135 TensionB-8 136.4 140.0 0.98. 336.0 296.78 1.132 TensionB-9 130.0 136..2 0.96 336.0 329.11 1.021 CompressionB-10 126.5 138.4 0.92 327.6 328.21 0.998 Compression6-95 979,0 777,3: 0„913 445.2 379.62 1.172 Compressi©n.6-12 173.0 177.3 0.98 443.1 380.14 1.166 I CompressionB-13 994.0 182.3 1.06 588.0 546.79 1.075" CompressionB-14 195.0 187.5 1.04. 558.6 547.94 1;01.9 Compression0-15 205.9. 199.0 1.03 562.8 513.15 1.092 CompressionB -16 201.$. 197..5. 1.02 554.4 510,36. 1,999 Compress.i; Qn.B-17 216.01 215.0 1.00 600.6. 580.65 1.030 CompressionB-1@ - 253,0 219.1 0.97 592.2 584,90 1..015 0ompres$son.B-19. 126.0 737.3 0.92, 308.,7 293.57 1.052 Compression.8-08 127.3 167.9 0.75 300„3. 454,11 0.660 Shear
Table 4. Measured stabilized crack spacirugs versus their theoretical values.
Meas. Theo. a Meas. a Meas. Corre-. aStab. min. - Stab. min. Csmin. Stab. max. Stab. max. csmax. Stab. sponding Theo. csmean
Beam Crack Crack ate- Crack Crack Mean Initial MeanaT aSpacing Spacing CSein. Spacing Spacing osmax. Crack M/M Crack csmean
acsmin.
acsmin.
acs acs Spacing. n Spacingmax. max.
a acsmeanmean
(in.) (in.) (in.) (in.), (in.) (in.)
1 2 3 4 5 6 7 8 9 10.. 11
B-1 5.00 4.08 1.23- 7.25 8.15: 0..89 6.12 0..59 6.33 0.97B-2 4.13 3.93 1.05: 7.63 7.86 0,97 5.90 0.55 5.34 1.11B-3- 4.31 3.73 1.1.6 6.63 7.4,6. 0.89 5.60 0.67 5.13 1.098-4 3,7.3 3.26 0.96 6.38: 6.52 0.98 4.89 0.67 4.75. 1.03B-5. 2.38 2.77 0.86 5.00, 5.53, 0.90 4.15 0.70 4.39 0.956-6 2.50 2.41 1.04 5.13 4.51 1..07 3.61 0..66 3.92 0.920-7 2.1,3.3 2.13 1.00 3.94 4.26. 0.92 : 3.20 9,.75 2.97 1.08B-8. 1.94. 1.98 0.93. 4.06. 3.94: 7.03 2.97 0.75 2.97 1.00B-9 2.13 1.90 1.12 3.75. 3.80 0.97' 2.85 0.73 2.72 1.05B-10 2.50 1.84 1.36 5.00 3.68. 1.36 2.76 0.76: 2.72 1.028-11 1.75 1.63. 1.07 3.13 3.26 0..96 2.44 0.66 2.67 0.91B-12 1.75 1.65 1.06 3.38 3.30. 1.02 2.47 0.66 2.67 0.930-13 1.44 1.58 0.91 3,56 3.16 1.13 2.37 0.68 2.21 1.070-14. 1.38 1.51. 0.91 3.63 3.03 1.20 2.27 0.71 2.21. 1.03B-15 1,25 1.39 0.90:. 3.73 2.77- 1.13 2.08- 0..75 2.46-. 0.84.B -16 1.75. 1.50 1.17 3.00 3.00. 1.00 2.25. 0.76 2.46 0.918-17" 1.63 1.50 1.08 3.25. 3..00 1.08 2.25 0.70 2.29 0.988-18 1.50. 1.37 1.09. 3.06-. 2.75- 1.11 2.06 0.71 2.29 0.900-19. 1,88 2.09. 0.90 4.25 4.18 1.02 3.73- 0.72 3.52 0.89B-20 1.69. 1.85. 0,91 3.75 3.70 1.03 2.78. 0.70 2.57 1.08Mean 1.04: 1.03 0.99.5.0. 0.13, 0.11. 0.08
34
deflection due to loading. Crack widthswere measured with illuminated 25-powermicroscopes having a 0.05 mm accuracy.Crack spacings of all the developing crackswere also accurately recorded as well as thecrack penetration of the principal cracks.
For most of the beams, eight to nineincrements of load were applied to fail-ure. At the conclusion of each beam test,the concrete control cylinders were testedfor both compressive and tensile failure.
Test Results
This section summarizes the test re-sults for effective prestress force, mo-ment capacity, flexural crack widths,and load-deflection data.
Effective prestress andmoment capacities
A measurement of the effective pre-stressing force is necessary to determinethe net steel stress for each loadingstate. The initial prestress varied be-tween 174.1 and 180.6 ksi (12,240 and12,696 kg/cm2, respectively). The ef-fective prestress correspondingly varied
from 138.0 to 148.0 ksi (9701 to 10404kg/cm2) after deducting anchorage,elastic shortening and creep and shrink-age losses.
The measured external moments, Mc,.,producing the first hair crack, is com-pared to the calculated cracking mo-ment in Table 3. This table also givesthe measured and calculated ultimatemoments.
Flexural crackingMaximum crack widths were mea-
sured at the reinforcement level and atthe bottom tensile face of the concrete.The spacings of the cracks were meas-sured an both faces of each beam ateach loading stage. These spacingswere summarized for each test speci-men and the mean crack spacing wascalculated.
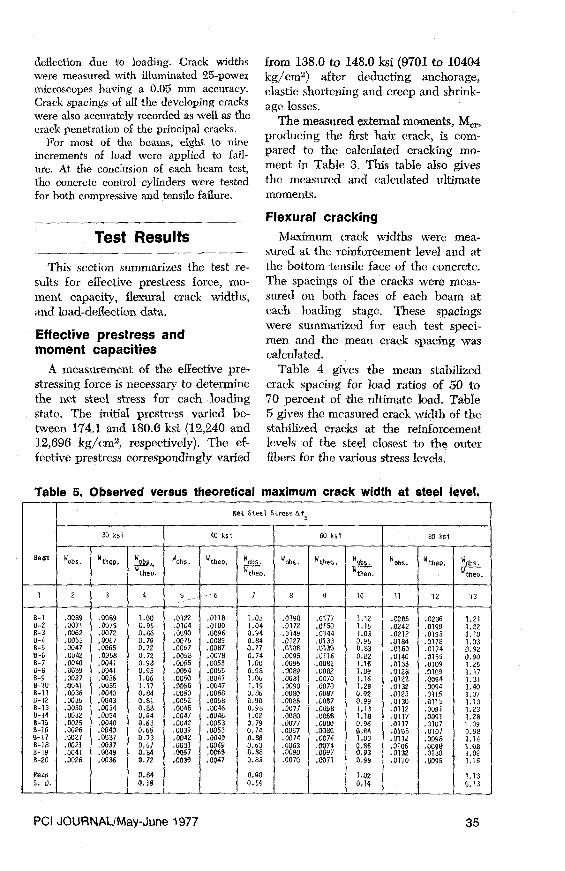
Table 4 gives the mean stabilizedcrack spacing for load ratios of 50 to70 percent of the ultimate load. Table5 gives the measured crack width of thestabilized cracks at the reinforcementlevels of the steel closest to the outerfibers for the various stress levels.
Table 5. Observed versus theoretical maximum crack width at steel level.Net Steel Stress afs
30 ksi 40 ksi 60 ksi 80 ksi.
Beam W obs. W theo, WObs. Wobs, W #heo, Wobs. W Wis. W #+eo, W Wig,
Wobs,
Wrhea,
Wobs.
W theo. the,,. Wtheo. then
1 2 3 4 5 _ --- 6 7 8 9 10 11 12 13
B-1 .0089 .0089 1.00 .0122 ,0118 1,03 .0198 .0177 1.12 .0285 .0236 1.21B-2 .0071 .0075 0.95 .0104 .0100 1.04 .0172 .0150 1.15 .0242 .0198 1.22B-3 .0062 .0072 0.86 .0090 .0096 0.94 :,0149 .0144 1.03 .0212 .0193 1,100-4 ,0053 ,0067 0.79 .0075 .0089 0.84 .0127 .0133 0.95 .0184 .0178 1.036-5 .0047 ,0065 0.72 .0067 .0087 0.77 ,0108 .0130 0.83 .0160 .0174 0.92B-6 .0042 .0058 0.72 ,0058 .0078 0.74 .0095 .0116 0,82 .0140 .0155 0.90B-7 .0040 .0041 0,98 .0055 .0055 1.00 ,0095 .0082 1.16 ,0135 ,0109 1.25B-8 .0039 ,0041 0.95 .0054 .0055 0.98 ,0089 .0082 1.09 .0128 .0109 1.17B-9 ,0077 ,0035 1.06 .0050 .0047 1,06 .0081 .0070 1.16 10123 .0094 1.31B-10 .0041 .0035 1.17 .0056 .0047 1.19 .0090 ,0070 1.29 .0132 .0094 1.40B-11 .0036 .0043 0.84 .0050 .0058 0.86 .0080 .0087 0.92 .0123 .0115 1.07B-12 .0035 ,0043 0.81 ,0052 .0058 0,90 .0086 .0087 0.99 ,0130 .0115 1.138-13 .0030 .0034 0.86 .0045 .0046 0.98 .0077 .0088 1.13 .0112 .0091 1.23B-14 ,0032 .0034 0,94 ,0047 .0046 1.02 .0080 .0068 1.16 .9117 ,0091 1.28B-15 .0025 .0040 0.63 .0042 .0053 0.79 .0077 .0080 0.96 .0117 .0107 1.098-16 .0026 .0040 0.65 .0039 ,0053 0.74 .0067 .0080 57.84 .9355 .0107 0.98B-17 .0027 .0437 0.73 .0042 .0049 0.86 .0074 .0074 1.00 .0112 .0098 1.14B-18 .0021 ,0037 0.57 .0031 .0049 0.63 .0063 .0074 0.85 ,0106 .0098 3.08B-19 .0041 .0049 0.84 .9957 ,0065 0.88 .0090 .0097 0.93 .0132 .0130 1.02B-20 .0026 .0036 0.72 ,0039 .0047 0.83 .0070 .0071 0.99 .0110 .0096 1.16
Mean 0,84 0.90 1.02 1.13S. 0. 0,18 0.14 0.14 0.13
PCI JOURNAL/May-June 1977 35

a I
OJ
0.0 0.3 0.6 0.9 1.2 1.5 1.8 2.1
DEFLECTION (IN)
Fig. 4. Typical load -deflection relation for Beams B-3 and B-4.
DeflectionDeflection behavior of prestressed
concrete structural elements differsfrom that of reinforced concrete sys-tems. Initial reverse deflection due toprestressing, namely camber, has to beconsidered. Typical composite netload-deflection relations due to externalload are shown in Fig. 4.
These curves essentially show a tri-linear relation. The first stage repre-sents the precracking stage, essentiallyelastic, the second stage, namely, thepost-cracking stage where the deflectionof the beam increases faster as morecracks develop, and the third stage de-notes the behavior prior to failure.
(a) FOR EVEN DISTRIBUTION OF (b) FOR NON-EVEN DISTRIBUTION OFREINFORCEMENT IN CONCRETE REINFORCEMENT IN CONCRETE
Fig. 5. Effective area in tension for distribution of reinforcement.
36

Mathematical Model forEvaluating Serviceability
This section describes the mathemati-cal model used to evaluate serviceabil-ity based on crack spacing, crack width,and deflection.
Crack spacingPrimary cracks form in the region of
maximum bending moment when theexternal load reaches the cracking load.As loading is increased, additionalcracks will form and the number ofcracks will be stabilized when the stressin the concrete no longer exceeds itstensile strength at further locations re-gardless of load increase.
This condition is important as it es-sentially produces the absolute mini-mum crack spacing which can occur athigh steel stresses, to be termed thestabilized minimum crack spacing. Themaximum possible crack spacing un-der this stabilized condition is twicethe minimum, to be termed the stabil-ized maximum crack spacing. Hence,the stabilized mean crack spacing ad8is shown to be the mean value of thetwo extremes.
The total tensile force T transferredfrom the steel to the concrete over thestabilized mean crack spacing can bedefined as:
T = f a,, u, , Io (1)where
f = a factor reflecting the distribu-tion of bond stress
urn = maximum bond stress which is
a function of \/faJo = sum of the circumferences of
the reinforcing elementsThe resistance R of the concrete
area in tension A t can be defined as:R = At f't (2)
By equating Eqs. (1) and (2), thefollowing expression for aC3 is obtained,where c is a constant to be developedfrom the tests:
a08 \ (3)Cs
The concrete stretched area, namely,the concrete area in tension At for boththe evenly distributed and non-evenlydistributed reinforcing elements isshown in Fig. 5.
With a mean value of f'tVL = 7.95in this investigation, a regression analy-sis of the test data resulted in the fol-lowing expression for the mean sta-bilized crack spacing:
aC8 = 1.20 A t/so (4)Fig. 6 gives the basic regression
analysis plot for aC8.
Crack widthIf Afg is the net stress in the pre-
stressed tendon or the magnitude ofthe tensile stress in the normal steel atany crack width load level in whichthe decompression load (decompressionhere means f c = 0 at the level of thereinforcing steel) is taken as the refer-ence point, 3 , 5 then for the prestressedtendon:
ifs = fn.t — fd (5)where
f,^ t = stress in the prestressing steelat any load level beyond thedecompression load
f,t = stress in the prestressing steelcorresponding to the decom-pression load
The unit strain e, = Of8/E3 since itis reasonable to disregard the unitstrains in the concrete due to the ef-fects of temperature, shrinkage andelastic shortening. 4 ' 5 Hence, the maxi-mum crack width can be defined as:
2Umx = k a0, Ea, (6)where k and a are constants to beestablished by tests.
Alternatively:w.mam = k' aas(Of,)a (6a)
Eq. (6a) is rewritten in terms of Of8so that an analysis of the test data ofall the simply supported test beamsleads to the following expression at the
PCI JOURNAL/May-June 1977 37

6
Z 5
dto 4z
a)3
C.,
rcC.,
za 2w
0wM
00
o
o
o f+Ata^ g =0.I5I
009
0
STAND. ERROR OF EST. 0.2698
IV LV ov •sv
V 20
Fig. 6. Stabilized mean crack spacing versus ftAt/V?, jo•
Ila ^
Its /
II4 'Wmax.5.85xt9" (Mo ^Dfs__
f12
.-110*40%
/ ---- ..- _______ -
• -40%108
-7 1W4/
-
• STAND. ERROR OF EST, 0.00125'"
)o0 'SC) Ivy 13v Gvv c:v avv aav
(At)Af6
fig. 7, Linearized maximum crack width versus net steel stress.
0.1
0,!
-0.,z
• 0.
E0.
x
0.acg 0.rcU
a1
Q 0,
0
38

reinforeement level::= J.4 X W 'i 4g S (Of4)1..31 (7).
A 25 percent band of sc3tt-cv en-velopes all the data for the expression.ir> Eq.. (7) for Af9 20 to 80 ksi.
Linearizing Eq. (7) for easier use bythe design engineer leads to the fol-lowing simplified expression of themaximur crack width at the reinforc-ing steel level:w. = 5.85 X 10- 5 (A7 Io) Ofs (8a)The maximum crack width (in.) at
the tensile face of the concrete is givenby.:,
tp Max = 5.85>< 10-5(R4)(At/o)^s (8b)where R4 is a distance ratio as definedin the notation.
A plot of the data and the best fitexpression for Eq (8a) is given in Fig. 7with a 40 percent spread which is rea-sonable in view of the randomness ofcrack development and the lineariza-tion of the original expression of Eq.
(7).Tables 5 and 6 give the relation be-
tween the observed and theoretical
crack widths at the reinforcing steellevel as well as at the tensile concretefaces of the beams at net stress levelst f s of 30, 40, 60, and 80 ksi.
DeflectionDeflection computations under ser-
vice load conditions will usually benecessary to ensure deflection service-ability in addition to crack control ser-viceability. Since the deflection whichconcerns the design engineer most is aservice load condition, both the nn-cracked and cracked section propertiesare needed11,12 for the computations.An estimate of the magnitude of de-flection can be made from the follow-ing equation:
S c M¢L ?(9)
where c is a constant depending on theloading and support conditions.
Branson's generally accepted11,13,14expression for the effective moment ofinertia Ie is as follows:
Table 6. Observed versus theoretical maximumcr k width at tensile face of beam.
let Steel Stress.4fs.
39 ksi. 40" ksi 60 ksi 80 ksi
Beam Wobs.thea.W . Wobs. W obs- Wibeo. WobS. Webs. WtheO. Wobs. Webs Websc. Wtheo. Wtheo.
.Wtheo.
1 2 3 4 5 6 7 8 9 10 11 12. 13
B-1 .0111 .0731 0.847 .0151 .0175. 0,865 .0261 ..0262 1.000 .0400 .0349:. 1.1.45.6-2 .0127 .0110 , 1.079 .0204 ' .0157 1.299 " .0275 .`9236. 1.108 .0409 .0313 1.309B-3 .0131 .0128 1.022 .0166: .0172 0.971 .0304 .0256, 1.166 .0382 .0344 1.112B-4 .0097 .0130 0.742 .0158 .0174 -. 0.910 : .0226 .0259 :' 0.871 .0304 .0347 0.876B-5 .0091 .0147 0.619 .0117 .0197. 0.595 .0205 .0294 0.698 .0320 .0393, 0.8146-6 .0124 .0148. 0.835 .0181 .0199 0.906 .0213 .0297: ! 0.717 .0364 .0397 0.917B-7 .0052. .0051 1..015 .0068 .0069 0.989 .0117 .0103:" 1.141 .0188 .0137 1.380B-8 .0049 .0051 0,956 .0061 .0069 0.887 .3111 .01.03 1.Q63 .0146 .0137 1.0726-9 .0051 .0045 1.130 .0064 .0061 1.056, .0107 .0090 1..185: .0165 .0121 1.361B-10 .0058 .0045 1.285 .0082 .0061 1.352 .0134 .0090 1,484 .0185. .0121 1.5268-11 .0054 .0059 0,917 .0069 .0079 0.868 .0112 .01.19 0.940 .0172. .0158 1.092B-12 .0048 .0059 0,815 .0076 .0079 0.956 .0134 .0119 1.124 .0192 .0158 1.219B-13 .0043 .0046 0.937 .0058 .0062 0.934 .0105 .0092 1 144 ( .0138 .0123 1.1.23B-14 .0052 .0046 1.133 .0059 .0062 0.950 .0103 .0092 1.122 .0145 .0123 1.180B-15 .0039 .0057 0.682 .0061 .0076 0.805 .011.5 .0114 1.005 .0181 .0153 1.183B-16 .0038 .0057. 0.664 .0057 .0076 0.752 .0093 .0114 0.81.3 .0160 .0153 1.046B-17 .0039 .0056 0.698 .0060 .0074 0.811 .0098 .0112 0.877 .0159 .0148 1.074B-18 .0030 .0056 0.537 .0045 .0074 0,608 .0086 .0112 0,770 .0147 .0148 0.993B-19 .0057 .0061 0.931. .0085 .0081. 1.046. .0129 .0121 1.064 .0202 .0163 1.243B-20 .0034 .0045 0.750 .0045: .0059, 0.760 .0089 .0089 1.000 .0139 .0119 1.161
Mean 0.880- 0.916 1.017 1.141S.D. 0.196. 0.187 0.190 0.174
PCI JOURNAL/May-June 1977, 39

1' = (Mcr)
3 1, +
[i_(Mcr)]1^^ (10)
The cracking moment M0,. of a pre-stressed concrete beam can be com-puted from the following expressionfor evaluating le:
Mc,.=Fe-} AI9 +frl.9 (11)
9y t yt
where Ier and I9 can be calculated fromthe properties of the section. The con-crete modulus of rupture, f, is equal to
7.5a/f. .Eqs. (10) and (11) were applied to
the deflection test results of 19 pre-stressed beams, 13 of which had addi-tional non-prestressed tension steel. Therange of application was from thecracking load level to 90 percent ofthe ultimate load.
Fig. 8 gives a plot of the computedversus measured deflections for theshort-term loadings applied in this in-vestigation. It is noted that the degreeof scatter is within a 20 percent bandwhich can be considered fully ade-quate.
Discussion ofTest Results
It is observed from this investigationthat the initial flexural cracks started ata relatively low net steel stress levelbetween 3 and 8 ksi. These initialcracks formed in a rather random man-ner and with an irregular spacing. Allmajor cracks usually developed at a netsteel stress level of 25 to 30 ksi.
At higher stresses the existing crackswidened and new cracks of narrowwidth usually formed between majorcracks. A visibile stabilized crackingspace condition was generally reached
z
0)z0
t-UWJWWOOWF-a.a00U
MEASURED DEFLECTION (IN.)
Fig. 8. Computed versus measured deflection.
40
8.0
2E 6.0
zUa-'' 4.0UU
VZW 2.02
0.05.0 150 25.0 35.0 45.0 55.0 65.0 75.0
STEEL STRESS ofy (KS I)
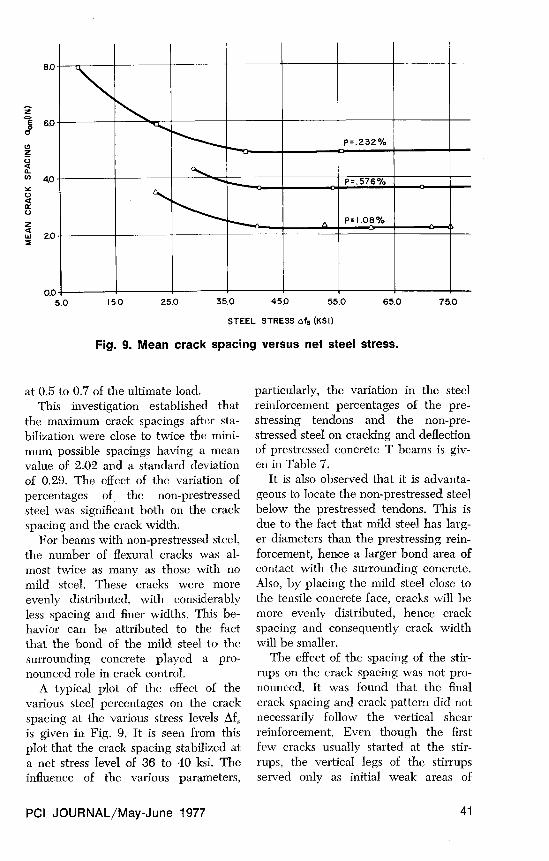
Fig. 9. Mean crack spacing versus net steel stress.
at 0.5 to 0.7 of the ultimate load.This investigation established that
the maximum crack spacings after sta-bilization were close to twice the mini-mum possible spacings having a meanvalue of 2.02 and a standard deviationof 0.29. The effect of the variation ofpercentages of the non-prestressedsteel was significant both on the crackspacing and the crack width.
For beams with non-prestressed steel,the number of flexural cracks was al-most twice as many as those with nomild steel. These cracks were moreevenly distributed, with considerablyless spacing and finer widths. This be-havior can be attributed to the factthat the bond of the mild steel to thesurrounding concrete played a pro-nounced role in crack control.
A typical plot of the effect of thevarious steel percentages on the crackspacing at the various stress levels Of,is given in Fig. 9. It is seen from thisplot that the crack spacing stabilized ata net stress level of 36 to 40 ksi. Theinfluence of the various parameters,
particularly, the variation in the steelreinforcement percentages of the pre-stressing tendons and the non-pre-stressed steel on cracking and deflectionof prestressed concrete T beams is giv-en in Table 7.
It is also observed that it is advanta-geous to locate the non-prestressed steelbelow the prestressed tendons. This isdue to the fact that mild steel has larg-er diameters than the prestressing rein-forcement, hence a larger bond area ofcontact with the surrounding concrete.Also, by placing the mild steel close tothe tensile concrete face, cracks will bemore evenly distributed, hence crackspacing and consequently crack widthwill be smaller.
The effect of the spacing of the stir-rups on the crack spacing was not pro-nounced. It was found that the finalcrack spacing and crack pattern did notnecessarily follow the vertical shearreinforcement. Even though the firstfew cracks usually started at the stir-rups, the vertical legs of the stirrupsserved only as initial weak areas of
PCI JOURNAL/May-June 1977 41

Table 7. Influence of various parameters on crackingand c.1eftection of prestressed concrete T beams.
Beam TenonNon-
PrestressedSteel
Percentageof Tension
Steel
C.G. of steel*(in. from Top
Fiber)Crack
Spacing
Max. Crack Widthat Level of Steelat f5 = 60 ksi
No. ofFlexural
Cracks
MidspanDeflectionat P = lOk
B -1 3-1/4' None 0.17 8.52 6.12 .0198 5 .9508-7 3-1/4" 24 3 0.47 8.75 3.20 .0095 9 .40064 31/4" -2=0 9.47 8,75 2,37 .0089 10 .395
6=2 4.1/4" 588'e 0:23 8,43 5,90 .0172 5 .3908'-9 4-1/4" 2=#3 0,53 8,71 2.85 .0081 10 .3428=10 4-1/4" 2-#3 0.53 8.71 2.76 .0090 10 .350
B-3 5-1/4" None 0.31 8,22 5.60 .0149 6 .320B-11 5-1/4" 2=93 0,60 8.63 2.44 ,00$0 11 .2998-12 5-1/4' 2-03 0.60 8.63 2.47 ,0286 11 .288
B-4 6-1/4" 6689 0.39 8.06 4,89 .0127 7 .2558-- 13 6-1/4" 2-#4 0.91 8.65 2,37 .0077 11 .2288-14 6-1/4' 2-#4 0.91 8.65 2,27 .0080 12 .247
8-5 7-1/4" None 0.48 7.74 4.15 .0108 8 .234B-15 7-1/4" 2-#4 0.99 8,57 2.08 .0077 12 .2118 -16 7=1/4" 2-#4 0.99 8.57 2.25 .0067 12 .207
8-6 0-1/4" Non 0.58 7,44 3.61 .0095 8 .258B-17 8-1/4" 2- 64 1.08 8.49 2.25 .0074 12 .1928-18 8-1/4" 2-#4 1.08 8,49 2,06 .0093 13 ,176
Distance from compression fiber to the center of lAytr of mild reinforcing steel closest to tension fiber.
stress concentration. In most cases, thestabilized mean crack spacings weresmaller than the spacings of stirrups.
Based on these observations and theanalytical results of this investigationit can be said that the proposed equa-tions for crack and deflection controlcan be reasonably applied by the de-sign engineer for maintaining the ser-viceability of pretensioned partiallyprestressed beams and girders underworking load and overload conditions.Once the allowable crack width is es-tablished for the prevailing environ-mental conditions, the proper percent-age of non-prestressing reinforcementcan be determined to ensure service-able behavior. Four design examplesare given in the Appendix to demon-strate the applicability of the proposedcrack width equations.
Conclusions
1. The maximum crack width (in.)at the level of reinforcement closest tothe tensile face can be predicted fromthe expression:
w = 5.85 x 10⁻⁵(A2/I9)f8
The crack width at the outer face ofthe concrete is
W '?vax = tom"Rt
where R4 is the distance ratio.
2. Initial flexural cracks randomlyform at irregular spacings at low netsteel stresses of 3 to 8 ksi. All majorcracks usually develop at a net stress of25 to 30 ksi.
3. Visible crack spacing stabilizes at50 to 70 percent of the ultimate load.
4. The presence of non-prestressedsteel in the prestressed members has asignificant effect on crack control suchthat the cracks become more evenly dis-tributed and the crack spacings andwidths become smaller.
5. An increase in the percentage ofreinforcement decreases substantiallythe crack spacings and width in thepartially prestressed beams.
6. For loads above the first crackingload, the deflections are smaller forprestressed concrete beams containingnon-prestressing reinforcement than fora similar beam without non-prestressedreinforcement.
42

REFERENCES
1. Huang, P. T., "Serviceability Behaviorand Crack Control in Pretensioned Pre-stressed Concrete I- and T-Beams,"PhD Thesis under the direction of thefirst author, Rutgers University, June1975, 338 pp.
2. Nawy, E. C., and Potyondy, J. C.,"Moment Rotation, Cracking and De-flection of Spirally Bound, PretensionedPrestressed Beams," Engineering Re-search Bulletin No. 51, Rutgers Uni-versity, November 1970, 96 pp.
3. Nawy, E. G., and Potyondy, J. C.,"Flexural Cracking Behavior of Pre-tensioned, Prestressed Concrete I- andT-Beams," ACI Journal, ProceedingsV. 68, No. 5, May 1971, pp. 355-360.
4. Nawy, E. G., "Crack Control in Rein-forced Concrete Structures," ACI Jour-nal, Proceedings V. 65, October 1968,pp. 825-836.
5. ACI Committee 224, "Control ofCracking inConcrete Structures, ACIJournal, Proceedings V. 69, No. 12,December 1972, pp. 717-752.
6. Ferry-Borges, J. N., "Preliminary Re-port," Comite Europeen du Beton,Commission IV a—Cracking.
7. Holmberg, A., and Lindgern, S.,"Crack Spacing and Crack Width dueto Normal Force or Bending Mo-ment," Document D2:1970, NationalSwedish Building Research.
8. Holmberg, A., "Flexural CrackWidth," Nordisk Betong, 1970.
9. CEB-FIP, "International Recommen-dations for the Design and Construc-tion of Concrete Structures," ComiteEuropeen du Beton/Federation Inter-nationale de la Precontrainte, Paris(English Edition Published by the Ce-ment and Concrete Association, Lon-don), 1970, pp. 1-80, Appendix V,pp. 1-47.
10. Abeles, P. W., "Design of PartiallyPrestressed Concrete Beams," ACIJournal, Proceedings V. 64, No. 10,October 1967, pp. 669-677.
11. ACI Committee 318, "Building CodeRequirements for Reinforced Con-crete (ACI 318-71)," American Con-crete Institute, Detroit, 1971, 78 pp.
12. ACI Committee 318, "Commentary onthe Building Code Requirements forReinforced Concrete (ACI 318-71C),"American Concrete Institute, Detroit,1971, 96 pp.
13. Branson, D. E., "Instantaneous andTime-Dependent Deflections of Simpleand Continuous Reinforced ConcreteBeams," Part 1, Report No. 7, AlabamaHighway Research Report, Bureau ofPublic Roads, August 1963.
14. PCI Design Handbook—Precast andPrestressed Concrete, Prestressed Con-crete Institute, Chicago, 1971, pp. 1-1to 12-8.
NOTEFour numerical examples showing the appli-cability of the recommended crack widthequations and a notation section, summariz-ing in alphabetical order the meaning of eachmathematical symbol, appear on the next fourpages.
PCI JOURNAL/May-June 1977 43

APPENDIX-DESIGN EXAMPLES
The following design examples areprepared solely to illustrate the appli-cation of the preceding recommendedcrack width equations. In these exam-ples it is assumed that the membergeometry, load condition, stresses intendons and mild steel have been de-fined. Consequently, the detailed mo-ment and stress calculations areomitted.
Example AlA prestressed concrete beam has a T
section as shown in Fig. Al. It is pre-stressed with fifteen 7/16-in. diameter,7-wire strand of 270-kip grade. The loca-tions of neutral axis and center of gravityof steel are shown in the figure. f's, = 5000psi, E, = 57,000V f',, E, = 28,000 psi.
Find the mean stabilized crack spacingand the crack widths at the steel level aswell as at the tensile face of the beam atOfa = 30 ksi. Assume that no failure inshear or bond takes place.(a) Mean stabilized crack spacing
A, = 7 X 14 = 98 sq in.Eo=15,rD
= 15i-(7/16)= 20.62 in.
at, =1.2(A:/yo)= 1.2(98/20.62)=5.7in.
(b) Maximum crack width at steel levelw,naa = 5.85 x 10-s(A, /lo)Ofs
= 5.85 x 10⁻⁶(98/20.62)30= 834.1 x 10 -6 in.-^ 0.0083 in.
(c) Maximum crack width at tensile faceof beam
_ 25 - 10.36R` 25-10.36-3.5
= 1.31
w'„ ax = wma.c R,= 0.0083 X 1.31= 0.011 in.
Example A2For the prestressed beam in Example
Al except that three additional #6 non-prestressed mild steel bars are added asshown in Fig. A2.
Find the crack spacing and crack widthsat Af, = 30 ksi.(a) Mean stabilized crack spacing
A, = 14(3 x 1.75 + 1/ X 7hs+ 13/a)= 14 x 6.84= 95.8 sq in.
Eo=20.62+3X2.36= 27.70 in.
a,, = 1.2(At /mo)= 1.2(95.8/27.7)= 4.15 in.
(b) Maximum crack width at steel levelwmaz = 5.85 X 10⁻⁵(A,/^o)\f,
= 5.85 x 10⁻⁵(95.8/27.7)30= 606.9 X 10⁻⁵- 0.0061 in.
(c) Maximum crack width at tensile faceof beam
25 - 10.6R`= 25-10.6-2.75
= 1.24w'max = wma: R
= 0.0061 X 1.24= 0.007 in.
Example A3A prestressed concrete beam has an I
section as shown in Fig. A3. It is pre-stressed with twenty-four 7/16-in. diam-eter, 7-wire strand of 270-kip grade. Thelocations of neutral axis and center ofgravity of steel are shown in the figure.f', = 5000 psi, E, = 57,000-v f' Es = 28,-000,000 psi.
Find the mean stabilized crack spacingand the crack widths at the steel level aswell as the tensile face of the beam at-Af, = 20 ksi. Assume that no failure inshear or bond takes place.(a) Mean stabilized crack spacing
A,=7X 18 = 126 sq in.Eo = 24irD
= 247r(7/16)= 32.99 in.
ass =1.2(A:/xo)= 1.2(126/32.99)=4.58 in.
44

1 ^
o - o
N N r ^ r ^I
+ ._ _– C.^S. M 1 C..Ci.S_N
I5Ø 15 '07-WIRE STRAND ^j 7-WIRE STRAND l
14" f 3-s 14'—
FIG. At FIG. A2
ri _
5.5' co 5.5' O1
N.A. N.A.MM -_
^ M
24- 16'D 20 6 i7-WIRE STRAND r- 7-WIRE STRAND F-4 -7 —-
FIG. A 3 FIG. A 4
Fig. A. Geometric details of sections in Examples Al to A4.
PCI JOURNAL/May-June 1977 45

(b) Maximum crack width at steel levelw..a, = 5.85 X 10⁻⁵(At/Eo)ofs
= 5.85 x 10⁻⁵(126/32.99)20= 446.9 x 10-== 0.0045 in.
(c) Maximum crack width at tensile faceof beam
_ 36 — 18.72R`- 36-18.72— 3.5
= 1.25w'mz = w„ ar R,
= 0.0045 X 1.25= 0.006 in.
Example A4For the prestressed beam in Example
A3 except that four 7 /16-in. diameter,7-wire strand of 270-kip grade at thebottom row are replaced by four #7 non-prestressed mild steel bars as shown inFig. A4.
Find the crack spacing and crack widthsat \f s = 20 ksi.(a) Mean stabilized crack spacing
At=18X(3X1.75+ 1/2 X 7/16+1%6)= 122.06 sq in.= 20^D + 4 X 2.75=207rX7/6+4x2.75= 38.49 in.
a g = 1.2(At/2o)1.2(122.06/38.49)
= 3.8 in.
(b) Maximum crack width at steel level= 5.85 X 10⁻⁵(A,/Xo)Of,= 5.85 x 10`5(122.06/38.49)20= 371.0 x 10 -5
0.0037 in.(c) Maximum crack width at tensile faceof beam
_ 36 — 19.23R` 36-19.23-2.79
= 1.2w' as = w,naz R,
=0.0037>< 1.2= 0.004 in.
NOTE: From the comparison ofcrack width values at the tensile faceof the concrete, it is noted that evenat the high net stress p fs = 30 ksi, it ispossible to reduce the crack width con-siderably for partially prestressed oroverloaded beams with the addition ofa few mild steel reinforcing bars.
For normal levels of net stress Af 8under working load conditions up to15 to 20 ksi, the crack width level thatcan develop at the tensile face usingthe criteria developed in this papercan become negligible.
NOTATION
Ag = gross area of concrete, sq in. f = a factor reflecting distributionAs = area of steel reinforcement, of bond stress
sq in. = compressive stress in concrete,At = concrete stretched area, name- psi
ly, concrete area in tension, f'0 = cylinder compressive strengthsq in. of concrete, psi
a,s = stabilized mean crack spacing, f' t = tensile splitting strength ofin. concrete, psi
E, = modulus of concrete, psi fa = stress in prestressing steel cor-
= 57,000 V f',_ psi for normal responding to decompressionweight concrete load; ksi
E5 = Young's modulus of steel, ksi ft = stress in prestressing steel atF =, prestressing force in tendon, any load level beyond decom-
kips, lb pression load, ksi
46

= (f, - J,) = net stress in pre-stressing steel, or magnitudeof tensile stress in non-pre-stressing steel at any load level
Jr = modulus of rupture of con-crete, psi, ksi
Icr = cracked moment of inertia, in.4= effective moment of inertia,
in.4
'U = gross moment of inertia, in.4
= effective beam span, ft, in.Ma = maximum service load moment
in span, in.-lb, ft-kips
Urr = cracking moment, in.-lb, ft-kips
10 = sum of reinforcing element cir-
cumferencesRi = ratio of distance from neutral
axis of beam to concrete out-side tension face (h2) to dis-tance from neutral axis to steelreinforcement centroid (h1);value has a range in this in-vestigation from 1.25 to 2.56,
ma,dmum bond stress as a
function of \ff; psimaximum flexural crack widthat steel level, in,maximum flexural crack widthat tensile face of concrete, in,
= unit strain in reinforcement, in.per in,deflection, in.
AcknowledgmentThis investigation is part of a continu-
ing research program on the behavior ofprestressed concrete beams and slabs, ini-tiated by the first author and conducted atthe Concrete Research Laboratories of theDepartment of Civil and EnvironmentalEngineering of Rutgers University—TheState University of New Jersey. The paperis based in part on the PhD thesis of thesecond author under the direction of thefirst.
Discussion of this paper is invited.Please forward your comments toPCI Headquarters by November 1, 1977.
PCI JOURNAL/May-June 1977 47