Country Covered: India Imarc - MarketResearch · other sectors such as credit/debit cards, ......
10
Imarc www.imarcgroup.com Country Covered: India Indian Smart Card Market Report & Forecast: 2011-2016 December 2011 aca Copyright © 2011 International Market Analysis Research & Consulting (IMARC). All Rights Reserved
Transcript of Country Covered: India Imarc - MarketResearch · other sectors such as credit/debit cards, ......
Imarcwww.imarcgroup.com
Country Covered: India
Indian Smart Card Market Report & Forecast: 2011-2016
December 2011
aca
Copyright © 2011 International Market Analysis Research & Consulting (IMARC). All Rights Reserved
IMARC
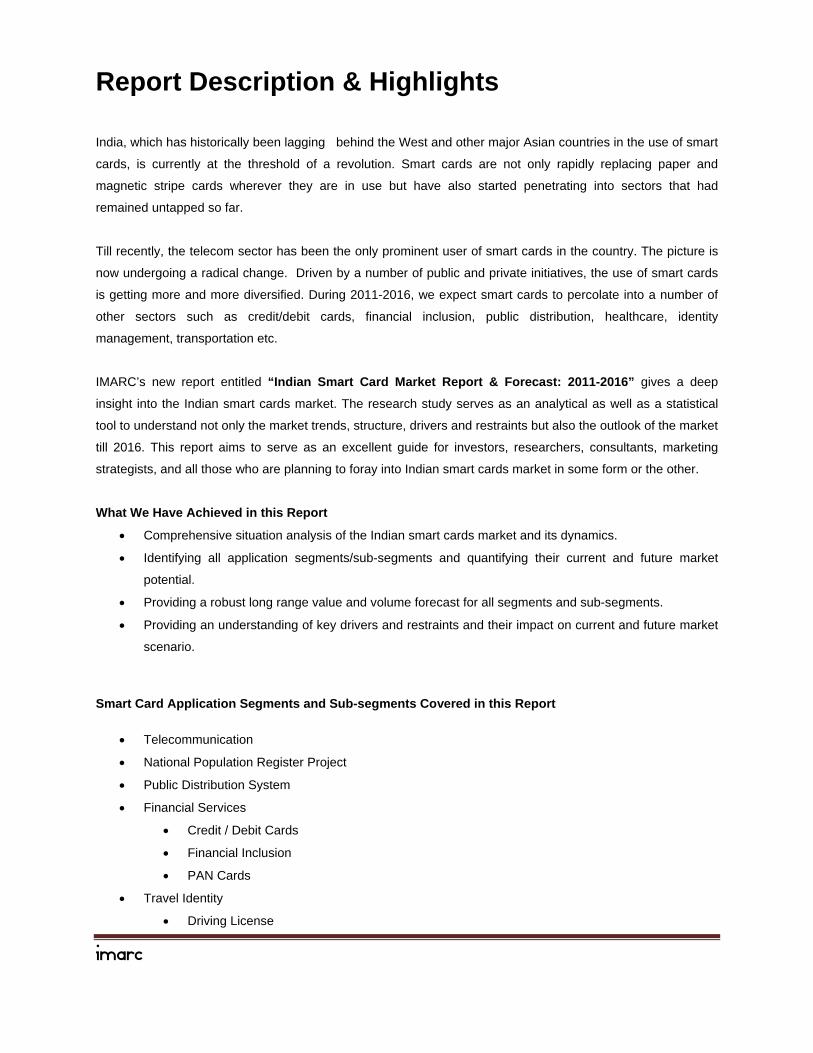
Report Description & Highlights
India, which has historically been lagging behind the West and other major Asian countries in the use of smart
cards, is currently at the threshold of a revolution. Smart cards are not only rapidly replacing paper and
magnetic stripe cards wherever they are in use but have also started penetrating into sectors that had
remained untapped so far.
Till recently, the telecom sector has been the only prominent user of smart cards in the country. The picture is
now undergoing a radical change. Driven by a number of public and private initiatives, the use of smart cards
is getting more and more diversified. During 2011-2016, we expect smart cards to percolate into a number of
other sectors such as credit/debit cards, financial inclusion, public distribution, healthcare, identity
management, transportation etc.
IMARC’s new report entitled “Indian Smart Card Market Report & Forecast: 2011-2016” gives a deep
insight into the Indian smart cards market. The research study serves as an analytical as well as a statistical
tool to understand not only the market trends, structure, drivers and restraints but also the outlook of the market
till 2016. This report aims to serve as an excellent guide for investors, researchers, consultants, marketing
strategists, and all those who are planning to foray into Indian smart cards market in some form or the other.
What We Have Achieved in this Report
Comprehensive situation analysis of the Indian smart cards market and its dynamics.
Identifying all application segments/sub-segments and quantifying their current and future market
potential.
Providing a robust long range value and volume forecast for all segments and sub-segments.
Providing an understanding of key drivers and restraints and their impact on current and future market
scenario.
Smart Card Application Segments and Sub-segments Covered in this Report
Telecommunication
National Population Register Project
Public Distribution System
Financial Services
Credit / Debit Cards
Financial Inclusion
PAN Cards
Travel Identity
Driving License
IMARC
Vehicle Registration Certificates
Passports
Automatic Fare Collection
Metro Rail Projects
Bus Projects
Indian Railways
Healthcare
Rashtriya Swasthya Bima Yojna
Ex-servicemen Contributory Health Scheme
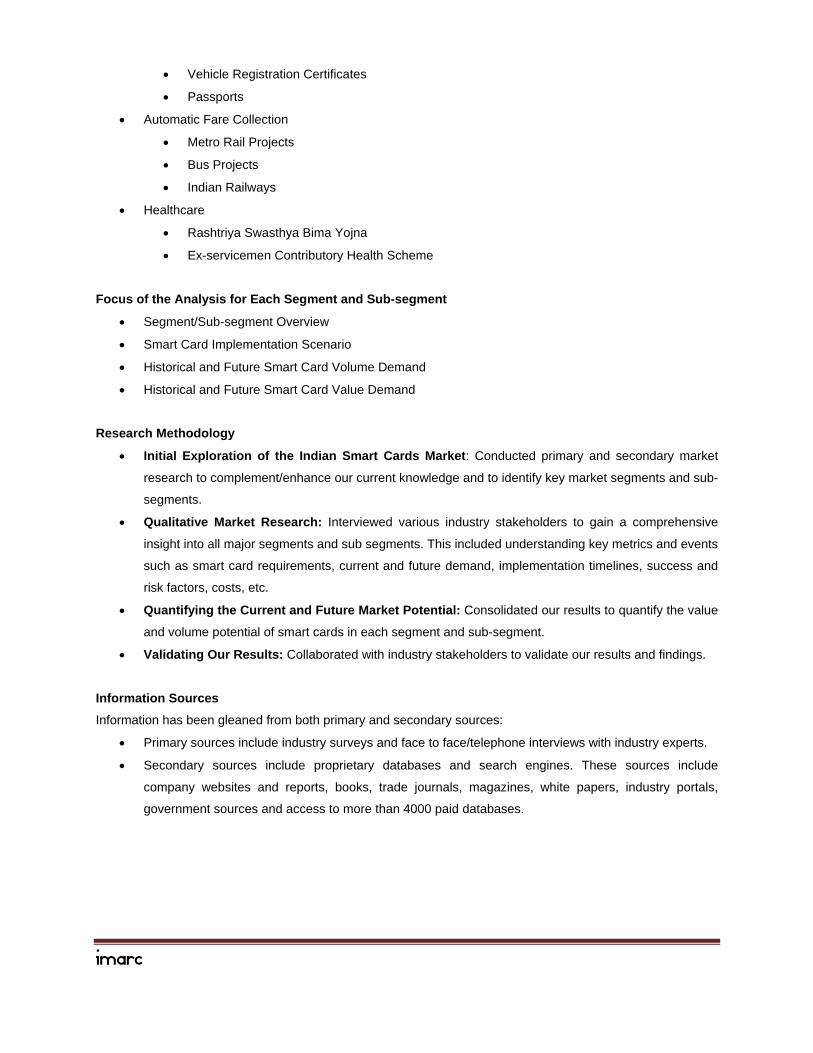
Focus of the Analysis for Each Segment and Sub-segment
Segment/Sub-segment Overview
Smart Card Implementation Scenario
Historical and Future Smart Card Volume Demand
Historical and Future Smart Card Value Demand
Research Methodology
Initial Exploration of the Indian Smart Cards Market: Conducted primary and secondary market
research to complement/enhance our current knowledge and to identify key market segments and sub-
segments.
Qualitative Market Research: Interviewed various industry stakeholders to gain a comprehensive
insight into all major segments and sub segments. This included understanding key metrics and events
such as smart card requirements, current and future demand, implementation timelines, success and
risk factors, costs, etc.
Quantifying the Current and Future Market Potential: Consolidated our results to quantify the value
and volume potential of smart cards in each segment and sub-segment.
Validating Our Results: Collaborated with industry stakeholders to validate our results and findings.
Information Sources
Information has been gleaned from both primary and secondary sources:
Primary sources include industry surveys and face to face/telephone interviews with industry experts.
Secondary sources include proprietary databases and search engines. These sources include
company websites and reports, books, trade journals, magazines, white papers, industry portals,
government sources and access to more than 4000 paid databases.
IMARC
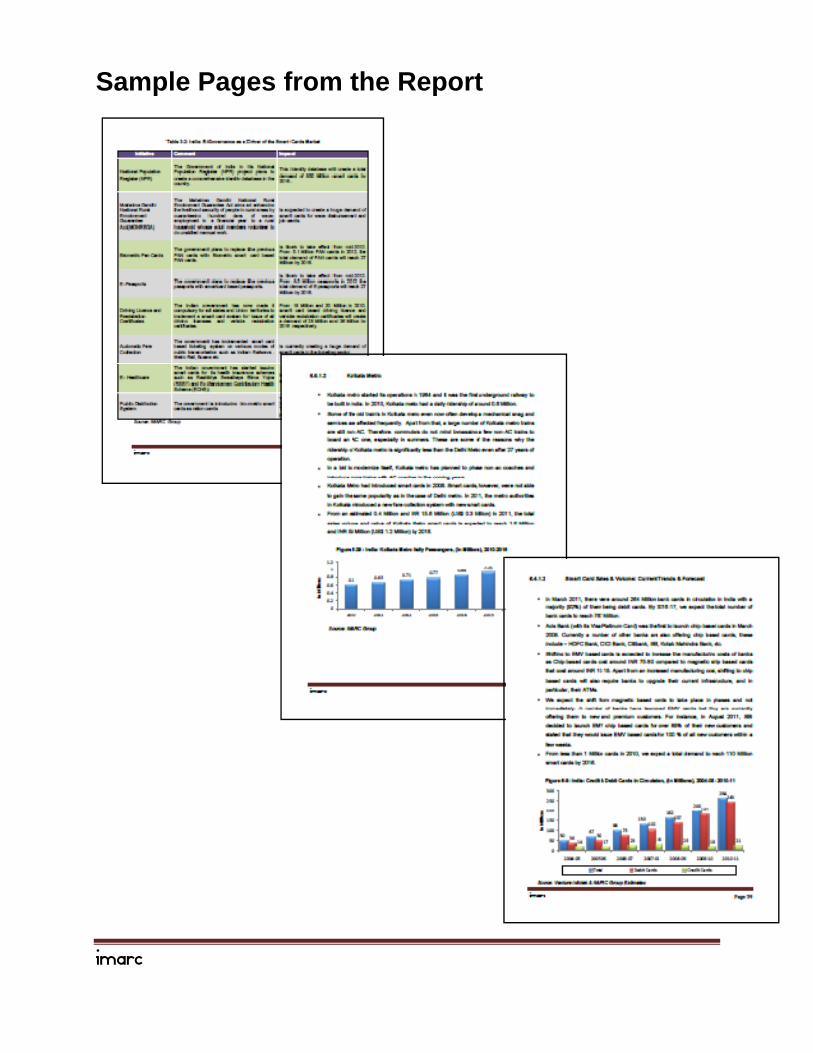
Sample Pages from the Report
IMARC
Table of Contents
1. Research Methodology & Market Definitions .............................................................................................. 11
2. Executive Summary ....................................................................................................................................... 14
3. Why is the Indian Smart Card Market so Lucrative? ................................................................................... 18
3.1 India’s Large Population Provides a Huge Consumer Base for Mass Market Applications .............. 18
3.2 E-Governance Initiatives by the Central & State Governments to Create Huge Opportunities ........ 19
3.3 Modernization of the Transportation Systems will Expand Smartcard Usage ................................... 21
3.4 Untapped Retail & Banking Sectors ....................................................................................................... 22
3.5 Growth in the Country’s GSM Subscribers will Drive Demand in the Telecom Sector ...................... 23
3.6 Adoption of Smart Cards in Identity Management is Increasing ......................................................... 23
4. Challenges Faced by the Indian Smart Card Market ................................................................................... 24
4.1 Technical & Bureaucratic Delays ............................................................................................................ 24
4.2 Infrastructure Constraints ....................................................................................................................... 25
4.3 Limited Awareness .................................................................................................................................. 25
4.4 Declining Prices ....................................................................................................................................... 26
5. Indian Smart Card Market Performance ....................................................................................................... 27
5.1 Current Trends ......................................................................................................................................... 27
5.2 Market Forecast ........................................................................................................................................ 28
6. Market Analysis by Applications .................................................................................................................. 33
6.1 Telecommunication ................................................................................................................................. 33
6.1.1 Overview ............................................................................................................................................ 33
6.1.2 Smart Card Sales & Volume: Current Trends & Forecast .................................................................. 33
6.3 National Population Register .................................................................................................................. 37
6.3.1 Overview ............................................................................................................................................ 37
6.3.2 Smart Card Sales & Volume: Current Trends & Forecast .................................................................. 37
6.4 Financial Services .................................................................................................................................... 40
6.4.1 Credit/Debit Cards ............................................................................................................................. 40
6.4.1.1 Overview ................................................................................................................................... 40
6.4.1.2 Smart Card Sales & Volume: Current Trends & Forecast ......................................................... 41
6.4.2 Financial inclusion .............................................................................................................................. 43
6.4.2.1 Overview ................................................................................................................................... 43
6.4.2.2 Smart Card Sales & Volume: Current Trends & Forecast ......................................................... 44
6.4.3 PAN Cards ......................................................................................................................................... 47
6.4.3.1 Overview ................................................................................................................................... 47
6.4.3.2 Smart Card Sales & Volume: Current Trends & Forecast ......................................................... 47
6.5 Travel Identity ........................................................................................................................................... 49
6.5.1 E-Passports ....................................................................................................................................... 49
IMARC
6.5.1.1 Overview ................................................................................................................................... 49
6.5.1.2 Smart Card Sales & Volume: Current Trends & Forecast ......................................................... 49
6.5.2 Driving License .................................................................................................................................. 52
6.5.2.1 Overview ................................................................................................................................... 52
6.5.2.2 Smart Card Sales & Volume: Current Trends & Forecast ......................................................... 52
6.5.3 Registration Certificates ..................................................................................................................... 54
6.5.3.1 Overview ................................................................................................................................... 54
6.5.3.2 Smart Card Sales & Volume: Current Trends & Forecast ......................................................... 54
6.6 Automatic Fare Collection ....................................................................................................................... 56
6.6.1 Metro Rail Projects ............................................................................................................................. 56
6.6.1.1 Delhi Metro ................................................................................................................................ 56
6.6.1.2 Kolkata Metro ............................................................................................................................ 59
6.6.1.3 Bangalore Metro ........................................................................................................................ 61
6.6.1.4 Mumbai Metro ........................................................................................................................... 63
6.6.1.5 Hyderabad Metro ...................................................................................................................... 65
6.6.1.6 Chennai Metro ........................................................................................................................... 67
6.6.1.7 Other Metro Projects ................................................................................................................. 69
6.6.2 Bus Transportation ............................................................................................................................. 70
6.6.2.1 Ahmedabad Bus Rapid Transport System ................................................................................ 70
6.6.2.2 BEST & NMMT .......................................................................................................................... 72
6.6.3 Indian Railways .................................................................................................................................. 74
6.7 Public Distribution Systems.................................................................................................................... 76
6.7.1 Overview ............................................................................................................................................ 76
6.7.2 Smart Card Sales & Volume: Current Trends & Forecast .................................................................. 77
6.8 Health Care ............................................................................................................................................... 79
6.8.1 Rashtriya Swasthya Bima Yojana ...................................................................................................... 79
6.8.1.1 Overview ................................................................................................................................... 79
6.8.1.2 Smart Card Sales & Volume: Current Trends & Forecast ......................................................... 79
6.8.2 Ex-Servicemen Contributory Health Scheme ..................................................................................... 82
6.8.2.1 Overview ................................................................................................................................... 82
6.8.2.2 Smart Card Sales & Volume: Current Trends & Forecast ......................................................... 82
7. About IMARC Group ...................................................................................................................................... 85
IMARC
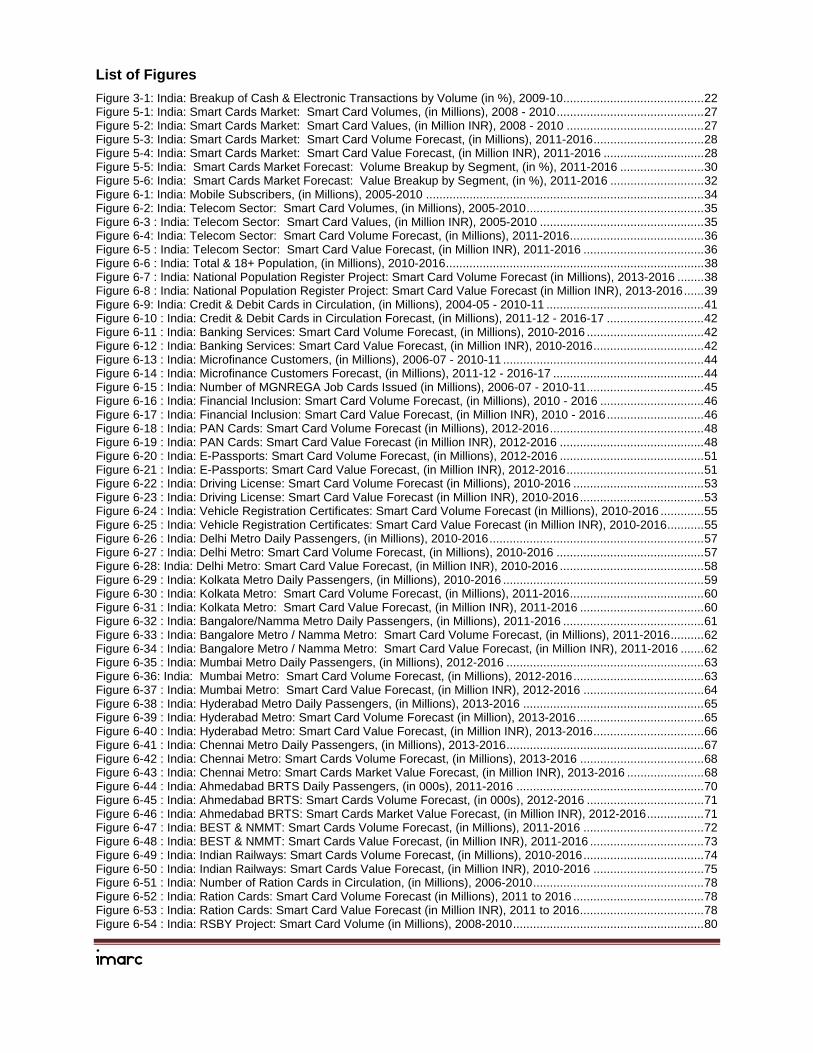
List of Figures
Figure 3-1: India: Breakup of Cash & Electronic Transactions by Volume (in %), 2009-10 .......................................... 22 Figure 5-1: India: Smart Cards Market: Smart Card Volumes, (in Millions), 2008 - 2010 ............................................ 27 Figure 5-2: India: Smart Cards Market: Smart Card Values, (in Million INR), 2008 - 2010 ......................................... 27 Figure 5-3: India: Smart Cards Market: Smart Card Volume Forecast, (in Millions), 2011-2016 ................................. 28 Figure 5-4: India: Smart Cards Market: Smart Card Value Forecast, (in Million INR), 2011-2016 .............................. 28 Figure 5-5: India: Smart Cards Market Forecast: Volume Breakup by Segment, (in %), 2011-2016 ......................... 30 Figure 5-6: India: Smart Cards Market Forecast: Value Breakup by Segment, (in %), 2011-2016 ............................ 32 Figure 6-1: India: Mobile Subscribers, (in Millions), 2005-2010 ................................................................................... 34 Figure 6-2: India: Telecom Sector: Smart Card Volumes, (in Millions), 2005-2010 ..................................................... 35 Figure 6-3 : India: Telecom Sector: Smart Card Values, (in Million INR), 2005-2010 ................................................. 35 Figure 6-4: India: Telecom Sector: Smart Card Volume Forecast, (in Millions), 2011-2016 ........................................ 36 Figure 6-5 : India: Telecom Sector: Smart Card Value Forecast, (in Million INR), 2011-2016 .................................... 36 Figure 6-6 : India: Total & 18+ Population, (in Millions), 2010-2016 ............................................................................. 38 Figure 6-7 : India: National Population Register Project: Smart Card Volume Forecast (in Millions), 2013-2016 ........ 38 Figure 6-8 : India: National Population Register Project: Smart Card Value Forecast (in Million INR), 2013-2016 ...... 39 Figure 6-9: India: Credit & Debit Cards in Circulation, (in Millions), 2004-05 - 2010-11 ............................................... 41 Figure 6-10 : India: Credit & Debit Cards in Circulation Forecast, (in Millions), 2011-12 - 2016-17 ............................. 42 Figure 6-11 : India: Banking Services: Smart Card Volume Forecast, (in Millions), 2010-2016 ................................... 42 Figure 6-12 : India: Banking Services: Smart Card Value Forecast, (in Million INR), 2010-2016 ................................. 42 Figure 6-13 : India: Microfinance Customers, (in Millions), 2006-07 - 2010-11 ............................................................ 44 Figure 6-14 : India: Microfinance Customers Forecast, (in Millions), 2011-12 - 2016-17 ............................................. 44 Figure 6-15 : India: Number of MGNREGA Job Cards Issued (in Millions), 2006-07 - 2010-11 ................................... 45 Figure 6-16 : India: Financial Inclusion: Smart Card Volume Forecast, (in Millions), 2010 - 2016 ............................... 46 Figure 6-17 : India: Financial Inclusion: Smart Card Value Forecast, (in Million INR), 2010 - 2016 ............................. 46 Figure 6-18 : India: PAN Cards: Smart Card Volume Forecast (in Millions), 2012-2016 .............................................. 48 Figure 6-19 : India: PAN Cards: Smart Card Value Forecast (in Million INR), 2012-2016 ........................................... 48 Figure 6-20 : India: E-Passports: Smart Card Volume Forecast, (in Millions), 2012-2016 ........................................... 51 Figure 6-21 : India: E-Passports: Smart Card Value Forecast, (in Million INR), 2012-2016 ......................................... 51 Figure 6-22 : India: Driving License: Smart Card Volume Forecast (in Millions), 2010-2016 ....................................... 53 Figure 6-23 : India: Driving License: Smart Card Value Forecast (in Million INR), 2010-2016 ..................................... 53 Figure 6-24 : India: Vehicle Registration Certificates: Smart Card Volume Forecast (in Millions), 2010-2016 ............. 55 Figure 6-25 : India: Vehicle Registration Certificates: Smart Card Value Forecast (in Million INR), 2010-2016 ........... 55 Figure 6-26 : India: Delhi Metro Daily Passengers, (in Millions), 2010-2016 ................................................................ 57 Figure 6-27 : India: Delhi Metro: Smart Card Volume Forecast, (in Millions), 2010-2016 ............................................ 57 Figure 6-28: India: Delhi Metro: Smart Card Value Forecast, (in Million INR), 2010-2016 ........................................... 58 Figure 6-29 : India: Kolkata Metro Daily Passengers, (in Millions), 2010-2016 ............................................................ 59 Figure 6-30 : India: Kolkata Metro: Smart Card Volume Forecast, (in Millions), 2011-2016 ........................................ 60 Figure 6-31 : India: Kolkata Metro: Smart Card Value Forecast, (in Million INR), 2011-2016 ..................................... 60 Figure 6-32 : India: Bangalore/Namma Metro Daily Passengers, (in Millions), 2011-2016 .......................................... 61 Figure 6-33 : India: Bangalore Metro / Namma Metro: Smart Card Volume Forecast, (in Millions), 2011-2016 .......... 62 Figure 6-34 : India: Bangalore Metro / Namma Metro: Smart Card Value Forecast, (in Million INR), 2011-2016 ....... 62 Figure 6-35 : India: Mumbai Metro Daily Passengers, (in Millions), 2012-2016 ........................................................... 63 Figure 6-36: India: Mumbai Metro: Smart Card Volume Forecast, (in Millions), 2012-2016 ....................................... 63 Figure 6-37 : India: Mumbai Metro: Smart Card Value Forecast, (in Million INR), 2012-2016 .................................... 64 Figure 6-38 : India: Hyderabad Metro Daily Passengers, (in Millions), 2013-2016 ...................................................... 65 Figure 6-39 : India: Hyderabad Metro: Smart Card Volume Forecast (in Million), 2013-2016 ...................................... 65 Figure 6-40 : India: Hyderabad Metro: Smart Card Value Forecast, (in Million INR), 2013-2016 ................................. 66 Figure 6-41 : India: Chennai Metro Daily Passengers, (in Millions), 2013-2016 ........................................................... 67 Figure 6-42 : India: Chennai Metro: Smart Cards Volume Forecast, (in Millions), 2013-2016 ..................................... 68 Figure 6-43 : India: Chennai Metro: Smart Cards Market Value Forecast, (in Million INR), 2013-2016 ....................... 68 Figure 6-44 : India: Ahmedabad BRTS Daily Passengers, (in 000s), 2011-2016 ........................................................ 70 Figure 6-45 : India: Ahmedabad BRTS: Smart Cards Volume Forecast, (in 000s), 2012-2016 ................................... 71 Figure 6-46 : India: Ahmedabad BRTS: Smart Cards Market Value Forecast, (in Million INR), 2012-2016 ................. 71 Figure 6-47 : India: BEST & NMMT: Smart Cards Volume Forecast, (in Millions), 2011-2016 .................................... 72 Figure 6-48 : India: BEST & NMMT: Smart Cards Value Forecast, (in Million INR), 2011-2016 .................................. 73 Figure 6-49 : India: Indian Railways: Smart Cards Volume Forecast, (in Millions), 2010-2016 .................................... 74 Figure 6-50 : India: Indian Railways: Smart Cards Value Forecast, (in Million INR), 2010-2016 ................................. 75 Figure 6-51 : India: Number of Ration Cards in Circulation, (in Millions), 2006-2010 ................................................... 78 Figure 6-52 : India: Ration Cards: Smart Card Volume Forecast (in Millions), 2011 to 2016 ....................................... 78 Figure 6-53 : India: Ration Cards: Smart Card Value Forecast (in Million INR), 2011 to 2016 ..................................... 78 Figure 6-54 : India: RSBY Project: Smart Card Volume (in Millions), 2008-2010 ......................................................... 80

IMARC
Figure 6-55 : India: RSBY Project: Smart Card Value (in Million INR), 2008-2010 ...................................................... 80 Figure 6-56 : India: RSBY Project: Smart Card Volume Forecast (in Millions), 2011-2013 .......................................... 81 Figure 6-57 : India: RSBY Project: Smart Card Value Forecast (in Million INR), 2011-2013 ....................................... 81 Figure 6-58 : India: ECHS Project: Smart Card Volume (in 000s), 2003-2010 ............................................................. 83 Figure 6-59 : India: ECHS Project: Smart Card Volume Forecast (in 000s), 2011-2016 .............................................. 83 Figure 6-60 : India: ECHS Project: Smart Card Value (in Million INR), 2003-2010 ...................................................... 83 Figure 6-61 : India: ECHS Project: Smart Card Value Forecast (in Million INR), 2011-2016 ....................................... 84
IMARC
List of Tables
Table 1-1: India: Smart Card Market Definitions .......................................................................................................... 11 Table 2-1: India: Executive Summary: Smart Card Market Forecast: Volume Breakup by Segment (in Million), 2011-2016 ............................................................................................................................................................................. 16 Table 2-2: India: Executive Summary: Smart Card Market Forecast: Value Breakup by Segment (in Million INR), 2011-2016 .................................................................................................................................................................... 17 Table 3-1: India: Population as a Driver of the Smart Cards Market ............................................................................ 18 Table 3-2: India: E-Governance as a Driver of the Smart Cards Market ...................................................................... 20 Table 3-3: India: Modernization of Transportation as a Driver of the Smart Cards Market ........................................... 21 Table 4-1: India: Smart Card Projects That Have Faced Delays & Bureaucratic Hurdles ............................................ 24 Table 5-1: India: Smart Card Market Forecast: Volume Breakup by Segment (in Million), 2011-2016 ........................ 29 Table 5-2: India: Smart Card Market Forecast: Volume Breakup by Segment (in %), 2011-2016 ............................... 30 Table 5-3: India: Smart Card Market Forecast: Value Breakup by Segment (in Million INR), 2011- ............................ 31 Table 5-4: India: Smart Card Market Forecast: Value Breakup by Segment (in %), 2011-2016 .................................. 32 Table 6-1 : India: Number and Type of PAN Cards Issued Forecast, (in Millions), 2010-2016 .................................... 48 Table 6-2 : India: Number and Type of Passports Issued, (in Millions), 2007-2010 ..................................................... 50 Table 6-3 : India: Number and Type of Passport Issued Forecast, (in Millions), 2011-2016 ........................................ 50 Table 6-4: India: Other Metro Projects ......................................................................................................................... 69
IMARC
About IMARC Group
For more than 5 years, the International Market Analysis Research and Consulting Group has
been a leading advisor on management strategy and market research worldwide. We partner
with clients in all sectors and regions to identify their highest-value opportunities, address their
most critical challenges, and transform their businesses.
IMARC's information products include major market, scientific, economic and technological
developments for business leaders in pharmaceutical, industrial, and high technology
organizations. Market forecasts and industry analysis for biotechnology, advanced materials,
pharmaceuticals, food and beverage, travel and tourism, nanotechnology and novel processing
methods are at the top of the company's expertise.
IMARC’s tailored approach combines unfathomable insight into the dynamics of companies and
markets with close cooperation at all levels of the client organization. This ensures that our
clients achieve unmatchable competitive advantage, build more proficient organizations, and
secure lasting results.


![2019 Christmas Cards - EASE Products...三] I 2019 Christmas Cards Greeting, Mini Cards & Post Cards CONTENTS GREETING CARDS 03 Basic Christmas Cards 05 Import & Turnowsky Christmas](https://static.fdocuments.us/doc/165x107/5f07a85f7e708231d41e157a/2019-christmas-cards-ease-products-i-2019-christmas-cards-greeting-mini.jpg)