Corporate Credit & Issue Rating ŞEKER Finansal Kiralama A ... · Rating Rationale The Turkish...
21
Copyright © 2007 by JCR Eurasia Rating. 19 Mayıs Mah., 19 Mayı s Cad., Nova Baran Plaza No:4 Kat: 12 Şişli-İSTANBUL Telephone: +90(212)352.56.73 Fax: +90 (212) 352.56.75 Reproduction is prohibited except by permission. All rights reserved. All information has been obtained from sources JCR Eurasia Rating believes to be reliable. However, JCR Eurasia Rating does not guarantee the truth, accuracy and adequacy of this information. JCR Eurasia Rating ratings are objective and independent opinions as to the creditworthiness of a security and issuer and not to be considered a recommendation to buy, hold or sell any security or to issue a loan. This rating report has been composed within the methodologies registered with and certified by the SPK (CMB-Capital Markets Board of Turkey), BDDK (BRSA-Banking Regulation and Supervision Agency) and internationally accepted rating principles and guidelines but is not covered by NRSRO regulations. http://www.jcrer.com.tr Corporate Credit & Issue Rating ☐New ☒Update Sector: Leasing Publishing Date: 31/05/2018 Senior Chief Analyst Gökhan İYİGÜN +90 212 352 56 73 [email protected] RATINGS Long Short International Foreign Currency BBB- A-3 Local Currency BBB- A-3 Outlook FC Stable Stable LC Stable Stable Issue Rating BBB- A-3 National Local Rating BBB+ (Trk) A-2 (Trk) Outlook Positive Stable Issue Rating BBB+ (Trk) A-2 (Trk) Sponsor Support 2 - Stand-Alone AB - Sovereign* Foreign Currency BBB- - Local Currency BBB- - Outlook FC Stable - LC Stable - *Affirmed by JCR on November 10, 2017 ŞEKER Finansal Kiralama A.Ş. And Its Subsidiary Company Overview F i n a n c i a l D a t a 1Q2018 2017* 2016* 2015* 2014* 2013* Total Assets (000 USD) 147,998 150,016 142,564 147,366 172,788 187,097 Total Assets (000 TRY) 584,428 565,847 503,506 428,481 400,677 398,592 Equity (000 TRY) 68,247 64,984 64,912 61,462 54,956 49,365 Net Profit (000 TRY) 3,069 5,265 6,864 6,860 5,590 5,248 Market Share (%) 0.95 0.97 1.04 1.05 1.23 1.40 ROAA (%) 0.56 0.74 1.49 1.95 0.80 1.91 ROAE (%) 4.65 6.12 11.02 13.86 6.13 13.87 Equity/Assets (%) 11.68 11.48 12.89 14.34 13.72 12.38 NPL (%) 11.44 11.40 12.67 17.64 14.46 10.17 Growth Rate (%) 14.17 12.38 17.51 6.94 0.52 42.83 * Audited consolidated financial statements Şeker Finansal Kiralama A.Ş. (Şeker Leasing, the Company), offering leasing services for investment support of domestic and international assets and capital goods needed by ‘Small and Medium Size Enterprises’ (SMEs), was founded in 1997 and has been publicly traded since 2004 (with a 12.10% free float including 8.59% repurchased shares of its capital of TL 45mn as of 1Q2018). The Company, one of the four leasing companies listed on the Borsa Istanbul (BIST), performs its activities via its headquarters and regional offices in Ankara, Izmir and Gaziantep as well as in the widespread branch network of Şekerbank T.A.Ş. (the Bank). The Company employed a staff force of 36 people as of 1Q2018. The main shareholder of Şeker Leasing with a 54.13% stake is Şekerbank T.A.Ş. (assigned a long- term national rating of ‘AA-(Trk)’ and a long-term international rating of ‘BBB-’ by JCR Eurasia Rating on September 27, 2017), a mid-scale commercial bank in Turkey. Şekerbank T.A.Ş. Personel Munzam Sosyal Güvenlik ve Yardımlaşma Sandıgı Vakfı (Voluntary Pension Fund) is the ultimate majority shareholder of the Company. The Company has a subsidiary named Sekar Oto Filo Yönetim Hizmetleri ve Ticaret A.Ş. as of the report date. Strengths Constraints Reputable and robust capital structure Diversified and long term weighted borrowing structure, positively differentiating the Company from the short- term sector composition The level of provisions in total income, decreasing below sector averages first time in the review period Improved asset quality Improved and above sector average interest margin and decreased FX position Benefits of being a bank affiliate company High compliance to corporate governance practices Below sector average equity level, common characteristic of bank related companies Deceasing market share regarding asset size in line with the Company’s cautious management strategy Diminished income and pre-tax profit figures resulting in deteriorated profitability indicators Increasing interest and foreign exchange rates environment, potentially tightening the net interest margin Volatilities imposed on non-bank FIs’ asset and net income growth by several incentives such as Credit Guarantee Fund (CGF) 0,97 1,04 1,05 1,23 1,40 0 2 Market Share (%) 12,38 17,51 6,94 12.65 42,83 -50 0 50 Growth Rate (%) 0,74 1,49 1,95 0,80 1,91 0 5 ROAA (%) 6,12 11,02 13,86 6,13 13,87 0 20 ROAE (%) 11,48 12,89 14,34 13,72 12,38 0 20 Equity/Assets (%) 11,4 12,7 17,6 14,5 10,2 0 20 2017 2016 2015 2014 2013 NPL (%)
Transcript of Corporate Credit & Issue Rating ŞEKER Finansal Kiralama A ... · Rating Rationale The Turkish...

Copyright © 2007 by JCR Eurasia Rating. 19 Mayıs Mah., 19 Mayıs Cad., Nova Baran Plaza No:4 Kat: 12 Şişli-İSTANBUL Telephone: +90(212)352.56.73 Fax: +90 (212) 352.56.75 Reproduction is prohibited except by permission. All rights reserved. All information has been obtained from sources JCR Eurasia Rating believes to be reliable. However, JCR Eurasia Rating does not guarantee the truth, accuracy and adequacy of this information. JCR Eurasia Rating ratings are objective and independent opinions as to the creditworthiness of a security and issuer and not to be considered a recommendation to buy, hold or sell any security or to
issue a loan. This rating report has been composed within the methodologies registered with and certified by the SPK (CMB-Capital Markets Board of Turkey), BDDK (BRSA-Banking Regulation and Supervision Agency) and internationally accepted rating principles and guidelines but is not covered by NRSRO regulations. http://www.jcrer.com.tr
Corporate Credit & Issue Rating
☐New ☒Update
Sector: Leasing Publishing Date: 31/05/2018
Senior Chief Analyst Gökhan İYİGÜN +90 212 352 56 73 [email protected]
RATINGS
Long Short
Inte
rnat
iona
l
Foreign Currency BBB- A-3
Local Currency BBB- A-3
Outlook FC Stable Stable
LC Stable Stable Issue Rating BBB- A-3
Nat
iona
l
Local Rating BBB+ (Trk)
A-2 (Trk)
Outlook Positive Stable
Issue Rating BBB+ (Trk)
A-2 (Trk)
Sponsor Support 2 - Stand-Alone AB -
Sove
reig
n* Foreign Currency BBB- -
Local Currency BBB- -
Outlook FC Stable - LC Stable -
*Affirmed by JCR on November 10, 2017
ŞEKER Finansal Kiralama A.Ş. And Its Subsidiary
Company Overview
F i n a n c i a l D a t a 1Q2018 2017* 2016* 2015* 2014* 2013*
Total Assets (000 USD) 147,998 150,016 142,564 147,366 172,788 187,097
Total Assets (000 TRY) 584,428 565,847 503,506 428,481 400,677 398,592
Equity (000 TRY) 68,247 64,984 64,912 61,462 54,956 49,365
Net Profit (000 TRY) 3,069 5,265 6,864 6,860 5,590 5,248
Market Share (%) 0.95 0.97 1.04 1.05 1.23 1.40
ROAA (%) 0.56 0.74 1.49 1.95 0.80 1.91
ROAE (%) 4.65 6.12 11.02 13.86 6.13 13.87
Equity/Assets (%) 11.68 11.48 12.89 14.34 13.72 12.38
NPL (%) 11.44 11.40 12.67 17.64 14.46 10.17
Growth Rate (%) 14.17 12.38 17.51 6.94 0.52 42.83 * Audited consolidated financial statements
Şeker Finansal Kiralama A.Ş. (Şeker Leasing, the Company), offering leasing services for investment support of domestic and international assets and capital goods needed by ‘Small and Medium Size Enterprises’ (SMEs), was founded in 1997 and has been publicly traded since 2004 (with a 12.10% free float including 8.59% repurchased shares of its capital of TL 45mn as of 1Q2018). The Company, one of the four leasing companies listed on the Borsa Istanbul (BIST), performs its activities via its headquarters and regional offices in Ankara, Izmir and Gaziantep as well as in the widespread branch network of Şekerbank T.A.Ş. (the Bank). The Company employed a staff force of 36 people as of 1Q2018. The main shareholder of Şeker Leasing with a 54.13% stake is Şekerbank T.A.Ş. (assigned a long-term national rating of ‘AA-(Trk)’ and a long-term international rating of ‘BBB-’ by JCR Eurasia Rating on September 27, 2017), a mid-scale commercial bank in Turkey. Şekerbank T.A.Ş. Personel Munzam Sosyal Güvenlik ve Yardımlaşma Sandıgı Vakfı (Voluntary Pension Fund) is the ultimate majority shareholder of the Company. The Company has a subsidiary named Sekar Oto Filo Yönetim Hizmetleri ve Ticaret A.Ş. as of the report date.
Strengths Constraints
Reputable and robust capital structure Diversified and long term weighted
borrowing structure, positively differentiating the Company from the short-term sector composition
The level of provisions in total income, decreasing below sector averages first time in the review period
Improved asset quality Improved and above sector average interest
margin and decreased FX position Benefits of being a bank affiliate company High compliance to corporate governance
practices
Below sector average equity level, common characteristic of bank related companies
Deceasing market share regarding asset size in line with the Company’s cautious management strategy
Diminished income and pre-tax profit figures resulting in deteriorated profitability indicators
Increasing interest and foreign exchange rates environment, potentially tightening the net interest margin
Volatilities imposed on non-bank FIs’ asset and net income growth by several incentives such as Credit Guarantee Fund (CGF)
0,971,041,051,231,40
0
2
Market Share (%)
12,3817,516,9412.65
42,83
-50
0
50
Growth Rate (%)
0,741,491,95
0,801,91
0
5
ROAA (%)
6,1211,02
13,86
6,13
13,87
0
20
ROAE (%)
11,4812,8914,3413,7212,38
0
20
Equity/Assets (%)
11,412,717,614,5
10,2
0
20
20172016201520142013
NPL (%)
ŞEKER FİNANSAL KİRALAMA A.Ş. AND ITS SUBSIDIARY 2
1. Rating Rationale The Turkish Leasing Sector has operated under regulations and supervision of the Banking Regulation and Supervision Agency (BRSA) since 2006. The Financial Leasing, Factoring and Financing Companies Act (Law No. 6361) and the regulation regarding organization and operating principals of financial leasing, factoring and financing companies came into force came into force on December 13, 2012 and April 24, 2013, respectively, both contributed positively to the sector trough improved product range, increased ability to represent and efficiency-enhanced processes. According to BRSA statistics updated May 15, 2018, the total asset size of the Turkish Leasing Sector was TRY 61.36bn and involved 25 leasing companies, four of which were listed on Borsa Istanbul (BIST) as of 1Q2018. The Company’s consolidated independent audit reports prepared in conformity with BRSA regulations, BRSA’s year-end and first quarter 2018 sectoral data updated on February 16 and May 15, 2018, respectively, JCR Eurasia Rating’s own studies and records, information and clarifications provided by the Company and non-financial figures constitute the major basis of Şeker Leasing’s ratings. The Company’s balance sheet composition, asset quality, risk management practices, business profile, liquidity management, history in the sector, profitability figures, revenues, debt structure, growth rates, off-balance sheet commitments, and the financial and non-financial positions of the main shareholders were taken into consideration while determining the risk assessment of the long-term international local currency and foreign currency ratings as well as national ratings. Additionally, the long and short-term notes attached for the local and foreign currency dominated debt instrument issuance has been assigned as the same as the Company's Long and Short Term National Local Ratings and country ceiling level, respectively, as there are no additional legal and/or financial collateral guarantees for the repayment of the possible bond/bono to be issued by Şeker Leasing. But, they do not cover any structured finance instruments.
Fundamental rating considerations are as below; Reputable and Robust Shareholding Structure and Benefits of Being a Bank Affiliate Company Şekerbank, a mid-scale commercial bank with paid capital, solo asset size and net profit figures of TRY 1,158mn, TRY 31.35bn and TRY 114.89mn as of FYE2017, respectively,
held the majority stake (54.13%) of the Company shares over the years. Şekerbank T.A.Ş. Personel Munzam Sosyal Güvenlik ve Yardımlaşma Vakfı, majority shareholder of the Şekerbank T.A.Ş. with a 35.44% stake, is the following (15.89) and ultimate majority shareholder of the Company. Accordingly, the Company uses its benefits regarding market recognition, customer base and access network. Diversified and Long Term Weighted Borrowing Structure The short-term weighted borrowing structure is a settled characteristic of the sector over the years with the ratio of “short term borrowings to total assets” ranging between 70.64% and 66.86% over the review period. The stated ratio of the Company exercised below sector average values and ranged between 29.66% and 44.61% in the same period and stabilized at approximately 40%s over the last two years. Funding needs met through debt instrument issuances since 2012 differentiated the Company from the sector by turning its borrowing structure into a long-term weighted dispersion, diversified the funding sources and contributed positively to its funding structure and risk level. Decreased Level of Provisions in Total Income The Company ratio of ‘provisions to total income’ displayed a noteworthy improvement and decreased below the sector average for the first time over the review period. A 42.86% decrease in provisions from TRY 9.8mn to TRY 5.6mn led to stated decrease in the ratio despite a 22.77% decrease in total income and contributed positively to the Company’s profit generation capacity. Improved Asset Quality A 6.47% decrease in overdue loans through cash collections (TRY 2.21mn) and write-off (TRY 11.49mn) together with a (3.93%) increase in gross receivables resulted in a decrease in the Company’s NPL ratio from 12.67% to 11.40% as of FYE2017, contributing positively to the asset quality. Moreover, the Company realized a TRY 8.26mn collection from overdue loans through sale of mortgaged real estate in the first quarter of 2018, contributing positively to future figures regarding profitability and asset quality. Improved and Above Sector Average Interest Margin and Decreased FX Position While the sector’s average interest margin decreased, the Company’s interest margin increased in the last year due to a higher increase in interest rate the Company applied to its earning assets than the increase in interest rate for costly liabilities, thanks to continuing debt instrument issuances in a period where market interest rates tend to rise, leading
ŞEKER FİNANSAL KİRALAMA A.Ş. AND ITS SUBSIDIARY 3
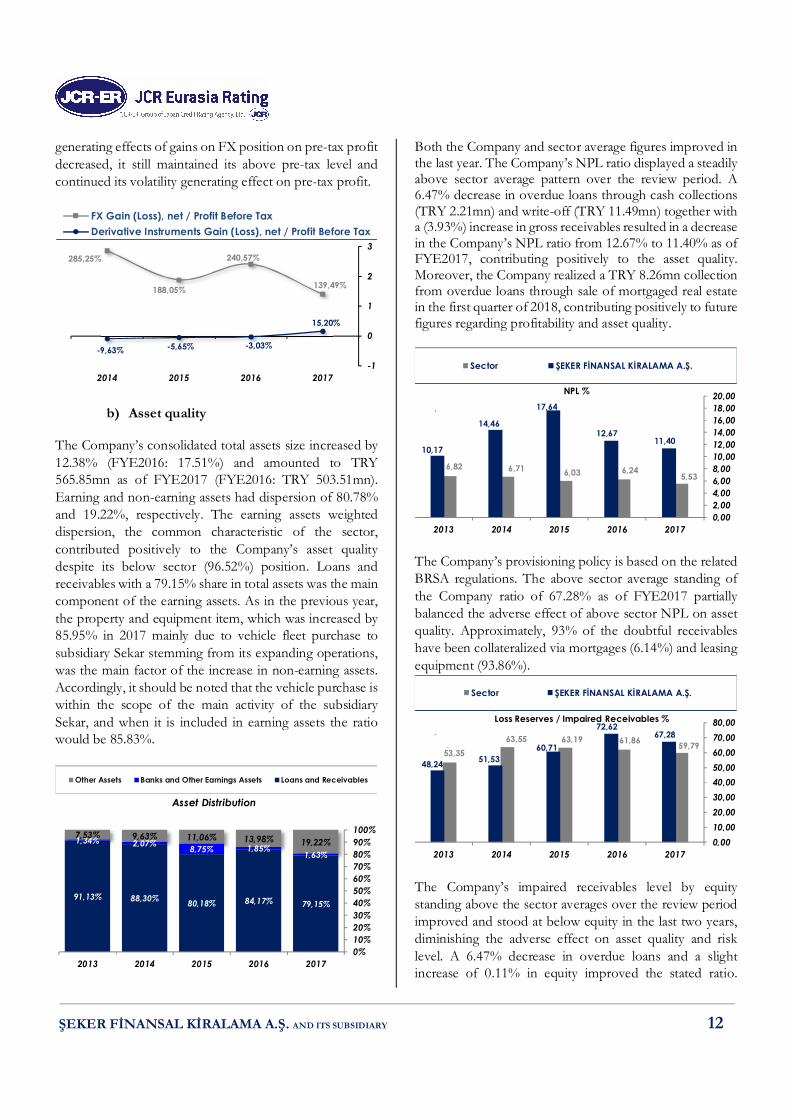
to Company interest margin (2.44%) surpassing again sector average (2.10%) as of FYE2017. The Company materialized TRY 5.54mn FX gain, TRY 604k gain on derivative instruments and TRY 3.97mn pre-tax profit as of FYE2017 (FYE2016: TRY 16.75mn FX gain, TRY 211k loss on derivatives, TRY 6.96mn pre-tax profit). Although the previous years’ volatility potential generating effects of gains on FX position on pre-tax profit decreased, it still maintained its above pre-tax level and continued its volatility generating effect on pre-tax profit. High Compliance to Corporate Governance Principles The Company is one of the few leasing companies listed on the BIST. Consequently, the corporate governance compliance level of the Company is relatively high compared to general sector practices, particularly in the following: presence of two independent members on the Board, establishment of all committees required by the principles (audit, corporate governance and early detection of risk), existence of an effective shareholders relation unit, and comprehensive website. These factors contribute to the Company’s transparency level in the sequel to the risk perception of investors for the Company. Below Sector Equity Level The Company’s standard ratio decreased to 11.48% from 12.89% in 2017 due to a higher increase in total assets (12.38%) than in equity (0.11%). Moreover, it maintained its below sector pattern as previous years and stood at 11.48% against the 14.8% sector figure as of FYE2017. But it should be noted that the comparatively low standard ratio inherits in all bank affiliated financial institutions due to their operating model with comparatively low equity level derived from their ease of access to relatively low-cost funding sources via their shareholding structure. The share buyback program which was launched in October 2016, the dividend payment realized in 2017 and the decreased year-end net profit figure were the main factors of decreasing equity level in the last two years. Additionally, with the board decision dated 19.4.2018, it was decided to increase the Company's paid-in capital by TRY 5mn with cash to be paid by Şekerbank. Downtrend in Market Share The Company and its subsidiary had a total asset size of TRY 565.85mn, corresponding to a 0.97% market share as of FYE2017. Within the consideration of the solo based Company figure, the market share regarding asset size stood at 0.88%. While the sector’s asset growth stayed
almost at the same level of 19%s, the Company’s asset growth decelerated from 17.51% to 12.38% in 2017, suppressing its market share. The consolidated asset size of the Company realized a 14.17% YoY growth and amounted to TRY 584.43mn as of 1Q2018, corresponding to a 0.95% market share. Diminished Income and Pre-tax Profit Figures The Company’s total income and pre-tax profit decreased by 22.77% to TRY 28.97mn and 42.95% to TRY 3.97mn, respectively, as of FYE2017. A 22.06% decrease in other income from operations, particularly a 66.92% decrease in gains from FX position, was the main factor of the decreased total income. As a result of the volatility potential on profitability indicators created by the rising levels of other income from operations in total income in the previous years together with a 40.19% increase in financial expenses resulted in diminished pre-tax profit and deteriorated profitability indicators despite the 29% increase in interest income and 42.86% decrease in provisions. On the other hand, it shoul be noted that the Company generated TRY 3.07mn net profit as of 1Q2018, corresponding to 58.3% of 2017 year-end figure. Impact of Macro-Based Government Incentives Including Credit Guarantee Fund backed Loans on the Non-Bank Financial Sectors Several incentive packages have been initiated so as to tackle economic headwinds in economy, most prominent of which is the CGF backed loans underwritten by the banking sector, exceeding TRY 220bn. While the Fund backed loans provided a much-needed relief to the corporates and supported the loan book and profitability growth of the banks, the non-bank financial sector’s growth acceleration has been somewhat tampered with the influx of additional banking loans. However, given the resource-based constraints on the banks, the expansion of the aforementioned loans is deemed unlikely, potentially helping non-bank financial sectors recover their momentum. Increasing Interest and Foreign Exchange Rates Environment The risk of maturity mismatch mainly derived from the relatively long maturity structure of leasing transactions is the common characteristics of the sector, leading to higher liquidity and interest rate risk exposures compared to other financial sectors. Additionally, a significant part of the sector's transaction volume is realized in foreign currency, leading to foreign currency risk exposure. The Company

ŞEKER FİNANSAL KİRALAMA A.Ş. AND ITS SUBSIDIARY 4
realized steady improvements in its maturity mismatch through long-term foreign currency denominated borrowings, corresponding to approximately 82% of total borrowings, particularly the EUR corresponding to 68% of total, both relieving liquidity management through long-term weighted borrowing structure in contrast to the general composition of the sector and diminishing market risk exposures. With respect to the above-mentioned factors, JCR Eurasia Rating has affirmed the Long Term International Foreign Currency and Local Currency Ratings as ‘BBB-’, the same as that of the Sovereign Ratings of the Republic of Turkey, and the Long Term National Local Ratings as ‘BBB+ (Trk)’ in JCR Eurasia Rating’s notation system, which denotes a satisfactory investment grade.
2. Outlook JCR Eurasia Rating has assigned a ‘Positive’ outlook on the National Long Term Rating perspectives of Şeker Leasing within the considerations of long-term weighted borrowing structure unlike the sector composition achieved through continuing debt instrument issuances relieving liquidity management, improved asset quality through collections from overdue loans and write-off of bad debts, 2018 first-quarter profit figure exceeding half of the 2017 year-end figure, improved profit generation capacity through above sector interest margin and decreased provisions level, board decision regarding TRY 5mn paid capital increase in cash, high collection capability of overdue loans through mortgages at sales phase together with TRY 8.26mn collection in first quarter of 2018 generating potential of positive contribution to future profitability and asset quality, new management approach that cares about bank synergy and possible positive contributions of improvement studies on system infrastructure and revised organizational structure with the addition of asset management, risk monitoring & receivable management and treasury & financial institutions units to risk monitoring and management, reporting and funding processes in future periods. Additionally, JCR Eurasia Rating has affirmed ‘Stable’ outlooks on the international long and short term local currency rating perspectives of Şeker Leasing, respectively, which are the sovereign ratings’ outlooks of the Republic of Turkey.
The main driving forces that can call forth a revision in the short-term regarding the current outlook status include Company related issues affecting asset quality, liability profile and profitability, along with Turkey’s sovereign rating which is highly responsive to domestic and foreign political and economic uncertainties, tensions and developments.
3. Sponsor Support and Stand-Alone Assessment
Sponsor support grades and their risk identifications and estimations reflect the financial and non-financial state and expected support of the Company’s major controlling shareholder, Şekerbank T.A.Ş., and the sector’s support level by public authorities. It is reasoned that Şeker Leasing’s main shareholder, as a mid-scale commercial bank in Turkey with a domestic network of 273 branches as of 1Q2018, has the adequate power, experience and equipment to provide financial and efficient operational support as and when required. In this regard, together with the sector’s support level falling behind the banking sector despite the improvements made through recent legislative regulations and implementations, JCR Eurasia Rating has affirmed the Sponsor Support Grade of ‘2’ reflecting the financial and non-financial states and expected support by the shareholders. The Stand-Alone Grade has been constituted with respect to the Company’s asset size and quality, equity structure, market shares, growth rates, risk management practices, operating history, track records and the development of existing risks in the markets and business environment. Within this context, the Stand Alone Grade of the Company has been affirmed as ‘AB’ in JCR Eurasia Rating’s notation system, with the opinion that Şeker Leasing has the level of strong experience and facilities to manage the incurred risks on its balance sheet without any assistance from its shareholders provided that it improves its market efficiency and pre-tax profit generation capacity.
4. Company Profile
a) History & Activities The Company was founded in 1997 to provide leasing services and has been publicly traded since 2004 under the code of SEKFK. The Company had a 12.10% free float of
ŞEKER FİNANSAL KİRALAMA A.Ş. AND ITS SUBSIDIARY 5
its capital of TRY 45mn as of 1Q2018, of which 8.59% of its shares were repurchased by the Company within the context of regulations regarding ‘liquidity provider’ as of August 19, 2016. The Company has been subject to the “Financial Leasing, Factoring and Financing Companies” Law since December 2012 and conducts its activities within the framework of the provisions of the related Regulation dated April 24, 2013. The Company carries out its leasing services via the widespread branches of Şekerbank, its headquarters and regional offices in Ankara, İzmir, and Gaziantep.
b) Organization & Employees
The organizational chart of the Company has been changed with the board decision dated January 8, 2018. Accordingly, the Company’s organizational chart covers five main units (credits, marketing & sales, treasury & financial institutions, legal affairs, financial & administrative affairs) reporting directly to the general directorate and fifteen subunits, six of which (operation & insurance, accounting, ‘financial control, budget & planning’, IT, human resources, administrative affairs) report to the financial and administrative affairs directorate, three (credit allocation, asset management, risk monitoring & receivables management) to the credits directorate and six (headquarter, three regional directorates, vendor & sales improvement, corporate communications and digital platforms) to the marketing and sales directorate. General directorate and audit committee report directly to the Board. As in the previous year, Şeker Leasing’s Board of Directors was composed of 7 members, including one executive and two independent members. The Audit, Corporate Governance and Early Detection of Risk & Credit committees have been established under the authority of the Board. In line with the related regulations, the Investor Relations Unit operates under the Corporate Governance Committee. The actual labor force of the Company and its subsidiary was 36 as of 1Q2018. As of October 9, 2017, Mr. Burak Latif LATİFOĞLU was appointed as general manager.
Board Members Dr. Hasan Basri GÖKTAN Chairman, Managing Director Canan AYDINOL Vice Chairman
Mehmet YAVUZ Independent Member Yusuf TUNA Independent Member Osman GÖKTAN Member Orhan KARAKAŞ Member Burak Latif LATİFOĞLU Member / General Manager
c) Shareholders, Subsidiaries & Affiliates
The following table provides the Company’s shareholder structure and paid-capital amount over the last three years. Both the paid capital amount and the stakes of majority shareholders have not changed since 2013. Şekerbank T.A.Ş., with paid capital, solo asset size and net profit FYE2017 figures of TRY 1,158mn, TRY 31.35bn and TRY 114.89mn, respectively, held the majority stake of the Company shares over the years.
ŞekerBank was established in 1953 as Pancar Kooperatifleri Bankası A.Ş. and changed its trade name to Şekerbank in 1956. The bank is a medium-scale bank operating in retail and private banking as well as corporate, commercial and small business banking through its 273 domestic branches as of 1Q2018. Bank shares have been publicly traded since 1997 with a free float rate of 34.19%. The Company has a subsidiary with a 99% stake, Sekar Oto Kiralama Turizm Kargo Taşımacılık Hizmeti ve Tic. Ltd.Şti. (Sekar) offering long term car rental services primarily to Şekerbank T.A.Ş. and its subsidiaries and affiliates until mid-2017. With the board decision dated 19.4.2018, it was decided to increase the Company's paid-in capital by TRY 5mn with cash to be paid by Şekerbank. Within the context of regulations regarding ‘liquidity provider’, the Company acquired 8.59% of its shares and the Company’s free float rate was 3.51% as of April 20,
April 20, 2018
2017 2016 2015
Şekerbank T.A.Ş. 54.13 54.13 54.13 54.13Şekerbank T.A.S. Personel Munzam Sosyal Güvenlik ve Yardımlaşma Vakfı 15.89 15.89 15.89 15.89
Şekerbank T.A.S. Personeli Sosyal Güvenlik ve Yardımlaşma Sandığı Vakfı 8.11 8.11 8.11 8.11
Şeker Yatırım Menkul Değerler A.Ş. 9.77 8.05 7.00 6.07Public * 12.10 13.82 14.87 15.80TOTAL 100.00 100.00 100.00 100.00
Paid Capital (TRY/000) 45,000 45,000 45,000 45,000
(*): Repurchased shares (8.59%) are show n in the "Public" section
Şeker Finanasal Kiralama A.Ş. Shareholders Structure (%)
ŞEKER FİNANSAL KİRALAMA A.Ş. AND ITS SUBSIDIARY 6
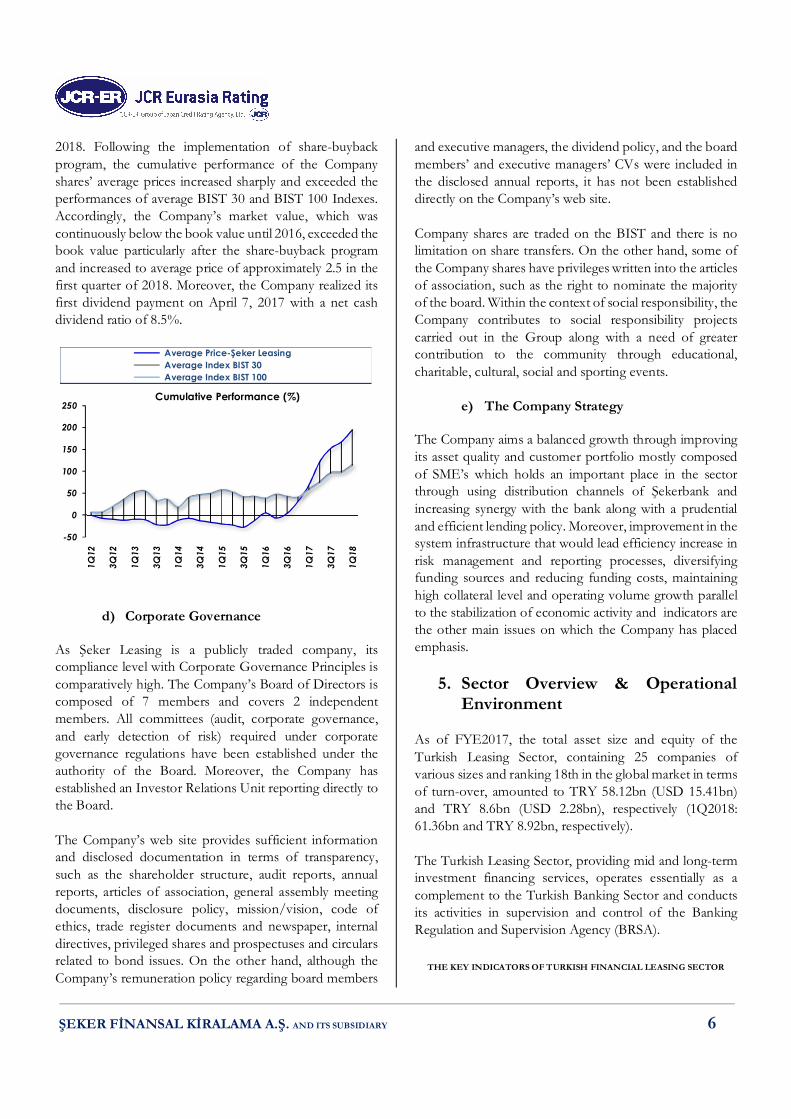
2018. Following the implementation of share-buyback program, the cumulative performance of the Company shares’ average prices increased sharply and exceeded the performances of average BIST 30 and BIST 100 Indexes. Accordingly, the Company’s market value, which was continuously below the book value until 2016, exceeded the book value particularly after the share-buyback program and increased to average price of approximately 2.5 in the first quarter of 2018. Moreover, the Company realized its first dividend payment on April 7, 2017 with a net cash dividend ratio of 8.5%.
d) Corporate Governance
As Şeker Leasing is a publicly traded company, its compliance level with Corporate Governance Principles is comparatively high. The Company’s Board of Directors is composed of 7 members and covers 2 independent members. All committees (audit, corporate governance, and early detection of risk) required under corporate governance regulations have been established under the authority of the Board. Moreover, the Company has established an Investor Relations Unit reporting directly to the Board. The Company’s web site provides sufficient information and disclosed documentation in terms of transparency, such as the shareholder structure, audit reports, annual reports, articles of association, general assembly meeting documents, disclosure policy, mission/vision, code of ethics, trade register documents and newspaper, internal directives, privileged shares and prospectuses and circulars related to bond issues. On the other hand, although the Company’s remuneration policy regarding board members
and executive managers, the dividend policy, and the board members’ and executive managers’ CVs were included in the disclosed annual reports, it has not been established directly on the Company’s web site. Company shares are traded on the BIST and there is no limitation on share transfers. On the other hand, some of the Company shares have privileges written into the articles of association, such as the right to nominate the majority of the board. Within the context of social responsibility, the Company contributes to social responsibility projects carried out in the Group along with a need of greater contribution to the community through educational, charitable, cultural, social and sporting events.
e) The Company Strategy The Company aims a balanced growth through improving its asset quality and customer portfolio mostly composed of SME’s which holds an important place in the sector through using distribution channels of Şekerbank and increasing synergy with the bank along with a prudential and efficient lending policy. Moreover, improvement in the system infrastructure that would lead efficiency increase in risk management and reporting processes, diversifying funding sources and reducing funding costs, maintaining high collateral level and operating volume growth parallel to the stabilization of economic activity and indicators are the other main issues on which the Company has placed emphasis.
5. Sector Overview & Operational Environment
As of FYE2017, the total asset size and equity of the Turkish Leasing Sector, containing 25 companies of various sizes and ranking 18th in the global market in terms of turn-over, amounted to TRY 58.12bn (USD 15.41bn) and TRY 8.6bn (USD 2.28bn), respectively (1Q2018: 61.36bn and TRY 8.92bn, respectively). The Turkish Leasing Sector, providing mid and long-term investment financing services, operates essentially as a complement to the Turkish Banking Sector and conducts its activities in supervision and control of the Banking Regulation and Supervision Agency (BRSA).
THE KEY INDICATORS OF TURKISH FINANCIAL LEASING SECTOR
-50
0
50
100
150
200
250
1Q
12
3Q
12
1Q
13
3Q
13
1Q
14
3Q
14
1Q
15
3Q
15
1Q
16
3Q
16
1Q
17
3Q
17
1Q
18
Cumulative Performance (%)
Average Price-Şeker Leasing Average Index BIST 30 Average Index BIST 100
ŞEKER FİNANSAL KİRALAMA A.Ş. AND ITS SUBSIDIARY 7
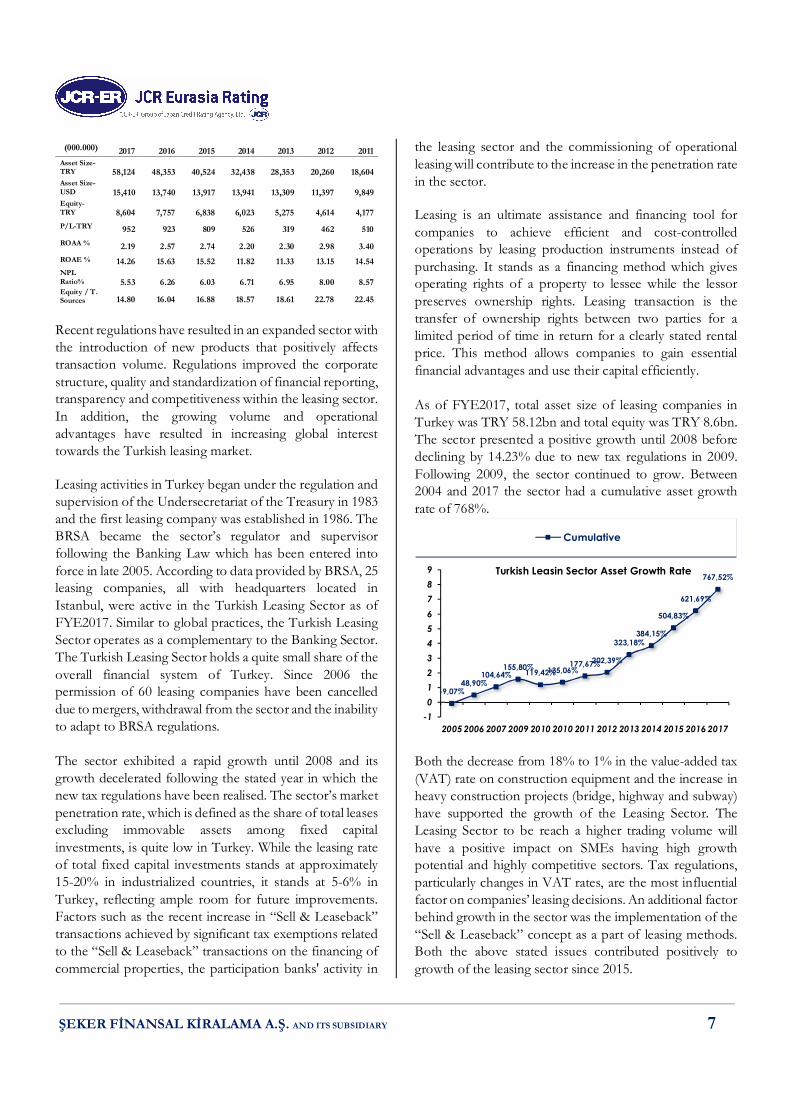
(000.000) 2017 2016 2015 2014 2013 2012 2011 Asset Size-TRY 58,124 48,353 40,524 32,438 28,353
20,260
18,604
Asset Size-USD
15,410 13,740 13,917 13,941 13,309 11,397 9,849
Equity-TRY
8,604 7,757 6,838 6,023 5,275
4,614
4,177
P/L-TRY 952 923 809 526 319 462 510 ROAA % 2.19 2.57 2.74 2.20 2.30 2.98 3.40 ROAE % 14.26 15.63 15.52 11.82 11.33 13.15 14.54 NPL Ratio%
5.53 6.26 6.03 6.71 6.95 8.00 8.57
Equity / T. Sources 14.80 16.04 16.88 18.57 18.61 22.78 22.45
Recent regulations have resulted in an expanded sector with the introduction of new products that positively affects transaction volume. Regulations improved the corporate structure, quality and standardization of financial reporting, transparency and competitiveness within the leasing sector. In addition, the growing volume and operational advantages have resulted in increasing global interest towards the Turkish leasing market. Leasing activities in Turkey began under the regulation and supervision of the Undersecretariat of the Treasury in 1983 and the first leasing company was established in 1986. The BRSA became the sector’s regulator and supervisor following the Banking Law which has been entered into force in late 2005. According to data provided by BRSA, 25 leasing companies, all with headquarters located in Istanbul, were active in the Turkish Leasing Sector as of FYE2017. Similar to global practices, the Turkish Leasing Sector operates as a complementary to the Banking Sector. The Turkish Leasing Sector holds a quite small share of the overall financial system of Turkey. Since 2006 the permission of 60 leasing companies have been cancelled due to mergers, withdrawal from the sector and the inability to adapt to BRSA regulations. The sector exhibited a rapid growth until 2008 and its growth decelerated following the stated year in which the new tax regulations have been realised. The sector’s market penetration rate, which is defined as the share of total leases excluding immovable assets among fixed capital investments, is quite low in Turkey. While the leasing rate of total fixed capital investments stands at approximately 15-20% in industrialized countries, it stands at 5-6% in Turkey, reflecting ample room for future improvements. Factors such as the recent increase in “Sell & Leaseback” transactions achieved by significant tax exemptions related to the “Sell & Leaseback” transactions on the financing of commercial properties, the participation banks' activity in
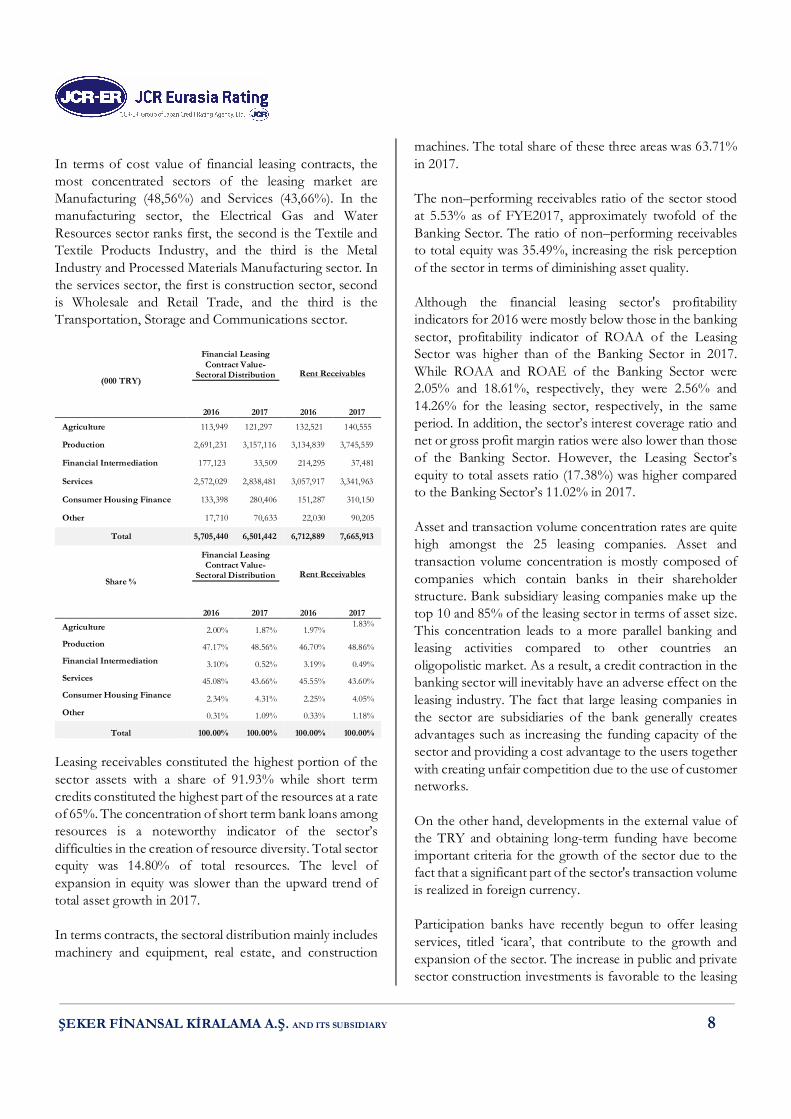
the leasing sector and the commissioning of operational leasing will contribute to the increase in the penetration rate in the sector. Leasing is an ultimate assistance and financing tool for companies to achieve efficient and cost-controlled operations by leasing production instruments instead of purchasing. It stands as a financing method which gives operating rights of a property to lessee while the lessor preserves ownership rights. Leasing transaction is the transfer of ownership rights between two parties for a limited period of time in return for a clearly stated rental price. This method allows companies to gain essential financial advantages and use their capital efficiently. As of FYE2017, total asset size of leasing companies in Turkey was TRY 58.12bn and total equity was TRY 8.6bn. The sector presented a positive growth until 2008 before declining by 14.23% due to new tax regulations in 2009. Following 2009, the sector continued to grow. Between 2004 and 2017 the sector had a cumulative asset growth rate of 768%.
Both the decrease from 18% to 1% in the value-added tax (VAT) rate on construction equipment and the increase in heavy construction projects (bridge, highway and subway) have supported the growth of the Leasing Sector. The Leasing Sector to be reach a higher trading volume will have a positive impact on SMEs having high growth potential and highly competitive sectors. Tax regulations, particularly changes in VAT rates, are the most influential factor on companies’ leasing decisions. An additional factor behind growth in the sector was the implementation of the “Sell & Leaseback” concept as a part of leasing methods. Both the above stated issues contributed positively to growth of the leasing sector since 2015.
-9,07%48,90%
104,64%155,80%119,42%135,06%
177,67%202,39%
323,18%384,15%
504,83%
621,69%
767,52%
-10123456789
2005 2006 2007 2009 2010 2010 2011 2012 2013 2014 2015 2016 2017
Turkish Leasin Sector Asset Growth Rate
Cumulative
ŞEKER FİNANSAL KİRALAMA A.Ş. AND ITS SUBSIDIARY 8
In terms of cost value of financial leasing contracts, the most concentrated sectors of the leasing market are Manufacturing (48,56%) and Services (43,66%). In the manufacturing sector, the Electrical Gas and Water Resources sector ranks first, the second is the Textile and Textile Products Industry, and the third is the Metal Industry and Processed Materials Manufacturing sector. In the services sector, the first is construction sector, second is Wholesale and Retail Trade, and the third is the Transportation, Storage and Communications sector.
(000 TRY)
Financial Leasing Contract Value-
Sectoral Distribution
Rent Receivables
2016 2017 2016 2017 Agriculture 113,949 121,297 132,521 140,555
Production 2,691,231 3,157,116 3,134,839 3,745,559
Financial Intermediation 177,123 33,509 214,295 37,481
Services 2,572,029 2,838,481 3,057,917 3,341,963
Consumer Housing Finance 133,398 280,406 151,287 310,150
Other 17,710 70,633 22,030 90,205
Total 5,705,440 6,501,442 6,712,889 7,665,913
Share %
Financial Leasing Contract Value-
Sectoral Distribution
Rent Receivables
2016 2017 2016 2017 Agriculture 2.00% 1.87% 1.97%
1.83%
Production 47.17% 48.56% 46.70% 48.86% Financial Intermediation 3.10% 0.52% 3.19% 0.49% Services 45.08% 43.66% 45.55% 43.60% Consumer Housing Finance 2.34% 4.31% 2.25% 4.05% Other 0.31% 1.09% 0.33% 1.18%
Total 100.00% 100.00% 100.00% 100.00%
Leasing receivables constituted the highest portion of the sector assets with a share of 91.93% while short term credits constituted the highest part of the resources at a rate of 65%. The concentration of short term bank loans among resources is a noteworthy indicator of the sector’s difficulties in the creation of resource diversity. Total sector equity was 14.80% of total resources. The level of expansion in equity was slower than the upward trend of total asset growth in 2017. In terms contracts, the sectoral distribution mainly includes machinery and equipment, real estate, and construction
machines. The total share of these three areas was 63.71% in 2017. The non–performing receivables ratio of the sector stood at 5.53% as of FYE2017, approximately twofold of the Banking Sector. The ratio of non–performing receivables to total equity was 35.49%, increasing the risk perception of the sector in terms of diminishing asset quality. Although the financial leasing sector's profitability indicators for 2016 were mostly below those in the banking sector, profitability indicator of ROAA of the Leasing Sector was higher than of the Banking Sector in 2017. While ROAA and ROAE of the Banking Sector were 2.05% and 18.61%, respectively, they were 2.56% and 14.26% for the leasing sector, respectively, in the same period. In addition, the sector’s interest coverage ratio and net or gross profit margin ratios were also lower than those of the Banking Sector. However, the Leasing Sector’s equity to total assets ratio (17.38%) was higher compared to the Banking Sector’s 11.02% in 2017. Asset and transaction volume concentration rates are quite high amongst the 25 leasing companies. Asset and transaction volume concentration is mostly composed of companies which contain banks in their shareholder structure. Bank subsidiary leasing companies make up the top 10 and 85% of the leasing sector in terms of asset size. This concentration leads to a more parallel banking and leasing activities compared to other countries an oligopolistic market. As a result, a credit contraction in the banking sector will inevitably have an adverse effect on the leasing industry. The fact that large leasing companies in the sector are subsidiaries of the bank generally creates advantages such as increasing the funding capacity of the sector and providing a cost advantage to the users together with creating unfair competition due to the use of customer networks. On the other hand, developments in the external value of the TRY and obtaining long-term funding have become important criteria for the growth of the sector due to the fact that a significant part of the sector's transaction volume is realized in foreign currency. Participation banks have recently begun to offer leasing services, titled ‘icara’, that contribute to the growth and expansion of the sector. The increase in public and private sector construction investments is favorable to the leasing
ŞEKER FİNANSAL KİRALAMA A.Ş. AND ITS SUBSIDIARY 9
sector. As a matter of fact, business and construction machines are increasing leasing demand and transaction volume considerably and this tendency is still going on. However, the construction industry can be fragile with the economic conjuncture, making the growth of the leasing industry also fragile. Construction and Real Estate Sector in Turkey constitutes half of the overall leasing activities. The fact that the leasing sector is limited to the sectors that move together with the economic conjuncture like construction increases the risk of sustainability. However, Leasing Sector continues its efforts to achieve a wider transaction volume through competitive SMEs and sectors. Investments in renewal and capacity upgrading at macro level, investments in energy and energy efficiency, use of leasing in public investments and the ongoing weight of business and construction machines will be important criteria in 2018 in terms of growth of the leasing sector. The recent decline in real estate transactions and the increase in machinery-equipment transactions are positive trends in terms of productivity. The improvement in the investment environment in 2017, the increase in household consumption expenditures, the recovery in consumer and real sector confidence positively affected the leasing sector. In particular, increases in private sector machinery investments have contributed positively to the development of the industry. In addition, tax advantages, facilitation of collateral systems, reduction of allowance rates have also supported the sector development.
6. Financial Foundation
a) Financial Indicators & Performance i. Indices relating to size
The table below shows the percent dispersion of the activities of Şeker Leasing and its consolidated subsidiary (Sekar) in terms of assets, liabilities and profit/loss. The Contribution of car rental activities increased to above 10% levels in all categories due to both higher growths in assets and liabilities and improved net profit against deteriorated leasing figure. The stated increased contribution of subsidiary (Sekar) derived from its expanding operations including not only the intra-group but the also non-group transactions exceeding the intra-group activity volume.
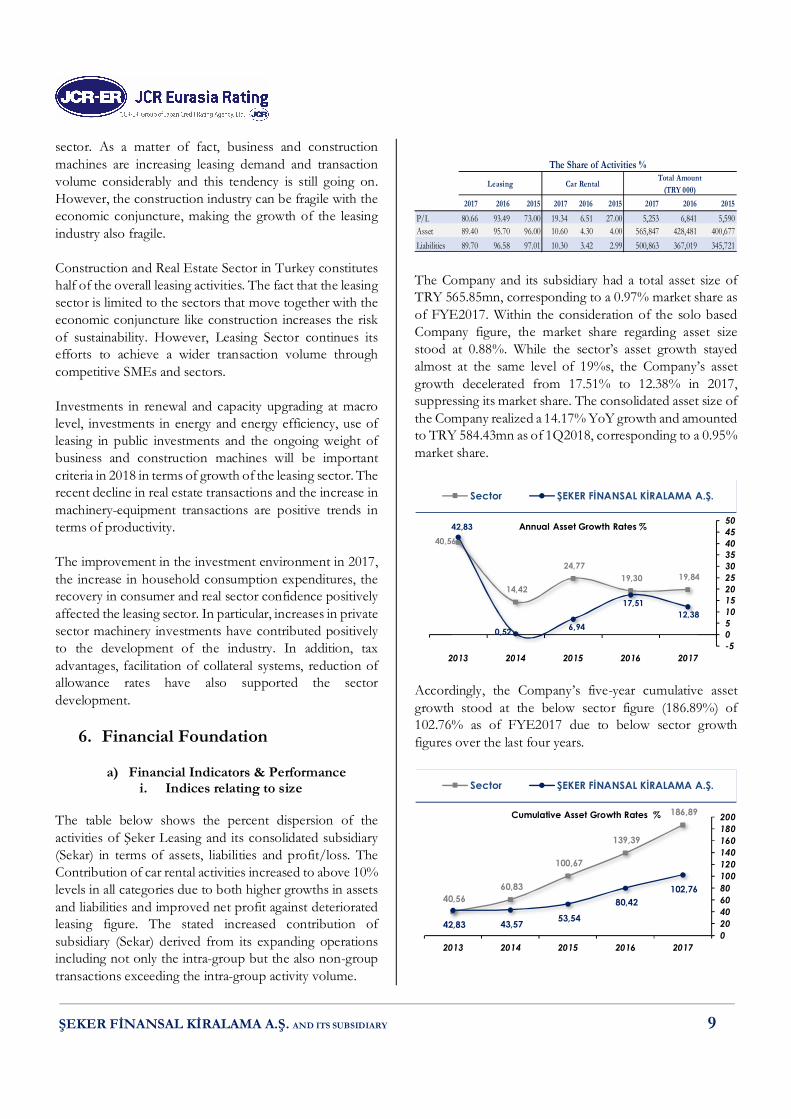
The Company and its subsidiary had a total asset size of TRY 565.85mn, corresponding to a 0.97% market share as of FYE2017. Within the consideration of the solo based Company figure, the market share regarding asset size stood at 0.88%. While the sector’s asset growth stayed almost at the same level of 19%s, the Company’s asset growth decelerated from 17.51% to 12.38% in 2017, suppressing its market share. The consolidated asset size of the Company realized a 14.17% YoY growth and amounted to TRY 584.43mn as of 1Q2018, corresponding to a 0.95% market share.
Accordingly, the Company’s five-year cumulative asset growth stood at the below sector figure (186.89%) of 102.76% as of FYE2017 due to below sector growth figures over the last four years.
2017 2016 2015 2017 2016 2015 2017 2016 2015
P/L 80.66 93.49 73.00 19.34 6.51 27.00 5,253 6,841 5,590 Asset 89.40 95.70 96.00 10.60 4.30 4.00 565,847 428,481 400,677 Liabilities 89.70 96.58 97.01 10.30 3.42 2.99 500,863 367,019 345,721
The Share of Activities %Car Rental
Total Amount (TRY 000)
Leasing
19,84 19,30 24,77
14,42
40,56
12,38 17,51
6,94 0,52
42,83
-505101520253035404550
20172016201520142013
Annual Asset Growth Rates %
Sector ŞEKER FİNANSAL KİRALAMA A.Ş.
186,89
139,39
100,67
60,83 40,56
102,76 80,42
53,54 43,57 42,83 020406080100120140160180200
20172016201520142013
Cumulative Asset Growth Rates %
Sector ŞEKER FİNANSAL KİRALAMA A.Ş.

ŞEKER FİNANSAL KİRALAMA A.Ş. AND ITS SUBSIDIARY 10
Accordingly, the Company’s market share regarding asset size displayed a decreasing trend due to the above stated below sector average growths over the last four years and stood at 0.97% as of FYE2017 and 0.95% as of 1Q2018, the lowest figures over the last five years.
Lower increase of 0.11% in equity than 17.88% in borrowings together with decreases in payables and non-costly liabilities resulted in an increase in borrowings level and decreases in the levels of other resources. The Company’s equity level in its resource distribution decreased from 14.34% in 2015 to 11.48% in 2017. While the share buy-back program that was launched in October 2016 was the main factor of equity level decrease in 2016, a TRY 5.2mn dividend payment in 2017 was for the last year.
ii. Indices relating to profitability Both the Company and sector profitability ratios ROAA and ROAE deteriorated in the last year and the Company ratios continued to stay below the sector averages. Although the Company’s gross operating profit stayed approximately at the same level of previous year figure and the provisions for impaired receivables and operating expenses decreased by 42.86% and 5.54%, respectively, the
decreased other revenues from operations and the mitigating effect of deferred taxes led to a 42.95% decrease in pre-tax profit against increases of 14.74% and 2.79% in average total assets and equity, respectively, resulting in deterioration in the Company’s profitability ratios ROAA and ROAE.
While the sector’s average interest margin decreased, the Company’s interest margin increased in the last year due to a higher increase in interest rate the Company applied to its earning assets than the increase in interest rate for costly liabilities, thanks to continuing debt instrument issuances in a period where market interest rates tend to rise, leading to Company interest margin (2.44%) surpassing again sector average (2.10%) as of FYE2017. Accordingly, although the Company’s operating volume decreased from TRY 169.56mn to TRY 145.62mn, its lease income increased from TRY 40.16mn to 51.81mn in the last year.
The trend lines representing the shares of the two main revenue streams, the net interest and commission income and the other income from operations, that make up the Company’s total revenue, exhibited an almost equal pattern
0,971,041,05
1,23
1,40
0,30
0,60
0,90
1,20
1,50
20172016201520142013
Market Share % Trend Line
4,615,762,522,543,85
83,4079,5182,3782,5982,91
0,501,840,761,150,8611,4812,8914,3413,7212,38
0%10%20%30%40%50%60%70%80%90%100%
20172016201520142013
Resource Distribution %
Equity Non-Costly Liabilities Financial Borrowing Payables
0,741,491,950,80
1,91
2,192,562,732,192…
6,12
11,0213,86
6,13
13,8714,2215,4815,32
11,6911,40
024681012141618
20172016201520142013
ROAA % ŞEKER FİNANSAL KİRALAMA A.Ş.ROAA % SECTORROAE % ŞEKER FİNANSAL KİRALAMA A.Ş.ROAE % SECTOR
9,20 7,68 7,16 7,76
6,56
11,64
9,87 10,29 11,46 11,04
2,44
2,19
3,13 3,69 4,47
2,10
2,45
2,61 2,71 3,25
0
2
4
6
8
10
12
14
20172016201520142013
Interest Rate for Costly Liabilities (avg.) %Interest Rate for Earning Assets (avg.) %Interest Margin %Sector Margin %
ŞEKER FİNANSAL KİRALAMA A.Ş. AND ITS SUBSIDIARY 11
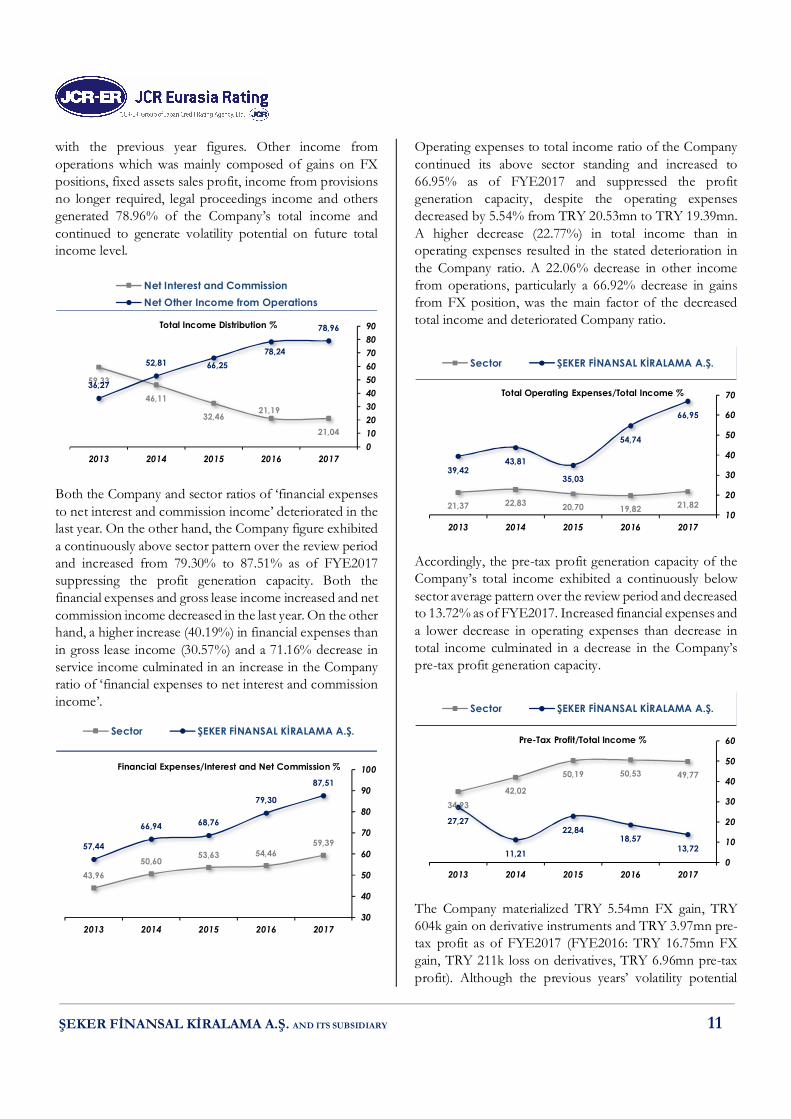
with the previous year figures. Other income from operations which was mainly composed of gains on FX positions, fixed assets sales profit, income from provisions no longer required, legal proceedings income and others generated 78.96% of the Company’s total income and continued to generate volatility potential on future total income level.
Both the Company and sector ratios of ‘financial expenses to net interest and commission income’ deteriorated in the last year. On the other hand, the Company figure exhibited a continuously above sector pattern over the review period and increased from 79.30% to 87.51% as of FYE2017 suppressing the profit generation capacity. Both the financial expenses and gross lease income increased and net commission income decreased in the last year. On the other hand, a higher increase (40.19%) in financial expenses than in gross lease income (30.57%) and a 71.16% decrease in service income culminated in an increase in the Company ratio of ‘financial expenses to net interest and commission income’.
Operating expenses to total income ratio of the Company continued its above sector standing and increased to 66.95% as of FYE2017 and suppressed the profit generation capacity, despite the operating expenses decreased by 5.54% from TRY 20.53mn to TRY 19.39mn. A higher decrease (22.77%) in total income than in operating expenses resulted in the stated deterioration in the Company ratio. A 22.06% decrease in other income from operations, particularly a 66.92% decrease in gains from FX position, was the main factor of the decreased total income and deteriorated Company ratio.
Accordingly, the pre-tax profit generation capacity of the Company’s total income exhibited a continuously below sector average pattern over the review period and decreased to 13.72% as of FYE2017. Increased financial expenses and a lower decrease in operating expenses than decrease in total income culminated in a decrease in the Company’s pre-tax profit generation capacity.
The Company materialized TRY 5.54mn FX gain, TRY 604k gain on derivative instruments and TRY 3.97mn pre-tax profit as of FYE2017 (FYE2016: TRY 16.75mn FX gain, TRY 211k loss on derivatives, TRY 6.96mn pre-tax profit). Although the previous years’ volatility potential
21,04
21,1932,46
46,11
59,33
78,96
78,2466,2552,81
36,27
0102030405060708090
20172016201520142013
Total Income Distribution %
Net Interest and CommissionNet Other Income from Operations
59,3954,4653,63
50,6043,96
87,51
79,30
68,7666,94
57,44
30
40
50
60
70
80
90
100
20172016201520142013
Financial Expenses/Interest and Net Commission %
Sector ŞEKER FİNANSAL KİRALAMA A.Ş.
21,8219,8220,7022,8321,37
66,95
54,74
35,03
43,8139,42
10
20
30
40
50
60
70
20172016201520142013
Total Operating Expenses/Total Income %
Sector ŞEKER FİNANSAL KİRALAMA A.Ş.
49,7750,5350,19
42,0234,93
13,7218,57
22,84
11,21
27,27
0
10
20
30
40
50
60
20172016201520142013
Pre-Tax Profit/Total Income %
Sector ŞEKER FİNANSAL KİRALAMA A.Ş.
ŞEKER FİNANSAL KİRALAMA A.Ş. AND ITS SUBSIDIARY 12
generating effects of gains on FX position on pre-tax profit decreased, it still maintained its above pre-tax level and continued its volatility generating effect on pre-tax profit.
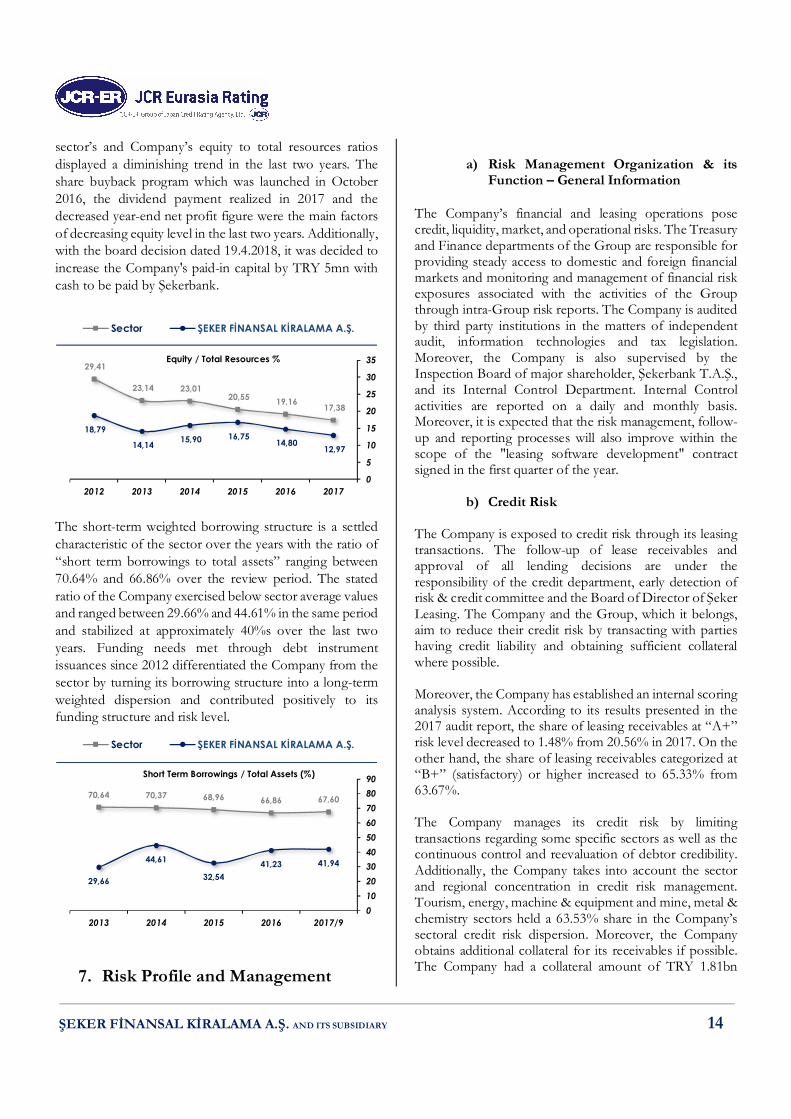
b) Asset quality The Company’s consolidated total assets size increased by 12.38% (FYE2016: 17.51%) and amounted to TRY 565.85mn as of FYE2017 (FYE2016: TRY 503.51mn). Earning and non-earning assets had dispersion of 80.78% and 19.22%, respectively. The earning assets weighted dispersion, the common characteristic of the sector, contributed positively to the Company’s asset quality despite its below sector (96.52%) position. Loans and receivables with a 79.15% share in total assets was the main component of the earning assets. As in the previous year, the property and equipment item, which was increased by 85.95% in 2017 mainly due to vehicle fleet purchase to subsidiary Sekar stemming from its expanding operations, was the main factor of the increase in non-earning assets. Accordingly, it should be noted that the vehicle purchase is within the scope of the main activity of the subsidiary Sekar, and when it is included in earning assets the ratio would be 85.83%.
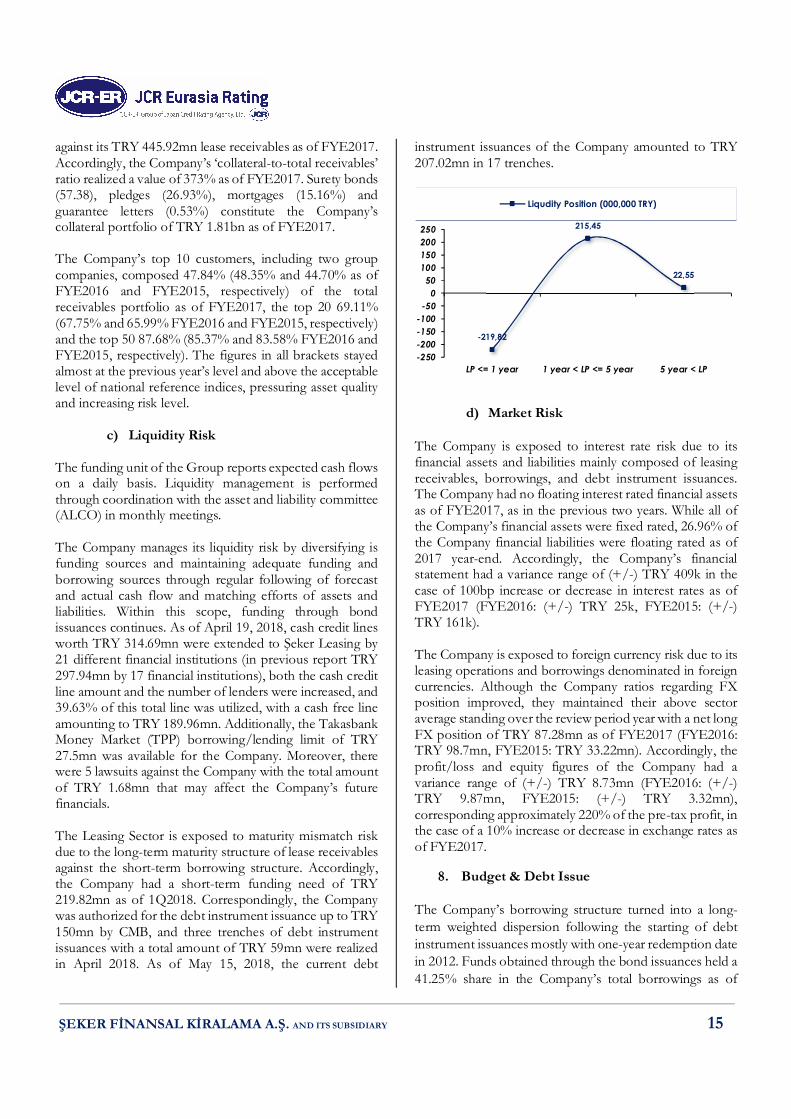
Both the Company and sector average figures improved in the last year. The Company’s NPL ratio displayed a steadily above sector average pattern over the review period. A 6.47% decrease in overdue loans through cash collections (TRY 2.21mn) and write-off (TRY 11.49mn) together with a (3.93%) increase in gross receivables resulted in a decrease in the Company’s NPL ratio from 12.67% to 11.40% as of FYE2017, contributing positively to the asset quality. Moreover, the Company realized a TRY 8.26mn collection from overdue loans through sale of mortgaged real estate in the first quarter of 2018, contributing positively to future figures regarding profitability and asset quality.
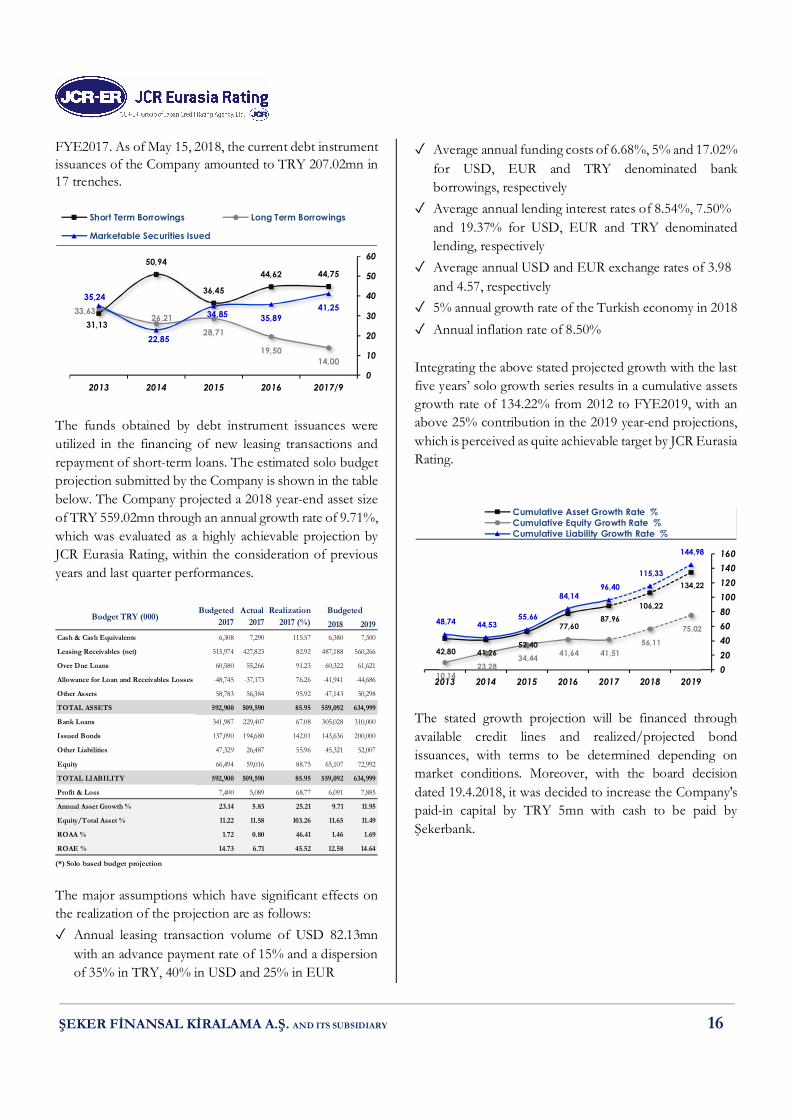
The Company’s provisioning policy is based on the related BRSA regulations. The above sector average standing of the Company ratio of 67.28% as of FYE2017 partially balanced the adverse effect of above sector NPL on asset quality. Approximately, 93% of the doubtful receivables have been collateralized via mortgages (6.14%) and leasing equipment (93.86%).
The Company’s impaired receivables level by equity standing above the sector averages over the review period improved and stood at below equity in the last two years, diminishing the adverse effect on asset quality and risk level. A 6.47% decrease in overdue loans and a slight increase of 0.11% in equity improved the stated ratio.
139,49%
240,57%
188,05%
285,25%
15,20%
-3,03%-5,65%-9,63%
-1
0
1
2
3
2017201620152014
FX Gain (Loss), net / Profit Before TaxDerivative Instruments Gain (Loss), net / Profit Before Tax
79,15%84,17%80,18%88,30%91,13%
1,63%1,85%8,75%2,07%1,34% 19,22%13,98%11,06%9,63%7,53%
0%10%20%30%40%50%60%70%80%90%100%
20172016201520142013
Asset Distribution
Other Assets Banks and Other Earnings Assets Loans and Receivables
5,53 6,24 6,03 6,71 6,82
11,40 12,67
17,64
14,46
10,17
0,002,004,006,008,0010,0012,0014,0016,0018,0020,00
20172016201520142013
NPL %
Sector ŞEKER FİNANSAL KİRALAMA A.Ş.
59,79 61,86 63,19 63,55 53,35
67,28 72,62
60,71 51,53 48,24
0,0010,0020,0030,0040,0050,0060,0070,0080,00
20172016201520142013
Loss Reserves / Impaired Receivables %
Sector ŞEKER FİNANSAL KİRALAMA A.Ş.

ŞEKER FİNANSAL KİRALAMA A.Ş. AND ITS SUBSIDIARY 13
Moreover, it is envisaged by the Company that the stated ratio will continue to improve in the upcoming periods through collections from impaired receivables.
The commodities subject to leasing transactions form the basic guarantee of the leasing companies’ undertaken risk. Additionally, the Company obtain sufficient collateral where appropriate. The Company’s ‘collateral-to-total receivables’ ratio displayed an above reference values and ranged between 241.44% and 373% over the review period, ensuring full coverage and diminishing the adverse effects of the above sector NPL ratio on asset quality. Surety bonds (57.38), pledges (26.93%), mortgages (15.16%) and guarantee letters (0.53%) constitute the Company’s collateral portfolio of TRY 1.81bn as of FYE2017. Additionally, the Company foresees 80-90% collection ability considering the current collaterals of doubtful receivables.
The Company ratio of ‘provisions to total income’ displayed a noteworthy improvement and decreased below the sector average for the first time over the review period. A 42.86% decrease in provisions from TRY 9.8mn to TRY 5.6mn despite a 22.77% decrease in total income led to above stated decrease in the ratio and contributed positively to the Company’s profit generation capacity.
c) Funding & Adequacy of Capital
The BRSA regulation related to the leasing companies’ equity level states that the standard ratio (equity to total assets) of them should be at least 3%. The Company’s standard ratio decreased to 11.48% from 12.89% in 2017 due to a higher increase in total assets (12.38%) than in equity (0.11%). Additionally, it maintained its below sector pattern as previous years and stood at 11.48% against the 14.8% sector figure as of FYE2017. But it should be noted that the comparatively low standard ratio inherits in all bank related non-bank financial institutions due to their operating model with comparatively low equity level derived from their ease of access to relatively low-cost funding sources via their shareholding structure.
As stated above, the comparatively low equity level, in other words a comparatively high leverage ratio, and relatively broad funding opportunities at favorable costs are the common characteristics of the bank related non-banking financial institutions differentiating them from other sector players. Accordingly, the Company figure stood at sector averages over the review period. Both the
35,49 37,68 33,99 34,78 34,16
85,09 91,08 110,42 100,60
78,70
0,0020,0040,0060,0080,00100,00120,00140,00
20172016201520142013
Impaired Receivables / Equity %
Sector ŞEKER FİNANSAL KİRALAMA A.Ş.
373,00
308,25
248,73264,12241,44
050100150200250300350400
20172016201520142013
Collaterals / Total Receivables %
27,95
23,7120,21
33,58
25,0619,94
19,3326,13
40,8443,90
28,9121,03
0
10
20
30
40
50
60
70
201720162015201420132012
Sector ŞEKER FİNANSAL KİRALAMA A.Ş.
Provisions / Total Income (%)
3,00 3,00 3,00 3,00 3,00 3,00
8,48 9,89
11,34 10,72 9,38
12,82 11,48
12,89 14,34 13,72
12,38
15,82
024681012141618
201720162015201420132012
Standard Ratio (Equity / Total Assets) %Free Equity / Total Assets Ratio %Realized Equity / Total Assets Ratio %
ŞEKER FİNANSAL KİRALAMA A.Ş. AND ITS SUBSIDIARY 14
sector’s and Company’s equity to total resources ratios displayed a diminishing trend in the last two years. The share buyback program which was launched in October 2016, the dividend payment realized in 2017 and the decreased year-end net profit figure were the main factors of decreasing equity level in the last two years. Additionally, with the board decision dated 19.4.2018, it was decided to increase the Company's paid-in capital by TRY 5mn with cash to be paid by Şekerbank.
The short-term weighted borrowing structure is a settled characteristic of the sector over the years with the ratio of “short term borrowings to total assets” ranging between 70.64% and 66.86% over the review period. The stated ratio of the Company exercised below sector average values and ranged between 29.66% and 44.61% in the same period and stabilized at approximately 40%s over the last two years. Funding needs met through debt instrument issuances since 2012 differentiated the Company from the sector by turning its borrowing structure into a long-term weighted dispersion and contributed positively to its funding structure and risk level.
7. Risk Profile and Management
a) Risk Management Organization & its
Function – General Information The Company’s financial and leasing operations pose credit, liquidity, market, and operational risks. The Treasury and Finance departments of the Group are responsible for providing steady access to domestic and foreign financial markets and monitoring and management of financial risk exposures associated with the activities of the Group through intra-Group risk reports. The Company is audited by third party institutions in the matters of independent audit, information technologies and tax legislation. Moreover, the Company is also supervised by the Inspection Board of major shareholder, Şekerbank T.A.Ş., and its Internal Control Department. Internal Control activities are reported on a daily and monthly basis. Moreover, it is expected that the risk management, follow-up and reporting processes will also improve within the scope of the "leasing software development" contract signed in the first quarter of the year.
b) Credit Risk The Company is exposed to credit risk through its leasing transactions. The follow-up of lease receivables and approval of all lending decisions are under the responsibility of the credit department, early detection of risk & credit committee and the Board of Director of Şeker Leasing. The Company and the Group, which it belongs, aim to reduce their credit risk by transacting with parties having credit liability and obtaining sufficient collateral where possible. Moreover, the Company has established an internal scoring analysis system. According to its results presented in the 2017 audit report, the share of leasing receivables at “A+” risk level decreased to 1.48% from 20.56% in 2017. On the other hand, the share of leasing receivables categorized at “B+” (satisfactory) or higher increased to 65.33% from 63.67%. The Company manages its credit risk by limiting transactions regarding some specific sectors as well as the continuous control and reevaluation of debtor credibility. Additionally, the Company takes into account the sector and regional concentration in credit risk management. Tourism, energy, machine & equipment and mine, metal & chemistry sectors held a 63.53% share in the Company’s sectoral credit risk dispersion. Moreover, the Company obtains additional collateral for its receivables if possible. The Company had a collateral amount of TRY 1.81bn
17,38 19,16 20,55
23,01 23,14
29,41
12,97 14,80
16,75 15,90 14,14
18,79
0
5
10
15
20
25
30
35
201720162015201420132012
Equity / Total Resources %
Sector ŞEKER FİNANSAL KİRALAMA A.Ş.
67,6066,8668,9670,3770,64
41,9441,2332,54
44,61
29,66
0102030405060708090
2017/92016201520142013
Short Term Borrowings / Total Assets (%)
Sector ŞEKER FİNANSAL KİRALAMA A.Ş.
ŞEKER FİNANSAL KİRALAMA A.Ş. AND ITS SUBSIDIARY 15
against its TRY 445.92mn lease receivables as of FYE2017. Accordingly, the Company’s ‘collateral-to-total receivables’ ratio realized a value of 373% as of FYE2017. Surety bonds (57.38), pledges (26.93%), mortgages (15.16%) and guarantee letters (0.53%) constitute the Company’s collateral portfolio of TRY 1.81bn as of FYE2017. The Company’s top 10 customers, including two group companies, composed 47.84% (48.35% and 44.70% as of FYE2016 and FYE2015, respectively) of the total receivables portfolio as of FYE2017, the top 20 69.11% (67.75% and 65.99% FYE2016 and FYE2015, respectively) and the top 50 87.68% (85.37% and 83.58% FYE2016 and FYE2015, respectively). The figures in all brackets stayed almost at the previous year’s level and above the acceptable level of national reference indices, pressuring asset quality and increasing risk level.
c) Liquidity Risk The funding unit of the Group reports expected cash flows on a daily basis. Liquidity management is performed through coordination with the asset and liability committee (ALCO) in monthly meetings. The Company manages its liquidity risk by diversifying is funding sources and maintaining adequate funding and borrowing sources through regular following of forecast and actual cash flow and matching efforts of assets and liabilities. Within this scope, funding through bond issuances continues. As of April 19, 2018, cash credit lines worth TRY 314.69mn were extended to Şeker Leasing by 21 different financial institutions (in previous report TRY 297.94mn by 17 financial institutions), both the cash credit line amount and the number of lenders were increased, and 39.63% of this total line was utilized, with a cash free line amounting to TRY 189.96mn. Additionally, the Takasbank Money Market (TPP) borrowing/lending limit of TRY 27.5mn was available for the Company. Moreover, there were 5 lawsuits against the Company with the total amount of TRY 1.68mn that may affect the Company’s future financials. The Leasing Sector is exposed to maturity mismatch risk due to the long-term maturity structure of lease receivables against the short-term borrowing structure. Accordingly, the Company had a short-term funding need of TRY 219.82mn as of 1Q2018. Correspondingly, the Company was authorized for the debt instrument issuance up to TRY 150mn by CMB, and three trenches of debt instrument issuances with a total amount of TRY 59mn were realized in April 2018. As of May 15, 2018, the current debt
instrument issuances of the Company amounted to TRY 207.02mn in 17 trenches.
d) Market Risk The Company is exposed to interest rate risk due to its financial assets and liabilities mainly composed of leasing receivables, borrowings, and debt instrument issuances. The Company had no floating interest rated financial assets as of FYE2017, as in the previous two years. While all of the Company’s financial assets were fixed rated, 26.96% of the Company financial liabilities were floating rated as of 2017 year-end. Accordingly, the Company’s financial statement had a variance range of (+/-) TRY 409k in the case of 100bp increase or decrease in interest rates as of FYE2017 (FYE2016: (+/-) TRY 25k, FYE2015: (+/-) TRY 161k). The Company is exposed to foreign currency risk due to its leasing operations and borrowings denominated in foreign currencies. Although the Company ratios regarding FX position improved, they maintained their above sector average standing over the review period year with a net long FX position of TRY 87.28mn as of FYE2017 (FYE2016: TRY 98.7mn, FYE2015: TRY 33.22mn). Accordingly, the profit/loss and equity figures of the Company had a variance range of (+/-) TRY 8.73mn (FYE2016: (+/-) TRY 9.87mn, FYE2015: (+/-) TRY 3.32mn), corresponding approximately 220% of the pre-tax profit, in the case of a 10% increase or decrease in exchange rates as of FYE2017.
8. Budget & Debt Issue The Company’s borrowing structure turned into a long-term weighted dispersion following the starting of debt instrument issuances mostly with one-year redemption date in 2012. Funds obtained through the bond issuances held a 41.25% share in the Company’s total borrowings as of
-219,82
215,45
22,55
-250-200-150-100
-500
50100150200250
LP <= 1 year 1 year < LP <= 5 year 5 year < LP
Liqudity Position (000,000 TRY)
ŞEKER FİNANSAL KİRALAMA A.Ş. AND ITS SUBSIDIARY 16
FYE2017. As of May 15, 2018, the current debt instrument issuances of the Company amounted to TRY 207.02mn in 17 trenches.
The funds obtained by debt instrument issuances were utilized in the financing of new leasing transactions and repayment of short-term loans. The estimated solo budget projection submitted by the Company is shown in the table below. The Company projected a 2018 year-end asset size of TRY 559.02mn through an annual growth rate of 9.71%, which was evaluated as a highly achievable projection by JCR Eurasia Rating, within the consideration of previous years and last quarter performances.
(*) Solo based budget projection
The major assumptions which have significant effects on the realization of the projection are as follows: ✓ Annual leasing transaction volume of USD 82.13mn
with an advance payment rate of 15% and a dispersion of 35% in TRY, 40% in USD and 25% in EUR
✓ Average annual funding costs of 6.68%, 5% and 17.02% for USD, EUR and TRY denominated bank borrowings, respectively
✓ Average annual lending interest rates of 8.54%, 7.50% and 19.37% for USD, EUR and TRY denominated lending, respectively
✓ Average annual USD and EUR exchange rates of 3.98 and 4.57, respectively
✓ 5% annual growth rate of the Turkish economy in 2018 ✓ Annual inflation rate of 8.50% Integrating the above stated projected growth with the last five years’ solo growth series results in a cumulative assets growth rate of 134.22% from 2012 to FYE2019, with an above 25% contribution in the 2019 year-end projections, which is perceived as quite achievable target by JCR Eurasia Rating.
The stated growth projection will be financed through available credit lines and realized/projected bond issuances, with terms to be determined depending on market conditions. Moreover, with the board decision dated 19.4.2018, it was decided to increase the Company's paid-in capital by TRY 5mn with cash to be paid by Şekerbank.
44,7544,62
36,45
50,94
31,13
14,0019,50
28,7126,21
33,63 41,2535,8934,85
22,85
35,24
0
10
20
30
40
50
60
2017/92016201520142013
Short Term Borrowings Long Term Borrowings
Marketable Securities Isued
2018 2019Cash & Cash Equivalents 6,308 7,290 115.57 6,380 7,500
Leasing Receivables (net) 515,974 427,823 82.92 487,188 560,266
Over Due Loans 60,580 55,266 91.23 60,322 61,621
Allowance for Loan and Receivables Losses -48,745 -37,173 76.26 -41,941 -44,686
Other Assets 58,783 56,384 95.92 47,143 50,298
TOTAL ASSETS 592,900 509,590 85.95 559,092 634,999
Bank Loans 341,987 229,407 67.08 305,028 310,000
Issued Bonds 137,090 194,680 142.01 143,636 200,000
Other Liabilities 47,329 26,487 55.96 45,321 52,007
Equity 66,494 59,016 88.75 65,107 72,992
TOTAL LIABILITY 592,900 509,590 85.95 559,092 634,999
Profit & Loss 7,400 5,089 68.77 6,091 7,885
Annual Asset Growth % 23.14 5.83 25.21 9.71 11.95
Equity/Total Asset % 11.22 11.58 103.26 11.65 11.49
ROAA % 1.72 0.80 46.41 1.46 1.69
ROAE % 14.73 6.71 45.52 12.58 14.64
Budget TRY (000)BudgetedBudgeted
2017Actual
2017Realization
2017 (%)
134,22
106,22 87,96
77,60
52,40 41,26 42,80
75,02 56,11
41,51 41,64 34,44 23,28
10,14
144,98
115,33 96,40
84,14
55,66 44,53 48,74
020406080100120140160
2019201820172016201520142013
Cumulative Asset Growth Rate %Cumulative Equity Growth Rate %Cumulative Liability Growth Rate %

ŞEKER FİNANSAL KİRALAMA A.Ş. AND ITS SUBSIDIARY 17
(Year end) (Year end) (Year end) (Year end) (Year end) (Year end) (Year end) (Year end) As % of As % of As % of
ŞEKER FİNANSAL KİRALAMA A.Ş. 2017 2017 2017 2016 2016 2015 2015 2014 2017 2016 2015 2017 2016 2015 BALANCE SHEET - ASSET USD TRY TRY TRY TRY TRY TRY TRY Assets Assets Assets Growth Growth Growth
TRY (000) (Converted) (Original) (Average) (Original) (Average) (Original) (Average) (Original) (Original) (Original) (Original) Rate Rate Rate
A-TOTAL EARNING ASSETS (I+II+III) 121,182.16 457,087.00 445,089.00 433,091.00 407,083.50 381,076.00 371,574.00 362,072.00 80.78 86.02 88.94 5.54 13.65 5.25 I- LOANS AND RECEIVABLES (net) 118,739.63 447,874.00 435,836.50 423,799.00 383,685.00 343,571.00 348,677.00 353,783.00 79.15 84.17 80.18 5.68 23.35 -2.89 a) Factoring Receivables 0.00 0.00 0.00 0.00 0.00 0.00 0.00 0.00 n.a n.a n.a n.a n.a n.a
b) Financing Loans 0.00 0.00 0.00 0.00 0.00 0.00 0.00 0.00 n.a n.a n.a n.a n.a n.a c) Lease Receivables 113,942.84 429,781.00 418,697.00 407,613.00 362,261.00 316,909.00 321,948.00 326,987.00 75.95 80.95 73.96 5.44 28.62 -3.08
d) Over Due Loans 14,659.99 55,296.00 57,209.00 59,122.00 63,495.00 67,868.00 61,576.50 55,285.00 9.77 11.74 15.84 -6.47 -12.89 22.76
e) Others 0.00 0.00 0.00 0.00 0.00 0.00 0.00 0.00 n.a n.a n.a n.a n.a n.a f) Receivable from Customer due to Brokerage Activities 0.00 0.00 0.00 0.00 0.00 0.00 0.00 0.00 n.a n.a n.a n.a n.a n.a g) Allowance for Loan and Receivables Losses (-) -9,863.20 -37,203.00 -40,069.50 -42,936.00 -42,071.00 -41,206.00 -34,847.50 -28,489.00 -6.57 -8.53 -9.62 -13.35 4.20 44.64
II-BANKS AND OTHER EARNING ASSETS 2,442.54 9,213.00 9,252.50 9,292.00 23,398.50 37,505.00 22,897.00 8,289.00 1.63 1.85 8.75 -0.85 -75.22 352.47 a) Banks 2,442.54 9,213.00 9,252.50 9,292.00 23,398.50 37,505.00 22,897.00 8,289.00 1.63 1.85 8.75 -0.85 -75.22 352.47
b) Other 0.00 0.00 0.00 0.00 0.00 0.00 0.00 0.00 n.a n.a n.a n.a n.a n.a
c) Balance With Banks-Current Accounts 0.00 0.00 0.00 0.00 0.00 0.00 0.00 0.00 n.a n.a n.a n.a n.a n.a
III-SECURITIES AT FAIR VALUE THROUGH P/L 0.00 0.00 0.00 0.00 0.00 0.00 0.00 0.00 n.a n.a n.a n.a n.a n.a a) Treasury Bills and Government Bonds 0.00 0.00 0.00 0.00 0.00 0.00 0.00 0.00 n.a n.a n.a n.a n.a n.a b) Other Investment 0.00 0.00 0.00 0.00 0.00 0.00 0.00 0.00 n.a n.a n.a n.a n.a n.a
c) Repurchase Agreement 0.00 0.00 0.00 0.00 0.00 0.00 0.00 0.00 n.a n.a n.a n.a n.a n.a B- INVESTMENTS IN ASSOCIATES (net)+EQUITY SHARE 0.00 0.00 0.00 0.00 0.00 0.00 0.00 0.00 n.a n.a n.a n.a n.a n.a a) Investments in Associates (net) 0.00 0.00 0.00 0.00 0.00 0.00 0.00 0.00 n.a n.a n.a n.a n.a n.a
b) Equity Share 0.00 0.00 0.00 0.00 0.00 0.00 0.00 0.00 n.a n.a n.a n.a n.a n.a C-NON-EARNING ASSETS 28,834.27 108,760.00 89,587.50 70,415.00 58,910.00 47,405.00 43,005.00 38,605.00 19.22 13.98 11.06 54.46 48.54 22.79 a) Cash and Cash Equivalents 0.00 0.00 0.00 0.00 0.00 0.00 0.00 0.00 n.a n.a n.a n.a n.a n.a
b) Financial Assets at Fair Value through P/L 0.00 0.00 0.00 0.00 0.00 0.00 0.00 0.00 n.a n.a n.a n.a n.a n.a
c) Asset Held For Sale And Discontinued Operations (net) 1,806.78 6,815.00 6,619.00 6,423.00 9,265.00 12,107.00 6,499.50 892.00 1.20 1.28 2.83 6.10 -46.95 1,257.29
d) Other 27,027.49 101,945.00 82,968.50 63,992.00 49,645.00 35,298.00 36,505.50 37,713.00 18.02 12.71 8.24 59.31 81.29 -6.40 - Intangible Assets 15.91 60.00 30.50 1.00 1.00 1.00 1.50 2.00 0.01 0.00 0.00 5,900.00 0.00 -50.00
- Property and Equipment 20,519.90 77,399.00 59,511.00 41,623.00 28,912.50 16,202.00 16,371.00 16,540.00 13.68 8.27 3.78 85.95 156.90 -2.04
- Deferred Tax 4,124.98 15,559.00 14,992.50 14,426.00 14,228.50 14,031.00 14,445.00 14,859.00 2.75 2.87 3.27 7.85 2.82 -5.57
- Other 2,366.71 8,927.00 8,434.50 7,942.00 6,503.00 5,064.00 5,688.00 6,312.00 1.58 1.58 1.18 12.40 56.83 -19.77 TOTAL ASSETS 150,016.44 565,847.00 534,676.50 503,506.00 465,993.50 428,481.00 414,579.00 400,677.00 100.00 100.00 100.00 12.38 17.51 6.94

ŞEKER FİNANSAL KİRALAMA A.Ş. AND ITS SUBSIDIARY 18
(Year end) (Year end) (Year end) (Year end) (Year end) (Year end) (Year end) (Year end) As % of As % of As % of
ŞEKER FİNANSAL KİRALAMA A.Ş. 2017 2017 2017 2016 2016 2015 2015 2014 2017 2016 2015 2017 2016 2015
BALANCE SHEET-LIABILITIES+EQUITY USD TRY TRY TRY TRY TRY TRY TRY Assets Assets Assets Growth Growth Growth
TRY (000) (Converted) (Original) (Average) (Original) (Average) (Original) (Average) (Original) (Original) (Original) (Original) Rate Rate Rate
C- COST BEARING RESOURCES (I+II) 132,040.35 498,043.00 463,687.00 429,331.00 396,540.00 363,749.00 352,422.50 341,096.00 88.02 85.27 84.89 16.00 18.03 6.64 I-PAYABLES 6,921.45 26,107.00 27,545.50 28,984.00 19,898.50 10,813.00 10,503.50 10,194.00 4.61 5.76 2.52 -9.93 168.05 6.07 a) Factoring Payables 0.00 0.00 0.00 0.00 0.00 0.00 0.00 0.00 n.a n.a n.a n.a n.a n.a b) Lease Payables 4,754.90 17,935.00 15,131.00 12,327.00 6,163.50 0.00 0.00 0.00 3.17 2.45 n.a 45.49 n.a n.a
c) Other 2,166.55 8,172.00 12,414.50 16,657.00 13,735.00 10,813.00 10,503.50 10,194.00 1.44 3.31 2.52 -50.94 54.05 6.07
II-BORROWING FUNDING LOANS & OTHER 125,118.91 471,936.00 436,141.50 400,347.00 376,641.50 352,936.00 341,919.00 330,902.00 83.40 79.51 82.37 17.88 13.43 6.66 a) Fund Borrowed-Short Term 55,990.88 211,192.00 194,907.50 178,623.00 153,627.00 128,631.00 148,594.00 168,557.00 37.32 35.48 30.02 18.23 38.86 -23.69 b) Fund Borrowed-Long Term 17,514.78 66,064.00 72,058.00 78,052.00 89,681.50 101,311.00 94,024.00 86,737.00 11.68 15.50 23.64 -15.36 -22.96 16.80
c ) Marketable Securities For Issued (net) 51,613.25 194,680.00 169,176.00 143,672.00 133,333.00 122,994.00 99,301.00 75,608.00 34.41 28.53 28.70 35.50 16.81 62.67
d) Securities Sold Under Repurchase Agreements 0.00 0.00 0.00 0.00 0.00 0.00 0.00 0.00 n.a n.a n.a n.a n.a n.a
e) Subordinated Loans 0.00 0.00 0.00 0.00 0.00 0.00 0.00 0.00 n.a n.a n.a n.a n.a n.a D- NON COST BEARING RESOURCES 747.63 2,820.00 6,041.50 9,263.00 6,266.50 3,270.00 3,947.50 4,625.00 0.50 1.84 0.76 -69.56 183.27 -29.30 a) Provisions 455.47 1,718.00 4,716.00 7,714.00 5,014.50 2,315.00 3,161.50 4,008.00 0.30 1.53 0.54 -77.73 233.22 -42.24
b) Current & Deferred Tax Liabilities 292.16 1,102.00 1,184.00 1,266.00 1,110.50 955.00 786.00 617.00 0.19 0.25 0.22 -12.95 32.57 54.78 c) Trading Liabilities (Derivatives) 0.00 0.00 141.50 283.00 141.50 0.00 0.00 0.00 n.a 0.06 n.a -100.00 n.a n.a
d) Other Liabilities 0.00 0.00 0.00 0.00 0.00 0.00 0.00 0.00 n.a n.a n.a n.a n.a n.a
E- TOTAL LIABILITIES 132,787.98 500,863.00 469,728.50 438,594.00 402,806.50 367,019.00 356,370.00 345,721.00 88.52 87.11 85.66 14.20 19.50 6.16 F- MINORITY INTEREST 0.00 0.00 0.00 0.00 n.a n.a n.a n.a n.a n.a F- EQUITY 17,228.45 64,984.00 64,948.00 64,912.00 63,187.00 61,462.00 58,209.00 54,956.00 11.48 12.89 14.34 0.11 5.61 11.84 a) Prior Year's Equity 17,209.36 64,912.00 63,187.00 61,462.00 58,209.00 54,956.00 52,160.50 49,365.00 11.47 12.21 12.83 5.61 11.84 11.33
b) Equity (Internal & external resources added during the year) -1,399.83 -5,280.00 -4,380.50 -3,481.00 -1,949.00 -417.00 -230.00 -43.00 -0.93 -0.69 -0.10 51.68 734.77 869.77
c) Minority Interest 23.07 87.00 77.00 67.00 65.00 63.00 53.50 44.00 0.02 0.01 0.01 29.85 6.35 43.18
d) Profit & Loss 1,395.85 5,265.00 6,064.50 6,864.00 6,862.00 6,860.00 6,225.00 5,590.00 0.93 1.36 1.60 -23.30 0.06 22.72 TOTAL LIABILITY+EQUITY 150,016.44 565,847.00 534,676.50 503,506.00 465,993.50 428,481.00 414,579.00 400,677.00 100.00 100.00 100.00 12.38 17.51 6.94
USD 1 = TRY 3.7719 3.5318 2.9076 2.3189
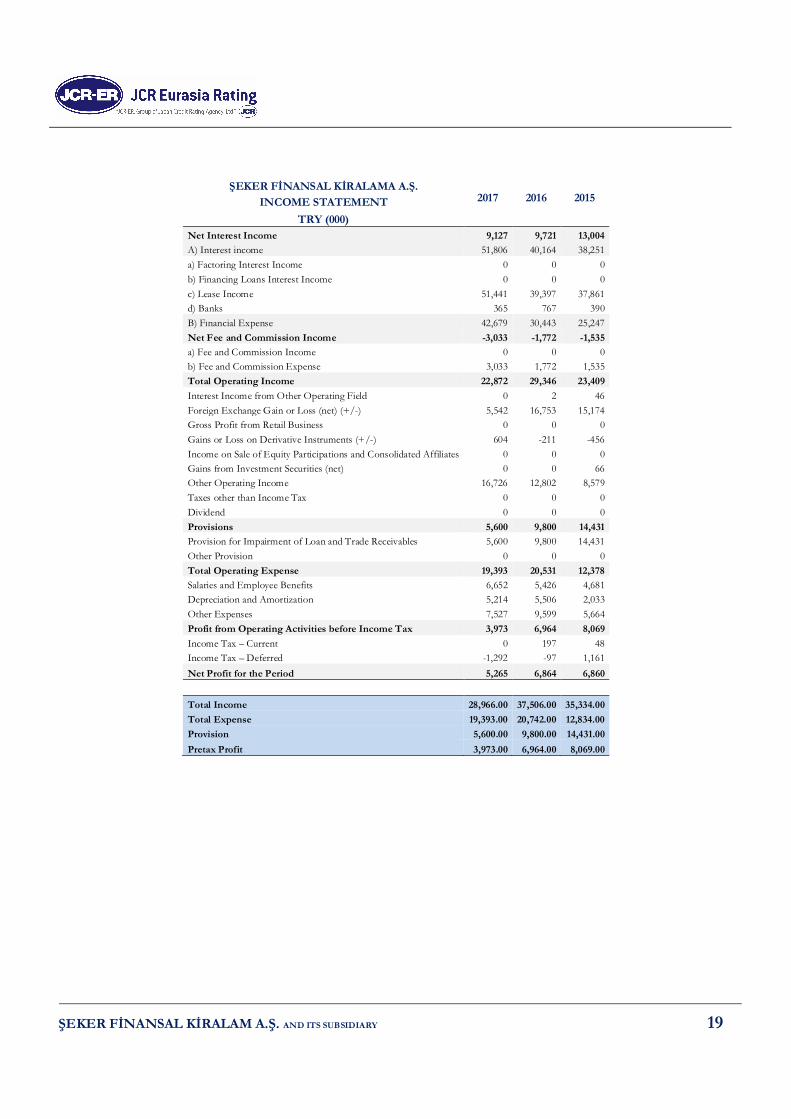
ŞEKER FİNANSAL KİRALAM A.Ş. AND ITS SUBSIDIARY 19
ŞEKER FİNANSAL KİRALAMA A.Ş. 2017 2016 2015 INCOME STATEMENT
TRY (000) Net Interest Income 9,127 9,721 13,004 A) Interest income 51,806 40,164 38,251 a) Factoring Interest Income 0 0 0 b) Financing Loans Interest Income 0 0 0 c) Lease Income 51,441 39,397 37,861 d) Banks 365 767 390 B) Fınancial Expense 42,679 30,443 25,247 Net Fee and Commission Income -3,033 -1,772 -1,535 a) Fee and Commission Income 0 0 0 b) Fee and Commission Expense 3,033 1,772 1,535 Total Operating Income 22,872 29,346 23,409 Interest Income from Other Operating Field 0 2 46 Foreign Exchange Gain or Loss (net) (+/-) 5,542 16,753 15,174 Gross Profit from Retail Business 0 0 0 Gains or Loss on Derivative Instruments (+/-) 604 -211 -456 Income on Sale of Equity Participations and Consolidated Affiliates 0 0 0 Gains from Investment Securities (net) 0 0 66 Other Operating Income 16,726 12,802 8,579 Taxes other than Income Tax 0 0 0 Dividend 0 0 0 Provisions 5,600 9,800 14,431 Provision for Impairment of Loan and Trade Receivables 5,600 9,800 14,431 Other Provision 0 0 0 Total Operating Expense 19,393 20,531 12,378 Salaries and Employee Benefits 6,652 5,426 4,681 Depreciation and Amortization 5,214 5,506 2,033 Other Expenses 7,527 9,599 5,664 Profit from Operating Activities before Income Tax 3,973 6,964 8,069 Income Tax – Current 0 197 48 Income Tax – Deferred -1,292 -97 1,161 Net Profit for the Period 5,265 6,864 6,860 Total Income 28,966.00 37,506.00 35,334.00 Total Expense 19,393.00 20,742.00 12,834.00 Provision 5,600.00 9,800.00 14,431.00 Pretax Profit 3,973.00 6,964.00 8,069.00
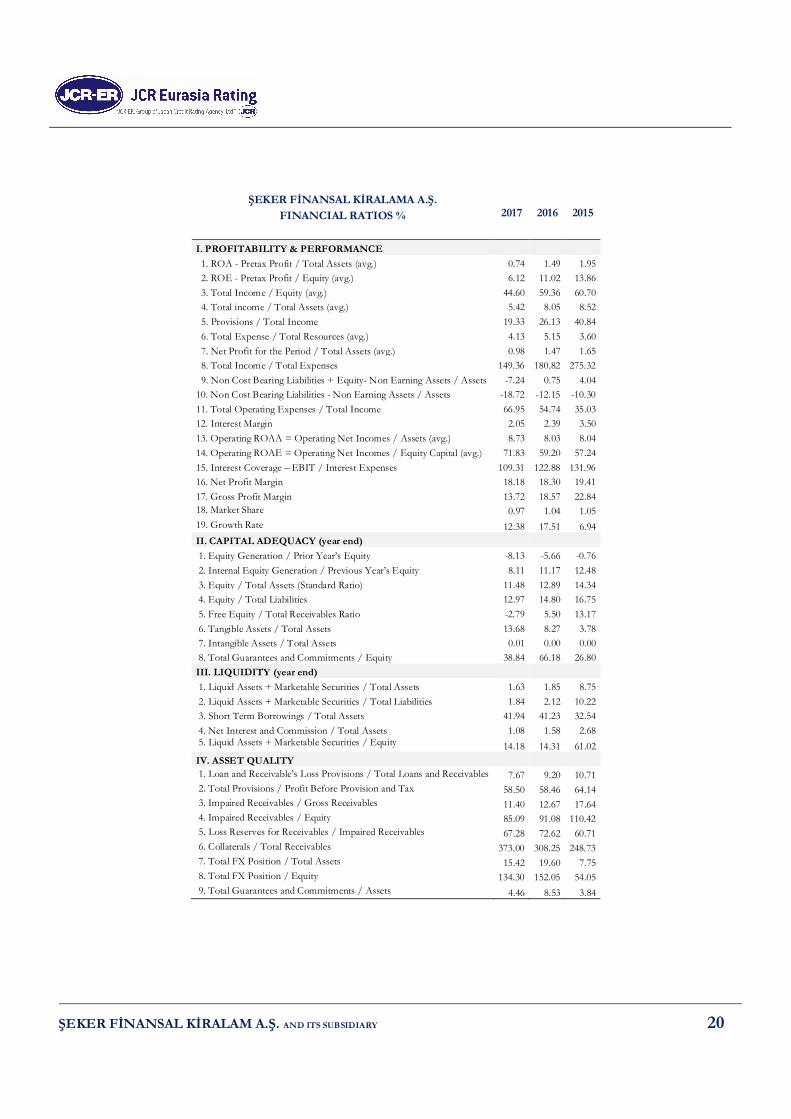
ŞEKER FİNANSAL KİRALAM A.Ş. AND ITS SUBSIDIARY 20
ŞEKER FİNANSAL KİRALAMA A.Ş. 2017 2016 2015 FINANCIAL RATIOS %
I. PROFITABILITY & PERFORMANCE 1. ROA - Pretax Profit / Total Assets (avg.) 0.74 1.49 1.95 2. ROE - Pretax Profit / Equity (avg.) 6.12 11.02 13.86 3. Total Income / Equity (avg.) 44.60 59.36 60.70 4. Total income / Total Assets (avg.) 5.42 8.05 8.52 5. Provisions / Total Income 19.33 26.13 40.84 6. Total Expense / Total Resources (avg.) 4.13 5.15 3.60 7. Net Profit for the Period / Total Assets (avg.) 0.98 1.47 1.65 8. Total Income / Total Expenses 149.36 180.82 275.32 9. Non Cost Bearing Liabilities + Equity- Non Earning Assets / Assets -7.24 0.75 4.04 10. Non Cost Bearing Liabilities - Non Earning Assets / Assets -18.72 -12.15 -10.30 11. Total Operating Expenses / Total Income 66.95 54.74 35.03 12. Interest Margin 2.05 2.39 3.50 13. Operating ROAA = Operating Net Incomes / Assets (avg.) 8.73 8.03 8.04 14. Operating ROAE = Operating Net Incomes / Equity Capital (avg.) 71.83 59.20 57.24 15. Interest Coverage – EBIT / Interest Expenses 109.31 122.88 131.96 16. Net Profit Margin 18.18 18.30 19.41 17. Gross Profit Margin 13.72 18.57 22.84 18. Market Share 0.97 1.04 1.05 19. Growth Rate 12.38 17.51 6.94 II. CAPITAL ADEQUACY (year end) 1. Equity Generation / Prior Year’s Equity -8.13 -5.66 -0.76 2. Internal Equity Generation / Previous Year’s Equity 8.11 11.17 12.48 3. Equity / Total Assets (Standard Ratio) 11.48 12.89 14.34 4. Equity / Total Liabilities 12.97 14.80 16.75 5. Free Equity / Total Receivables Ratio -2.79 5.50 13.17 6. Tangible Assets / Total Assets 13.68 8.27 3.78 7. Intangible Assets / Total Assets 0.01 0.00 0.00 8. Total Guarantees and Commitments / Equity 38.84 66.18 26.80 III. LIQUIDITY (year end) 1. Liquid Assets + Marketable Securities / Total Assets 1.63 1.85 8.75 2. Liquid Assets + Marketable Securities / Total Liabilities 1.84 2.12 10.22 3. Short Term Borrowings / Total Assets 41.94 41.23 32.54 4. Net Interest and Commission / Total Assets 1.08 1.58 2.68 5. Liquid Assets + Marketable Securities / Equity 14.18 14.31 61.02 IV. ASSET QUALITY 1. Loan and Receivable’s Loss Provisions / Total Loans and Receivables 7.67 9.20 10.71 2. Total Provisions / Profit Before Provision and Tax 58.50 58.46 64.14 3. Impaired Receivables / Gross Receivables 11.40 12.67 17.64 4. Impaired Receivables / Equity 85.09 91.08 110.42 5. Loss Reserves for Receivables / Impaired Receivables 67.28 72.62 60.71 6. Collaterals / Total Receivables 373.00 308.25 248.73 7. Total FX Position / Total Assets 15.42 19.60 7.75 8. Total FX Position / Equity 134.30 152.05 54.05 9. Total Guarantees and Commitments / Assets 4.46 8.53 3.84
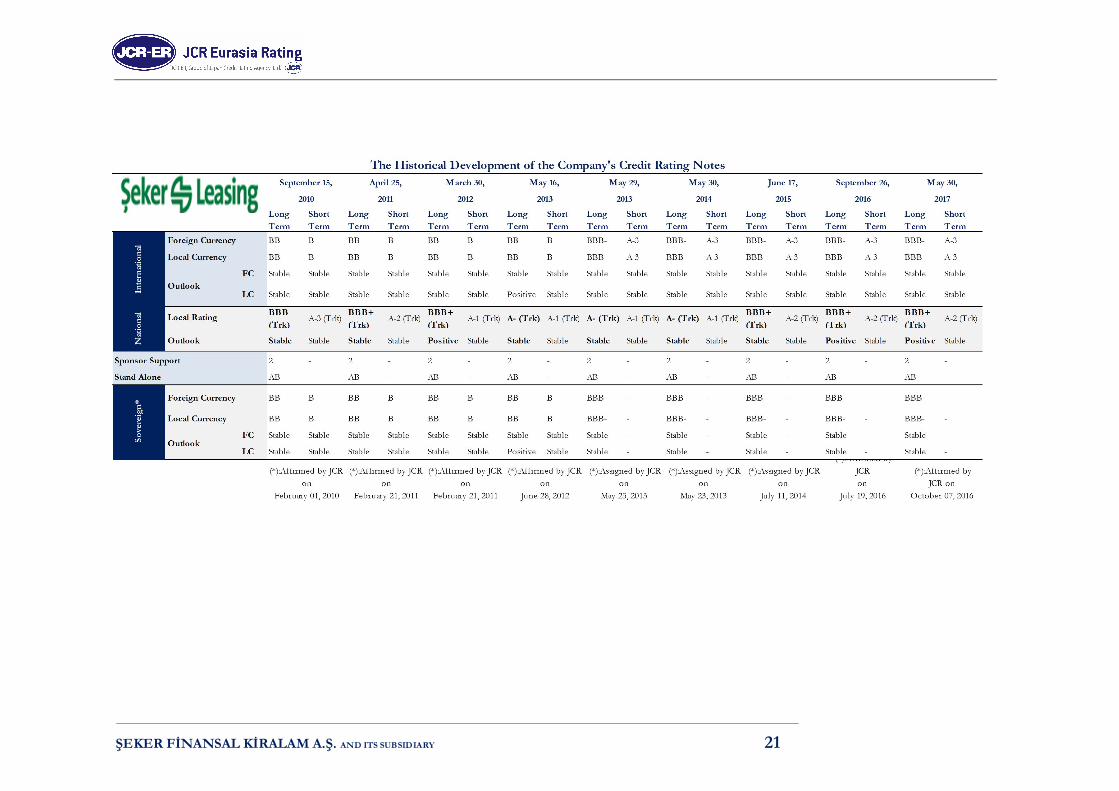
ŞEKER FİNANSAL KİRALAM A.Ş. AND ITS SUBSIDIARY 21