ICBC Financial Leasing Co., Ltd. · 2019-10-01 · Credit Rating Report: ICBC Financial Leasing...
20
S&P Ratings (China) Co., Ltd. www.spgchinaratings.cn July 11, 2019 Credit Rating Report ICBC Financial Leasing Co., Ltd. July 11, 2019 Analysts: Ying Li, CFA, FRM: 010-65166061; [email protected] Longtai Chen: 010-65166065; [email protected] Zheng Li: 010-65166067; [email protected] Contents Tear Sheet .............................................................................................. 1 Rating Summary ..................................................................................... 2 Macro-Economic and Industry Trend ..................................................... 3 Business Position ................................................................................... 4 Capital and Earnings .............................................................................. 7 Risk Position ......................................................................................... 11 Funding and Liquidity........................................................................... 13 External Support .................................................................................. 15 Appendix 1: Key Financial Data ........................................................... 17 Appendix 2: Peer Comparison Data .................................................... 18 * S&P CHINA RATINGS ARE ASSIGNED ON A RATING SCALE THAT IS DISTINCT FROM THE S&P GLOBAL RATING SCALE. AN S&P CHINA RATING MUST NOT BE EQUATED WITH OR REPRESENTED AS A RATING ON THE S&P GLOBAL RATINGS SCALE. This document is prepared in both English and Chinese. The English translation is for reference only, and the Chinese version will prevail in the event of any inconsistency between the English version and the Chinese version.
Transcript of ICBC Financial Leasing Co., Ltd. · 2019-10-01 · Credit Rating Report: ICBC Financial Leasing...
S&P Ratings (China) Co., Ltd. www.spgchinaratings.cn July 11, 2019
Credit Rating Report
ICBC Financial Leasing Co., Ltd.
July 11, 2019
Analysts:
Ying Li, CFA, FRM: 010-65166061; [email protected]
Longtai Chen: 010-65166065; [email protected]
Zheng Li: 010-65166067; [email protected]
Contents
Tear Sheet .............................................................................................. 1
Rating Summary ..................................................................................... 2
Macro-Economic and Industry Trend ..................................................... 3
Business Position ................................................................................... 4
Capital and Earnings .............................................................................. 7
Risk Position ......................................................................................... 11
Funding and Liquidity........................................................................... 13
External Support .................................................................................. 15
Appendix 1: Key Financial Data ........................................................... 17
Appendix 2: Peer Comparison Data .................................................... 18
* S&P CHINA RATINGS ARE ASSIGNED ON A RATING SCALE THAT IS DISTINCT FROM THE S&P GLOBAL RATING
SCALE. AN S&P CHINA RATING MUST NOT BE EQUATED WITH OR REPRESENTED AS A RATING ON THE S&P
GLOBAL RATINGS SCALE.
This document is prepared in both English and Chinese. The English translation is for reference only, and the
Chinese version will prevail in the event of any inconsistency between the English version and the Chinese version.
Credit Rating Report: ICBC Financial Leasing Co., Ltd. July 11, 2019
S&P Ratings (China) Co., Ltd. www.spgchinaratings.cn 1
Tear Sheet Company Name Rating Type Current Rating Rating Date Outlook/CreditWatch
ICBC Financial Leasing Co., Ltd. Issuer Credit Rating AAA July 11, 2019 Stable
Peer Group Comparison (The peer group includes ICBCFL, BoComFL, CDBFL, Minsheng FL, CMBFL and CCBFL)
(2016-2018 three-year average) ICBCFL Max Min Average Asset-weighted average Median
Total assets (bil) 202.57 206.25 137.31 177.71 181.52 182.74
Gross operating income (bil) 12.08 13.02 7.72 10.91 11.17 11.49
Net income (bil) 2.42 2.42 1.27 1.92 1.98 2.01
Regulatory capital adequacy ratio (%) 13.80 13.80 10.37 11.64 11.76 10.86
Return on average equity (%) 9.54 14.09 9.32 10.96 10.98 9.85
Non-performing financial lease receivable ratio (%) 1.19 1.78 0.81 1.21 1.23 1.15
Total debt/total equity (X) 6.13 9.32 6.13 7.93 7.87 8.36
Note: data in this table has been adjusted by S&P Global (China) Ratings.
Industry Classification: Finance Company
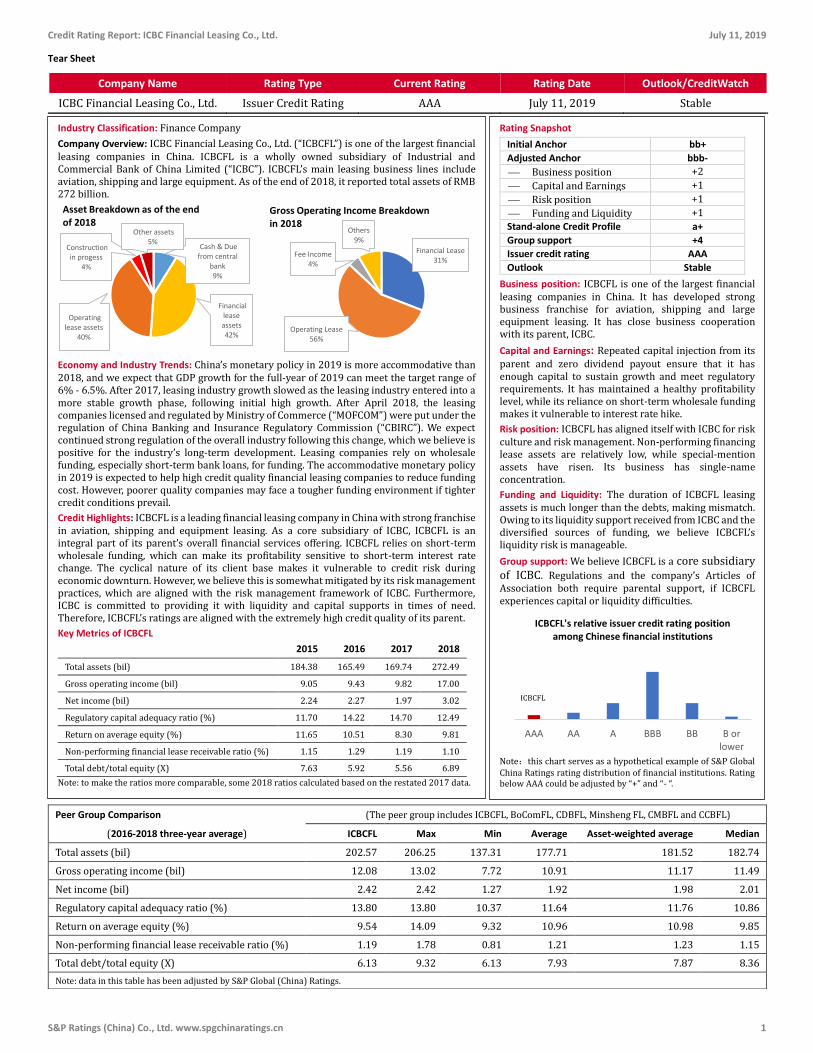
Company Overview: ICBC Financial Leasing Co., Ltd. (“ICBCFL”) is one of the largest financial leasing companies in China. ICBCFL is a wholly owned subsidiary of Industrial and Commercial Bank of China Limited (“ICBC”). ICBCFL’s main leasing business lines include aviation, shipping and large equipment. As of the end of 2018, it reported total assets of RMB 272 billion.
Economy and Industry Trends: China’s monetary policy in 2019 is more accommodative than 2018, and we expect that GDP growth for the full-year of 2019 can meet the target range of 6% - 6.5%. After 2017, leasing industry growth slowed as the leasing industry entered into a more stable growth phase, following initial high growth. After April 2018, the leasing companies licensed and regulated by Ministry of Commerce (“MOFCOM”) were put under the regulation of China Banking and Insurance Regulatory Commission (“CBIRC”). We expect continued strong regulation of the overall industry following this change, which we believe is positive for the industry’s long-term development. Leasing companies rely on wholesale funding, especially short-term bank loans, for funding. The accommodative monetary policy in 2019 is expected to help high credit quality financial leasing companies to reduce funding cost. However, poorer quality companies may face a tougher funding environment if tighter credit conditions prevail.
Credit Highlights: ICBCFL is a leading financial leasing company in China with strong franchise in aviation, shipping and equipment leasing. As a core subsidiary of ICBC, ICBCFL is an integral part of its parent’s overall financial services offering. ICBCFL relies on short-term wholesale funding, which can make its profitability sensitive to short-term interest rate change. The cyclical nature of its client base makes it vulnerable to credit risk during economic downturn. However, we believe this is somewhat mitigated by its risk management practices, which are aligned with the risk management framework of ICBC. Furthermore, ICBC is committed to providing it with liquidity and capital supports in times of need. Therefore, ICBCFL’s ratings are aligned with the extremely high credit quality of its parent.
Key Metrics of ICBCFL 2015 2016 2017 2018
Total assets (bil) 184.38 165.49 169.74 272.49
Gross operating income (bil) 9.05 9.43 9.82 17.00
Net income (bil) 2.24 2.27 1.97 3.02
Regulatory capital adequacy ratio (%) 11.70 14.22 14.70 12.49
Return on average equity (%) 11.65 10.51 8.30 9.81
Non-performing financial lease receivable ratio (%) 1.15 1.29 1.19 1.10
Total debt/total equity (X) 7.63 5.92 5.56 6.89
Note: to make the ratios more comparable, some 2018 ratios calculated based on the restated 2017 data.
Cash & Due from central
bank 9%
Financial lease assets 42%
Operating lease assets
40%
Construction in progess
4%
Other assets 5%
Asset Breakdown as of the end of 2018
Financial Lease31%
Operating Lease56%
Fee Income4%
Others9%
Gross Operating Income Breakdown in 2018
Rating Snapshot
Initial Anchor bb+
Adjusted Anchor bbb-
⎯ Business position +2
⎯ Capital and Earnings +1
⎯ Risk position +1
⎯ Funding and Liquidity +1
Stand-alone Credit Profile a+
Group support +4
Issuer credit rating AAA
Outlook Stable
Business position: ICBCFL is one of the largest financial leasing companies in China. It has developed strong business franchise for aviation, shipping and large equipment leasing. It has close business cooperation with its parent, ICBC.
Capital and Earnings: Repeated capital injection from its parent and zero dividend payout ensure that it has enough capital to sustain growth and meet regulatory requirements. It has maintained a healthy profitability level, while its reliance on short-term wholesale funding makes it vulnerable to interest rate hike.
Risk position: ICBCFL has aligned itself with ICBC for risk culture and risk management. Non-performing financing lease assets are relatively low, while special-mention assets have risen. Its business has single-name concentration.
Funding and Liquidity: The duration of ICBCFL leasing assets is much longer than the debts, making mismatch. Owing to its liquidity support received from ICBC and the diversified sources of funding, we believe ICBCFL’s liquidity risk is manageable.
Group support: We believe ICBCFL is a core subsidiary of ICBC. Regulations and the company’s Articles of Association both require parental support, if ICBCFL experiences capital or liquidity difficulties.
Note:this chart serves as a hypothetical example of S&P Global China Ratings rating distribution of financial institutions. Rating below AAA could be adjusted by “+” and “- “.
AAA AA A BBB BB B orlower
ICBCFL's relative issuer credit rating position among Chinese financial institutions
ICBCFL
Credit Rating Report: ICBC Financial Leasing Co., Ltd. July 11, 2019
S&P Ratings (China) Co., Ltd. www.spgchinaratings.cn 2
Rating Summary
Company Name Rating Type Current Rating Rating Date Outlook/Credit
Watch
ICBC Financial Leasing Co., Ltd Issuer Credit Rating AAA July 11, 2019 Stable
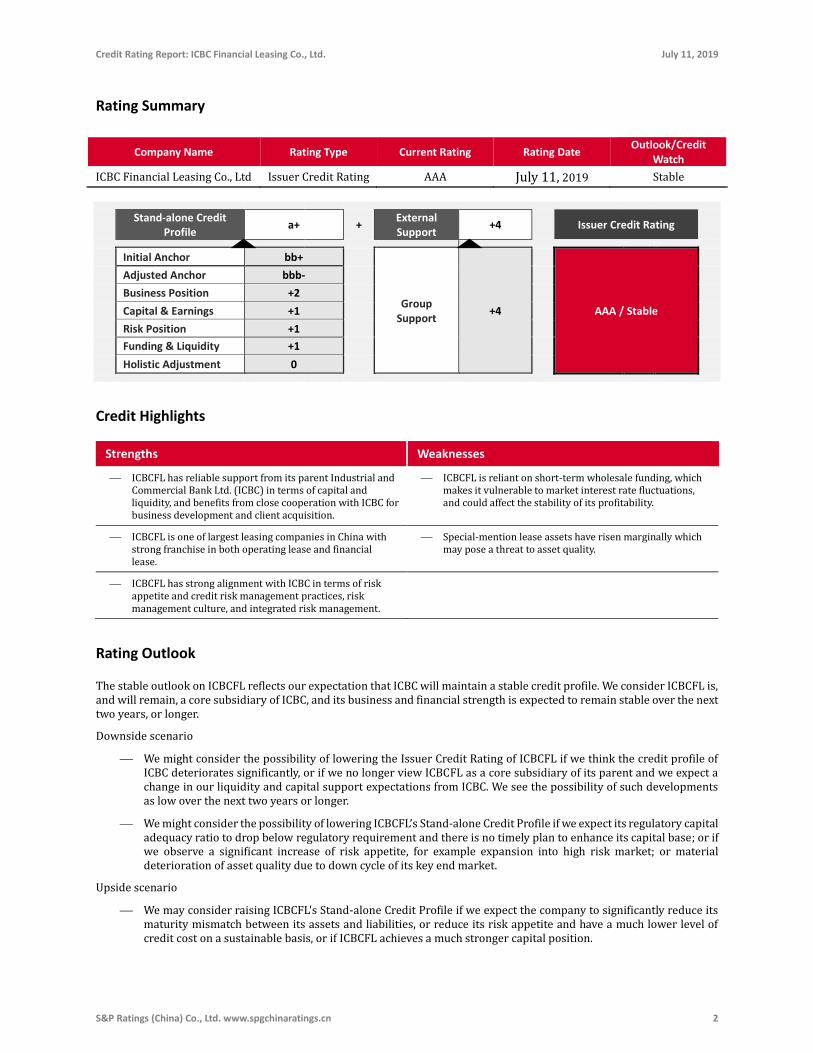
Stand-alone Credit Profile
a+ + External Support
+4 Issuer Credit Rating
Initial Anchor bb+
Group Support
+4
AAA / Stable
Adjusted Anchor bbb-
Business Position +2
Capital & Earnings +1
Risk Position +1
Funding & Liquidity +1
Holistic Adjustment 0
Credit Highlights
Strengths Weaknesses
⎯ ICBCFL has reliable support from its parent Industrial and Commercial Bank Ltd. (ICBC) in terms of capital and liquidity, and benefits from close cooperation with ICBC for business development and client acquisition.
⎯ ICBCFL is reliant on short-term wholesale funding, which makes it vulnerable to market interest rate fluctuations, and could affect the stability of its profitability.
⎯ ICBCFL is one of largest leasing companies in China with strong franchise in both operating lease and financial lease.
⎯ Special-mention lease assets have risen marginally which may pose a threat to asset quality.
⎯ ICBCFL has strong alignment with ICBC in terms of risk appetite and credit risk management practices, risk management culture, and integrated risk management.
Rating Outlook
The stable outlook on ICBCFL reflects our expectation that ICBC will maintain a stable credit profile. We consider ICBCFL is, and will remain, a core subsidiary of ICBC, and its business and financial strength is expected to remain stable over the next two years, or longer.
Downside scenario
⎯ We might consider the possibility of lowering the Issuer Credit Rating of ICBCFL if we think the credit profile of ICBC deteriorates significantly, or if we no longer view ICBCFL as a core subsidiary of its parent and we expect a change in our liquidity and capital support expectations from ICBC. We see the possibility of such developments as low over the next two years or longer.
⎯ We might consider the possibility of lowering ICBCFL’s Stand-alone Credit Profile if we expect its regulatory capital adequacy ratio to drop below regulatory requirement and there is no timely plan to enhance its capital base; or if we observe a significant increase of risk appetite, for example expansion into high risk market; or material deterioration of asset quality due to down cycle of its key end market.
Upside scenario
⎯ We may consider raising ICBCFL's Stand-alone Credit Profile if we expect the company to significantly reduce its maturity mismatch between its assets and liabilities, or reduce its risk appetite and have a much lower level of credit cost on a sustainable basis, or if ICBCFL achieves a much stronger capital position.
Credit Rating Report: ICBC Financial Leasing Co., Ltd. July 11, 2019
S&P Ratings (China) Co., Ltd. www.spgchinaratings.cn 3
Non-bank financial
institutions are typically
subject to lighter
regulation than their
bank counterparts.
The non-bank financial
institution market tends
to be highly fragmented
due to low barriers to
entry.
Furthermore, their
funding channels are
usually quite limited.
Therefore, we typically
apply an anchor of
“bb+” to domestic
finance companies.
The leasing industry is
fragmented. Leasing
companies licensed by
CBIRC are subject to
more stringent
regulation.
Financial leasing
companies licensed by
CBIRC have their anchor
adjusted to “bbb-” from
“bb+”.
Anchor
Macro-Economic and Industry Trend
In our view, China is expected to achieve its GDP growth target range of “6%-6.5%” in
2019. Should the economic slowdown intensify, and GDP growth drop to below 6% for
2019, we expect further stimulation policies are likely to be used. Since the second half of
2018, deleveraging has somewhat paused, but not yet reversed. We generally expect a
monetary easing in 2019, but only a moderate and careful easing. Inter-bank liquidity is
expected to be greater than in 2018. We believe local government infrastructure
investment may be among the first to benefit from this round of easing, but effective
borrowing rates for the real economy may remain relatively high given lending caution
around the credit risk in the real economy.
Before April 2018, the licensing and regulation of China’s leasing industry was divided
between two institutions, China Banking and Insurance Regulatory Commission (“CBIRC”)
and Ministry of Commerce (“MOFCOM”). After April 2018, the central government
consolidated the regulation responsibilities of leasing companies to CBIRC. After this
regulatory change, we expect more consistent regulation across the board which will
benefit the industry in the mid to long term.
The leasing industry is fragmented, partly due to divided regulations before 2018. China
has about 12,000 leasing companies, of which 70 were licensed by CBIRC and the
remaining by MOFCOM. The relatively low barriers to entry has led to heated competition.
Financial leasing companies also face competition from banking and shadow banking
industries.
In contrast, operating lease activities have provided a different value proposition, and
require specific industry and technical expertise in certain industries, such as aviation or
shipping. We have identified that large leasing companies have generally been putting
additional strategic focus on the operating lease segment.
Large bank-affiliated leasing companies tend to have long-term business relationships
with large airlines and big players in shipping, energy, transportation and infrastructure
industries. In recent years, they have also made progress in building up an international
portfolio by leasing aircraft to international airlines. In contrast, small and medium-sized
leasing companies tend to do business with small and medium-sized enterprises, and they
might face different challenges in terms of credit risk management.
Many clients of the leasing industry are in aviation and shipping industries, which tend to
be cyclical sectors, leaving the leasing industry generally more vulnerable to asset quality
deterioration in periods of economic downturn. In addition, leasing companies also do
business with local government financing vehicles (“LGFVs”), exposing them to the credit
risk of LGFVs. Some of the lease assets related to LGFVs can be highways, tunnels, and
pipelines. The relative illiquidity of these assets may affect recovery rate in the case of
default.
As a relatively young industry, the leasing industry experienced rapid growth before 2017.
After 2017 it has entered into a more stable and more mature stage, which was partially
attributable to economic rebalancing.
Credit Rating Report: ICBC Financial Leasing Co., Ltd. July 11, 2019
S&P Ratings (China) Co., Ltd. www.spgchinaratings.cn 4
ICBCFL is one of the
largest financial leasing
companies in China.
ICBCFL has built a strong
franchise in aviation,
shipping and equipment
leasing.
ICBCFL’s business
development is strongly
supported by its parent
through client referral
and business
cooperation.
Its market position is
much stronger than
average finance
companies and has two-
notch uplift for business
position.
Leasing companies generally rely on short-term bank loans for funding, resulting in
continuous short-term refinancing risk. Leasing companies licensed by CBIRC have access
to the inter-bank market, although the inter-bank market funding cannot exceed 100% of
their capital. Bank-affiliated leasing companies tend to have a more reliable liquidity
profile, thanks to ongoing liquidity support from parent banks. In contrast, many other
leasing companies without access to the inter-bank market can be more vulnerable to
refinancing risk.
We expect a slowdown of industry growth in the next two years. In our view, large bank-
affiliated leasing companies are expected to remain stable and benefit from more
accommodative monetary policy, while smaller leasing companies might face more
challenges in terms of asset quality deterioration and capital base erosion. Some of them
might find it more difficult to access funding if lenders become more concerned about
their credit risk profile.
Stand-alone Credit Profile
Established in 2007, ICBCFL was set up as a pilot program by the State Council, and it was
the first bank-affiliated financial leasing company licensed by China Banking Regulatory
Commission (“CBRC”), the predecessor of CBIRC. Its license is registered in Tianjin.
ICBCFL is a leading financial leasing company in China. It has three major business lines:
aviation, shipping and large equipment leasing. Its reported total assets were RMB 272
billion as of the end of 2018. Its reported gross operating income was RMB 17 billion and
return on average equity was 10% in 2018.
ICBCFL is a wholly owned subsidiary of Industrial and Commercial Bank of China Ltd.
(“ICBC”), which is the largest commercial bank in China. ICBCFL is one of ICBC's largest
non-bank subsidiaries in terms of total assets. We view ICBCFL as a core subsidiary of
ICBC and we believe there is strong business synergy between ICBC and ICBCFL. ICBC has
provided ICBCFL with significant ongoing support in terms of client acquisition, capital
injection, risk management and liquidity support.
Business Position
ICBCFL is one of the largest leasing companies in China and has a leading franchise in the
leasing industry. Within the peer group of large bank-affiliated financial leasing
companies in China, we view ICBCFL’s business position as strong in terms of operating
lease expertise, asset size and profitability.
Credit Rating Report: ICBC Financial Leasing Co., Ltd. July 11, 2019
S&P Ratings (China) Co., Ltd. www.spgchinaratings.cn 5
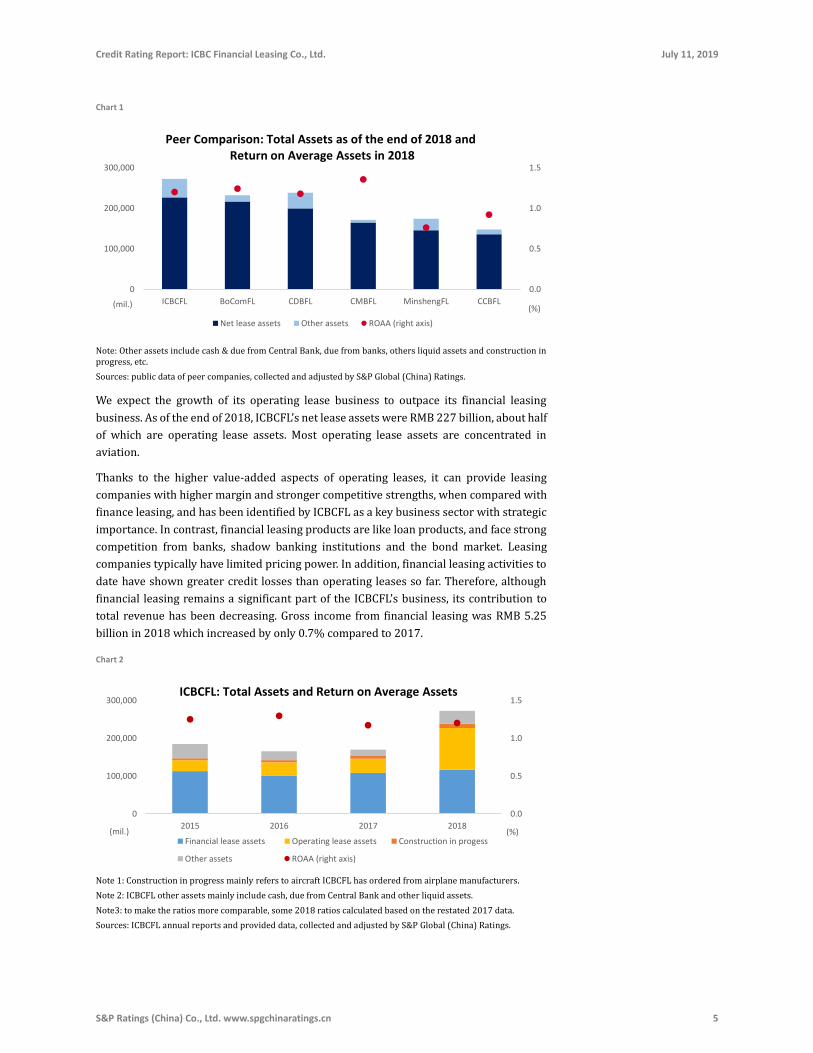
Chart 1
Note: Other assets include cash & due from Central Bank, due from banks, others liquid assets and construction in progress, etc.
Sources: public data of peer companies, collected and adjusted by S&P Global (China) Ratings.
We expect the growth of its operating lease business to outpace its financial leasing
business. As of the end of 2018, ICBCFL’s net lease assets were RMB 227 billion, about half
of which are operating lease assets. Most operating lease assets are concentrated in
aviation.
Thanks to the higher value-added aspects of operating leases, it can provide leasing
companies with higher margin and stronger competitive strengths, when compared with
finance leasing, and has been identified by ICBCFL as a key business sector with strategic
importance. In contrast, financial leasing products are like loan products, and face strong
competition from banks, shadow banking institutions and the bond market. Leasing
companies typically have limited pricing power. In addition, financial leasing activities to
date have shown greater credit losses than operating leases so far. Therefore, although
financial leasing remains a significant part of the ICBCFL’s business, its contribution to
total revenue has been decreasing. Gross income from financial leasing was RMB 5.25
billion in 2018 which increased by only 0.7% compared to 2017.
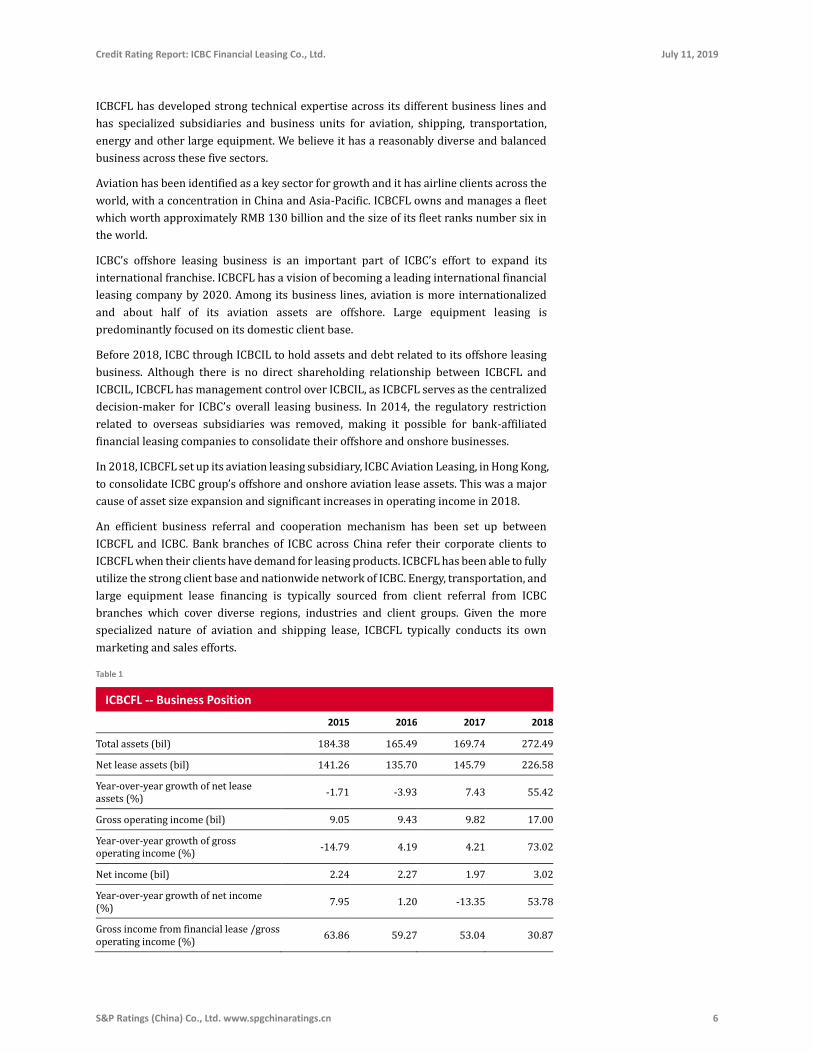
Chart 2
Note 1: Construction in progress mainly refers to aircraft ICBCFL has ordered from airplane manufacturers.
Note 2: ICBCFL other assets mainly include cash, due from Central Bank and other liquid assets.
Note3: to make the ratios more comparable, some 2018 ratios calculated based on the restated 2017 data.
Sources: ICBCFL annual reports and provided data, collected and adjusted by S&P Global (China) Ratings.
0.0
0.5
1.0
1.5
0
100,000
200,000
300,000
ICBCFL BoComFL CDBFL CMBFL MinshengFL CCBFL(%)(mil.)
Peer Comparison: Total Assets as of the end of 2018 andReturn on Average Assets in 2018
Net lease assets Other assets ROAA (right axis)
0.0
0.5
1.0
1.5
0
100,000
200,000
300,000
2015 2016 2017 2018(%)(mil.)
ICBCFL: Total Assets and Return on Average Assets
Financial lease assets Operating lease assets Construction in progess
Other assets ROAA (right axis)
Credit Rating Report: ICBC Financial Leasing Co., Ltd. July 11, 2019
S&P Ratings (China) Co., Ltd. www.spgchinaratings.cn 6
ICBCFL has developed strong technical expertise across its different business lines and
has specialized subsidiaries and business units for aviation, shipping, transportation,
energy and other large equipment. We believe it has a reasonably diverse and balanced
business across these five sectors.
Aviation has been identified as a key sector for growth and it has airline clients across the
world, with a concentration in China and Asia-Pacific. ICBCFL owns and manages a fleet
which worth approximately RMB 130 billion and the size of its fleet ranks number six in
the world.
ICBC’s offshore leasing business is an important part of ICBC’s effort to expand its
international franchise. ICBCFL has a vision of becoming a leading international financial
leasing company by 2020. Among its business lines, aviation is more internationalized
and about half of its aviation assets are offshore. Large equipment leasing is
predominantly focused on its domestic client base.
Before 2018, ICBC through ICBCIL to hold assets and debt related to its offshore leasing
business. Although there is no direct shareholding relationship between ICBCFL and
ICBCIL, ICBCFL has management control over ICBCIL, as ICBCFL serves as the centralized
decision-maker for ICBC’s overall leasing business. In 2014, the regulatory restriction
related to overseas subsidiaries was removed, making it possible for bank-affiliated
financial leasing companies to consolidate their offshore and onshore businesses.
In 2018, ICBCFL set up its aviation leasing subsidiary, ICBC Aviation Leasing, in Hong Kong,
to consolidate ICBC group’s offshore and onshore aviation lease assets. This was a major
cause of asset size expansion and significant increases in operating income in 2018.
An efficient business referral and cooperation mechanism has been set up between
ICBCFL and ICBC. Bank branches of ICBC across China refer their corporate clients to
ICBCFL when their clients have demand for leasing products. ICBCFL has been able to fully
utilize the strong client base and nationwide network of ICBC. Energy, transportation, and
large equipment lease financing is typically sourced from client referral from ICBC
branches which cover diverse regions, industries and client groups. Given the more
specialized nature of aviation and shipping lease, ICBCFL typically conducts its own
marketing and sales efforts.
Table 1
ICBCFL -- Business Position
2015 2016 2017 2018
Total assets (bil) 184.38 165.49 169.74 272.49
Net lease assets (bil) 141.26 135.70 145.79 226.58
Year-over-year growth of net lease assets (%)
-1.71 -3.93 7.43 55.42
Gross operating income (bil) 9.05 9.43 9.82 17.00
Year-over-year growth of gross operating income (%)
-14.79 4.19 4.21 73.02
Net income (bil) 2.24 2.27 1.97 3.02
Year-over-year growth of net income (%)
7.95 1.20 -13.35 53.78
Gross income from financial lease /gross operating income (%)
63.86 59.27 53.04 30.87
Credit Rating Report: ICBC Financial Leasing Co., Ltd. July 11, 2019
S&P Ratings (China) Co., Ltd. www.spgchinaratings.cn 7
ICBC is committed to
injecting capital into
ICBCFL to support its
growth and meet
regulatory
requirements.
ICBCFL has maintained a
healthy level of
profitability despite
pressure of interest risk
and credit risk.
Its capital position is
stronger than average
finance companies
because of reliable
parental support,
resulting in one-notch
uplift for capital and
earnings.
ICBCFL -- Business Position
2015 2016 2017 2018
Gross income from operating lease/gross operating income (%)
24.16 30.44 34.28 55.94
Note 1: net lease assets include net finance lease receivables, net operating lease assets and prepaid lease assets. ICBCFL holds 11.4 billion on construction in progress that mainly refers to aircrafts, and it will become lease assets.
Note 2: the rapid growth of net lease assets, gross operating income and net income in 2018 were caused by the consolidated of offshore aviation assets.
Sources: ICBCFL annual reports and provided data, collected and adjusted by S&P Global (China) Ratings.
Table 2
Peer Comparison -- Business Position
(2016-2018 three-year avg.)
ICBCFL Peer Group
Max Min Average Asset-
weighted average
Median
Total assets (bil) 202.57 206.25 137.31 177.71 181.52 182.74
Net lease assets (bil) 169.36 194.59 128.05 157.36 160.28 157.08
Year-over-year growth of net lease assets (%)
19.64 19.64 6.44 14.00 14.40 15.22
Gross operating income (bil) 12.08 13.02 7.72 10.91 11.17 11.49
Year-over-year growth of gross operating income (%)
27.14 27.14 13.00 19.52 19.86 18.99
Net income (bil) 2.42 2.42 1.27 1.92 1.98 2.01
Year-over-year growth of net income (%)
13.88 34.16 10.95 17.20 17.83 13.27
Gross income from financial lease/gross operating income (%)
47.73 76.04 41.58 54.69 53.11 52.74
Gross income from operating lease/gross operating income (%)
40.22 46.69 17.88 32.72 34.40 31.74
Note: Bank of Communications Financial Leasing (BoComFL), China Development Bank Financial Leasing (CDBFL), Minsheng bank Financial Leasing (MinshengFL), China Merchants Bank Financial Leasing (CMBFL) and China Construction Bank Financial Leasing (CCBFL) have been chosen as the peer group of ICBCFL. The weights are assigned based on the average total assets of these companies from 2016 to 2018. The weights of ICBCFL, BoComFL, CDBFL, Minsheng FL, CMBFL and CCBFL are 19.0%, 19.3%, 18.5%, 15.8%,14.5% and 12.9% respectively.
Sources: public data of peer companies, collected and adjusted by S&P Global (China) Ratings.
Capital and Earnings
ICBC has provided repeated capital injections into ICBCFL and thus far ICBCFL has not
returned any dividend payouts to ICBC. We believe ICBCFL has had adequate capital to
support business development and meet regulatory requirements on its capital base.
When set up in 2007, ICBCFL had a capital position of RMB 2 billion. During the past 11
years, ICBC injected capital three times of RMB 3 billion each. Furthermore, ICBC has not
taken dividends from ICBCFL, and ICBCFL’s earnings have been 100% retained to support
further business growth. In 2018, with the approval of ICBC, RMB 7 billion retained
earnings were transferred into paid-in capital which increased to RMB 18 billion by the
end of 2018.
As a result of the strong capital base, the company has been able to maintain stable
leverage and sufficient capital adequacy ratios during rapid business growth. As of the
Credit Rating Report: ICBC Financial Leasing Co., Ltd. July 11, 2019
S&P Ratings (China) Co., Ltd. www.spgchinaratings.cn 8
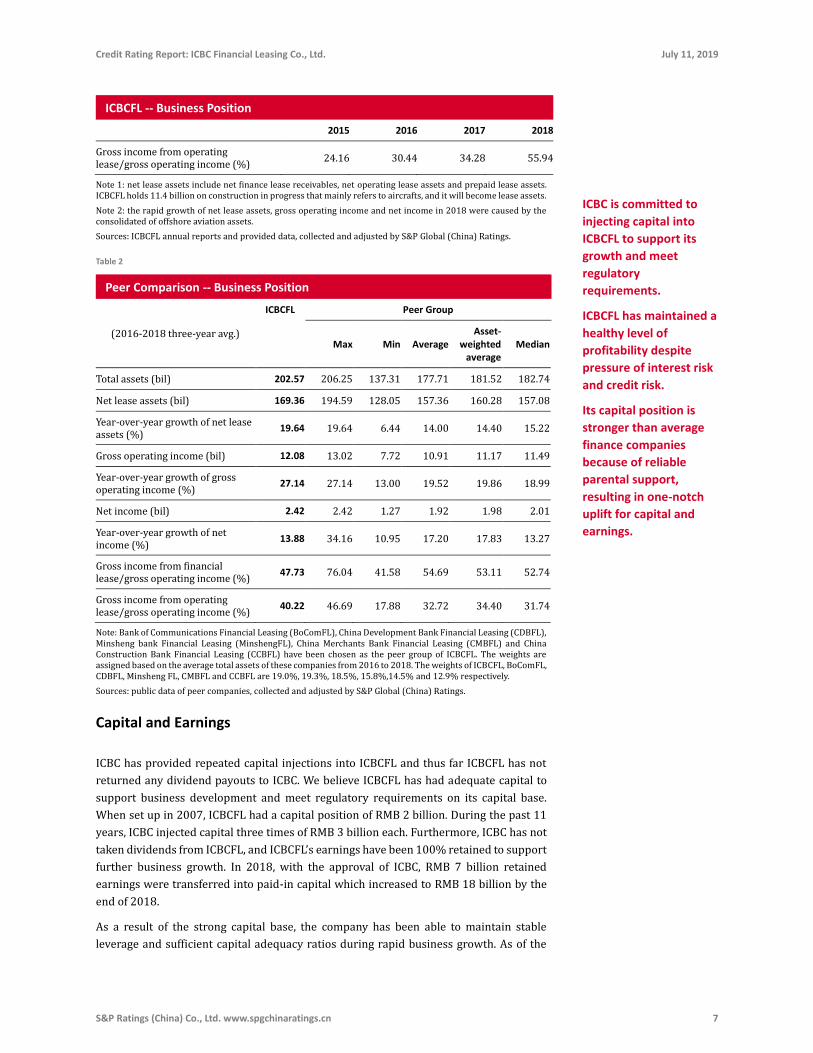
end of 2018, its total debt/equity ratio is 6.9 times and reported regulatory capital
adequacy ratio is 12.49%, higher than the minimum regulatory requirements.
Chart 3
Sources: public data of peer companies, collected and adjusted by S&P Global (China) Ratings.
As a result of the relatively high leverage of the offshore aviation leasing business, its
consolidation into ICBCFL in 2018 has resulted in a drop in ICBCFL’s regulatory capital
adequacy ratio, from 14.70% at the end of 2017 to 12.49% at the end of 2018. The
company plans to issue hybrid bonds to raise its capital adequacy ratio back to a higher
level. In addition, we expect stable profitability can positively contribute to its capital
position, and our estimation of its capital adequacy ratio to be close to 13% in next 24
months, without considering any hybrid bond issuance.
To support the development of the offshore leasing business, ICBCFL has been providing
credit support to ICBCIL and its subsidiaries in the form of keep-well arrangements. These
contingent liabilities could become potential strains on the capital position of ICBCFL. In
our view, any negative impact on capital position due to the consolidation of the offshore
business is only short-term. We believe the consolidation may reduce any uncertainty on
its capital adequacy level caused by contingent liabilities of offshore businesses and
makes ICBCFL more transparent to the market.
Following a decade of rapid growth, ICBCFL is entering into a more mature and stable
phase with single-digit growth, and we expect it will be easier to manage leverage and
capital adequacy in a slower growth environment. Except for any consolidation of
offshore shipping assets, we expect single-digit growth of its assets for the next 24 months,
and the annual growth rate would likely be in the range of 6 – 8%.
We expect that capital support from ICBC to ICBCFL is almost certain given that such
support is required by Chinese regulations. Rules Governing Financial Leasing Companies
issued by CBRC in 2014 requires capital support from controlling shareholders to its
financial leasing companies. To comply with this regulation, ICBCFL amended its Articles
of Association in the same year, which provides for ICBC to promptly replenish the
company's capital level if operational losses lead to capital erosion.
0.0
5.0
10.0
15.0
0.0
5.0
10.0
15.0
ICBCFL BoComFL CDBFL CMBFL MinshengFL CCBFL(x)(%)
Peer Comparison: Capital Adequacy Ratio and Leverage Ratio as of the End of 2018
Regulatory capital adequacy ratio Total debt/total equity (right axis)
Credit Rating Report: ICBC Financial Leasing Co., Ltd. July 11, 2019
S&P Ratings (China) Co., Ltd. www.spgchinaratings.cn 9
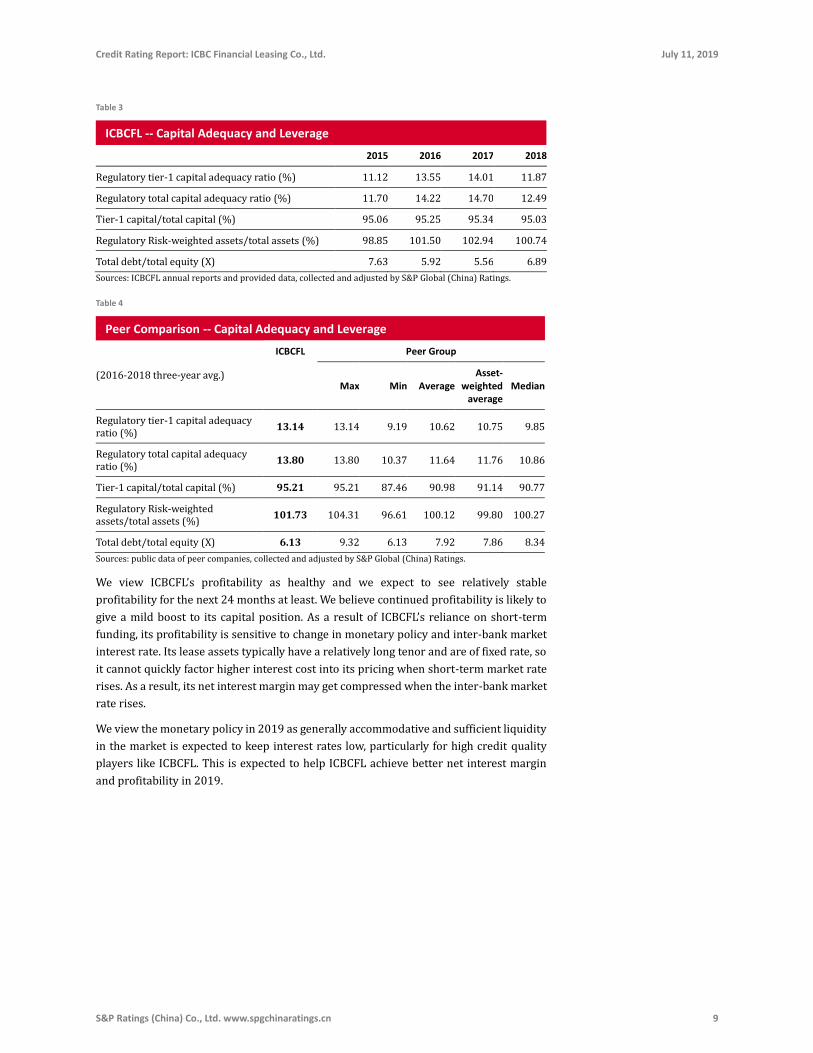
Table 3
ICBCFL -- Capital Adequacy and Leverage
2015 2016 2017 2018
Regulatory tier-1 capital adequacy ratio (%) 11.12 13.55 14.01 11.87
Regulatory total capital adequacy ratio (%) 11.70 14.22 14.70 12.49
Tier-1 capital/total capital (%) 95.06 95.25 95.34 95.03
Regulatory Risk-weighted assets/total assets (%) 98.85 101.50 102.94 100.74
Total debt/total equity (X) 7.63 5.92 5.56 6.89
Sources: ICBCFL annual reports and provided data, collected and adjusted by S&P Global (China) Ratings.
Table 4
Peer Comparison -- Capital Adequacy and Leverage
(2016-2018 three-year avg.)
ICBCFL Peer Group
Max Min Average Asset-
weighted average
Median
Regulatory tier-1 capital adequacy ratio (%)
13.14 13.14 9.19 10.62 10.75 9.85
Regulatory total capital adequacy ratio (%)
13.80 13.80 10.37 11.64 11.76 10.86
Tier-1 capital/total capital (%) 95.21 95.21 87.46 90.98 91.14 90.77
Regulatory Risk-weighted assets/total assets (%)
101.73 104.31 96.61 100.12 99.80 100.27
Total debt/total equity (X) 6.13 9.32 6.13 7.92 7.86 8.34
Sources: public data of peer companies, collected and adjusted by S&P Global (China) Ratings.
We view ICBCFL’s profitability as healthy and we expect to see relatively stable
profitability for the next 24 months at least. We believe continued profitability is likely to
give a mild boost to its capital position. As a result of ICBCFL’s reliance on short-term
funding, its profitability is sensitive to change in monetary policy and inter-bank market
interest rate. Its lease assets typically have a relatively long tenor and are of fixed rate, so
it cannot quickly factor higher interest cost into its pricing when short-term market rate
rises. As a result, its net interest margin may get compressed when the inter-bank market
rate rises.
We view the monetary policy in 2019 as generally accommodative and sufficient liquidity
in the market is expected to keep interest rates low, particularly for high credit quality
players like ICBCFL. This is expected to help ICBCFL achieve better net interest margin
and profitability in 2019.
Credit Rating Report: ICBC Financial Leasing Co., Ltd. July 11, 2019
S&P Ratings (China) Co., Ltd. www.spgchinaratings.cn 10
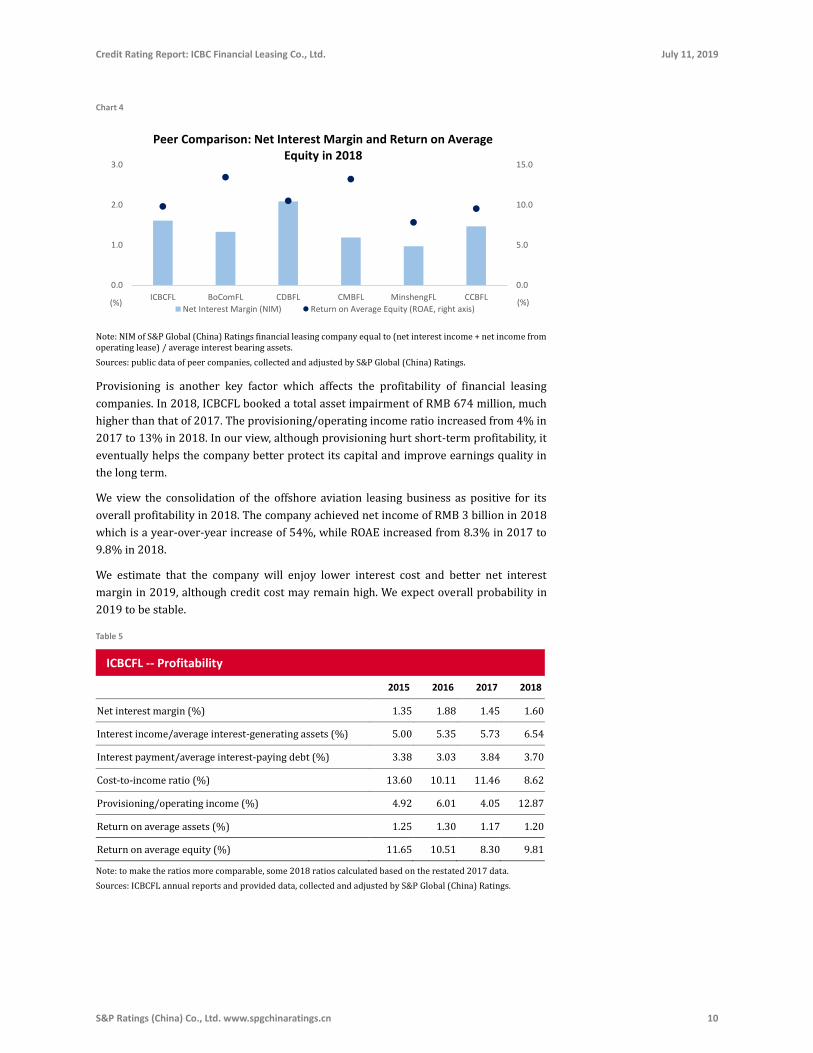
Chart 4
Note: NIM of S&P Global (China) Ratings financial leasing company equal to (net interest income + net income from operating lease) / average interest bearing assets.
Sources: public data of peer companies, collected and adjusted by S&P Global (China) Ratings.
Provisioning is another key factor which affects the profitability of financial leasing
companies. In 2018, ICBCFL booked a total asset impairment of RMB 674 million, much
higher than that of 2017. The provisioning/operating income ratio increased from 4% in
2017 to 13% in 2018. In our view, although provisioning hurt short-term profitability, it
eventually helps the company better protect its capital and improve earnings quality in
the long term.
We view the consolidation of the offshore aviation leasing business as positive for its
overall profitability in 2018. The company achieved net income of RMB 3 billion in 2018
which is a year-over-year increase of 54%, while ROAE increased from 8.3% in 2017 to
9.8% in 2018.
We estimate that the company will enjoy lower interest cost and better net interest
margin in 2019, although credit cost may remain high. We expect overall probability in
2019 to be stable.
Table 5
ICBCFL -- Profitability
2015 2016 2017 2018
Net interest margin (%) 1.35 1.88 1.45 1.60
Interest income/average interest-generating assets (%) 5.00 5.35 5.73 6.54
Interest payment/average interest-paying debt (%) 3.38 3.03 3.84 3.70
Cost-to-income ratio (%) 13.60 10.11 11.46 8.62
Provisioning/operating income (%) 4.92 6.01 4.05 12.87
Return on average assets (%) 1.25 1.30 1.17 1.20
Return on average equity (%) 11.65 10.51 8.30 9.81
Note: to make the ratios more comparable, some 2018 ratios calculated based on the restated 2017 data.
Sources: ICBCFL annual reports and provided data, collected and adjusted by S&P Global (China) Ratings.
0.0
5.0
10.0
15.0
0.0
1.0
2.0
3.0
ICBCFL BoComFL CDBFL CMBFL MinshengFL CCBFL(%)(%)
Peer Comparison: Net Interest Margin and Return on Average Equity in 2018
Net Interest Margin (NIM) Return on Average Equity (ROAE, right axis)
Credit Rating Report: ICBC Financial Leasing Co., Ltd. July 11, 2019
S&P Ratings (China) Co., Ltd. www.spgchinaratings.cn 11
ICBCFL has aligned itself
with ICBC for risk
culture and risk
management practices.
Its risk position is
stronger than average
finance companies,
resulting in one-notch
uplift for risk position.
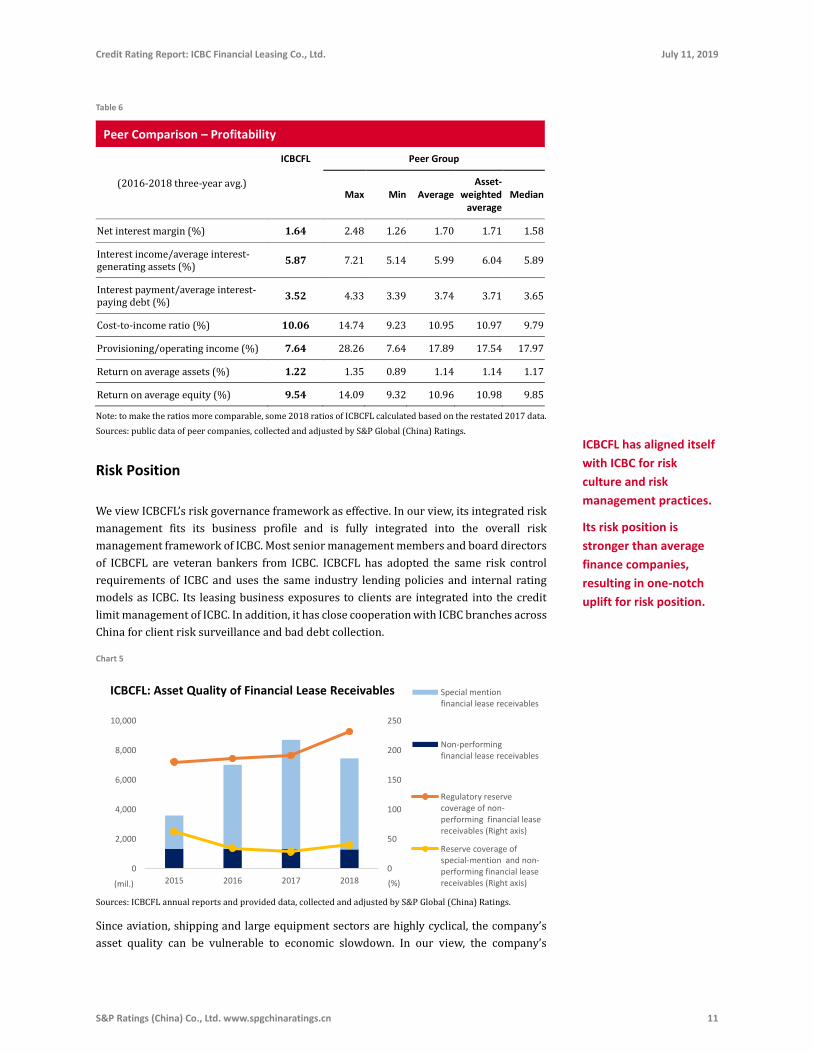
Table 6
Peer Comparison – Profitability
(2016-2018 three-year avg.)
ICBCFL Peer Group
Max Min Average Asset-
weighted average
Median
Net interest margin (%) 1.64 2.48 1.26 1.70 1.71 1.58
Interest income/average interest-generating assets (%)
5.87 7.21 5.14 5.99 6.04 5.89
Interest payment/average interest-paying debt (%)
3.52 4.33 3.39 3.74 3.71 3.65
Cost-to-income ratio (%) 10.06 14.74 9.23 10.95 10.97 9.79
Provisioning/operating income (%) 7.64 28.26 7.64 17.89 17.54 17.97
Return on average assets (%) 1.22 1.35 0.89 1.14 1.14 1.17
Return on average equity (%) 9.54 14.09 9.32 10.96 10.98 9.85
Note: to make the ratios more comparable, some 2018 ratios of ICBCFL calculated based on the restated 2017 data.
Sources: public data of peer companies, collected and adjusted by S&P Global (China) Ratings.
Risk Position
We view ICBCFL’s risk governance framework as effective. In our view, its integrated risk
management fits its business profile and is fully integrated into the overall risk
management framework of ICBC. Most senior management members and board directors
of ICBCFL are veteran bankers from ICBC. ICBCFL has adopted the same risk control
requirements of ICBC and uses the same industry lending policies and internal rating
models as ICBC. Its leasing business exposures to clients are integrated into the credit
limit management of ICBC. In addition, it has close cooperation with ICBC branches across
China for client risk surveillance and bad debt collection.
Chart 5
Sources: ICBCFL annual reports and provided data, collected and adjusted by S&P Global (China) Ratings.
Since aviation, shipping and large equipment sectors are highly cyclical, the company’s
asset quality can be vulnerable to economic slowdown. In our view, the company’s
0
50
100
150
200
250
0
2,000
4,000
6,000
8,000
10,000
2015 2016 2017 2018 (%)(mil.)
ICBCFL: Asset Quality of Financial Lease Receivables Special mentionfinancial lease receivables
Non-performingfinancial lease receivables
Regulatory reservecoverage of non-performing financial leasereceivables (Right axis)
Reserve coverage ofspecial-mention and non-performing financial leasereceivables (Right axis)
Credit Rating Report: ICBC Financial Leasing Co., Ltd. July 11, 2019
S&P Ratings (China) Co., Ltd. www.spgchinaratings.cn 12
effective risk management has mitigated this issue to some extent. ICBCFL has managed
to maintain a relatively stable and low non-performing financing lease receivable ratio.
The average non-performing lease receivable ratio from 2016 to 2018 is 1.2%. However,
special-mention assets in its financial lease business has increased from 2.0% in 2015 to
6.7% in 2017, and then dropped to 5.2% by the end of 2018.
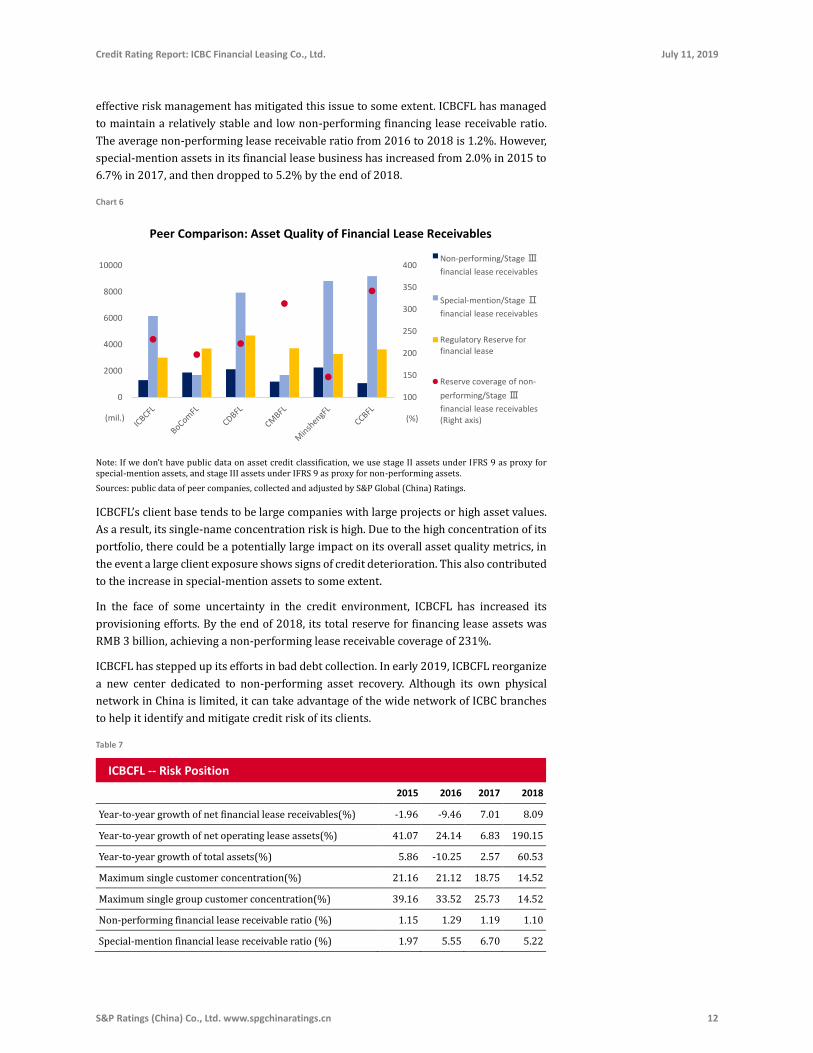
Chart 6
Note: If we don’t have public data on asset credit classification, we use stage II assets under IFRS 9 as proxy for special-mention assets, and stage III assets under IFRS 9 as proxy for non-performing assets.
Sources: public data of peer companies, collected and adjusted by S&P Global (China) Ratings.
ICBCFL’s client base tends to be large companies with large projects or high asset values.
As a result, its single-name concentration risk is high. Due to the high concentration of its
portfolio, there could be a potentially large impact on its overall asset quality metrics, in
the event a large client exposure shows signs of credit deterioration. This also contributed
to the increase in special-mention assets to some extent.
In the face of some uncertainty in the credit environment, ICBCFL has increased its
provisioning efforts. By the end of 2018, its total reserve for financing lease assets was
RMB 3 billion, achieving a non-performing lease receivable coverage of 231%.
ICBCFL has stepped up its efforts in bad debt collection. In early 2019, ICBCFL reorganize
a new center dedicated to non-performing asset recovery. Although its own physical
network in China is limited, it can take advantage of the wide network of ICBC branches
to help it identify and mitigate credit risk of its clients.
Table 7
ICBCFL -- Risk Position
2015 2016 2017 2018
Year-to-year growth of net financial lease receivables(%) -1.96 -9.46 7.01 8.09
Year-to-year growth of net operating lease assets(%) 41.07 24.14 6.83 190.15
Year-to-year growth of total assets(%) 5.86 -10.25 2.57 60.53
Maximum single customer concentration(%) 21.16 21.12 18.75 14.52
Maximum single group customer concentration(%) 39.16 33.52 25.73 14.52
Non-performing financial lease receivable ratio (%) 1.15 1.29 1.19 1.10
Special-mention financial lease receivable ratio (%) 1.97 5.55 6.70 5.22
100
150
200
250
300
350
400
0
2000
4000
6000
8000
10000
(%)(mil.)
Peer Comparison: Asset Quality of Financial Lease Receivables
Non-performing/Stage Ⅲ
financial lease receivables
Special-mention/Stage Ⅱ
financial lease receivables
Regulatory Reserve forfinancial lease
Reserve coverage of non-
performing/Stage Ⅲ
financial lease receivables (Right axis)
Credit Rating Report: ICBC Financial Leasing Co., Ltd. July 11, 2019
S&P Ratings (China) Co., Ltd. www.spgchinaratings.cn 13
Although ICBCFL has a
significant maturity
mismatch between
assets and liabilities, it
has reliable ongoing
liquidity supports from
its parent, which leads
to one-notch uplift for
funding and liquidity.
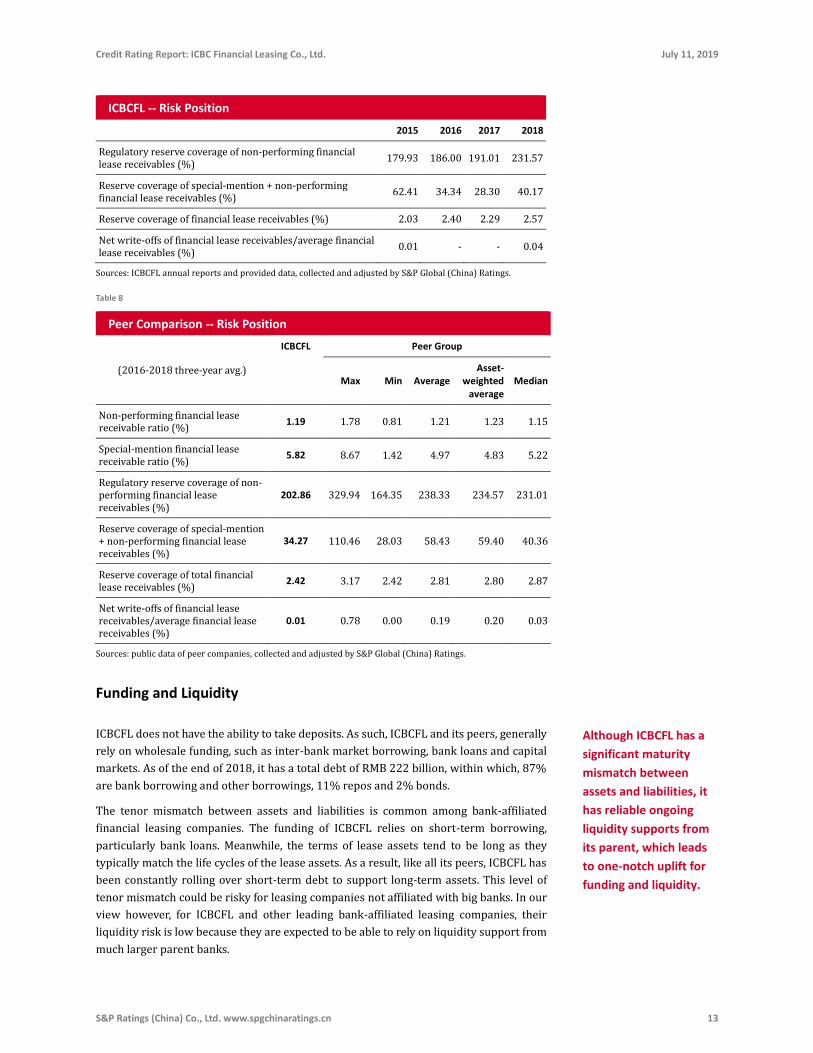
ICBCFL -- Risk Position
2015 2016 2017 2018
Regulatory reserve coverage of non-performing financial lease receivables (%)
179.93 186.00 191.01 231.57
Reserve coverage of special-mention + non-performing financial lease receivables (%)
62.41 34.34 28.30 40.17
Reserve coverage of financial lease receivables (%) 2.03 2.40 2.29 2.57
Net write-offs of financial lease receivables/average financial lease receivables (%)
0.01 - - 0.04
Sources: ICBCFL annual reports and provided data, collected and adjusted by S&P Global (China) Ratings.
Table 8
Peer Comparison -- Risk Position
(2016-2018 three-year avg.)
ICBCFL Peer Group
Max Min Average Asset-
weighted average
Median
Non-performing financial lease receivable ratio (%)
1.19 1.78 0.81 1.21 1.23 1.15
Special-mention financial lease receivable ratio (%)
5.82 8.67 1.42 4.97 4.83 5.22
Regulatory reserve coverage of non-performing financial lease receivables (%)
202.86 329.94 164.35 238.33 234.57 231.01
Reserve coverage of special-mention + non-performing financial lease receivables (%)
34.27 110.46 28.03 58.43 59.40 40.36
Reserve coverage of total financial lease receivables (%)
2.42 3.17 2.42 2.81 2.80 2.87
Net write-offs of financial lease receivables/average financial lease receivables (%)
0.01 0.78 0.00 0.19 0.20 0.03
Sources: public data of peer companies, collected and adjusted by S&P Global (China) Ratings.
Funding and Liquidity
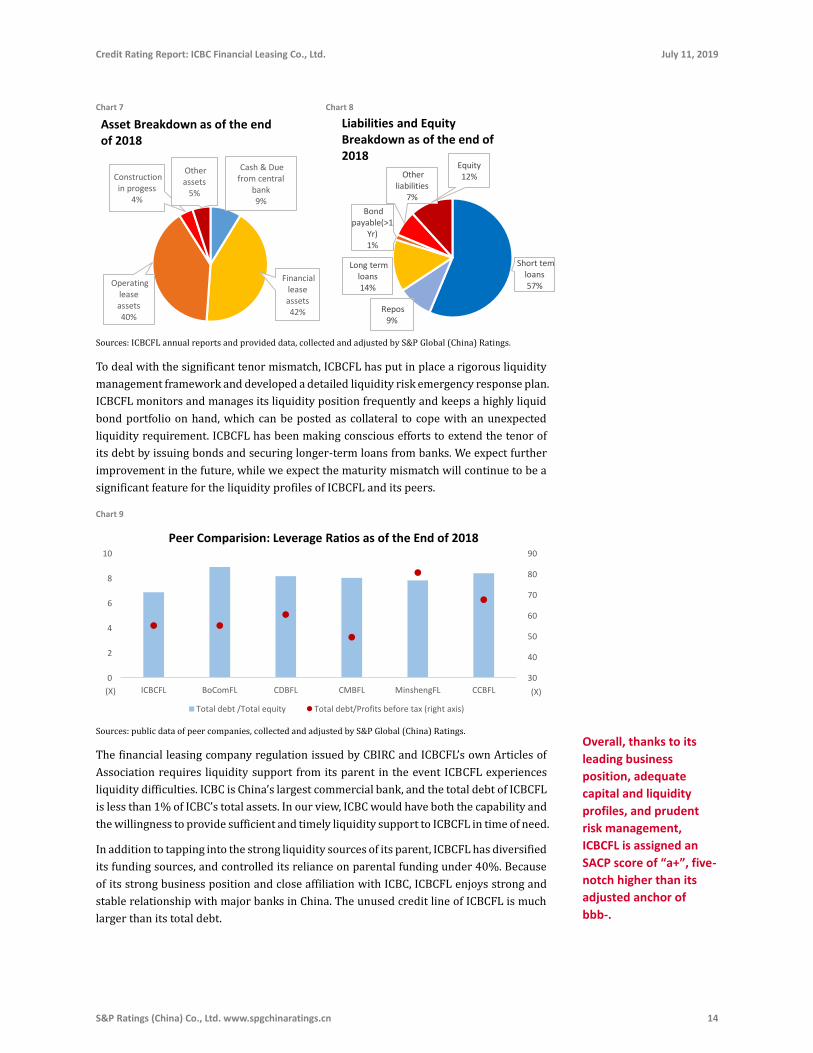
ICBCFL does not have the ability to take deposits. As such, ICBCFL and its peers, generally
rely on wholesale funding, such as inter-bank market borrowing, bank loans and capital
markets. As of the end of 2018, it has a total debt of RMB 222 billion, within which, 87%
are bank borrowing and other borrowings, 11% repos and 2% bonds.
The tenor mismatch between assets and liabilities is common among bank-affiliated
financial leasing companies. The funding of ICBCFL relies on short-term borrowing,
particularly bank loans. Meanwhile, the terms of lease assets tend to be long as they
typically match the life cycles of the lease assets. As a result, like all its peers, ICBCFL has
been constantly rolling over short-term debt to support long-term assets. This level of
tenor mismatch could be risky for leasing companies not affiliated with big banks. In our
view however, for ICBCFL and other leading bank-affiliated leasing companies, their
liquidity risk is low because they are expected to be able to rely on liquidity support from
much larger parent banks.
Credit Rating Report: ICBC Financial Leasing Co., Ltd. July 11, 2019
S&P Ratings (China) Co., Ltd. www.spgchinaratings.cn 14
Chart 7 Chart 8
Sources: ICBCFL annual reports and provided data, collected and adjusted by S&P Global (China) Ratings.
To deal with the significant tenor mismatch, ICBCFL has put in place a rigorous liquidity
management framework and developed a detailed liquidity risk emergency response plan.
ICBCFL monitors and manages its liquidity position frequently and keeps a highly liquid
bond portfolio on hand, which can be posted as collateral to cope with an unexpected
liquidity requirement. ICBCFL has been making conscious efforts to extend the tenor of
its debt by issuing bonds and securing longer-term loans from banks. We expect further
improvement in the future, while we expect the maturity mismatch will continue to be a
significant feature for the liquidity profiles of ICBCFL and its peers.
Chart 9
Sources: public data of peer companies, collected and adjusted by S&P Global (China) Ratings.
The financial leasing company regulation issued by CBIRC and ICBCFL’s own Articles of
Association requires liquidity support from its parent in the event ICBCFL experiences
liquidity difficulties. ICBC is China’s largest commercial bank, and the total debt of ICBCFL
is less than 1% of ICBC’s total assets. In our view, ICBC would have both the capability and
the willingness to provide sufficient and timely liquidity support to ICBCFL in time of need.
In addition to tapping into the strong liquidity sources of its parent, ICBCFL has diversified
its funding sources, and controlled its reliance on parental funding under 40%. Because
of its strong business position and close affiliation with ICBC, ICBCFL enjoys strong and
stable relationship with major banks in China. The unused credit line of ICBCFL is much
larger than its total debt.
Cash & Due from central
bank 9%
Financial lease assets 42%
Operating lease assets 40%
Construction in progess
4%
Other assets
5%
Asset Breakdown as of the end of 2018
Short tem loans 57%
Repos 9%
Long term loans 14%
Bond payable(>1
Yr) 1%
Other liabilities
7%
Equity12%
Liabilities and Equity Breakdown as of the end of 2018
30
40
50
60
70
80
90
0
2
4
6
8
10
ICBCFL BoComFL CDBFL CMBFL MinshengFL CCBFL (X)(X)
Peer Comparision: Leverage Ratios as of the End of 2018
Total debt /Total equity Total debt/Profits before tax (right axis)
Overall, thanks to its
leading business
position, adequate
capital and liquidity
profiles, and prudent
risk management,
ICBCFL is assigned an
SACP score of “a+”, five-
notch higher than its
adjusted anchor of
bbb-.
Credit Rating Report: ICBC Financial Leasing Co., Ltd. July 11, 2019
S&P Ratings (China) Co., Ltd. www.spgchinaratings.cn 15
Because ICBCFL is
critical to its parent,
given the extremely low
credit risk of ICBC, an
Issuer Credit Rating of
AAA has been assigned
to ICBCFL, which is a
four-notch uplift from
its SACP of a+.
We view that when the market liquidity tightens, the major risk facing the company could
be the profitability pressure caused by the rising cost of capital rather than refinancing
risk.
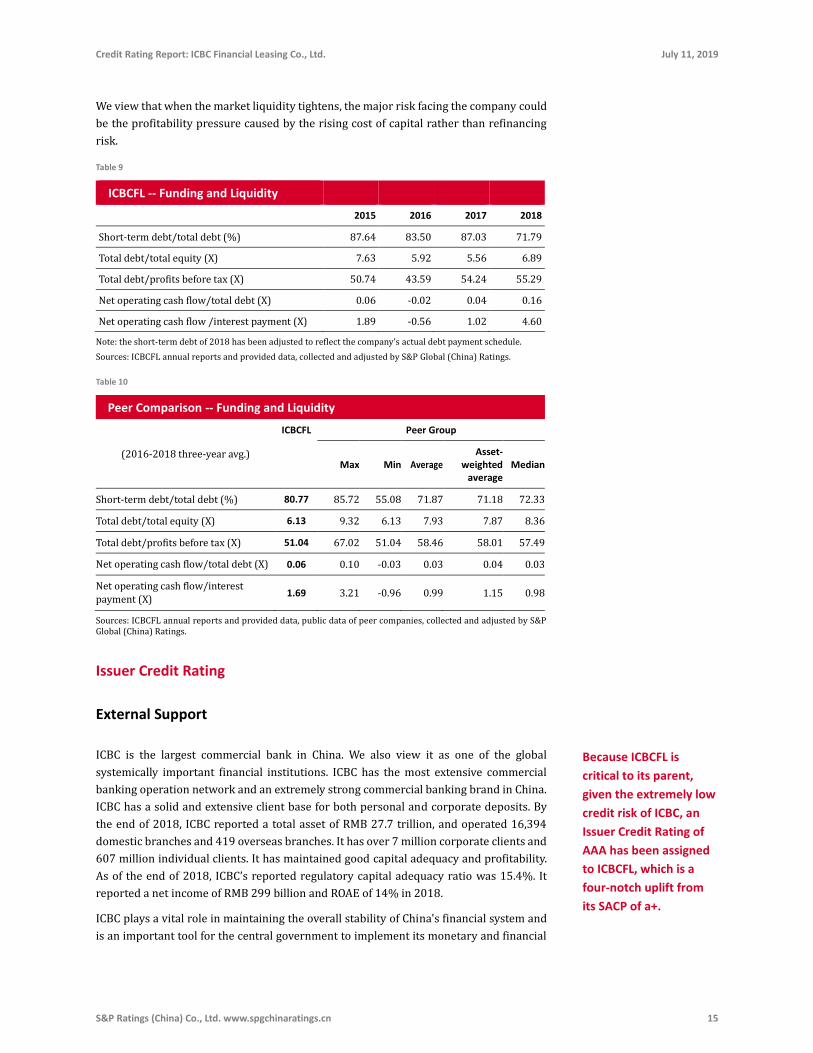
Table 9
ICBCFL -- Funding and Liquidity
2015 2016 2017 2018
Short-term debt/total debt (%) 87.64 83.50 87.03 71.79
Total debt/total equity (X) 7.63 5.92 5.56 6.89
Total debt/profits before tax (X) 50.74 43.59 54.24 55.29
Net operating cash flow/total debt (X) 0.06 -0.02 0.04 0.16
Net operating cash flow /interest payment (X) 1.89 -0.56 1.02 4.60
Note: the short-term debt of 2018 has been adjusted to reflect the company’s actual debt payment schedule.
Sources: ICBCFL annual reports and provided data, collected and adjusted by S&P Global (China) Ratings.
Table 10
Peer Comparison -- Funding and Liquidity
(2016-2018 three-year avg.)
ICBCFL Peer Group
Max Min Average Asset-
weighted average
Median
Short-term debt/total debt (%) 80.77 85.72 55.08 71.87 71.18 72.33
Total debt/total equity (X) 6.13 9.32 6.13 7.93 7.87 8.36
Total debt/profits before tax (X) 51.04 67.02 51.04 58.46 58.01 57.49
Net operating cash flow/total debt (X) 0.06 0.10 -0.03 0.03 0.04 0.03
Net operating cash flow/interest payment (X)
1.69 3.21 -0.96 0.99 1.15 0.98
Sources: ICBCFL annual reports and provided data, public data of peer companies, collected and adjusted by S&P Global (China) Ratings.
Issuer Credit Rating
External Support
ICBC is the largest commercial bank in China. We also view it as one of the global
systemically important financial institutions. ICBC has the most extensive commercial
banking operation network and an extremely strong commercial banking brand in China.
ICBC has a solid and extensive client base for both personal and corporate deposits. By
the end of 2018, ICBC reported a total asset of RMB 27.7 trillion, and operated 16,394
domestic branches and 419 overseas branches. It has over 7 million corporate clients and
607 million individual clients. It has maintained good capital adequacy and profitability.
As of the end of 2018, ICBC’s reported regulatory capital adequacy ratio was 15.4%. It
reported a net income of RMB 299 billion and ROAE of 14% in 2018.
ICBC plays a vital role in maintaining the overall stability of China's financial system and
is an important tool for the central government to implement its monetary and financial
Credit Rating Report: ICBC Financial Leasing Co., Ltd. July 11, 2019
S&P Ratings (China) Co., Ltd. www.spgchinaratings.cn 16
policies. ICBC’s largest shareholder is the central government and this shareholding is
long-term and strategic. Its biggest shareholders are Central Huijin Investment Ltd. and
Ministry of Finance, respectively holding 34.71% and 34.60% of its shares. As a result, the
combined shareholding by the central government is 69.31%. In addition, the senior
management team of ICBC has been appointed by the central government.
Overall, as the biggest commercial bank in China, ICBC has a very strong business position
and financial strength. It is critical to the central government, and we believe the
likelihood of government support, in time of stress, is almost certain. As a result, ICBC’s
overall credit risk is extremely low.
ICBCFL is wholly owned by ICBC, and it is one of the largest non-bank subsidiaries of ICBC
in terms of total assets. We believe that ICBCFL is a core subsidiary of ICBC. ICBCFL’s
business is an integral part of the ICBC group to provide a full package of financial services
to its corporate clients. Leasing has become an important supplement for bank loans. The
products and services offered by ICBCFL can provide special added values to large
corporate clients in aviation, shipping, energy, transportation and infrastructure
industries.
An effective corporate governance framework has been set up between ICBCFL and its
parent. ICBC has set up a board of directors to oversee the subsidiary and appointed its
management. ICBC monitors the key business and financial performance indicators of
ICBCFL, ensures consistency of risk appetite, underwriting standards and exposure limit
execution between the parent and the leasing subsidiary. In our view, ICBC has provided
effective ongoing support for the company in terms of business development, capital
injection and funding supports.
Liquidity and capital support from the parent to ICBCFL in time of stress is required by
Chinese regulations. A regulation issued by the bank regulator in 2014 requires liquidity
and capital supports from controlling shareholders to its financial leasing companies. To
comply with this regulation, ICBCFL amended its Articles of Association in the same year
which provides for ICBC to provide liquidity support in case the company faces payment
difficulty and to promptly replenish the company's capital levels if operational losses lead
to capital erosion.
Overall, ICBC has been providing strong ongoing support to ICBCFL and it is required to
provide extraordinary supports by regulations in time of stress. As a result, ICBCFL’s
ratings are closely aligned with ICBC’s credit quality. In addition, based on the importance
of ICBC to central government and the importance of ICBCFL to ICBC, we believe indirect
government support through the parent is also highly likely. Given the extremely high
credit quality of ICBC, we assign an Issuer Credit Rating of AAA to ICBCFL.
Credit Rating Report: ICBC Financial Leasing Co., Ltd. July 11, 2019
S&P Ratings (China) Co., Ltd. www.spgchinaratings.cn 17
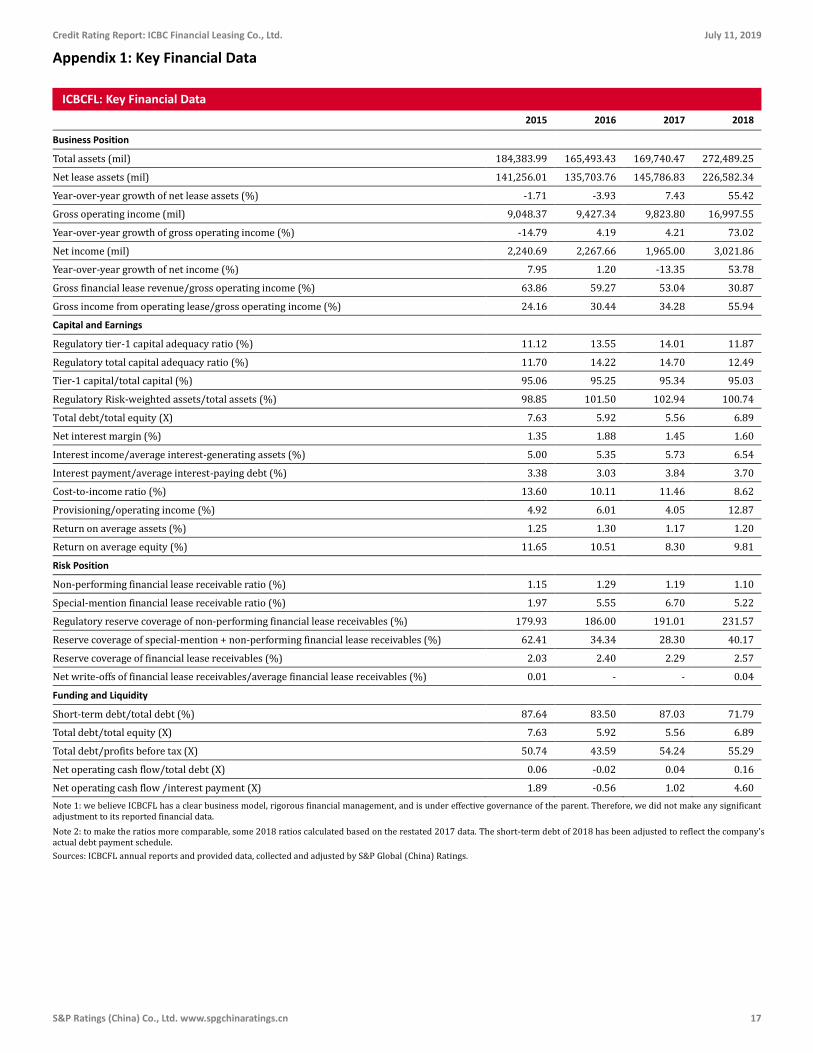
Appendix 1: Key Financial Data
ICBCFL: Key Financial Data
2015 2016 2017 2018
Business Position
Total assets (mil) 184,383.99 165,493.43 169,740.47 272,489.25
Net lease assets (mil) 141,256.01 135,703.76 145,786.83 226,582.34
Year-over-year growth of net lease assets (%) -1.71 -3.93 7.43 55.42
Gross operating income (mil) 9,048.37 9,427.34 9,823.80 16,997.55
Year-over-year growth of gross operating income (%) -14.79 4.19 4.21 73.02
Net income (mil) 2,240.69 2,267.66 1,965.00 3,021.86
Year-over-year growth of net income (%) 7.95 1.20 -13.35 53.78
Gross financial lease revenue/gross operating income (%) 63.86 59.27 53.04 30.87
Gross income from operating lease/gross operating income (%) 24.16 30.44 34.28 55.94
Capital and Earnings
Regulatory tier-1 capital adequacy ratio (%) 11.12 13.55 14.01 11.87
Regulatory total capital adequacy ratio (%) 11.70 14.22 14.70 12.49
Tier-1 capital/total capital (%) 95.06 95.25 95.34 95.03
Regulatory Risk-weighted assets/total assets (%) 98.85 101.50 102.94 100.74
Total debt/total equity (X) 7.63 5.92 5.56 6.89
Net interest margin (%) 1.35 1.88 1.45 1.60
Interest income/average interest-generating assets (%) 5.00 5.35 5.73 6.54
Interest payment/average interest-paying debt (%) 3.38 3.03 3.84 3.70
Cost-to-income ratio (%) 13.60 10.11 11.46 8.62
Provisioning/operating income (%) 4.92 6.01 4.05 12.87
Return on average assets (%) 1.25 1.30 1.17 1.20
Return on average equity (%) 11.65 10.51 8.30 9.81
Risk Position
Non-performing financial lease receivable ratio (%) 1.15 1.29 1.19 1.10
Special-mention financial lease receivable ratio (%) 1.97 5.55 6.70 5.22
Regulatory reserve coverage of non-performing financial lease receivables (%) 179.93 186.00 191.01 231.57
Reserve coverage of special-mention + non-performing financial lease receivables (%) 62.41 34.34 28.30 40.17
Reserve coverage of financial lease receivables (%) 2.03 2.40 2.29 2.57
Net write-offs of financial lease receivables/average financial lease receivables (%) 0.01 - - 0.04
Funding and Liquidity
Short-term debt/total debt (%) 87.64 83.50 87.03 71.79
Total debt/total equity (X) 7.63 5.92 5.56 6.89
Total debt/profits before tax (X) 50.74 43.59 54.24 55.29
Net operating cash flow/total debt (X) 0.06 -0.02 0.04 0.16
Net operating cash flow /interest payment (X) 1.89 -0.56 1.02 4.60
Note 1: we believe ICBCFL has a clear business model, rigorous financial management, and is under effective governance of the parent. Therefore, we did not make any significant adjustment to its reported financial data.
Note 2: to make the ratios more comparable, some 2018 ratios calculated based on the restated 2017 data. The short-term debt of 2018 has been adjusted to reflect the company’s actual debt payment schedule.
Sources: ICBCFL annual reports and provided data, collected and adjusted by S&P Global (China) Ratings.
Credit Rating Report: ICBC Financial Leasing Co., Ltd. July 11, 2019
S&P Ratings (China) Co., Ltd. www.spgchinaratings.cn 18
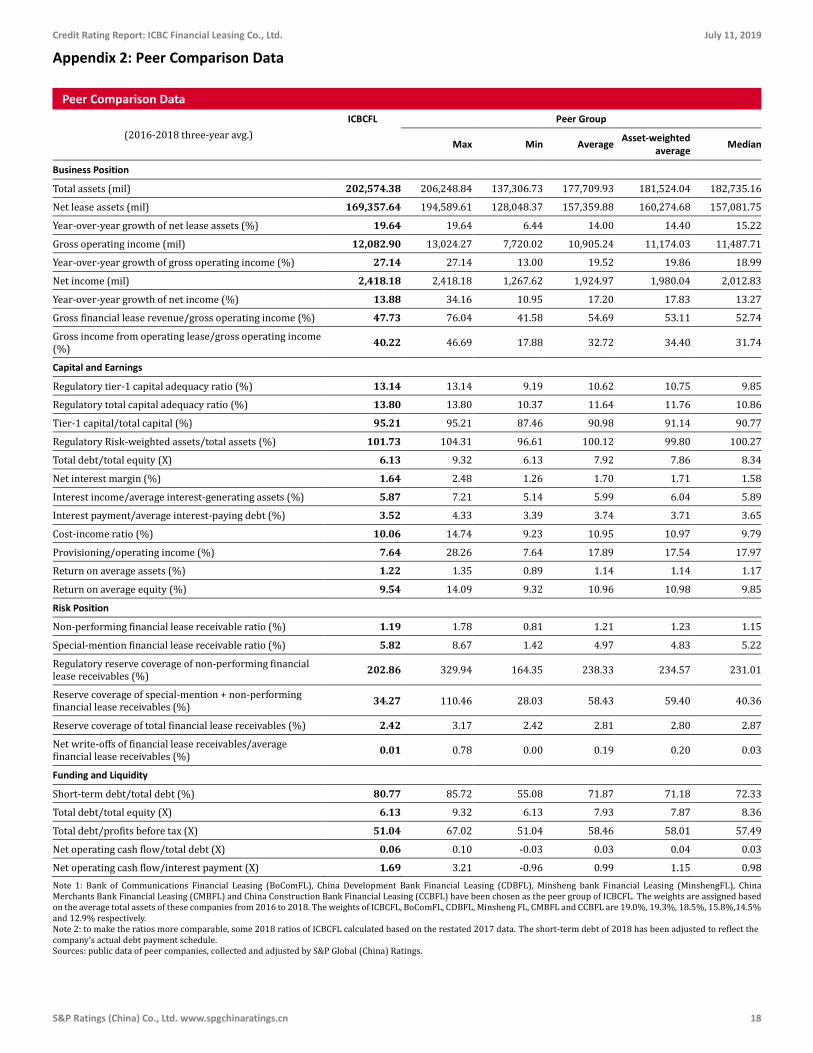
Appendix 2: Peer Comparison Data
Peer Comparison Data
(2016-2018 three-year avg.)
ICBCFL Peer Group
Max Min Average Asset-weighted
average Median
Business Position
Total assets (mil) 202,574.38 206,248.84 137,306.73 177,709.93 181,524.04 182,735.16
Net lease assets (mil) 169,357.64 194,589.61 128,048.37 157,359.88 160,274.68 157,081.75
Year-over-year growth of net lease assets (%) 19.64 19.64 6.44 14.00 14.40 15.22
Gross operating income (mil) 12,082.90 13,024.27 7,720.02 10,905.24 11,174.03 11,487.71
Year-over-year growth of gross operating income (%) 27.14 27.14 13.00 19.52 19.86 18.99
Net income (mil) 2,418.18 2,418.18 1,267.62 1,924.97 1,980.04 2,012.83
Year-over-year growth of net income (%) 13.88 34.16 10.95 17.20 17.83 13.27
Gross financial lease revenue/gross operating income (%) 47.73 76.04 41.58 54.69 53.11 52.74
Gross income from operating lease/gross operating income (%)
40.22 46.69 17.88 32.72 34.40 31.74
Capital and Earnings
Regulatory tier-1 capital adequacy ratio (%) 13.14 13.14 9.19 10.62 10.75 9.85
Regulatory total capital adequacy ratio (%) 13.80 13.80 10.37 11.64 11.76 10.86
Tier-1 capital/total capital (%) 95.21 95.21 87.46 90.98 91.14 90.77
Regulatory Risk-weighted assets/total assets (%) 101.73 104.31 96.61 100.12 99.80 100.27
Total debt/total equity (X) 6.13 9.32 6.13 7.92 7.86 8.34
Net interest margin (%) 1.64 2.48 1.26 1.70 1.71 1.58
Interest income/average interest-generating assets (%) 5.87 7.21 5.14 5.99 6.04 5.89
Interest payment/average interest-paying debt (%) 3.52 4.33 3.39 3.74 3.71 3.65
Cost-income ratio (%) 10.06 14.74 9.23 10.95 10.97 9.79
Provisioning/operating income (%) 7.64 28.26 7.64 17.89 17.54 17.97
Return on average assets (%) 1.22 1.35 0.89 1.14 1.14 1.17
Return on average equity (%) 9.54 14.09 9.32 10.96 10.98 9.85
Risk Position
Non-performing financial lease receivable ratio (%) 1.19 1.78 0.81 1.21 1.23 1.15
Special-mention financial lease receivable ratio (%) 5.82 8.67 1.42 4.97 4.83 5.22
Regulatory reserve coverage of non-performing financial lease receivables (%)
202.86 329.94 164.35 238.33 234.57 231.01
Reserve coverage of special-mention + non-performing financial lease receivables (%)
34.27 110.46 28.03 58.43 59.40 40.36
Reserve coverage of total financial lease receivables (%) 2.42 3.17 2.42 2.81 2.80 2.87
Net write-offs of financial lease receivables/average financial lease receivables (%)
0.01 0.78 0.00 0.19 0.20 0.03
Funding and Liquidity
Short-term debt/total debt (%) 80.77 85.72 55.08 71.87 71.18 72.33
Total debt/total equity (X) 6.13 9.32 6.13 7.93 7.87 8.36
Total debt/profits before tax (X) 51.04 67.02 51.04 58.46 58.01 57.49
Net operating cash flow/total debt (X) 0.06 0.10 -0.03 0.03 0.04 0.03
Net operating cash flow/interest payment (X) 1.69 3.21 -0.96 0.99 1.15 0.98
Note 1: Bank of Communications Financial Leasing (BoComFL), China Development Bank Financial Leasing (CDBFL), Minsheng bank Financial Leasing (MinshengFL), China Merchants Bank Financial Leasing (CMBFL) and China Construction Bank Financial Leasing (CCBFL) have been chosen as the peer group of ICBCFL. The weights are assigned based on the average total assets of these companies from 2016 to 2018. The weights of ICBCFL, BoComFL, CDBFL, Minsheng FL, CMBFL and CCBFL are 19.0%, 19.3%, 18.5%, 15.8%,14.5% and 12.9% respectively. Note 2: to make the ratios more comparable, some 2018 ratios of ICBCFL calculated based on the restated 2017 data. The short-term debt of 2018 has been adjusted to reflect the company’s actual debt payment schedule. Sources: public data of peer companies, collected and adjusted by S&P Global (China) Ratings.
Credit Rating Report: ICBC Financial Leasing Co., Ltd. July 11, 2019
S&P Ratings (China) Co., Ltd. www.spgchinaratings.cn 19
Copyright © 2019 by S&P Ratings (China) Co., Ltd. All rights reserved.
S&P Ratings (China) Co., Ltd. (“S&P Ratings”) owns the copyright and/or other related intellectual property rights of the abovementioned content (including ratings, credit-related analyses and data, valuations, model, software or other application or output therefrom) or any part thereof (Content). No Content may be modified, reverse engineered, reproduced or distributed in any form by any means, or stored in a database or retrieval system, without the prior written permission of S&P Ratings. The Content shall not be used for any unlawful or unauthorized purposes. S&P Ratings and any third-party providers, as well as their directors, officers, shareholders, employees or agents (collectively "S&P Parties") do not guarantee the accuracy, completeness, timeliness or availability of the Content. S&P Parties are not responsible for any errors or omissions (negligent or otherwise), regardless of the cause, for the results obtained from the use of the Content, or for the security or maintenance of any data input by the user. The Content is provided on an “as is” basis. S&P PARTIES DISCLAIM ANY AND ALL EXPRESS OR IMPLIED WARRANTIES, INCLUDING, BUT NOT LIMITED TO, ANY WARRANTIES OF MERCHANTABILITY OR FITNESS FOR A PARTICULAR PURPOSE OR USE, FREEDOM FROM BUGS, SOFTWARE ERRORS OR DEFECTS, THAT THE CONTENT’S FUNCTIONING WILL BE UNINTERRUPTED OR THAT THE CONTENT WILL OPERATE WITH ANY SOFTWARE OR HARDWARE CONFIGURATION. In no event shall S&P Parties be liable to any party for any direct, indirect, incidental, exemplary, compensatory, punitive, special or consequential damages, costs, expenses, legal fees, or losses (including, without limitation, lost income or lost profits and opportunity costs or losses caused by negligence) in connection with any use of the Content even if advised of the possibility of such damages.
Credit-related and other analyses, including ratings, and statements in the Content are statements of opinion as of the date they are expressed and not statements of fact. S&P Ratings' opinions, analyses, forecasts and rating acknowledgment decisions (described below) are not and should not be viewed as recommendations to purchase, hold, or sell any securities or to make any investment decisions, and do not address the suitability of any security. S&P Ratings assumes no obligation to update the Content following publication in any form or format. The Content should not be relied on and is not a substitute for the skill, judgment and experience of the user, its management, employees, advisors and / or clients when making investment and other business decisions. S&P Ratings does not act as a fiduciary or an investment advisor except where registered as such. While S&P Ratings has obtained information from sources it believes to be reliable, S&P Ratings does not perform an audit and undertakes no duty of due diligence or independent verification of any information it receives. Rating-related publications may be published for a variety of reasons that are not necessarily dependent on action by rating committees, including, but not limited to, the publication of a periodic update on a credit rating and related analyses.
A RATING ISSUED BY S&P RATINGS IS ASSIGNED ON A RATING SCALE SPECIFICALLY FOR USE IN CHINA, AND IS S&P RATINGS' OPINION OF AN OBLIGOR’S OVERALL CREDITWORTHINESS OR CAPACITY TO MEET SPECIFIC FINANCIAL OBLIGATIONS, RELATIVE TO THAT OF OTHER ISSUERS AND ISSUSES WITHIN CHINA ONLY AND PROVIDES A RANK ORDERING OF CREDIT RISK WITHIN CHINA. AN S&P RATINGS' RATING IS NOT A GLOBAL SCALE RATING, AND IS NOT AND SHOULD NOT BE VIEWED, RELIED UPON, OR REPRESENTED AS SUCH. S&P PARTIES ARE NOT RESPONSIBLE FOR ANY LOSSES CAUSED BY USES OF S&P RATINGS' RATINGS IN MANNERS CONTRARY TO THIS PARAGRAPH.
To the extent that regulatory authorities allow a rating agency to acknowledge in one jurisdiction a rating issued in another jurisdiction for certain regulatory purposes, S&P Ratings reserves the right to assign, withdraw or suspend such acknowledgement at any time and in its sole discretion. S&P Ratings disclaims any duty whatsoever arising out of the assignment, withdrawal or suspension of an acknowledgment as well as any liability for any damage alleged to have been suffered on account thereof.
S&P Ratings keeps certain activities of its business units separate from each other in order to preserve the independence and objectivity of their respective activities. As a result, certain business units of S&P Ratings may have information that is not available to other S&P Ratings business units. S&P Ratings has established policies and procedures to maintain the confidentiality of certain non-public information received in connection with each analytical process.
S&P Ratings may receive compensation for its ratings and certain analyses, normally from issuers or underwriters of securities or from obligors. S&P Ratings reserves the right to disseminate its opinions and analyses. S&P Ratings' public ratings and analyses are made available on its Web site www.spgchinaratings.cn, and may be distributed through other means, including via S&P Ratings' publications and third-party redistributors.