![Laboratory Microchem Silliker Private Limited, A-513 ... Fibre GAFTA 2003 [10:0] IS: 12711 - 1989 (Reaffirmed 1994) 1 - 30 % ... 5 - 99 % Sodium Chloride (Salt) IS: 2860 - 1964 (Reaffirmed](https://static.fdocuments.us/doc/165x107/5aa219487f8b9ada698c7644/laboratory-microchem-silliker-private-limited-a-513-fibre-gafta-2003-100.jpg)
TURKEY 0.091288848 0.31 Credit & Issue Rating Banking ... · private equity, leasing, factoring and...
20
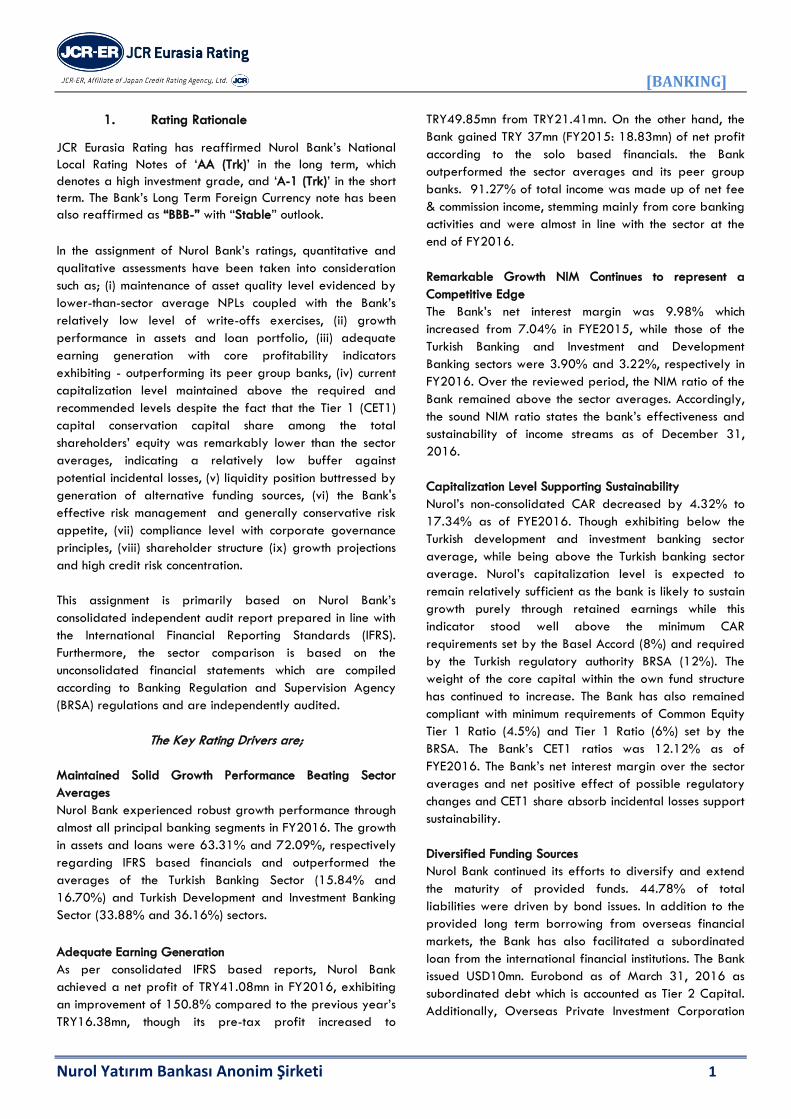
TURKEY Copyright © 2007 by JCR Eurasia Rating. 19 Mayıs Mah., 19 Mayıs Cad., Nova Baran Plaza No:4 Kat: 12 Şişli-İSTANBUL Telephone: +90(212)352.56.73 Fax: +90 (212) 352.56.75 Reproduction is prohibited except by permission. All rights reserved. All information has been obtained from sources JCR Eurasia Rating believes to be reliable. However, JCR Eurasia Rating does not guarantee the truth, accuracy and adequacy of this information. JCR Eurasia Rating ratings are objective and independent opinions as to the creditworthiness of a security and issuer and not to be considered a recommendation to buy, hold or sell any security or to issue a loan. This rating report has been composed within the methodologies registered with and certified by the SPK (CMB-Capital Markets Board of Turkey), BDDK (BRSA-Banking Regulation and Supervision Agency) and internationally accepted rating principles and guidelines but is not covered by NRSRO regulations. http://www.jcrer.com.tr Credit & Issue Rating Updated Banking [Financial Institutions] Long Term Short Term International Foreign Currency BBB- A-3 Local Currency BBB A-3 Outlook FC Stable Stable LC Stable Stable Issue Rating n.a. n.a. National Local Rating AA(Trk) A-1(Trk) Outlook Stable Stable Issue Rating AA(Trk) A-1(Trk) Sponsor Support 1 - Stand Alone AB - Sovereign* Foreign Currency BBB- - Local Currency BBB- - Outlook FC Stable - LC Stable - *Affirmed by Japan Credit Rating Agency on October 7,2016 Chief Analyst: Orkun İNAN +90 212 352 56 73 [email protected] 9.977248812 7.038781998 6.398667315 4.437502728 6.183027592 0 2 4 6 8 10 12 NIM (%) 63.31 12.16 45.48 73.21 34.94 0.00 20.00 40.00 60.00 80.00 Growth Rate (%) 5.287183697 3.160331535 3.744637723 0.091288848 2.112945816 0 2 4 6 ROAA (%) 17.34 21.66 16.89 14.20 19.01 0.00 5.00 10.00 15.00 20.00 25.00 2016 2015 2014 2013 2012 CAR (%) 14.38 18.00 16.64 20.60 44.62 0.00 10.00 20.00 30.00 40.00 50.00 2016 2015 2014 2013 2012 Equity / Assets (%) 33.55 18.21 20.52 0.31 5.05 0.00 20.00 40.00 60.00 ROAE (%) Nurol Yatırım Bankası A.Ş. F i n a n c i a l D a t a 2016* 2015* 2014* 2013* 2012* Total Assets (000 USD) 390,384 246,300 275,358 206,021 142,552 Total Assets (000 TRY) 1,169,551 716,141 638,527 438,907 253,401 Total Net Loans (000 TRY) 742,918 431,711 356,456 241,190 150,576 Equity (000 TRY) 168,218 128,936 106,222 90,422 113,057 Net Profit (00 TRY) 41,083 16,381 15,867 0,516 3,872 Market Share (%) ** 0.043 0.0305 0.0318 0.0250 0.0181 ROAA (%) 5.29 3.16 3.74 0.09 2.11 ROAE (%) 33.55 18.21 20.52 0.31 5.05 Equity/T. Assets (%) 14.38 18.00 16.64 20.60 44.62 CAR - Capital Adequacy Ratio (%) 17.34 21.66 16.89 14.20 19.01 Asset Growth Rate (Annual) (%) 63.31 12.16 45.48 73.21 34.94 * End of Year - Based on IFRS Financials ** On Solo Basis Among the Turkish Banking Sector Overview Nurol Yatırım Bankası A.Ş. (hereinafter “Nurol Bank” or the “Bank”), was incorporated in August,1998 and started its operations in May,1999. The Bank carries out operations in the fields of financial consulting, structured finance, private equity, leasing, factoring and cash loans- guarantees through a workforce of 44 as of December 31,2016. Nurol is a small-sized Investment Bank in Turkish Development and Investment Banking Sector, accounting for 0.82% of total assets as of December 31,2016. The Bank ranked 35 th (FYE2015:37 th ) in terms of assets size among the 47 banks in the Turkish financial market and had a 0.043% market share in the entire banking sector at the end of FY2016. The majority shareholders of the Bank were Nurol Holding A.Ş. (78.16%) and Nurol İnşaat ve Tic. A.Ş. (15.96%), which also has direct and indirect control over the Nurol Group-has operations in construction, defense, finance, tourism, health, mining, real estate, marketing and manufacturing industries through 33 firms within the Group. Strengths • Although its sector wide downward trend, the Bank’s profitability indicators with recurring revenue components outperforming sectorial averages, • Despite expanding its loan portfolio, high level of asset quality regarding below-the-sector NPL figures, • Strengthened liquidity structure thanks to diversified and extended the maturity of funds, • Loan book growth rate, being above the Turkey’s banking sector average despite weaker credit demand as interest rates gradually picked up in the country, • High level of compliance regarding corporate governance implementations and sustainability accompanied by well- established managerial practices and advanced risk management system. Constraints • High penetration level of the Turkish financial system increasing risks for sectorial growth, • Declining in the capital adequacy ratio in line with the banking sector's average despite setting aside sufficient capital to withstand shocks, • Continuation of high credit risk concentration among the top ten cash and non-cash loans customers, • Scarce alternative delivery channels to provide continuity of efficiency rates, • Domestic and international political instability, which like a domino effect on macro indicators and translation into national currency depreciation and more expensive funding.
-
Upload
phunghuong -
Category
Documents
-
view
215 -
download
0
Transcript of TURKEY 0.091288848 0.31 Credit & Issue Rating Banking ... · private equity, leasing, factoring and...
TURKEY
Copyright © 2007 by JCR Eurasia Rating. 19 Mayıs Mah., 19 Mayıs Cad., Nova Baran Plaza No:4 Kat: 12 Şişli-İSTANBUL Telephone: +90(212)352.56.73 Fax: +90 (212) 352.56.75
Reproduction is prohibited except by permission. All rights reserved. All information has been obtained from sources JCR Eurasia Rating believes to be reliable. However, JCR Eurasia
Rating does not guarantee the truth, accuracy and adequacy of this information. JCR Eurasia Rating ratings are objective and independent opinions as to the creditworthiness of a
security and issuer and not to be considered a recommendation to buy, hold or sell any security or to issue a loan. This rating report has been composed within the methodologies
registered with and certified by the SPK (CMB-Capital Markets Board of Turkey), BDDK (BRSA-Banking Regulation and Supervision Agency) and internationally accepted rating
principles and guidelines but is not covered by NRSRO regulations. http://www.jcrer.com.tr
Credit & Issue Rating
Updated
Banking
[Financial Institutions]
Long Term Short Term
Inte
rna
tiona
l Foreign Currency BBB- A-3
Local Currency BBB A-3
Outlook FC Stable Stable
LC Stable Stable
Issue Rating n.a. n.a.
Na
tiona
l Local Rating AA(Trk) A-1(Trk)
Outlook Stable Stable
Issue Rating AA(Trk) A-1(Trk)
Sponsor Support 1 -
Stand Alone AB -
Sove
reig
n* Foreign Currency BBB- -
Local Currency BBB- -
Outlook FC Stable -
LC Stable -
*Affirmed by Japan Credit Rating Agency on October 7,2016
Chief Analyst: Orkun İNAN
+90 212 352 56 73 [email protected]
9.977248812
7.0387819986.398667315
4.437502728
6.183027592
0
2
4
6
8
10
12
NIM (%)
63.31
12.16
45.48
73.21
34.94
0.00
20.00
40.00
60.00
80.00
Growth Rate (%)
5.287183697
3.160331535
3.744637723
0.091288848
2.112945816
0
2
4
6
ROAA (%)
17.34
21.66
16.89
14.20
19.01
0.00
5.00
10.00
15.00
20.00
25.00
20162015201420132012
CAR (%)
14.3818.0016.64
20.60
44.62
0.00
10.00
20.00
30.00
40.00
50.00
20162015201420132012
Equity / Assets (%)
33.55
18.2120.52
0.315.05
0.00
20.00
40.00
60.00
ROAE (%)
Nurol Yatırım Bankası A.Ş.
F i n a n c i a l D a t a 2016* 2015* 2014* 2013* 2012*
Total Assets (000 USD) 390,384 246,300 275,358 206,021 142,552
Total Assets (000 TRY) 1,169,551 716,141 638,527 438,907 253,401
Total Net Loans (000 TRY) 742,918 431,711 356,456 241,190 150,576
Equity (000 TRY) 168,218 128,936 106,222 90,422 113,057
Net Profit (00 TRY) 41,083 16,381 15,867 0,516 3,872
Market Share (%) ** 0.043 0.0305 0.0318 0.0250 0.0181
ROAA (%) 5.29 3.16 3.74 0.09 2.11
ROAE (%) 33.55 18.21 20.52 0.31 5.05
Equity/T. Assets (%) 14.38 18.00 16.64 20.60 44.62
CAR - Capital Adequacy Ratio (%) 17.34 21.66 16.89 14.20 19.01
Asset Growth Rate (Annual) (%) 63.31 12.16 45.48 73.21 34.94
* End of Year - Based on IFRS Financials ** On Solo Basis Among the Turkish Banking Sector
Overview
Nurol Yatırım Bankası A.Ş. (hereinafter “Nurol Bank” or the “Bank”), was
incorporated in August,1998 and started its operations in May,1999. The Bank
carries out operations in the fields of financial consulting, structured finance,
private equity, leasing, factoring and cash loans- guarantees through a
workforce of 44 as of December 31,2016.
Nurol is a small-sized Investment Bank in Turkish Development and Investment
Banking Sector, accounting for 0.82% of total assets as of December 31,2016.
The Bank ranked 35th (FYE2015:37th) in terms of assets size among the 47
banks in the Turkish financial market and had a 0.043% market share in the
entire banking sector at the end of FY2016.
The majority shareholders of the Bank were Nurol Holding A.Ş. (78.16%) and
Nurol İnşaat ve Tic. A.Ş. (15.96%), which also has direct and indirect control
over the Nurol Group-has operations in construction, defense, finance, tourism,
health, mining, real estate, marketing and manufacturing industries through 33
firms within the Group.
Strengths
• Although its sector wide downward trend, the Bank’s
profitability indicators with recurring revenue components
outperforming sectorial averages,
• Despite expanding its loan portfolio, high level of asset
quality regarding below-the-sector NPL figures,
• Strengthened liquidity structure thanks to diversified and
extended the maturity of funds,
• Loan book growth rate, being above the Turkey’s banking
sector average despite weaker credit demand as interest
rates gradually picked up in the country,
• High level of compliance regarding corporate governance
implementations and sustainability accompanied by well-
established managerial practices and advanced risk
management system.
Constraints
• High penetration level of the Turkish financial system increasing
risks for sectorial growth,
• Declining in the capital adequacy ratio in line with the banking
sector's average despite setting aside sufficient capital to
withstand shocks,
• Continuation of high credit risk concentration among the top ten
cash and non-cash loans customers,
• Scarce alternative delivery channels to provide continuity of
efficiency rates,
• Domestic and international political instability, which like a
domino effect on macro indicators and translation into national
currency depreciation and more expensive funding.
[BANKING]
Nurol Yatırım Bankası Anonim Şirketi 1
1. Rating Rationale
JCR Eurasia Rating has reaffirmed Nurol Bank’s National
Local Rating Notes of ‘AA (Trk)’ in the long term, which
denotes a high investment grade, and ‘A-1 (Trk)’ in the short
term. The Bank’s Long Term Foreign Currency note has been
also reaffirmed as “BBB-” with “Stable” outlook.
In the assignment of Nurol Bank’s ratings, quantitative and
qualitative assessments have been taken into consideration
such as; (i) maintenance of asset quality level evidenced by
lower-than-sector average NPLs coupled with the Bank’s
relatively low level of write-offs exercises, (ii) growth
performance in assets and loan portfolio, (iii) adequate
earning generation with core profitability indicators
exhibiting - outperforming its peer group banks, (iv) current
capitalization level maintained above the required and
recommended levels despite the fact that the Tier 1 (CET1)
capital conservation capital share among the total
shareholders’ equity was remarkably lower than the sector
averages, indicating a relatively low buffer against
potential incidental losses, (v) liquidity position buttressed by
generation of alternative funding sources, (vi) the Bank's
effective risk management and generally conservative risk
appetite, (vii) compliance level with corporate governance
principles, (viii) shareholder structure (ix) growth projections
and high credit risk concentration.
This assignment is primarily based on Nurol Bank’s
consolidated independent audit report prepared in line with
the International Financial Reporting Standards (IFRS).
Furthermore, the sector comparison is based on the
unconsolidated financial statements which are compiled
according to Banking Regulation and Supervision Agency
(BRSA) regulations and are independently audited.
The Key Rating Drivers are;
Maintained Solid Growth Performance Beating Sector
Averages
Nurol Bank experienced robust growth performance through
almost all principal banking segments in FY2016. The growth
in assets and loans were 63.31% and 72.09%, respectively
regarding IFRS based financials and outperformed the
averages of the Turkish Banking Sector (15.84% and
16.70%) and Turkish Development and Investment Banking
Sector (33.88% and 36.16%) sectors.
Adequate Earning Generation
As per consolidated IFRS based reports, Nurol Bank
achieved a net profit of TRY41.08mn in FY2016, exhibiting
an improvement of 150.8% compared to the previous year’s
TRY16.38mn, though its pre-tax profit increased to
TRY49.85mn from TRY21.41mn. On the other hand, the
Bank gained TRY 37mn (FY2015: 18.83mn) of net profit
according to the solo based financials. the Bank
outperformed the sector averages and its peer group
banks. 91.27% of total income was made up of net fee
& commission income, stemming mainly from core banking
activities and were almost in line with the sector at the
end of FY2016.
Remarkable Growth NIM Continues to represent a
Competitive Edge
The Bank’s net interest margin was 9.98% which
increased from 7.04% in FYE2015, while those of the
Turkish Banking and Investment and Development
Banking sectors were 3.90% and 3.22%, respectively in
FY2016. Over the reviewed period, the NIM ratio of the
Bank remained above the sector averages. Accordingly,
the sound NIM ratio states the bank’s effectiveness and
sustainability of income streams as of December 31,
2016.
Capitalization Level Supporting Sustainability
Nurol’s non-consolidated CAR decreased by 4.32% to
17.34% as of FYE2016. Though exhibiting below the
Turkish development and investment banking sector
average, while being above the Turkish banking sector
average. Nurol’s capitalization level is expected to
remain relatively sufficient as the bank is likely to sustain
growth purely through retained earnings while this
indicator stood well above the minimum CAR
requirements set by the Basel Accord (8%) and required
by the Turkish regulatory authority BRSA (12%). The
weight of the core capital within the own fund structure
has continued to increase. The Bank has also remained
compliant with minimum requirements of Common Equity
Tier 1 Ratio (4.5%) and Tier 1 Ratio (6%) set by the
BRSA. The Bank’s CET1 ratios was 12.12% as of
FYE2016. The Bank’s net interest margin over the sector
averages and net positive effect of possible regulatory
changes and CET1 share absorb incidental losses support
sustainability.
Diversified Funding Sources
Nurol Bank continued its efforts to diversify and extend
the maturity of provided funds. 44.78% of total
liabilities were driven by bond issues. In addition to the
provided long term borrowing from overseas financial
markets, the Bank has also facilitated a subordinated
loan from the international financial institutions. The Bank
issued USD10mn. Eurobond as of March 31, 2016 as
subordinated debt which is accounted as Tier 2 Capital.
Additionally, Overseas Private Investment Corporation
[BANKING]
Nurol Yatırım Bankası Anonim Şirketi 2
(OPIC) provided USD10mn. loans as of December 12, 2016.
Short Term Funding Base Exert Pressure on Liquidity
Management
As an investment bank, Nurol Yatirim Bank is not entitled to
collect customer deposits. Therefore, the Bank is funded
through issued debt securities, borrowed funds from domestic
institutions, current balances of its loan customers and equity.
Adequate liquidity level without funding gap or violations
remaining compliant with BRSA parameters. Moreover, the
Bank has initiated some efforts to provide trade finance
facilities in FY2016.
Persisting High Credit Risk Concentration
The Bank’s largest 10 corporate customers constituted
78.60% of the total corporate cash outstanding loans and
72% of total non-cash loans, maintaining high concentration
levels. The Bank’s high concentration level, a by-product of
the Company’s decision to focus on larger corporate
customers, increases the exposure to a single-party risk.
High Level of Compliance regarding Corporate Governance
Implementations and Sustainability
Nurol has high compliance level with the corporate
governance principles particularly regarding the exercise of
shareholders’ rights, efficient and comprehensive system of
public disclosure and the Bank website together serving as
an effective platform in their supporting the transparency
level, comprehensive risk management system with
functionalized organizational units of internal control and
internal audit, contributions to publicly known event and
project.
2. Outlook
JCR Eurasia Rating has reaffirmed “Stable” outlooks on the
short and long term national and international ratings
perspectives of Nurol Yatırım Bank, regarding its capability
to maintain internal equity generation capacity, new funding
sources despite the slight deterioration in capital adequacy
ratio level-well above the legal and targeted boundaries
indicating the capacity to absorb incidental losses-.
Substantial factors that may be taken into consideration
for any future positive changes in ratings and outlook
status include: (i) an enhancement in capital strength through
a considerable cash equity injection, (ii) remarkable
improvements in profitability ratios,(iii) continuity of efforts to
diversify funding mix and extend the maturity profile, (iv)
notable improvement in market efficiencies, (v) steadiness of
recovery in the global economy, (vi) an upgrade of Turkey’s
country ceiling ratings.
Key considerations which would constrain the ratings are
(i) permanency of the deterioration in asset quality
through an increase in NPLs resulting from weakened
debt-servicing capability of real sector firms, (ii)
continuity of below sector average weak profitability
indicators, (iii) diminution in capital adequacy strength,
(iv) probable adversities of ongoing geopolitical risks, (v)
deterioration in liquidity ratios along with the possible
difficulties in accessing external fund resources and
downgrading the sovereign rating level of Turkey.
3. Sponsor Support and Stand Alone
Sponsor Support notes and risk assessments reflect the
financial strength and expected assistance of the
controlling shareholders. It is considered that the utmost
shareholder has the tendency and satisfactory financial
strength to offer financial support when liquidity needs
arise in the short or long term perspective. Based on
these assessments, the Sponsor Support Note of the Bank
has been reaffirmed as “1”, which denotes a strong
external support possibility.
On the other hand, even if the shareholders or public
authorities do not provide any assistance, the Bank is
expected to be able to manage its balance sheet risks
successfully given its own strong equity base and
capitalization levels which are adequate to absorb
incidental losses. Within this context, the Stand-Alone
Grade of the Bank has been reaffirmed as “AB” in JCR
Eurasia’s notation system, which signifies a strong and
credible bank.
4. Company Profile
a. History
Nurol Yatırım Bankası A.Ş. was established on August
6, 1998 as an investment Bank and commenced
operations in May 1999. The Bank was set up as a
subsidiary of Nurol Holding, a prominent conglomerate
in Turkey with stakes in various industries and a
primary focus on the Construction & Contracting,
Defence & Production, Energy, Trading & Service,
Finance and Tourism sectors. While the corporate,
retail, investment and regional banking constitute the
principal axis of Nurol Bank’s operations, the Bank also
offers financial leasing, factoring, trade finance and
consulting services.

[BANKING]
Nurol Yatırım Bankası Anonim Şirketi 3
b. Organization & Employees
The Bank’s headquarters is located in Istanbul. The Bank
has employed a staff force of 44 (FY2015: 39). The Board
of Nurol Bank consists of ten members, three of whom are
independent members and a general manager. According
to Capital Market Board (CMB) principles three of Board
Members should be independent and the members of the
audit committee of the BoD are accepted as independent
members. The Company’s organization structure includes
4- Committee (pricing committee, credit, corporate, audit,
asset and liability, discipline and personnel, information
systems strategy) 2 chief assistant general managers, 5
assistant general managers.
c. Shareholders, Subsidiaries
The main shareholder of Nurol Bank is Nurol Holding A.Ş.,
which holds 78.16% of total shares. Nurol Holding A.Ş.,
although set up in 1989; trace back to the establishment of
its flagship company Nurol İnşaat ve Ticaret A.Ş in 1966.
Nurol Holding is currently carrying out activities mainly in
construction and contracting sectors and in defence,
manufacturing industry, real estate investment, energy,
tourism, mining, finance, trade and service sectors with more
than 33 subsidiaries, affiliates, branch offices and project
partnerships within the country and abroad. Nurol Holding’s
total assets reached TRY9.20bn while total equity was
around TRY1.60bn. as of FYE2015. Additionally, the
Group’s sales revenue increased to TRY3.45bn in FY2015
from TRY2.51bn. in FY2014.
The table below indicates the detailed shareholding structure
of the Bank.
The table below indicates the detailed Nurol Holding
A.Ş.’s main engaged sectors.
Nurol Holding A.Ş.'s Engaged Sectors
Construction and Contracting
Nurol İnşaat ve Tic. A.Ş.
Nurol Gayrimenkul Yatırım Ort. A.Ş.
Nurol Makina ve Sanayi A.Ş. Çelik İşletmeleri
Otoyol Yatırım ve İşletme A.Ş.
Defence and Production
Nurol Makina ve Sanayi A.Ş.
Nurol Teknoloji San. ve Mad. Tic. A.Ş.
FNSS Savunma Sistemleri A.Ş.
Financial Services
Nurol Yatırım Bankası A.Ş.
Nurol Sigorta Aracılık Hizmetleri A.Ş.
Commercial and Services
Nurol İşletme ve Gayrimenkul Yönetim A.Ş.
Botim İşletme Yönetim ve Tic. A.Ş.
Energy and Mining Sector
TÜMAD Madencilik San. ve Tic. A.Ş.
Nurol Enerji Üretim ve Pazarlama A.Ş.
Nurol Göksu Elektrik Üretim A.Ş.
Enova Enerji Üretim A.Ş.
Tourism
Turser Turizm Serv. ve Tic. A.Ş.
Bosfor Turizm İşletmecilik A.Ş.
Nurol Kulüp Salima Tatil Köyü ve Turizm İşletmeleri A.Ş
Sheraton Batumi Otel
The following table shows the current shareholder
structure of Nurol Holding A.Ş. as of December,2015.
Shareholders Structure 2015 (TRY) Share %
Nurettin Çarmıklı 258,454,800 0.3330603
Erol Çarmıklı 258,454,800 0.3330603
Mehmet Oğuz Çarmıklı 258,454,800 0.3330603
Eyüp Sabri Çarmıklı 93,030 0.0001199
Gaye Çarmıklı 93,030 0.0001199
Gürol Çarmıklı 62,020 0.0000799
Gürhan Çarmıklı 62,020 0.0000799
Gözde Çarmıklı 62,020 0.0000799
Eda Çarmıklı Yolcu 62,020 0.0000799
S. Ceyda Çarmıklı 62,020 0.0000799
Oğuzhan Çarmıklı 62,020 0.0000799
Aynur Türkan Çarmıklı 38,710 0.0000499
Müjgan Sevgi Kayaalp 22,408 0.0000289
Melih Kayaalp 8,151 0.0000105
Semih Kayaalp 8,151 0.0000105
Paid Capital (000 TRY) 776,000,000 100
Shareholders Structure 2016
Share Amount Share %
Nurol Holding A.Ş. 35,171 78.1578
Nurol İnşaat ve Tic A.Ş. 7,182 15.9600
Nurol Otelcilik ve Tur İşl. A.Ş. 397 0.8822
Nurettin Çarmıklı 400 0.8889
Erol Çarmıklı 400 0.8889
Mehmet Oğuz Çarmıklı 400 0.8889
Eyüp Sabri Çarmıklı 350 0.7778
Oğuzhan Çarmıklı 350 0.7778
Gürol Çarmıklı 175 0.3889
Gürhan Çarmıklı 175 0.3889
Paid Capital (000 TL) 45,000 45,000

[BANKING]
Nurol Yatırım Bankası Anonim Şirketi 4
d. Corporate Governance
Although Nurol Bank is not a publicly traded company, Nurol
Bank carries out its operations under Banking Law and the
Banking Regulation and Supervision Authority (BRSA)
regulations. The Bank mostly complies with the Communiqué
on Corporate Governance Principles of Banks’ published on
November 1, 2006 by BRSA. In accordance with the
regulation, the Bank has a Corporate and Remuneration
committee and disclosed its mission, vision, strategies,
periodic financials, annual reports and ethical rules. In
addition, The Bank’s web site provides information and
documentation in terms of transparency and contains the
shareholder structure, curriculum vitae of the BoD and top
management, articles of association and organization chart.
Nurol Bank has a Corporate Governance Committee
responsible for monitoring whether the Corporate
Governance Principles are complied with expressing the
issues that may originate stemming from non-compliance and
submitting reformative activity to its Board of Directors. In
this regard, the compliance level of the Bank is satisfactory.
The Bank revises the articles of association and other internal
regulations as deemed necessary. Moreover, the Bank has
an Investor Relations Department.
The Bank’s Board is composed of ten members and
qualifications of the members meet the terms expressed in
the principles. As can be seen in the resumes found on the
Bank’s website, the members possess the necessary
qualifications in terms of education, professional and
managerial experience. According to Capital Market Board
(CMB) principles, three of Board Members should be
independent and the members of the audit committee of the
BoD are accepted as independent members.
We, as JCR Eurasia Rating, are of the opinion that the senior
management of the Company is adequate in terms of
education, experience and managerial skills.
5. Sector Analysis
The Turkish banking sector, regulated by the BRSA-Banking
Regulation and Supervision Agency; consists of deposit
banks, development and investment banks, and participation
banks which operates on the basis of dividends in the
framework of Islamic rules. The asset size of the banking
sector, which has the largest share in the Turkish financial
system, was USD 799bn. (TRY2.73bn) by the end of 2016.
SUMMARY OF KEY INDICATORS OF THE TURKISH BANKING SECTOR
(000.000) 2016 2015 2014 2013
Asset Size -TL 2,730,942 2,357,386 1,994,263 1,732,382
Asset Size-USD 799,129 807,850 857,047 813,172
Equity-TL 300,171 262,213 231,941 193,704
Profit-TL 37,532 26,052 24,610 24,664
ROAE% 1.86 1.52 1.69 2.01
ROAE% 16.81 13.38 14.79 16.59
NPL Ratio% 3.23 3.09 2.85 2.75
Capital Adequacy Ratio %
15.57 15.56 16.30 15.30
Equity / Total Assets
10.99 11.12 11.63 11.18
Loans / Deposits% 1.16 1.18 1.17 1.10
Asset / GDP ratio in Turkey is close to the level of
developing countries, but lower than the average of
developed countries. Therefore, the growth potential of
the Turkish banking sector is still high compared to the
average.
Although the Turkish banking sector achieved an increase
in profitability by 44.06% in absolute terms in 2016
compared to the previous year, the profitability
performance of the banking sector was 23.01% in dollar
terms due to the extraordinary depreciation of TRY.
Macro prudential measures taken to curb the current
account deficit, especially using credit cards and vehicle
credits, have resulted with changes at the business model
and competitiveness level of the banking sector.
However, the system was loosened in 2016 with new
regulations in this area.
The financial strength of the Turkish banking sector to
support the economic activity and growth remains largely
preserved in 2016, although the exceptional value losses
of the TRY caused this strength to be weakened and the
potential of the Sector’s ability to reach out new
resources is rasped. The borrowing costs of the banks
from abroad is in an increasing trend, due to the Fed’s
contractionary monetary policy. On the other hand, the
increase in the monetary expansion of the European and
Far East markets is limiting the side effects of Fed’s
attitude. limiting the increase. The loose monetary
policies of the European Central Bank will continue to

[BANKING]
Nurol Yatırım Bankası Anonim Şirketi 5
support the Turkish banking sector in terms of funding costs in
2017.
Turkey is not exposed to the risk of refinancing the banks in
Turkey, although it is stated that the banking sector will be
put under pressure due to the poor record of the tourism
sector, the weak Turkish Lira, and the energy sector
pressured by low energy prices. In addition, the Turkish
banking sector has always been able to expand its long-
term expansion and increase the credit volume thanks to its
high capital adequacy level. Because the Turkish banking
sector has double-buffer in terms of Capital Adequacy
Ratio. Therefore, according to JCR-ER, the outlook of the
Turkish banking sector is stable, not negative.
Although the average interest margins of the Turkish banking
system, which are downed to the 3-3.5%, are still higher
than developed countries. The Turkish banking sector still
maintains its high net profit margins on local currency and
the efforts continue to increase non-interest income steadily.
Despite its low asset size, the Sector maintained its positive
position in 2016, with high profitability, high deposit share,
high capital ratio, high inflation and high real growth.
However, the continuation of the growth rate in 2017
depends on the stability of the local currency.
In the Turkish Banking Sector, the number of banks operating
in 2014 rose from 51 to 52 in 2015 and to 53 in 2016.
Internet, ATM and POS investments are continuing to increase
in order to increase the accessibility of the banking services.
The concentration of assets, loans and deposits in the sector
is quite high. In all three areas, the share of the top five
banks is close up to 60%. The highest concentration is in
deposits, loans and profit generated, respectively.
The share of non-residents in the equity structure of the
sector is quite high.
NUMBER OF BANKS
State Banks
Private Banks
SDIF Bank
Foreign Banks
TOTAL
DEPOSIT BANKS (*) 3 9 1 21 34
DEVELOPMENT & INVESTMENT BANKS (*)
4 4 - 5 13
PARTICIPATION BANKS 2 - 1 3 6
TOPLAM 9 13 2 29 53
NUMBER OF BRANCHES
State Banks
Private Banks
SDIF Bank
Foreign Banks
TOTAL
DEPOSIT BANKS (*) 3,699 4.225 1 3,018 10,943
DEVELOPMENT & INVESTMENT BANKS (*)
24 13 - 5 42
PARTICIPATION BANKS 77 - - 886 963
TOPLAM 3,800 4.238 1 3,909 11,948
NUMBER OF STAFF
State Banks
Private Banks
SDIF Bank
Foreign Banks
TOTAL
DEPOSIT BANKS (*) 57,509 74,097 221 60,583 192,41
DEVELOPMENT & INVESTMENT BANKS (*)
3,994 1,100 - 215 5,309
PARTICIPATION BANKS 1,116 - - 13,402 14,518
TOPLAM 62,619 75,197 221 74,200 212,23
7
The legal framework of the Turkish banking sector, which
overlaps with the main lines of the EU legislation, except
for abroad branches and deposit guarantees, has been
shaped in accordance with the criteria of consolidation of
integration with global economies, the Basel Accords and
the capital requirement directives (CRD). Within this
context, the European Commission affirmed that both the
control framework and the regulatory framework of the
Turkish banking sector were largely compatible and
equivalent to the EU regime, as of December 2016.
Regarding the regulatory framework, this high level of
equivalence was considered to have originated from the
advanced implementation of Basel III in Turkish
legislation. In terms of risk management, the Turkish
banking sector is capable of managing its pricing and
balance sheet balances in international norms.
The banking sector that is the one that most affected by
national and international regulations, constantly
changing customer demands, developing technology, and
social-political structural changes. In this aspect, it is
expected that banks' agenda will be increasingly
engaged in key issues such as capital, liquidity,
profitability, cost management and digitalization of
internal processes. Especially in 2017, digitalization will
gain importance in cost management and competition.
The Turkish banking sector has a highly dynamic structure
in product and service formations, which is structured with
a flexibility that is in line with the ever-changing
expectations of credit and deposit customers and
investors within the scope of innovative and sustainable
business models. The deepening of capital markets with
the strong capital structure of banking will also continue

[BANKING]
Nurol Yatırım Bankası Anonim Şirketi 6
in 2017 as an advantage in collecting deposits and in
inward / outward borrowing.
The Turkish banking sector, which is not yet at the desired
level of scale and cost efficiency, will intensify its structuring
and growth strategies in this particular area.
In the Turkish banking sector, while innovative approaches to
branching and alternative channels are being demonstrated,
the importance of multi-branching still remains. The elasticity
coefficients of the Turkish banking sector are well above the
global optimum levels in terms of lending capacity, interest
volatility and regulatory pressures. Legal arrangements
increase the resilience of banks to crises, as well as create
downward pressure on productivity and profitability.
However, financial innovations created at the national and
global level can significantly eliminate the negative effects
of regulatory constraints.
Banks mainly provide deposit-based financing, while the use
of alternative sources is also increasing. Due to the increasing
funding opportunities, parallel to the expansion of the
quantities in the developed countries, the foreign liabilities of
the banks have increased in recent years. The external debt
restructuring rate of the banking sector is above 100 percent
and the long-term funding from abroad contributes to the
prolongation of the passive market. Banks' securities issuance
continues to grow in an accelerating rate.
The ratio of non-performing loans to equity was 12.87% in
2012, 15.29% in 2013, 15.69% in 2014, 18.13% in 2015
and 19.35% in 2016. In 2016, the ratio of non-performing
loans highly increased by 22.15% in nominal terms and the
share of the problematic loans compared to the previous
year in total credits was mathematically higher than the
previous year because the nominal increase rate in total
loans (16.90%). As of 2016, the conversion rate to non-
performing loan is 3.23%. It should also be noted that
banking sector sells certain impaired receivables in bundles
to “asset management companies”, reducing the impaired
receivable amount in the balance sheet and reducing the
NPL ratio.
As of the end of 2012, the capital adequacy ratio of the
sector increased from 17,90% to 15,30% at the end of
2013 and rose to 16,30% at the end of 2014 and rose to
15,56% at the end of 2015, and lastly to 15.57% in 2016.
The fact that 84.40% of legal equity is composed of main
capital has shown that the industry maintains good quality of
equity structure, but the level of 90% in the past is gradually
decreasing.
In 2016, as in 2015, the banking sector has
fundamentally funded its asset growth from loans and
required reserves through an increase in deposits, equity,
issued securities and borrowings.
SECTOR 2013 2014 2015 2016
PARTICIPATION BANKS 5.55 5.23 5.10 4.87
DEVELOPMENT AND INVESTMENT BANKS
4.05 4.24 4.52 5.23
DEPOSIT BANKS 90.41 90.53 90.37 89.91
Total 100.00 100.00 100.00 100.00
As of the end of 2016, 89.91% of the banking sector is
comprised of deposit banks, whereas 5.23% and 4.87%
belongs to participation banks development and
investment banks respectively. Cumulatively in the last 13
years, the Turkish banking sector has grown almost every
year and this growth has reached a very high rate of
1149.45% between 2004-2016.
On the basis of the USD, the Turkish banking sector grew
by 388.53% over the years 2003-2016. For the last two
years, Turkish banking sector shrank in dollar terms due
to the depreciation of TL.
In 2016, development and investment banks sustained
the most growth at 33.88%. The annual growth rate of
participation banks was 10.50% and the growth rate of
deposit banks was 15.24%, year on year. Contrary to
previous years, the low growth of participation banking
stemmed from the transfer of Bank Asya to the SDIF in
2014 and the problems of the public sector.
In 2015, the Turkish banking sector's total assets grew by
15.84%, with TRY 7.58 billion in foreign currency and
8.26% in TRY resources. Asset growth was 8.13% in
foreign currency assets and 7.71% in TL assets.
In terms of contributing to growth in resources, foreign
currency deposits were ranked first, borrowing from
banks were ranked second, and TRY deposits were
[BANKING]
Nurol Yatırım Bankası Anonim Şirketi 7
ranked third. In terms of contributing to growth within the
assets, the first order was TRY loans, the second order was
foreign currency loans, and the third order was obligatory.
The share of deposits in total resources has decreased from
61.9% in 2005, to 52.83% at the end of 2015 and to
53.23% in 2016, while the basic funding balance within
banking resources is still deposits.
In terms of assets, the weight of the securities in the Turkish
banking sector decreased gradually to 12,75%. Credits
increased from 38.93% in 2005 to 63.51% at the end of
2016. The highest increase among the assets due to the
CBRT's reserve ratios within macroeconomic policies has been
challenged in the item of required reserved items. Provisions
constituting 3.68% of assets in 2005 accounted for 6.74% of
assets at the end of 2016. There is a desire to slow down
credit growth as the basis for raising the allowance rates.
While the Turkish banking sector has generally started to
show a downward trend in its profitability indicators, the
current relatively high levels continued in 2016 as well. The
funding structure of the sector is dominated by deposits,
necessitating more branching and operating expenses, which
in turn causes downward reflection on the sector's
profitability. On the other hand, the banks fully reflect the
expected loss rates in the lending process to interest margins
on prudential principles. This weakens the return on assets.
The high level of non-interest expenses indicates that banks
might still need to increase their operational efficiency.
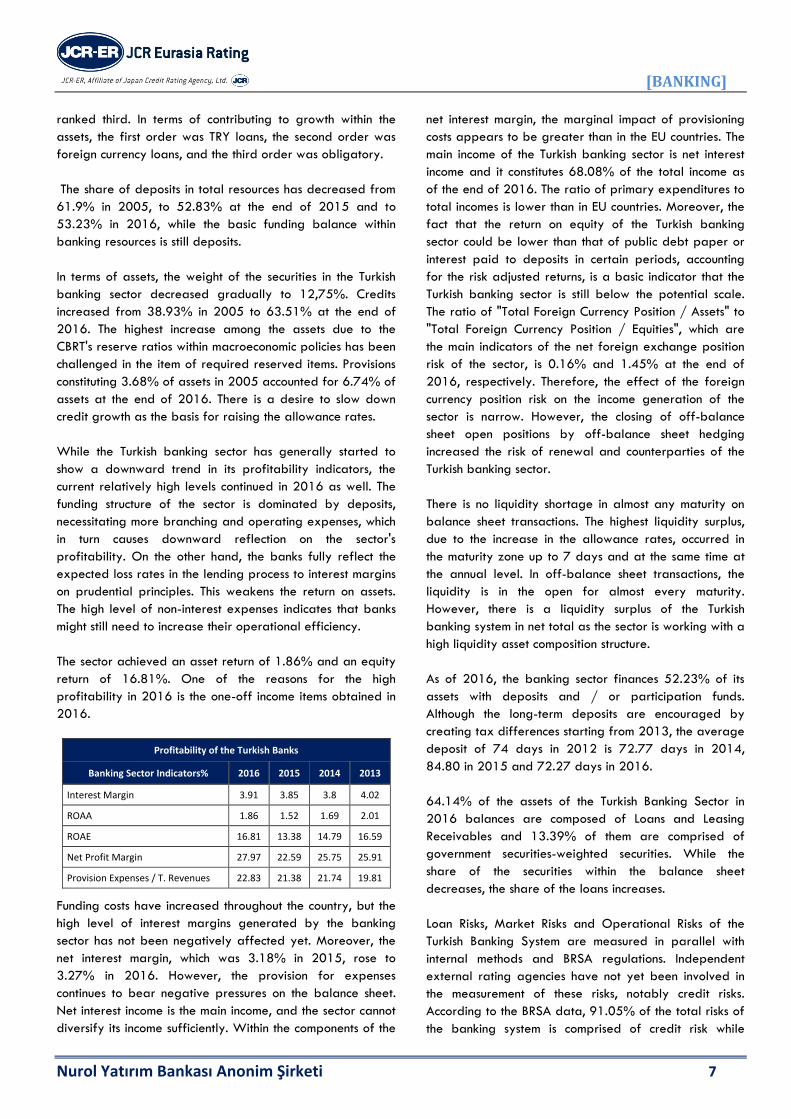
The sector achieved an asset return of 1.86% and an equity
return of 16.81%. One of the reasons for the high
profitability in 2016 is the one-off income items obtained in
2016.
Profitability of the Turkish Banks
Banking Sector Indicators% 2016 2015 2014 2013
Interest Margin 3.91 3.85 3.8 4.02
ROAA 1.86 1.52 1.69 2.01
ROAE 16.81 13.38 14.79 16.59
Net Profit Margin 27.97 22.59 25.75 25.91
Provision Expenses / T. Revenues 22.83 21.38 21.74 19.81
Funding costs have increased throughout the country, but the
high level of interest margins generated by the banking
sector has not been negatively affected yet. Moreover, the
net interest margin, which was 3.18% in 2015, rose to
3.27% in 2016. However, the provision for expenses
continues to bear negative pressures on the balance sheet.
Net interest income is the main income, and the sector cannot
diversify its income sufficiently. Within the components of the
net interest margin, the marginal impact of provisioning
costs appears to be greater than in the EU countries. The
main income of the Turkish banking sector is net interest
income and it constitutes 68.08% of the total income as
of the end of 2016. The ratio of primary expenditures to
total incomes is lower than in EU countries. Moreover, the
fact that the return on equity of the Turkish banking
sector could be lower than that of public debt paper or
interest paid to deposits in certain periods, accounting
for the risk adjusted returns, is a basic indicator that the
Turkish banking sector is still below the potential scale.
The ratio of "Total Foreign Currency Position / Assets" to
"Total Foreign Currency Position / Equities", which are
the main indicators of the net foreign exchange position
risk of the sector, is 0.16% and 1.45% at the end of
2016, respectively. Therefore, the effect of the foreign
currency position risk on the income generation of the
sector is narrow. However, the closing of off-balance
sheet open positions by off-balance sheet hedging
increased the risk of renewal and counterparties of the
Turkish banking sector.
There is no liquidity shortage in almost any maturity on
balance sheet transactions. The highest liquidity surplus,
due to the increase in the allowance rates, occurred in
the maturity zone up to 7 days and at the same time at
the annual level. In off-balance sheet transactions, the
liquidity is in the open for almost every maturity.
However, there is a liquidity surplus of the Turkish
banking system in net total as the sector is working with a
high liquidity asset composition structure.
As of 2016, the banking sector finances 52.23% of its
assets with deposits and / or participation funds.
Although the long-term deposits are encouraged by
creating tax differences starting from 2013, the average
deposit of 74 days in 2012 is 72.77 days in 2014,
84.80 in 2015 and 72.27 days in 2016.
64.14% of the assets of the Turkish Banking Sector in
2016 balances are composed of Loans and Leasing
Receivables and 13.39% of them are comprised of
government securities-weighted securities. While the
share of the securities within the balance sheet
decreases, the share of the loans increases.
Loan Risks, Market Risks and Operational Risks of the
Turkish Banking System are measured in parallel with
internal methods and BRSA regulations. Independent
external rating agencies have not yet been involved in
the measurement of these risks, notably credit risks.
According to the BRSA data, 91.05% of the total risks of
the banking system is comprised of credit risk while
[BANKING]
Nurol Yatırım Bankası Anonim Şirketi 8
7.04% correspond to operational risks and 1.91% to market
risk. The total amount of risk is 2.029.181 Million TRY.
The Turkish Banking Sector generally covers the on-balance
sheet foreign currency short position with off-balance sheet
foreign currency long position. The net foreign currency net
general position of the sector has been at low levels for
many years.
In the sector, as a whole, the share of equity in the balance
sheet declined from 13.17% in 2012, to 11.19% in 2013, to
11.64% in 2014, 11.12% in 2015 and to 10.99% in 2016.
Participation banks have the lowest equity / total resources
ratio in the sector.
On the other hand, despite the fact that development and
investment banking has lost its attractiveness in developed
countries due to the worsening equity balance of assets,
Turkey still maintains its high capital and high capital ratios
and continues its attractiveness.
The capital adequacy ratio of the sector is calculated
according to Basel II rules. For many years, CAR still
maintains its high level. As of 2015, the CAR is 15.57%.
Country ratings of Fitch, Moody's, S&P, JCR, DBRS and IIRA
rating institutions are used in determining the credit quality
stages of foreign currency receivables due from central
governments and central banks. Rating scales of Fitch,
Moody's, S & P, JCR, DBRS and IIRA rating agencies are
used to determine the level of credit quality of receivables
from the banks and intermediary institutions, regional
administrations or local administrations, administrative units
and non-commercial enterprises, multilateral development
banks, if the institutions are resident abroad.
JCR Eurasia Rating has been authorized to determine the risk
weights of the collective receivable classes from banks,
borrowing instruments issued by banks, financial institutions
other than banks, borrowing instruments issued by financial
institutions other than banks, corporate companies not
included in Small and Medium Size Enterprises, by corporate
companies not included in Small and Medium Enterprises, of
domestic and/or foreign residence. However, since the notes
issued by JCR Eurasia Rating have not yet been matched to
appropriate risk weights, the CAR is calculated at 100% risk
weight assuming that the bank receivables in this scope are
not rated.
Despite high profitability and capital adequacy ratios in the
Turkish banking sector in 2016, and the high level of
problematic receivables transferred to restructuring and
asset management companies, the increase in the conversion
rate of the assets to impaired receivable class could not be
prevented. The reason for this trend is the deterioration
of the borrowers’ balance sheets in the wake of
significant foreign currency rate increases.
6. Financial Analysis
a. Financial Indicators & Performance
i. Indices Relating to Size
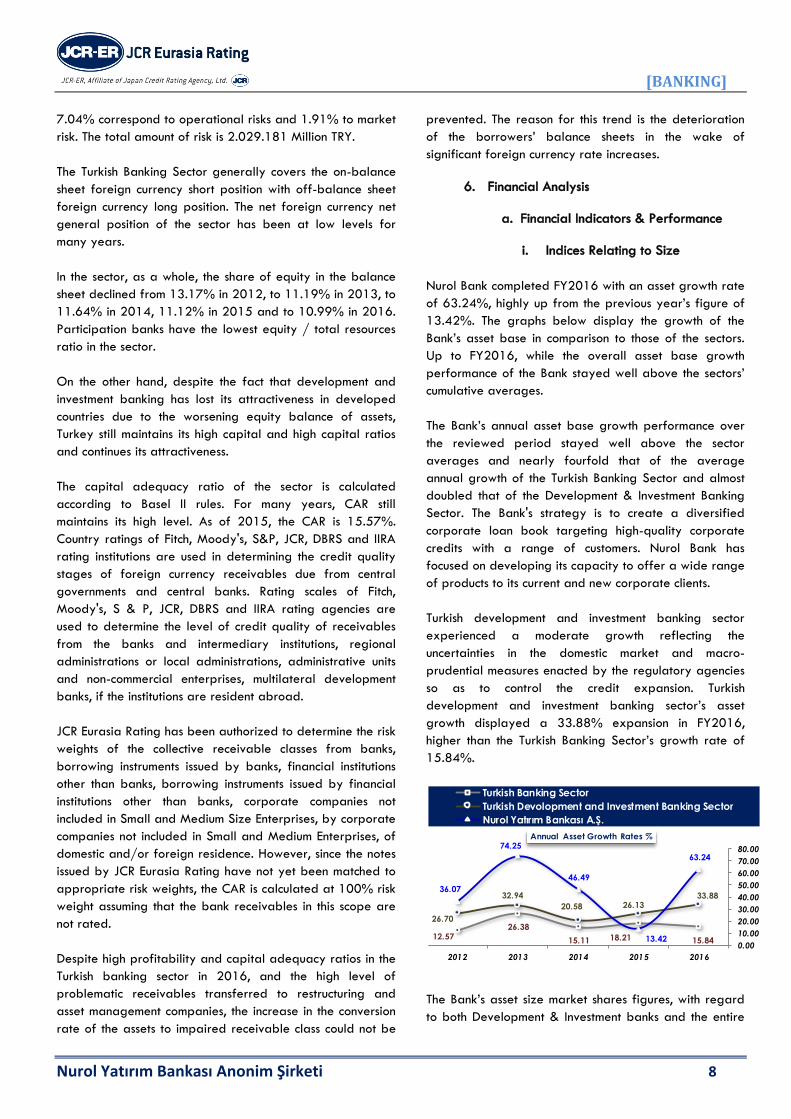
Nurol Bank completed FY2016 with an asset growth rate
of 63.24%, highly up from the previous year’s figure of
13.42%. The graphs below display the growth of the
Bank’s asset base in comparison to those of the sectors.
Up to FY2016, while the overall asset base growth
performance of the Bank stayed well above the sectors’
cumulative averages.
The Bank’s annual asset base growth performance over
the reviewed period stayed well above the sector
averages and nearly fourfold that of the average
annual growth of the Turkish Banking Sector and almost
doubled that of the Development & Investment Banking
Sector. The Bank's strategy is to create a diversified
corporate loan book targeting high-quality corporate
credits with a range of customers. Nurol Bank has
focused on developing its capacity to offer a wide range
of products to its current and new corporate clients.
Turkish development and investment banking sector
experienced a moderate growth reflecting the
uncertainties in the domestic market and macro-
prudential measures enacted by the regulatory agencies
so as to control the credit expansion. Turkish
development and investment banking sector’s asset
growth displayed a 33.88% expansion in FY2016,
higher than the Turkish Banking Sector’s growth rate of
15.84%.
15.84 18.21 15.11
26.38 12.57
33.8826.1320.58
32.94
26.70
63.24
13.42
46.49
74.25
36.07
0.00
10.00
20.00
30.00
40.00
50.00
60.00
70.00
80.00
20162015201420132012
Annual Asset Growth Rates %
Turkish Banking Sector
Turkish Devolopment and Investment Banking Sector
Nurol Yatırım Bankası A.Ş.
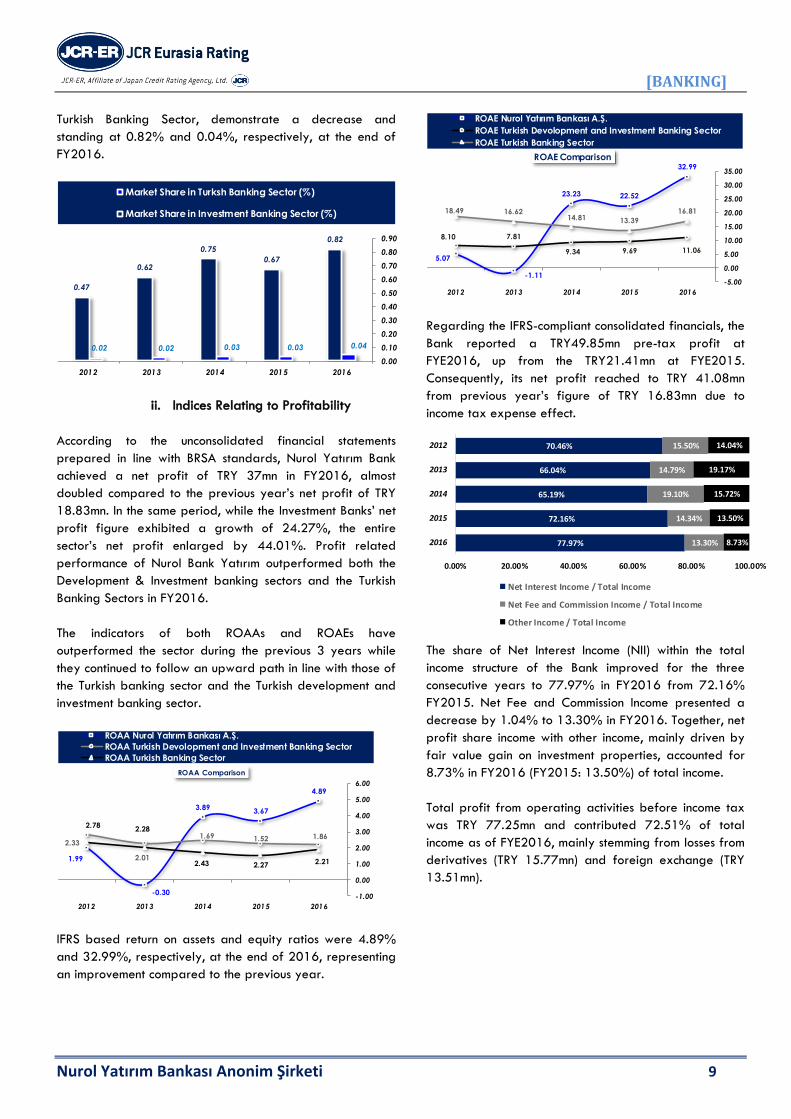
The Bank’s asset size market shares figures, with regard
to both Development & Investment banks and the entire
[BANKING]
Nurol Yatırım Bankası Anonim Şirketi 9
Turkish Banking Sector, demonstrate a decrease and
standing at 0.82% and 0.04%, respectively, at the end of
FY2016.
0.040.030.030.020.02
0.82
0.67
0.75
0.62
0.47
0.00
0.10
0.20
0.30
0.40
0.50
0.60
0.70
0.80
0.90
20162015201420132012
Market Share in Turksh Banking Sector (%)
Market Share in Investment Banking Sector (%)
ii. Indices Relating to Profitability
According to the unconsolidated financial statements
prepared in line with BRSA standards, Nurol Yatırım Bank
achieved a net profit of TRY 37mn in FY2016, almost
doubled compared to the previous year’s net profit of TRY
18.83mn. In the same period, while the Investment Banks’ net
profit figure exhibited a growth of 24.27%, the entire
sector’s net profit enlarged by 44.01%. Profit related
performance of Nurol Bank Yatırım outperformed both the
Development & Investment banking sectors and the Turkish
Banking Sectors in FY2016.
The indicators of both ROAAs and ROAEs have
outperformed the sector during the previous 3 years while
they continued to follow an upward path in line with those of
the Turkish banking sector and the Turkish development and
investment banking sector.
4.89
3.673.89
-0.30
1.99 2.212.272.43
2.282.78
1.861.521.69
2.01
2.33
-1.00
0.00
1.00
2.00
3.00
4.00
5.00
6.00
20162015201420132012
ROAA Comparison
ROAA Nurol Yatırım Bankası A.Ş.
ROAA Turkish Devolopment and Investment Banking Sector
ROAA Turkish Banking Sector
IFRS based return on assets and equity ratios were 4.89%
and 32.99%, respectively, at the end of 2016, representing
an improvement compared to the previous year.
32.99
22.5223.23
-1.11
5.0711.069.699.34
7.818.10
16.81
13.3914.8116.6218.49
-5.00
0.00
5.00
10.00
15.00
20.00
25.00
30.00
35.00
20162015201420132012
ROAE Comparison
ROAE Nurol Yatırım Bankası A.Ş.
ROAE Turkish Devolopment and Investment Banking Sector
ROAE Turkish Banking Sector
Regarding the IFRS-compliant consolidated financials, the
Bank reported a TRY49.85mn pre-tax profit at
FYE2016, up from the TRY21.41mn at FYE2015.
Consequently, its net profit reached to TRY 41.08mn
from previous year’s figure of TRY 16.83mn due to
income tax expense effect.
77.97%
72.16%
65.19%
66.04%
70.46%
13.30%
14.34%
19.10%
14.79%
15.50%
8.73%
13.50%
15.72%
19.17%
14.04%
0.00% 20.00% 40.00% 60.00% 80.00% 100.00%
2016
2015
2014
2013
2012
Net Interest Income / Total Income
Net Fee and Commission Income / Total Income
Other Income / Total Income
The share of Net Interest Income (NII) within the total
income structure of the Bank improved for the three
consecutive years to 77.97% in FY2016 from 72.16%
FY2015. Net Fee and Commission Income presented a
decrease by 1.04% to 13.30% in FY2016. Together, net
profit share income with other income, mainly driven by
fair value gain on investment properties, accounted for
8.73% in FY2016 (FY2015: 13.50%) of total income.
Total profit from operating activities before income tax
was TRY 77.25mn and contributed 72.51% of total
income as of FYE2016, mainly stemming from losses from
derivatives (TRY 15.77mn) and foreign exchange (TRY
13.51mn).

[BANKING]
Nurol Yatırım Bankası Anonim Şirketi 10
8.92
9.69 8.43
7.85 6.72
16.73
13.39
11.81
10.1310.23
7.82
3.70 3.38 2.28 3.51
0.0
2.0
4.0
6.0
8.0
10.0
12.0
14.0
16.0
18.0
20162015201420132012
Interest Margin %
Interest Rate for Costly Liabilities (avg.) %
Interest Rate for Earning Assets (avg.) %
Margin %
Although the average interest income and expense rates for
the last five years exhibited a fluctuating pattern, following
FY2012, the NIM maintained its upward path during
FY2016 with contributions mainly from loans, and funds
borrowed & bond issues.
9.98
7.04
6.40
4.44
6.18
3.51
3.22 3.45 3.64 3.67
4.43
4.29 3.90 3.84 3.80
4.02
4.42
3.86
0.00
2.00
4.00
6.00
8.00
10.00
12.00
201620152014201320122011
Nurol Yatırım Bankası A.Ş.
Turkish Devolopment and Investment Banking Sector
Turkish Banking Sector
Net Interest Margin %
At the end of FY2016, the net interest margin (NIM) ratio of
the Bank clearly increased to 9.98% from 7.04% in
FYE2015 and remained above both the Turkish Banking and
the Development & Investment Banking sectors average
levels. The high and above sector average NIM ratio
specifies the bank’s effectiveness and stronger returns in
interest base incomes. The Bank’s loan books grew by
72.09% to TRY742.92mn. in FYE2015 which triggered NIM
during the period.
b. Asset Quality
As in the previous years, loans held the largest share in the
Bank’s total asset dispersion with a below the sector average
(64.14%) rate of 63.52%, despite a slight decrease
compared to the previous year’s figure of 60.28%. The
loans-weighted asset structure of Nurol Bank, despite
increasing the risk exposure, considers the efficiency of the
Bank’s financial intermediary business.
63.52%60.28%55.82%54.95%59.42%
16.52%29.69%
31.69%
18.52%5.44%
2.30%
8.05%10.01%
20.45%25.63%
17.66%1.98%2.48%6.08%
9.51%
0%
10%
20%
30%
40%
50%
60%
70%
80%
90%
100%
20162015201420132012
Asset Distribution %
Other Assets Securities
Banks and Other Earnings Assets Loans and Receivables
The Bank’s non-performing loans portfolio which are
transferred to an asset management company assets
amounted to TRY 9.04mn at the end of FY2016. he NPL
ratios of the Bank remained below the sector averages
for the last three years.
63.52%60.28%55.82%54.95%
59.42%
16.52%
29.69%31.69%18.52%5.44%
17.66%
1.98%2.48%6.08%9.51%
0%
10%
20%
30%
40%
50%
60%
70%
80%
90%
100%
20162015201420132012
Asset Distribution
Other Assets Banks and Other Earnings Assets
Loans and Receivables
Higher loan exposure provides greater advantages than
fixed rate secure instruments in growing economies. On
the other hand, when the economy slows down, increasing
NPLs rate deteriorates asset quality. Measures
implemented by the CBRT and BRSA to limit credit
growth and individual consumption and ongoing unrest in
some bordering countries add uncertainties and pull
down Turkey’s economic growth forecast. Under these
circumstances, we, as JCR Eurasia Rating, estimate an
upward trend in NPLs in the Banking Sector in 2017.

[BANKING]
Nurol Yatırım Bankası Anonim Şirketi 11
82.34%
98.02%97.52%
93.92%
90.49%
87.16%
70.00%
75.00%
80.00%
85.00%
90.00%
95.00%
100.00%
201620152014201320122011
Total Earning Assets / Total Assets (%)
The earning assets of the bank accounted for 82.34% of its
total assets, tying the asset quality directly into the quality of
the receivables of portfolio.
0.0
0
0.1
2
2.7
0
0.2
3
0.2
8
0.5
9
0.6
5
0.8
3
0.9
1
0.9
7
3.2
3
3.0
9
2.8
4
2.7
4
2.8
6
0.00
0.50
1.00
1.50
2.00
2.50
3.00
3.50
20162015201420132012
NPL %
Nurol Yatırım Bankası A.Ş.
Turkish Devolopment and Investment Banking Sector
Turkish Banking Sector
At the end of FY2015, the non-performing loans portfolio of
Nurol as a proportion of its equity decreased to 0.44%
(FY2014: 9.78%) – but stayed well below both the Turkish
banking sector and development & investment banking
sectors.
0.0
2
0.4
4
9.7
8
0.6
8
0.4
0 2.2
8
2.0
4
2.2
7
2.2
2
1.7
6
19.3
5
18.1
3
15.6
9
15.2
7
12.8
7
0.00
2.00
4.00
6.00
8.00
10.00
12.00
14.00
16.00
18.00
20.00
20162015201420132012
Impaired Loans / Equity %
Nurol Yatırım Bankası A.Ş.
Turkish Devolopment and Investment Banking Sector
Turkish Banking Sector
The doubtful receivables are covered with provisions to a
great extent, the impact on the equity is thought to be
insignificant.
c. Funding & Adequacy of Capital
As an investment bank, Nurol Bank is not entitled to collect
customer deposits and this situation directs the Bank to
alternative, new and innovative fund resources. The Bank’s
funding sources exhibited an alteration in the last two
consecutive years. The Bank’s ability to access alternative
funding sources such as funds borrowed from overseas
financial markets and bond issues increased.
Nurol Bank continued its efforts to diversify and extend
the maturity of provided funds. 44.78% of total
liabilities were driven by bond issues. In addition to the
provided long term borrowing from overseas financial
markets, the Bank has also facilitated subordinated loans
from the international financial institutions. The Bank
issued USD10mn. Eurobond as of March 31, 2016 as
subordinated debt which is accounted as Tier 2 Capital.
Additionally, Overseas Private Investment Corporation
(OPIC) provided USD10mn. loans as of December 12,
2016.
61.3675.96
50.74
77.56
49.2359.62
24.266.04
32.63
1.83
6.152.32
14.3818.0016.6420.60
44.6238.06
0.00%
10.00%
20.00%
30.00%
40.00%
50.00%
60.00%
70.00%
80.00%
90.00%
100.00%
201620152014201320122011
Resource Distribution %
Equity Non-Costly Liabilities Other Borrowing Collected Fund
The Bank’s collected fund, which embraces issued debt
securities and current balances of loan customers,
accounted for 14.38% of the total fund resources. Other
borrowing consisting of bank loans formed 61.36% of
total sources.
The Bank continued issuances of TRY denominated bills
and notes and enhanced its Short-Term Schedule. In the
wake of significant FX movements, the share of foreign
currency liabilities deteriorates profitability in case of
the depreciation of the TRY. The Bank’s total deposits
was TRY 140.09mn at FYE2016 on a solo basis and
presented a growth of 253.88% YoY basis.

[BANKING]
Nurol Yatırım Bankası Anonim Şirketi 12
17.34 21.66
16.89 14.20
19.01 17.23
23.44
28.26
32.83 32.69 34.21
48.14
15.57 15.56 16.28 15.30
17.90 16.46
0.00
10.00
20.00
30.00
40.00
50.00
60.00
201620152014201320122011
CAR (%) Nurol Yatırım Bankası A.Ş.
CAR (%) Turkish Devolopment and Investment Banking Sector
CAR (%) Turkish Banking Sector
Nurol’s non-consolidated CAR decreased by 4.32% to
17.34% as of FYE2016. Though exhibiting below the Turkish
development and investment banking sector average, while
being above the Turkish banking sector average. Nurol’s
capitalization level is expected to remain relatively sufficient
as the bank is likely to sustain growth purely through
retained earnings while this indicator stood well above the
minimum CAR requirements set by the Basel Accord (8%) and
required by the Turkish regulatory authority BRSA (12%).
The weight of the core capital within the own fund structure
has continued to increase. The Bank has also remained
compliant with minimum requirements of Common Equity Tier
1 Ratio (4.5%) and Tier 1 Ratio (6%) set by the BRSA. The
Bank’s CET1 ratios was 12.12% as of FYE2016. The Bank’s
net interest margin over the sector averages and net positive
effect of possible regulatory changes and CET1 share
absorb incidental losses support sustainability.
According to the audited IFRS report, Nurol’ s Tier1 capital,
principally consisting of paid-up capital, profit and legal
reserves increased to TRY155.85mn. in FYE2016 from to TRY
125.41mn as of FYE2015, displaying sufficient capital
quality. Additionally, The Bank issued USD10mn. Eurobond
as of March 31, 2016 as subordinated debt which is
accounted as Tier 2 Capital.
69.89%
95.63%95.39%
81.19%71.41%
90.77%
30.11%
4.37%4.61%
18.81%28.59%
9.23%
0%
20%
40%
60%
80%
100%
120%
201620152014201320122011
Own Fund Structure
Core Capital Supplementary Capital
The share of core capital, principally consisting of paid-up
capital and retained earnings, accounted for 69.89% of the
Bank’s total own fund structure in FYE2016 (FYE2015:
95.63%). Above ratios specify the Bank’s lower reliance
on Tier second capital, which is not considered to be loss
absorbing.
7. Risk Profile & Management
a. Risk Management Organization & Its
Function – General Information
A separate risk management department was
established within the Bank, which reports to the Board
and is entitled to carry out risk management operations
independent of executive activities. On the other hand,
development of relevant policies and strategies and their
control are amongst the responsibilities of the Board. All
of the mechanisms related to the establishment of
standards, information flow, determination of compliance
with standards and the decision making and applications
processes are encompassed throughout the risk
management system.
All of the mechanisms related to the establishment of
standards, information flow, determination of compliance
with standards and the decision making and applications
processes are encompassed throughout the risk
management system.
The Board of Directors has the overall responsibility of
establishing and supervising the Bank’s risk management
framework. The Bank has set up Assets and Liabilities
Committee, Audit Committee, Liquidity Risk Management
Committee, Market Risk Committee, Credit Risk
Committee, Operational Risk Committee under the BoD.
Furthermore, in order to maintain a thorough and
complete risk management system, an Anti-Fraud
Monitoring Committee, Sustainability Committee, Internal
Control Unit and departments of Risk Management,
Internal Audit, Anti- Fraud Monitoring and Compliance
were also set up for further surveillance.
b. Credit Risk
The Bank's credit risk management policy is initially set
on three pillars; customer selection, credit allocation and
credit pricing for its corporate, commercial and medium
sized enterprise loan portfolio, involving statistical
methods on historical data to assess its customers based
on objective criteria and assigning grades. In this sense,
through the guides of comprehensive risk management
framework, the Bank manages its credit risk by the
allocation of loan limits for customers and customer

[BANKING]
Nurol Yatırım Bankası Anonim Şirketi 13
groups as well as the definition of limits for sectors with
considerations of maximizing risk-adjusted returns. Moreover,
concentration risk is monitored on monthly basis in terms of
industry, rating by risk group and customer.
The Bank continuously monitors customer credit assessments,
takes necessary precautions and reviews allocated limits
when necessary. In accordance with the lending policies,
collaterals such as cash, bank guarantees, mortgages,
pledges, cheques & notes and personal or corporate
guarantees are required in line with the financial position of
the debtor and its creditworthiness.
The Bank granted 93.82% of its loan book as corporates
and the remaining 5.97% was factoring loans. On the other
hand, 6% of the Bank’s non-cash loans directly or indirectly
were given to group companies.
The Bank’s (i) largest 10 cash loan customers composed
78.60% (FY2015:82.20%) of the total cash loan portfolio as
of FYE2016, (ii) largest 10 non-cash loan customers
composed 72.20% (FY2015:59.90%) of the total non-cash
loan portfolio as of FYE2016.
Customer Concentration (Cash)
2016 2015
First 10
78.60% 82.20%
First 20
95.20% 94.80%
First 50
100.0% 100.0%
Customer Concentration (Non-Cash) 2016 2015
First 10 72.0% 59.90%
First 20 91.90% 83.10%
First 50 99.80% 99.60%
The following table shows the sectorial cash and non-cash
loan book composition of the Bank in FYE2016.
Sectorial Concentration (Cash) (First-5) %
Energy 21.5
Other 17.6
Textile 16.6
Automotive 10.7
Non-Bank FI s 7.7
Sectorial Concentration (Non-Cash) (First-5) %
Banks 34.8
Energy 28.2
Infrastructure 12.3
Fuel Oil Trade 7.8
Real Estate (Investment / Rental) 3.7
Nurol Bank has exposure to concentration risk where its
business activities focus particularly on a similar type of
customers and industrial sectors in Turkey. Nurol is
constrained by customer and sector concentrations which
are applicable for most banks in Turkey and high
related party lending. Although we, as JCR Eurasia
Rating, have not assessed the individual risk level of
those companies and allocated credits, these credits are
presumed to be paid back.
The Bank’s foreign currency risk exposure complies with
BRSA regulations. The Bank’s interest rate risk is also
limited and risk arising from interest rate fluctuations is
monitored on a daily basis and managed by the asset
and liability committee.
c. Market Risk
Nurok Bank measures its market risk daily with the value
at risk (VaR) methodology, considering its trading and
available-for-sale portfolios. Regular back testing is also
conducted to test the reliability of the model. As part of
risk management activities, global and national
developments are also followed to be used in scenario
analyse for the market risk management and
determination of limits.
Additionally, The Bank performs and monitors its market
risks and takes appropriate and timely actions in
accordance with the Communiqué on Measurement and
Evaluation of Capital Adequacy of Banks. The Bank
calculates and reports general market risk, commodity
risk, currency risk, specific risk, clearing risk and
counterparty credit risk using the ‘Standard Method’, in
line with the methodology outlined in the regulations of
BRSA.
The Bank’s foreign currency risk exposure is restricted
and complies with BRSA regulations. The Bank was short
in USD and Euro long in denominated liabilities. The
Bank’s total foreign currency position to assets and
equity ratios are 6.67% and 46.39%, at the end of
FYE2016 (FYE2015: 7.50% and 41.66%, respectively).
d. Liquidity Risk
Treasury and financial institutions department manages
liquidity risk in order to take necessary measures in a
timely and accurate manner to meet its obligations even
in stressed conditions and accomplishes the regulations
regarding liquidity implemented by the BRSA. The Bank
calculates and follows up the liquidity risk, cash flows,

[BANKING]
Nurol Yatırım Bankası Anonim Şirketi 14
gap analyses, stress tests and scenario analyses which are
periodically reported by the Risk Management Department
to the Senior Management and Audit Committee.
In addition to the requirement of legal liquidity ratios, by the
Assets and Liabilities Committee (ALCO) sets internal liquidity
ratios such as liquid assets to total assets and liquid assets to
portfolio of issued bank bonds. Risk management unit closely
monitors the liquidity conditions under the pre-determined
limits.
In overcoming the liquidity risk considering short and long
term liquidity requirements, the Bank has been in an effort to
develop alternative funding channels and to diversify its
funding sources through instruments such as bond issuances,
local and foreign borrowings.
The Bank's liquidity ratios in FYE2016 and FYE2015 are as
follows,
Period (Avg.)
First maturity bracket (weekly)
Second maturity bracket (monthly)
FC (%) Total (%) FC (%) Total (%)
2016 176 238 106 137
2015 302 262 108 137
Accordingly, the Bank’s liquidity ratios were above the
requirement levels and remained compliant with BRSA
parameters in 2016. On the other hand, according to the
decision of BRSA dated 24 December 2015 and number of
6613;
The Development and Investment Banks will;
- Maintain for calculating and reporting liquidity ratios as
per the framework of the ‘Communiqué on Measurement and
Evaluation of Liquidity Adequacy of Banks’ weekly and
monthly liquidity ratios on a bank-only basis for foreign
currency assets/liabilities and total assets/liabilities should
stand at a minimum of 80% and 100%, respectively.
- Calculate liquidity coverage ratios as zero up to FYE2017.
8. Budget & Debt Issue
The estimated budget projection between the years of
FYE2017 and FYE2018 submitted by Nurol Bank. The Bank
recorded growths of 63.31% and 70.53% in asset and
liabilities respectively in FY2016 and surpassed the
previously projected growth of 38.85% and 45.13%
respectively in those fields. Additionally, realized figures in
equity and net profit of -30.47% and 96.56% respectively
in FYE2016 were remarkably stayed above the
projected figures.
According to the base scenario developed by the Nurol
Bank Management, some of the planned topics are
shown in the graphs below;
58.18 26.51 48.61 80.39
135.35 140.32
---- 34.94
-51.57
240.03281.36
522.82583.48
20.66
-99.56
357.66 404.87
760.92
855.81
----200
0
200
400
600
800
1,000
2012 2013 2014 2015 2016 2017
Cumulative Equity Growth Rate %
Cumulative Asset Growth Rate %
Cumulative Liability Growth Rate %
Within the framework of projections and budgeting
activities in FY2017, the Bank projected growths of
9.74%, 2.11% and 11.02% in asset, liabilities and
equity respectively.
31,5
38
64
,643
88,6
54
150,
113
127,
592
17,6
42
34,6
14
49
,384
85
,532
72,4
88
-1,0
36
20,7
69
24
,809
46,3
06
24,1
84
-55
1
16,4
15
18,8
26
37
,00
4
19,3
47
-20,000
-
20,000
40,000
60,000
80,000
100,000
120,000
140,000
160,000
2013 2014 2015 2016 2017e
Interest Income Interest Expenses Pre tax Profit Net Profit
In addition, the Bank projected a 2017 year-end interest
income and net profit sizes of TRY127.59mn. and
TRY19.35mn., respectively.

[BANKING]
Nurol Yatırım Bankası Anonim Şirketi 15
FYE FYE FYE FYE FYE FYE FYE FYE As % of As % of As % of FYE FYE FYE
Nurol Yatırım Bankası A.Ş. 2016 2016 2016 2015 2015 2014 2014 2013 2016 2015 2014 2016 2015 2014
BALANCE SHEET - ASSET USD TRY TRY TRY TRY TRY TRY TRY Assets Assets Assets Growth Growth Growth
(000) (Converted) (Original) (Average) (Original) (Average) (Original) (Average) (Original) (Original) (Original) (Original) Rate % Rate % Rate %
A- TOTAL EARNING ASSETS ( I+II+III ) 321,434 962,984 832,484 701,984 662,331 622,677 517,452 412,226 82.34 98.02 97.52 37.18 12.74 51.05
I- LOANS AND LEASING RECEIVABLES (net) 247,978 742,918 587,315 431,711 394,084 356,456 298,823 241,190 63.52 60.28 55.82 72.09 21.11 47.79
a) Short Term Loans 78,715 235,822 236,532 237,241 193,863 150,484 157,403 164,321 20.16 33.13 23.57 -0.60 57.65 -8.42
b) Lease Assets 0 0 4,396 8,792 10,564 12,336 14,965 17,594 n.a 1.23 1.93 -100.00 -28.73 -29.89
c) Medium & Long Term Loans 169,053 506,467 344,574 182,681 181,966 181,250 118,166 55,082 43.30 25.51 28.39 177.24 0.79 229.05
d) Over Due Loans 9 28 284 540 7,419 14,298 7,427 556 0.00 0.08 2.24 -94.81 -96.22 2,471.58
e) Others 0 0 0 0 0 0 2,014 4,027 n.a n.a n.a n.a n.a -100.00
f) Receivable from Customer due to Brokerage Activities 2,146 6,430 6,099 5,768 2,884 0 0 0 0.55 0.81 n.a 11.48 n.a n.a
g) Allowance for Loan and Receivables Losses (-) -1,946 -5,829 -4,570 -3,311 -2,612 -1,912 -1,151 -390 -0.50 -0.46 -0.30 76.05 73.17 390.26
II- OTHER EARNING ASSETS 64,475 193,161 202,901 212,640 207,485 202,330 141,804 81,277 16.52 29.69 31.69 -9.16 5.10 148.94
a) Balance With Banks -Time Deposits 31,223 93,541 100,073 106,604 107,907 109,210 84,012 58,814 8.00 14.89 17.10 -12.25 -2.39 85.69
b) Money Market Placements 14,172 42,459 52,406 62,353 73,703 85,053 52,033 19,012 3.63 8.71 13.32 -31.91 -26.69 347.36
c) Reserve Deposits at CB (*) 19,080 57,161 50,412 43,663 25,640 7,616 3,808 0 4.89 6.10 1.19 30.91 473.31 n.a
d) Balance With CB- Demand Deposits 0 0 10 20 236 451 1,951 3,451 n.a 0.00 0.07 -100.00 -95.57 -86.93
III- SECURITIES AT FAIR VALUE THROUGH P/L 8,981 26,905 42,269 57,633 60,762 63,891 76,825 89,759 2.30 8.05 10.01 -53.32 -9.79 -28.82
a) Treasury Bills and Government Bonds 6,306 18,891 23,203 27,514 33,007 38,499 51,241 63,983 1.62 3.84 6.03 -31.34 -28.53 -39.83
b) Other Investment 2,675 8,014 19,067 30,119 27,756 25,392 25,584 25,776 0.69 4.21 3.98 -73.39 18.62 -1.49
c) Repurchase Agreement 0 0 0 0 0 0 0 0 n.a n.a n.a n.a n.a n.a
B- INVESTMENTS IN ASSOCIATES (NET) + EQUITY SHARE 0 0 0 0 0 0 0 0 n.a n.a n.a n.a n.a n.a
a) Investments in Associates (Net) 0 0 0 0 0 0 0 0 n.a n.a n.a n.a n.a n.a
b) Equity Share 0 0 0 0 0 0 0 0 n.a n.a n.a n.a n.a n.a
C- NON-EARNING ASSETS 68,950 206,567 110,362 14,157 15,004 15,850 21,266 26,681 17.66 1.98 2.48 1,359.12 -10.68 -40.59
a) Cash and Cash Equivalents 53 160 160 160 174 187 151 114 0.01 0.02 0.03 0.00 -14.44 64.04
b) Balance With Banks - Current Accounts 8,981 26,905 14,967 3,029 6,452 9,875 7,944 6,013 2.30 0.42 1.55 788.25 -69.33 64.23
c) Financial Assets at Fair Value through P/L 0 0 0 0 0 0 0 0 n.a n.a n.a n.a n.a n.a
d) Accrued Interest from Loans and Lease 0 0 0 0 0 0 0 0 n.a n.a n.a n.a n.a n.a
e) Other 59,916 179,502 95,235 10,968 8,378 5,788 13,171 20,554 15.35 1.53 0.91 1,536.60 89.50 -71.84
- Intangible Assets 463 1,387 1,271 1,154 1,088 1,021 1,056 1,090 0.12 0.16 0.16 20.19 13.03 -6.33
- Property and Equipment 827 2,478 2,040 1,601 1,045 488 534 580 0.21 0.22 0.08 54.78 228.07 -15.86
- Deferred Tax 0 0 0 0 0 0 0 0 n.a n.a n.a n.a n.a n.a
- Other 58,626 175,637 91,925 8,213 6,246 4,279 11,582 18,884 15.02 1.15 0.67 2,038.52 91.94 -77.34
TOTAL ASSETS 390,384 1,169,551 942,846 716,141 677,334 638,527 538,717 438,907 100.00 100.00 100.00 63.31 12.16 45.48

[BANKING]
Nurol Yatırım Bankası Anonim Şirketi 16
FYE FYE FYE FYE FYE FYE FYE FYE As % of As % of As % of FYE FYE FYE
Nurol Yatırım Bankası A.Ş. 2016 2016 2016 2015 2015 2014 2014 2013 2016 2015 2014 2016 2015 2014
BALANCE SHEET LIABILITIES & SHAREHOLDERS' EQUITY USD TRY TRY TRY TRY TRY TRY TRY Assets Assets Assets Growth Growth Growth
(000) (Converted) (Original) (Average) (Original) (Average) (Original) (Average) (Original) (Original) (Original) (Original) Rate % Rate % Rate %
A- COST BEARING RESOURCES ( I+II ) 239,541 717,642 630,796 543,950 433,956 323,961 332,198 340,434 61.36 75.96 50.74 31.93 67.91 -4.84
I- DEPOSIT 0 0 0 0 0 0 0 0 n.a n.a n.a n.a n.a n.a
a) TL Deposit 0 0 0 0 0 0 0 0 n.a n.a n.a n.a n.a n.a
b) FC Deposit 0 0 0 0 0 0 0 0 n.a n.a n.a n.a n.a n.a
c) FC & LC Banks Deposits 0 0 0 0 0 0 0 0 n.a n.a n.a n.a n.a n.a
II- BORROWING FUNDING LOANS & OTHER 239,541 717,642 630,796 543,950 433,956 323,961 332,198 340,434 61.36 75.96 50.74 31.93 67.91 -4.84
a) Borrowing From Domestic Market 234,258 701,814 622,519 543,223 407,840 272,456 244,724 216,992 60.01 75.85 42.67 29.19 99.38 25.56
b) Borrowing From Overseas Markets 0 0 0 0 0 0 0 0 n.a n.a n.a n.a n.a n.a
c) Borrowing from Interbank 0 0 0 0 0 0 0 0 n.a n.a n.a n.a n.a n.a
d) Securities Sold Under Repurchase Agreements 5,283 15,828 8,278 727 26,116 51,505 87,474 123,442 1.35 0.10 8.07 2,077.17 -98.59 -58.28
e) Subordinated Loans & Others 0 0 0 0 0 0 0 0 n.a n.a n.a n.a n.a n.a
B- NON-COST BEARING RESOURCES 94,693 283,691 163,473 43,255 125,800 208,344 108,198 8,051 24.26 6.04 32.63 555.86 -79.24 2,487.80
a) Provisions 905 2,712 3,176 3,640 3,307 2,974 2,785 2,595 0.23 0.51 0.47 -25.49 22.39 14.61
b) Current & Deferred Tax Liabilities 1,029 3,082 3,601 4,119 2,388 657 649 640 0.26 0.58 0.10 -25.18 526.94 2.66
c) Trading Liabilities (Derivatives) 4,274 12,803 6,630 457 1,334 2,211 1,145 79 1.09 0.06 0.35 2,701.53 -79.33 2,698.73
d) Other Liabilities 88,486 265,094 150,067 35,039 118,771 202,502 103,620 4,737 22.67 4.89 31.71 656.57 -82.70 4,174.90
C- TOTAL LIABILITIES 334,234 1,001,333 794,269 587,205 559,755 532,305 440,395 348,485 85.62 82.00 83.36 70.53 10.31 52.75
D- MINORITY INTEREST 0 0 0 0 0 0 0 0 n.a n.a n.a n.a n.a n.a
E- EQUITY 56,149 168,218 148,577 128,936 117,579 106,222 98,322 90,422 14.38 18.00 16.64 30.47 21.38 17.47
a) Prior Year's Equity 43,037 128,936 117,579 106,222 98,322 90,422 101,740 113,057 11.02 14.83 14.16 21.38 17.47 -20.02
b) Equity (Added From Internall & External Resourses At This Year) -601 -1,801 2,266 6,333 3,133 -67 -11,609 -23,151 -0.15 0.88 -0.01 -128.44 -9,552.24 -99.71
c) Profit & Loss 13,713 41,083 28,732 16,381 16,124 15,867 8,192 516 3.51 2.29 2.48 150.80 3.24 2,975.00
TOTAL LIABILITIES AND SHAREHOLDERS' EQUITY 390,384 1,169,551 942,846 716,141 677,334 638,527 538,717 438,907 100.00 100.00 100.00 63.31 12.16 45.48
(*) This item is included in Other Item USD Rates 1=TRY 2.9959 2.9076 2.3189 2.1304

[BANKING]
Nurol Yatırım Bankası Anonim Şirketi 17
Nurol Yatırım Bankası A.Ş. FY FY FY FY FY
INCOME STATEMENT
(000) TRY
Net Interest Income 83,059.00 46,620.00 33,110.00 14,234.00 12,149.00
a) Interest Income 139,312.00 88,661.00 61,125.00 32,500.00 20,097.00
b) Interest Expense 56,253.00 42,041.00 28,015.00 18,266.00 7,948.00
Net Fee and Commission Income 14,171.00 9,263.00 9,699.00 3,187.00 2,673.00
a) Fee and Commission Income 19,732.00 12,256.00 11,710.00 4,967.00 3,540.00
b) Fee and Commission Expense 5,561.00 2,993.00 2,011.00 1,780.00 867.00
Total Operating Income -19,985.00 -9,270.00 -3,949.00 283.00 1,618.00
Net trading income (+/-) -15,767.00 9,701.00 5,092.00 -1,935.00 -803.00
Foreign Exchange Gain or Loss (net) (+/-) -13,513.00 -17,994.00 -11,932.00 3,475.00 715.00
Gross Profit from Retail Business 0.00 0.00 0.00 0.00 0.00
Premium income from insurance business 0.00 0.00 0.00 0.00 0.00
Income on Sale of Equity Participations and Consolidated Affiliates 0.00 0.00 0.00 0.00 0.00
Gains from Investment Securities (Net) 1,145.00 1,258.00 1,386.00 -1,914.00 1,346.00
Other Operating Income 8,150.00 -2,235.00 1,505.00 657.00 360.00
Taxes other than Income 0.00 0.00 0.00 0.00 0.00
Dividend 0.00 0.00 0.00 0.00 0.00
Provisions 2,767.00 5,382.00 1,945.00 624.00 -492.00
Provision for Impairment of Loan and Trade Receivables 2,542.00 4,282.00 1,571.00 135.00 -516.00
Other Provision 225.00 1,100.00 374.00 489.00 24.00
Total Operating Expense 24,628.00 19,825.00 16,742.00 16,764.00 12,271.00
Salaries and Employee Benefits 12,231.00 9,725.00 7,937.00 8,920.00 5,335.00
Depreciation and Amortization 752.00 522.00 784.00 563.00 587.00
Other Expenses 11,645.00 9,578.00 8,021.00 7,281.00 6,349.00
Profit from Operating Activities before Income Tax 49,850.00 21,406.00 20,173.00 316.00 4,661.00
Income Tax – Current 0.00 0.00 0.00 0.00 0.00
Income Tax – Deferred 8,767.00 5,025.00 4,306.00 -200.00 789.00
Net Profit for the Period 41,083.00 16,381.00 15,867.00 516.00 3,872.00
Total Income 106,525.00 64,607.00 50,792.00 21,553.00 17,243.00
Total Expense 53,908.00 37,819.00 28,674.00 20,613.00 13,074.00
Provision 2,767.00 5,382.00 1,945.00 624.00 -492.00
Pre-tax Profit 49,850.00 21,406.00 20,173.00 316.00 4,661.00
2016 2015 2014 2013 2012

[BANKING]
Nurol Yatırım Bankası Anonim Şirketi 18
Nurol Yatırım Bankası A.Ş. FY FY FY
FINANCIAL RATIOS %
I. PROFITABILITY & PERFORMANCE
1. ROA - Pretax Profit / Total Assets (avg.) 5.29 3.16 3.74
2. ROE - Pretax Profit / Equity (avg.) 33.55 18.21 20.52
3. Total Income / Equity (avg.) 71.70 54.95 51.66
4. Total income / Total Assets (avg.) 11.30 9.54 9.43
5. Provisions / Total Income 2.60 8.33 3.83
6. Total Expense / Total Liabilities (avg.) 6.79 6.76 6.51
7. Net Profit for the Period / Total Assets (avg.) 4.36 2.42 2.95
8. Total Income / Total Expenses 197.61 170.83 177.14
9. Non Cost Bearing Liabilities + Equity- Non Earning Assets / Total Assets 20.98 22.07 46.78
10. Non Cost Bearing Liabilities - Non Earning Assets / Total Assets 6.59 4.06 30.15
11. Total Operating Expenses / Total Income 23.12 30.69 32.96
12. Net Interest Margin 9.98 7.04 6.40
13. Operating ROAA (avg.) 11.25 9.37 8.94
14. Operating ROAE (avg.) 71.41 53.96 49.01
15. Interest Coverage – EBIT / Interest Expenses 188.62 150.92 172.01
16. Net Profit Margin 38.57 25.35 31.24
17. Gross Profit Margin 46.80 33.13 39.72
18. Market Share in Turkish Devolopment and Investment Banking Sector 0.82 0.67 0.75
19. Market Share in Entire Banking System 0.04 0.03 0.03
20. Growth Rate 63.31 12.16 45.48
II. CAPITAL ADEQUACY (year end)
1. Equity Generation / Prior Year’s Equity -1.40 5.96 -0.07
2. Internal Equity Generation / Previous Year’s Equity 31.86 15.42 17.55
3. Equity / Total Assets 14.38 18.00 16.64
4. Core Capital / Total Assets 13.33 17.51 15.07
5. Supplementary Capital / Total Assets 5.74 0.80 0.73
6. Tier 1 / Risk Waighted Asset 12.12 24.17 17.42
7. Capital / Total Assets 19.07 18.31 15.79
8. Own Fund / Total Assets 19.07 18.31 15.79
8. Standard Capital Adequacy Ratio 17.34 21.66 16.89
9. Surplus Own Fund 95.86 63.07 52.62
10. Free Equity / Total Assets 14.05 17.62 16.40
11. Equity / Total Guarantees and Commitments + Equity 26.63 37.47 20.68
III. LIQUIDITY (year end)
1. Liquidity Management Success (On Demand) 98.47 99.30 99.31
2. Liquidity Management Success (Up to 1 Month) 95.55 89.34 93.85
3. Liquidity Management Success (1 to 3 Months) 86.05 97.60 91.74
4. Liquidity Management Success (3 to 6 Months ) 99.99 100.00 94.31
5. Liquidity Management Success (6 to 12 Months) 92.02 92.44 96.32
6. Liquidity Management Success (Over 1 Year & Unallocated) 92.01 99.51 88.59
IV. ASSET QUALITY
1. Loan and Receivable’s Loss Provisions / Total Loans and Receivables 0.78 0.76 0.53
2. Total Provisions / Profit Before Provision and Tax 5.26 20.09 8.79
3. Impaired Loans / Gross Loans 0.00 0.12 3.99
4. Impaired Loans / Equity 0.02 0.42 13.46
5. Total FX Position / Total Assets 6.67 7.50 15.66
6. Total FX Position / Equity 46.39 41.66 94.13
7. Assets / Total Guarantees and Commitments + Assets 71.62 76.90 61.05
2016 2015 2014
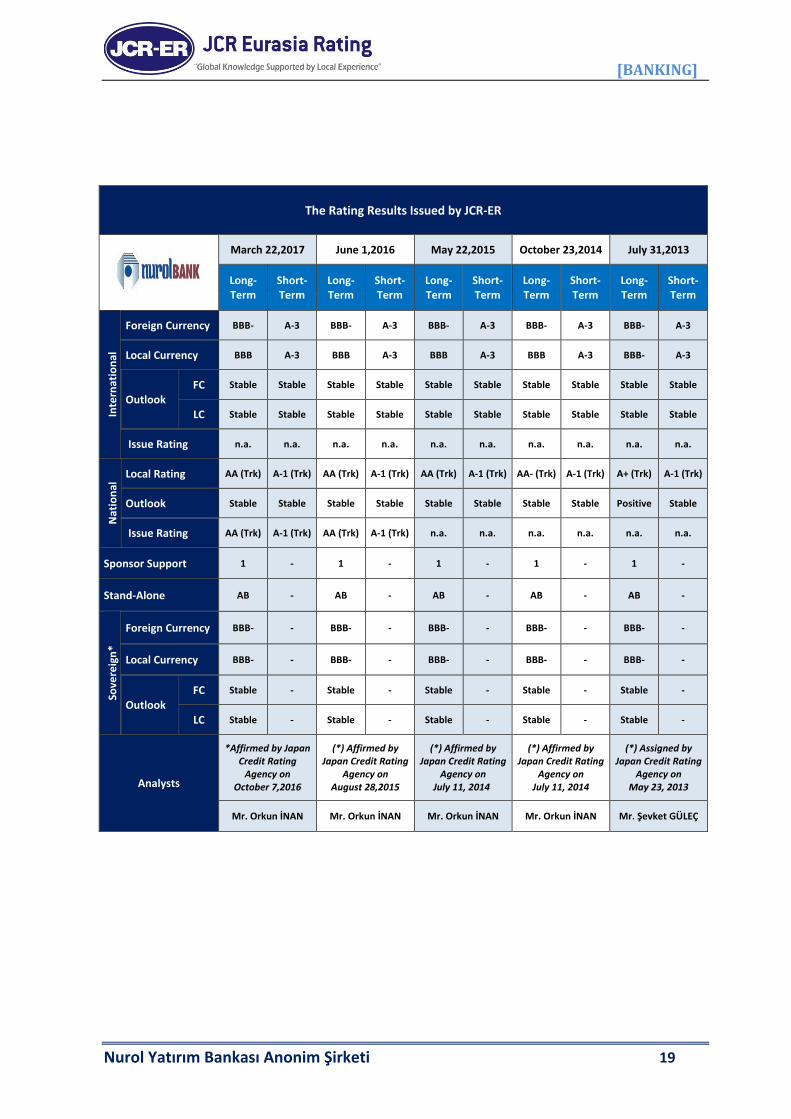
[BANKING]
Nurol Yatırım Bankası Anonim Şirketi 19
The Rating Results Issued by JCR-ER
March 22,2017 June 1,2016 May 22,2015 October 23,2014 July 31,2013
Long-Term
Short-Term
Long-Term
Short-Term
Long-Term
Short-Term
Long-Term
Short-Term
Long-Term
Short-Term
Inte
rnat
ion
al
Foreign Currency BBB- A-3 BBB- A-3 BBB- A-3 BBB- A-3 BBB- A-3
Local Currency BBB A-3 BBB A-3 BBB A-3 BBB A-3 BBB- A-3
Outlook FC Stable Stable Stable Stable Stable Stable Stable Stable Stable Stable
LC Stable Stable Stable Stable Stable Stable Stable Stable Stable Stable
Issue Rating n.a. n.a. n.a. n.a. n.a. n.a. n.a. n.a. n.a. n.a.
Nat
ion
al Local Rating AA (Trk) A-1 (Trk) AA (Trk) A-1 (Trk) AA (Trk) A-1 (Trk) AA- (Trk) A-1 (Trk) A+ (Trk) A-1 (Trk)
Outlook Stable Stable Stable Stable Stable Stable Stable Stable Positive Stable
Issue Rating AA (Trk) A-1 (Trk) AA (Trk) A-1 (Trk) n.a. n.a. n.a. n.a. n.a. n.a.
Sponsor Support 1 - 1 - 1 - 1 - 1 -
Stand-Alone AB - AB - AB - AB - AB -
Sove
reig
n*
Foreign Currency BBB- - BBB- - BBB- - BBB- - BBB- -
Local Currency BBB- - BBB- - BBB- - BBB- - BBB- -
Outlook FC Stable - Stable - Stable - Stable - Stable -
LC Stable - Stable - Stable - Stable - Stable -
Analysts
*Affirmed by Japan Credit Rating
Agency on October 7,2016
(*) Affirmed by Japan Credit Rating
Agency on August 28,2015
(*) Affirmed by Japan Credit Rating
Agency on July 11, 2014
(*) Affirmed by Japan Credit Rating
Agency on July 11, 2014
(*) Assigned by Japan Credit Rating
Agency on May 23, 2013
Mr. Orkun İNAN Mr. Orkun İNAN Mr. Orkun İNAN Mr. Orkun İNAN Mr. Şevket GÜLEÇ


![ions of DOCUMENT CONTAINING DISCLOSURES AS PER … · ICRA Limited has reaffirmed a “[ICRA] AA/Stable” (pronounced “ICRA double A with stable outlook”) rating e captioned](https://static.fdocuments.us/doc/165x107/5fa20eaa1def69286e243c03/ions-of-document-containing-disclosures-as-per-icra-limited-has-reaffirmed-a-aoeicra.jpg)