Copyright © 2018. Trend Micro Incorporated. All rights...
163
Transcript of Copyright © 2018. Trend Micro Incorporated. All rights...

Trend Micro Incorporated reserves the right to make changes to this document and tothe product described herein without notice. Before installing and using the product,review the readme files, release notes, and/or the latest version of the applicabledocumentation, which are available from the Trend Micro website at:
http://docs.trendmicro.com/en-us/enterprise/trend-micro-endpoint-sensor.aspx
Trend Micro, the Trend Micro t-ball logo, OfficeScan, Control Manager, and TrendMicro Endpoint Sensor are trademarks or registered trademarks of Trend MicroIncorporated. All other product or company names may be trademarks or registeredtrademarks of their owners.
Copyright © 2018. Trend Micro Incorporated. All rights reserved.
Document Part No.: APEM18232/180418
Release Date: May 2018
Protected by U.S. Patent No.: Patents pending.
This documentation introduces the main features of the product and/or providesinstallation instructions for a production environment. Read through the documentationbefore installing or using the product.
Detailed information about how to use specific features within the product may beavailable at the Trend Micro Online Help Center and/or the Trend Micro KnowledgeBase.
Trend Micro always seeks to improve its documentation. If you have questions,comments, or suggestions about this or any Trend Micro document, please contact us [email protected].
Evaluate this documentation on the following site:
http://www.trendmicro.com/download/documentation/rating.asp
Privacy and Personal Data Collection Disclosure
Certain features available in Trend Micro products collect and send feedback regardingproduct usage and detection information to Trend Micro. Some of this data isconsidered personal in certain jurisdictions and under certain regulations. If you do notwant Trend Micro to collect personal data, you must ensure that you disable the relatedfeatures.
The following link outlines the types of data that Endpoint Sensor collects and providesdetailed instructions on how to disable the specific features that feedback theinformation.
https://success.trendmicro.com/data-collection-disclosure
Data collected by Trend Micro is subject to the conditions stated in the Trend MicroPrivacy Policy:
https://www.trendmicro.com/en_us/about/legal/privacy-policy-product.html
i
Table of ContentsPreface
Preface .................................................................................................................. v
Documentation .................................................................................................. vi
Audience ............................................................................................................ vii
Document Conventions .................................................................................. vii
Terminology ..................................................................................................... viii
Chapter 1: IntroductionAbout Trend Micro Endpoint Sensor ......................................................... 1-2
What's New ..................................................................................................... 1-2
Features and Benefits ..................................................................................... 1-3Threat Investigation ............................................................................... 1-4Customized Endpoint Investigation .................................................... 1-4Remote Endpoint Management ........................................................... 1-4Attack Discovery .................................................................................... 1-4File Collection and Analysis .................................................................. 1-4
Integration with Deep Discovery Analyzer ................................................ 1-5
Integration with Control Manager ............................................................... 1-5
Compatibility ................................................................................................... 1-6
Chapter 2: Getting StartedGetting Started Tasks ..................................................................................... 2-2
The Management Console ............................................................................ 2-2Opening the Management Console ..................................................... 2-3Logging on the Management Console ................................................ 2-3
Dashboard ....................................................................................................... 2-4Intelligent Monitoring Summary by Host .......................................... 2-5Calendar ................................................................................................... 2-6

Endpoint Sensor 1.6 Update 4 Administrator's Guide
ii
Endpoint .......................................................................................................... 2-7
Chapter 3: Performing an InvestigationInvestigation .................................................................................................... 3-2
Running an Investigation ...................................................................... 3-2Investigating Historical Records .......................................................... 3-9Investigating System Snapshots ......................................................... 3-13Analyzing the Results ........................................................................... 3-18Investigation Troubleshooting ........................................................... 3-32
Chapter 4: Monitoring FilesMonitoring ....................................................................................................... 4-2
Monitoring Rules .................................................................................... 4-3Submission Settings ................................................................................ 4-5Deep Discovery Analyzer Integration ................................................ 4-7
Submitted for Analysis ................................................................................... 4-7Rule Category .......................................................................................... 4-9
Monitoring Log ............................................................................................. 4-10
Purging Monitoring Tables ......................................................................... 4-13
Chapter 5: Managing Trend Micro Endpoint SensorAdministration ................................................................................................ 5-2
Updates .................................................................................................... 5-2Proxy ......................................................................................................... 5-4Management Console ............................................................................ 5-5Accounts .................................................................................................. 5-6About ........................................................................................................ 5-8License ...................................................................................................... 5-9
Chapter 6: Technical SupportTroubleshooting Resources ........................................................................... 6-2
Using the Support Portal ....................................................................... 6-2Threat Encyclopedia .............................................................................. 6-2
Table of Contents
iii
Contacting Trend Micro ................................................................................ 6-3Speeding Up the Support Call .............................................................. 6-4
Sending Suspicious Content to Trend Micro ............................................. 6-4Email Reputation Services .................................................................... 6-4File Reputation Services ........................................................................ 6-5Web Reputation Services ....................................................................... 6-5
Other Resources ............................................................................................. 6-5Download Center ................................................................................... 6-5Documentation Feedback ..................................................................... 6-6
AppendixAppendix A: OfficeScan Integration
About Trend Micro OfficeScan Integration .............................................. A-2
About Plug-in Manager ................................................................................ A-2
Installing OfficeScan ..................................................................................... A-3
Agent Installation Considerations When Using OfficeScan ................... A-4
Using the Trend Micro Endpoint Sensor Deployment Tool .................. A-4
Trend Micro Endpoint Sensor Agent Deployment Tasks .................... A-11
The OfficeScan Agent Tree ....................................................................... A-14
Appendix B: Trend Micro Control Manager IntegrationAbout Trend Micro Control Manager ........................................................ B-2
Supported Control Manager Versions ........................................................ B-2
Control Manager Integration in this Release ............................................. B-3
Registering with Control Manager .............................................................. B-4
Adding the Endpoint Sensor Widgets ........................................................ B-5
Using the Endpoint Sensor Investigation Widget .................................... B-6
Using Automatic Updates ............................................................................. B-7

Endpoint Sensor 1.6 Update 4 Administrator's Guide
iv
Trend Micro Endpoint Sensor Policy ......................................................... B-9
Appendix C: Supported IOC Indicator TermsIOC Samples for Historical Records IOCs ............................................. C-12
IOC Samples for System Process IOCs ................................................... C-16
IOC Sample for Disk Scanning IOCs ...................................................... C-21
IOC Sample for Monitoring IOCs ............................................................ C-22
IndexIndex .............................................................................................................. IN-1
v
Preface
PrefaceWelcome to the Trend Micro™ Endpoint Sensor™ Administrator's Guide. This documentdiscusses getting started information, investigation steps, and product managementdetails.
• Documentation on page vi
• Audience on page vii
• Document Conventions on page vii
• Terminology on page viii
Endpoint Sensor 1.6 Update 4 Administrator's Guide
vi
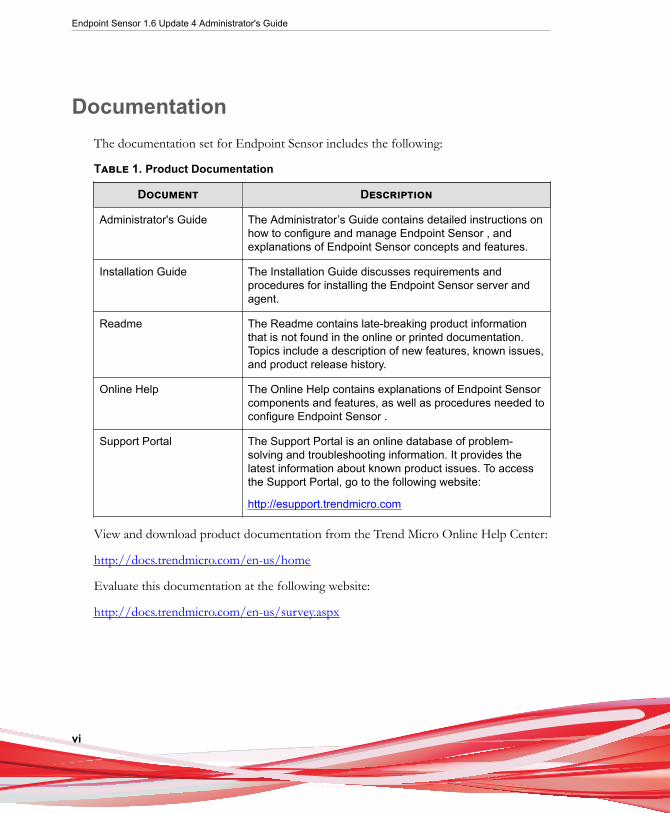
DocumentationThe documentation set for Endpoint Sensor includes the following:
Table 1. Product Documentation
Document Description
Administrator's Guide The Administrator’s Guide contains detailed instructions onhow to configure and manage Endpoint Sensor , andexplanations of Endpoint Sensor concepts and features.
Installation Guide The Installation Guide discusses requirements andprocedures for installing the Endpoint Sensor server andagent.
Readme The Readme contains late-breaking product informationthat is not found in the online or printed documentation.Topics include a description of new features, known issues,and product release history.
Online Help The Online Help contains explanations of Endpoint Sensorcomponents and features, as well as procedures needed toconfigure Endpoint Sensor .
Support Portal The Support Portal is an online database of problem-solving and troubleshooting information. It provides thelatest information about known product issues. To accessthe Support Portal, go to the following website:
http://esupport.trendmicro.com
View and download product documentation from the Trend Micro Online Help Center:
http://docs.trendmicro.com/en-us/home
Evaluate this documentation at the following website:
http://docs.trendmicro.com/en-us/survey.aspx

Preface
vii
AudienceThe Endpoint Sensor documentation is written for network administrators, systemsengineers, and information security analysts. The documentation assumes that the readerhas an in-depth knowledge of networking and information security, which includes thefollowing topics:
• Network topologies
• Server management
• Database management
• Incident response procedures
• Content security protection
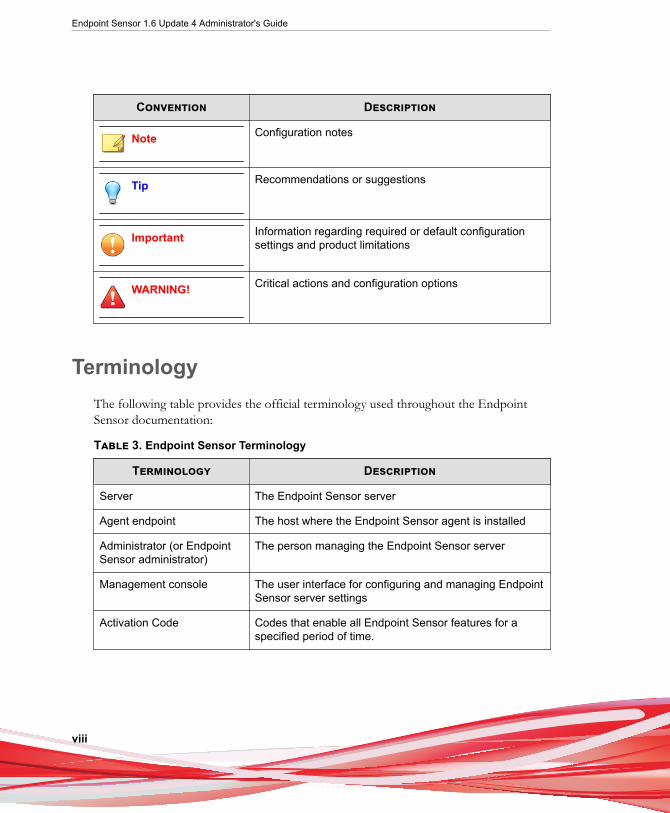
Document ConventionsThe documentation uses the following conventions.
Table 2. Document Conventions
Convention Description
UPPER CASE Acronyms, abbreviations, and names of certaincommands and keys on the keyboard
Bold Menus and menu commands, command buttons, tabs,and options
Italics References to other documents
Monospace Sample command lines, program code, web URLs, filenames, and program output
Navigation > Path The navigation path to reach a particular screen
For example, File > Save means, click File and then clickSave on the interface
Endpoint Sensor 1.6 Update 4 Administrator's Guide
viii
Convention Description
Note Configuration notes
Tip Recommendations or suggestions
Important Information regarding required or default configurationsettings and product limitations
WARNING! Critical actions and configuration options
TerminologyThe following table provides the official terminology used throughout the EndpointSensor documentation:
Table 3. Endpoint Sensor Terminology
Terminology Description
Server The Endpoint Sensor server
Agent endpoint The host where the Endpoint Sensor agent is installed
Administrator (or EndpointSensor administrator)
The person managing the Endpoint Sensor server
Management console The user interface for configuring and managing EndpointSensor server settings
Activation Code Codes that enable all Endpoint Sensor features for aspecified period of time.
Preface
ix
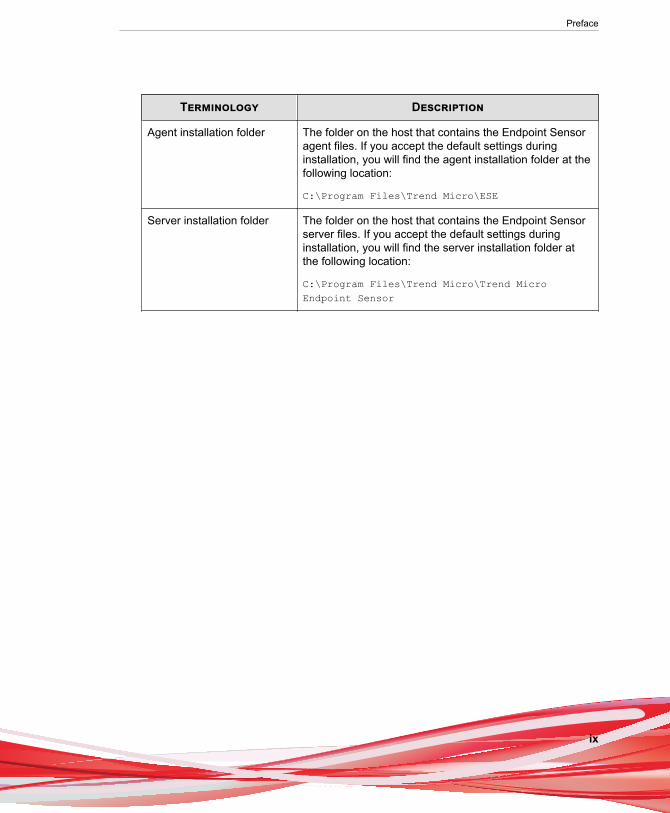
Terminology Description
Agent installation folder The folder on the host that contains the Endpoint Sensoragent files. If you accept the default settings duringinstallation, you will find the agent installation folder at thefollowing location:
C:\Program Files\Trend Micro\ESE
Server installation folder The folder on the host that contains the Endpoint Sensorserver files. If you accept the default settings duringinstallation, you will find the server installation folder atthe following location:
C:\Program Files\Trend Micro\Trend MicroEndpoint Sensor


1-1
Chapter 1
IntroductionThis section provides an overview of Endpoint Sensor and the features available in thisrelease.
Topics include:
• About Trend Micro Endpoint Sensor on page 1-2
• What's New on page 1-2
• Features and Benefits on page 1-3
• Compatibility on page 1-6
Endpoint Sensor 1.6 Update 4 Administrator's Guide
1-2
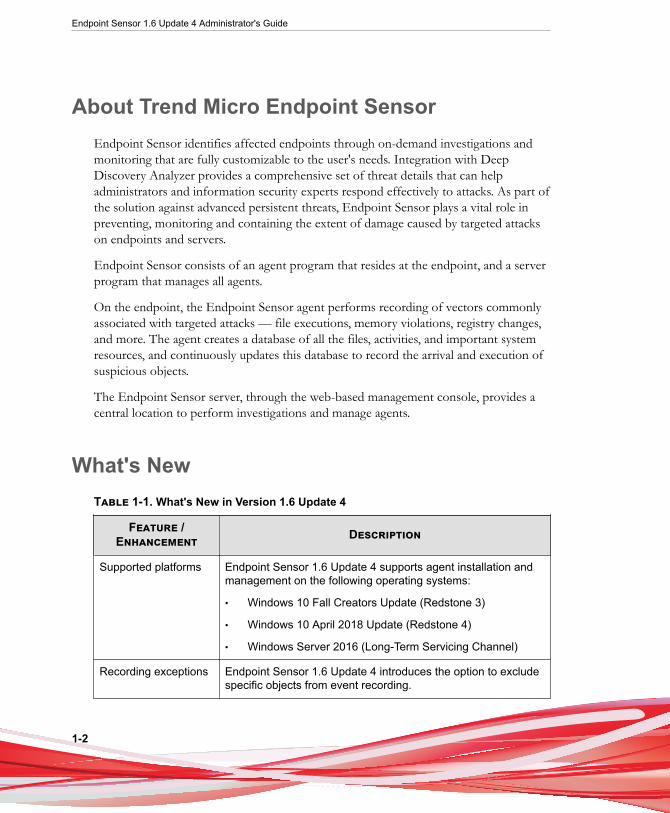
About Trend Micro Endpoint SensorEndpoint Sensor identifies affected endpoints through on-demand investigations andmonitoring that are fully customizable to the user's needs. Integration with DeepDiscovery Analyzer provides a comprehensive set of threat details that can helpadministrators and information security experts respond effectively to attacks. As part ofthe solution against advanced persistent threats, Endpoint Sensor plays a vital role inpreventing, monitoring and containing the extent of damage caused by targeted attackson endpoints and servers.
Endpoint Sensor consists of an agent program that resides at the endpoint, and a serverprogram that manages all agents.
On the endpoint, the Endpoint Sensor agent performs recording of vectors commonlyassociated with targeted attacks — file executions, memory violations, registry changes,and more. The agent creates a database of all the files, activities, and important systemresources, and continuously updates this database to record the arrival and execution ofsuspicious objects.
The Endpoint Sensor server, through the web-based management console, provides acentral location to perform investigations and manage agents.
What's NewTable 1-1. What's New in Version 1.6 Update 4
Feature /Enhancement Description
Supported platforms Endpoint Sensor 1.6 Update 4 supports agent installation andmanagement on the following operating systems:
• Windows 10 Fall Creators Update (Redstone 3)
• Windows 10 April 2018 Update (Redstone 4)
• Windows Server 2016 (Long-Term Servicing Channel)
Recording exceptions Endpoint Sensor 1.6 Update 4 introduces the option to excludespecific objects from event recording.
Introduction
1-3
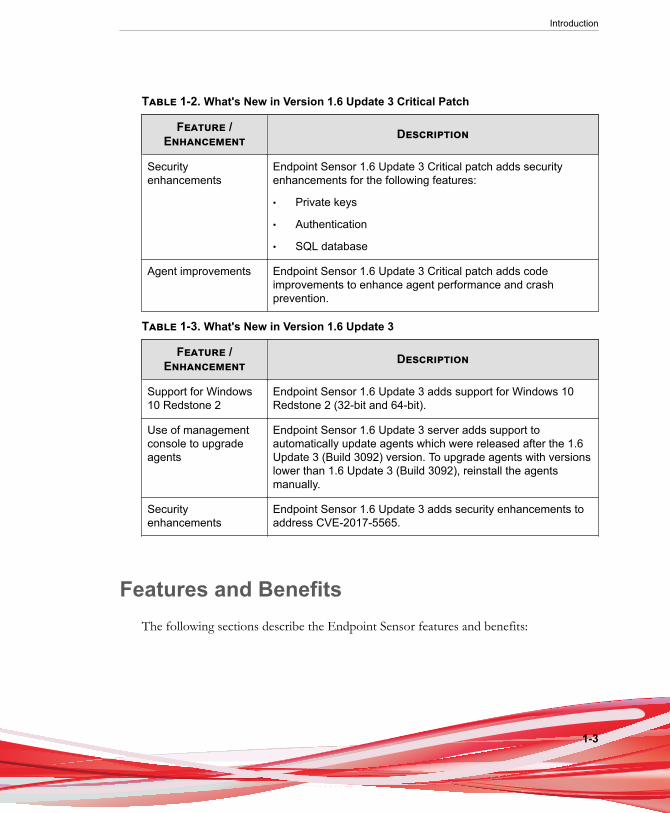
Table 1-2. What's New in Version 1.6 Update 3 Critical Patch
Feature /Enhancement Description
Securityenhancements
Endpoint Sensor 1.6 Update 3 Critical patch adds securityenhancements for the following features:
• Private keys
• Authentication
• SQL database
Agent improvements Endpoint Sensor 1.6 Update 3 Critical patch adds codeimprovements to enhance agent performance and crashprevention.
Table 1-3. What's New in Version 1.6 Update 3
Feature /Enhancement Description
Support for Windows10 Redstone 2
Endpoint Sensor 1.6 Update 3 adds support for Windows 10Redstone 2 (32-bit and 64-bit).
Use of managementconsole to upgradeagents
Endpoint Sensor 1.6 Update 3 server adds support toautomatically update agents which were released after the 1.6Update 3 (Build 3092) version. To upgrade agents with versionslower than 1.6 Update 3 (Build 3092), reinstall the agentsmanually.
Securityenhancements
Endpoint Sensor 1.6 Update 3 adds security enhancements toaddress CVE-2017-5565.
Features and BenefitsThe following sections describe the Endpoint Sensor features and benefits:
Endpoint Sensor 1.6 Update 4 Administrator's Guide
1-4
Threat InvestigationEndpoint Sensor provides a central location to investigate for the existence of threats onmultiple endpoints. All investigation criteria are fully customizable by the user. EndpointSensor can investigate both historical and current states of all managed endpoints. Eachinvestigation provides a graphical breakdown of the threat's activities, which helpsadministrators re-construct the events of the security incident from start to end.
If regular monitoring is part of the organization's security plan, Endpoint Sensorprovides the option to perform investigations scheduled at specified intervals.
Customized Endpoint InvestigationEndpoint Sensor supports IOC and YARA rules which allow the creation, sharing andre-use of existing threat information. IOC and YARA rules are fully customizable toaddress targeted attacks. Additionally, Endpoint Sensor also provides its own set of IOCrules, which are regularly updated to provide protection from the most recent threats.
Remote Endpoint ManagementEndpoint Sensor allows administrators to monitor, manage and run investigations onendpoints through a web-based management console. The management consoleprovides a means to configure the endpoints remotely, and view endpoint details —suchas agent version, pattern version, etc. — all from a central location.
Attack DiscoveryEndpoint Sensor can proactively monitor and discover suspicious files and behaviorthrough user-defined IOC rules. Endpoint Sensor also leverages on Trend Micro's threatintelligence through the use of regularly updated IOC rules to provide protection fromthe latest threats.
File Collection and AnalysisEndpoint Sensor collects all files that match a monitoring rule. Once a suspicious file isfound, it can be sent to a local file server, or sent to a Deep Discovery Analyzer server

Introduction
1-5
for further analysis. Deep Discovery Analyzer then provides Endpoint Sensor with acomprehensive set of threat details that can help administrators determine if a file ismalicious or not.
For details, see Integration with Deep Discovery Analyzer on page 1-5.
Integration with Deep Discovery AnalyzerEndpoint Sensor supports integration with Deep Discovery Analyzer™ 5.1 and later.
Deep Discovery Analyzer is a custom sandbox analysis server that enhances the targetedattack protection of Trend Micro and third-party security products. Deep DiscoveryAnalyzer supports out-of-the-box integration to augment or centralize the sandboxanalysis of other Trend Micro products. The custom sandboxing environments createdwithin Deep Discovery Analyzer precisely match target desktop software configurations,resulting in more accurate detections and fewer false positives.
For details, refer to the documentation available at:
http://docs.trendmicro.com/en-us/enterprise/deep-discovery-analyzer.aspx
Integration with Control ManagerEndpoint Sensor 1.6 Update 4 supports integration with Trend Micro™ ControlManager™. Control Manager manages Trend Micro products and services at thegateway, mail server, file server and corporate desktop levels. The Control Manager web-based management console provides a single monitoring point for products and servicesthroughout the network. Use Control Manager to manage several Endpoint Sensorservers from a single location.
Endpoint Sensor supports the following Control Manager versions.
Endpoint Sensor 1.6 Update 4 Administrator's Guide
1-6
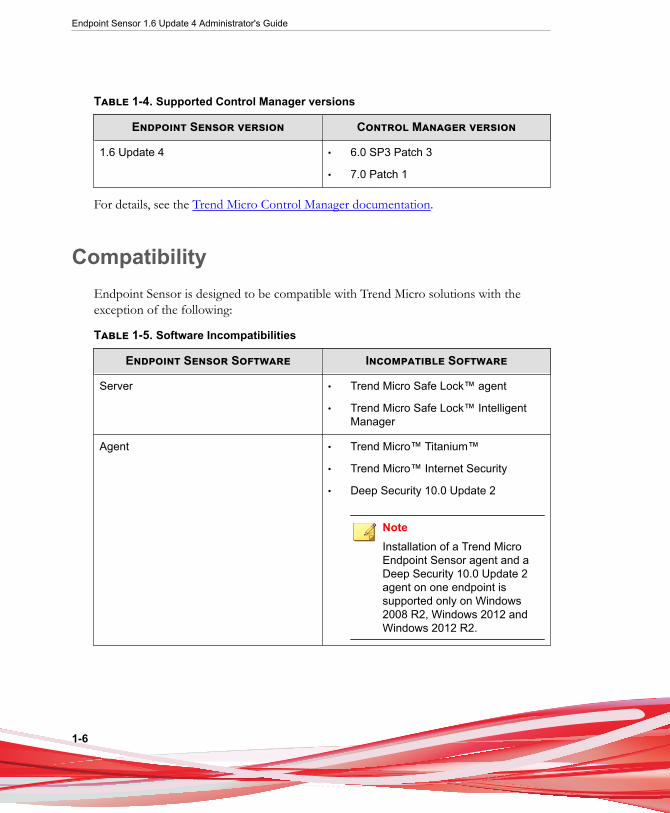
Table 1-4. Supported Control Manager versions
Endpoint Sensor version Control Manager version
1.6 Update 4 • 6.0 SP3 Patch 3
• 7.0 Patch 1
For details, see the Trend Micro Control Manager documentation.
CompatibilityEndpoint Sensor is designed to be compatible with Trend Micro solutions with theexception of the following:
Table 1-5. Software Incompatibilities
Endpoint Sensor Software Incompatible Software
Server • Trend Micro Safe Lock™ agent
• Trend Micro Safe Lock™ IntelligentManager
Agent • Trend Micro™ Titanium™
• Trend Micro™ Internet Security
• Deep Security 10.0 Update 2
NoteInstallation of a Trend MicroEndpoint Sensor agent and aDeep Security 10.0 Update 2agent on one endpoint issupported only on Windows2008 R2, Windows 2012 andWindows 2012 R2.

Introduction
1-7
ImportantSetup does not check for these incompatibilities, and will continue with the installation.The incompatible program may prevent Endpoint Sensor from functioning properly.
To ensure that Endpoint Sensor is successfully installed, refer to the pre- and post-installation sections of the Installation Guide available at:
http://docs.trendmicro.com/en-us/enterprise/trend-micro-endpoint-sensor/


2-1
Chapter 2
Getting StartedThis section describes how to get started with Endpoint Sensor .
Topics include:
• Getting Started Tasks on page 2-2
• The Management Console on page 2-2
• Dashboard on page 2-4
• Endpoint on page 2-7
Endpoint Sensor 1.6 Update 4 Administrator's Guide
2-2
Getting Started TasksGetting Started Tasks provides a high-level overview of all procedures required to getEndpoint Sensor up and running as quickly as possible.
Procedure
1. Log on the management console.
For details, see Logging on the Management Console on page 2-3.
2. Verify that all endpoints are detected.
For details, see Endpoint on page 2-7.
3. Configure updates.
For details, see Updates on page 5-2.
4. Configure proxy settings.
For details, see Proxy on page 5-4.
5. Configure management console settings.
For details, see Management Console on page 5-5.
6. Configure monitoring settings.
For details, see Monitoring on page 4-2.
The Management ConsoleThe management console is the central point for monitoring and launching a EndpointSensor investigation. Use the Endpoint Sensor management console to perform thefollowing tasks:
• Monitor and investigate endpoints
Getting Started
2-3
• Analyze the enterprise-wide chain of events involved in an attack
• Update the product license
• Manage the administrator account
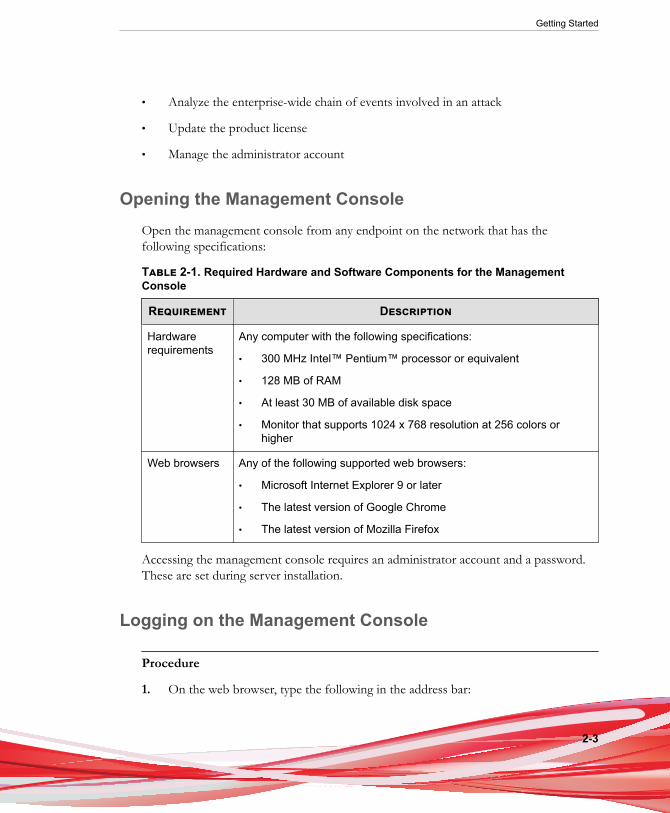
Opening the Management ConsoleOpen the management console from any endpoint on the network that has thefollowing specifications:
Table 2-1. Required Hardware and Software Components for the ManagementConsole
Requirement Description
Hardwarerequirements
Any computer with the following specifications:
• 300 MHz Intel™ Pentium™ processor or equivalent
• 128 MB of RAM
• At least 30 MB of available disk space
• Monitor that supports 1024 x 768 resolution at 256 colors orhigher
Web browsers Any of the following supported web browsers:
• Microsoft Internet Explorer 9 or later
• The latest version of Google Chrome
• The latest version of Mozilla Firefox
Accessing the management console requires an administrator account and a password.These are set during server installation.
Logging on the Management Console
Procedure
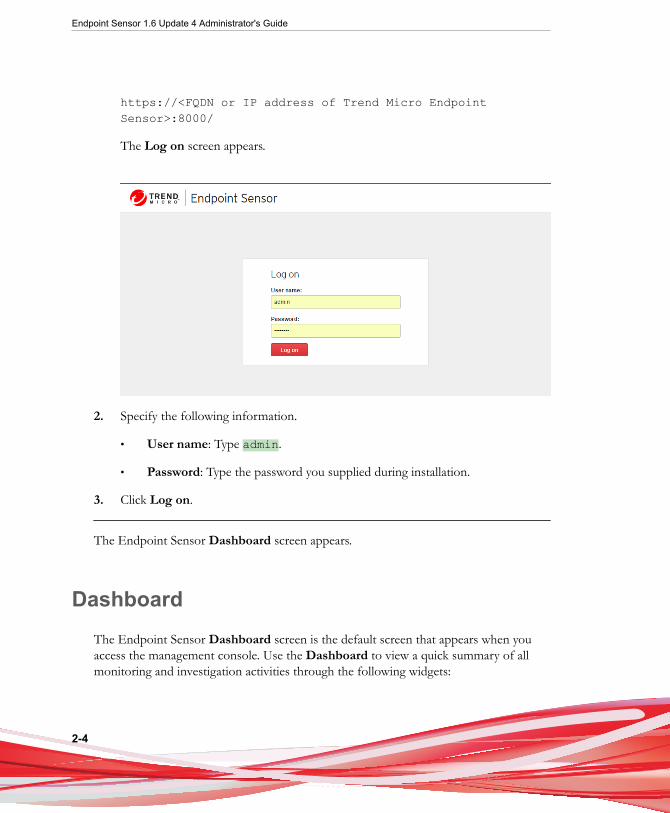
1. On the web browser, type the following in the address bar:
Endpoint Sensor 1.6 Update 4 Administrator's Guide
2-4
https://<FQDN or IP address of Trend Micro EndpointSensor>:8000/
The Log on screen appears.
2. Specify the following information.
• User name: Type admin.
• Password: Type the password you supplied during installation.
3. Click Log on.
The Endpoint Sensor Dashboard screen appears.
DashboardThe Endpoint Sensor Dashboard screen is the default screen that appears when youaccess the management console. Use the Dashboard to view a quick summary of allmonitoring and investigation activities through the following widgets:
Getting Started
2-5
Note
On first use, widgets have no data to display since widgets get data from investigationresults. To display widget data, proceed to the Investigation screen to start aninvestigation.
For details, see Investigation on page 3-2.
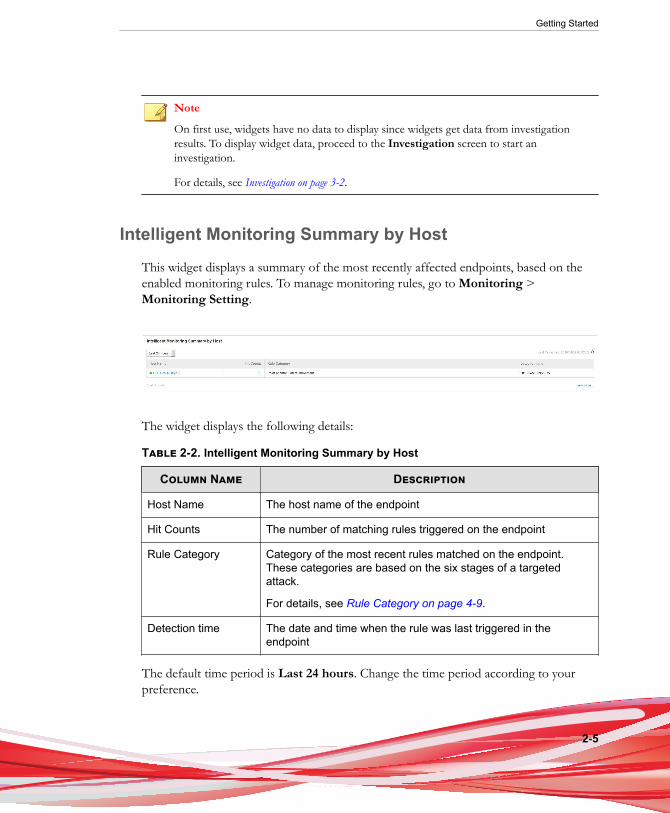
Intelligent Monitoring Summary by Host
This widget displays a summary of the most recently affected endpoints, based on theenabled monitoring rules. To manage monitoring rules, go to Monitoring >Monitoring Setting.
The widget displays the following details:
Table 2-2. Intelligent Monitoring Summary by Host
Column Name Description
Host Name The host name of the endpoint
Hit Counts The number of matching rules triggered on the endpoint
Rule Category Category of the most recent rules matched on the endpoint.These categories are based on the six stages of a targetedattack.
For details, see Rule Category on page 4-9.
Detection time The date and time when the rule was last triggered in theendpoint
The default time period is Last 24 hours. Change the time period according to yourpreference.

Endpoint Sensor 1.6 Update 4 Administrator's Guide
2-6
CalendarThis widget displays a calendar showing all the investigation schedules.
By default, this widget presents an overview of all the investigations occurring for thecurrent month. The current date is highlighted in yellow. To review schedules, performany of the following:
Getting Started
2-7
• Click on a schedule to view a quick summary of the investigation results. To viewthe full results, click View results.
• Use the Month, Week and Day buttons to customize the display to your preferredview.
• Use the buttons to navigate through the calendar and view past or futureschedules. To return to the current date, click Today.
Note
• Endpoint Sensor does not support automatic adjustments for Daylight Saving Time(DST). To minimize issues, review the schedule details and make necessaryadjustments to ensure that the schedule runs at the intended time.
• Use the Schedule screen to manage schedules.
For details, see Managing Schedules on page 3-8.
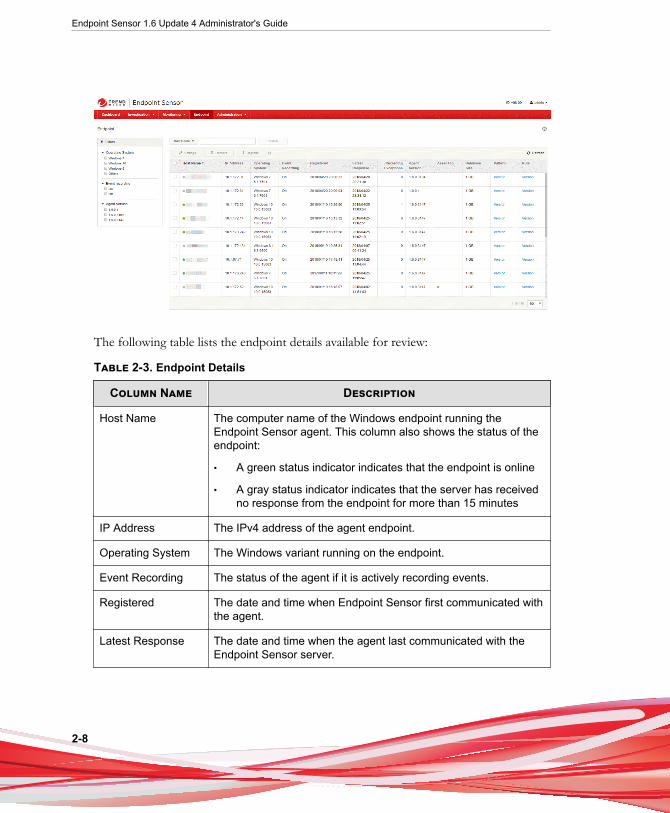
EndpointUse the Endpoint screen to manage all endpoints detected by the Endpoint Sensorserver.
Note
• The Endpoint screen can only show endpoints that have the Endpoint Sensor agentinstalled.
For details about agent requirements and installation, refer to the Trend Micro EndpointSensor Installation Guide available at:
http://docs.trendmicro.com/en-us/enterprise/trend-micro-endpoint-sensor.aspx
Endpoint Sensor 1.6 Update 4 Administrator's Guide
2-8
The following table lists the endpoint details available for review:
Table 2-3. Endpoint Details
Column Name Description
Host Name The computer name of the Windows endpoint running theEndpoint Sensor agent. This column also shows the status of theendpoint:
• A green status indicator indicates that the endpoint is online
• A gray status indicator indicates that the server has receivedno response from the endpoint for more than 15 minutes
IP Address The IPv4 address of the agent endpoint.
Operating System The Windows variant running on the endpoint.
Event Recording The status of the agent if it is actively recording events.
Registered The date and time when Endpoint Sensor first communicated withthe agent.
Latest Response The date and time when the agent last communicated with theEndpoint Sensor server.
Getting Started
2-9
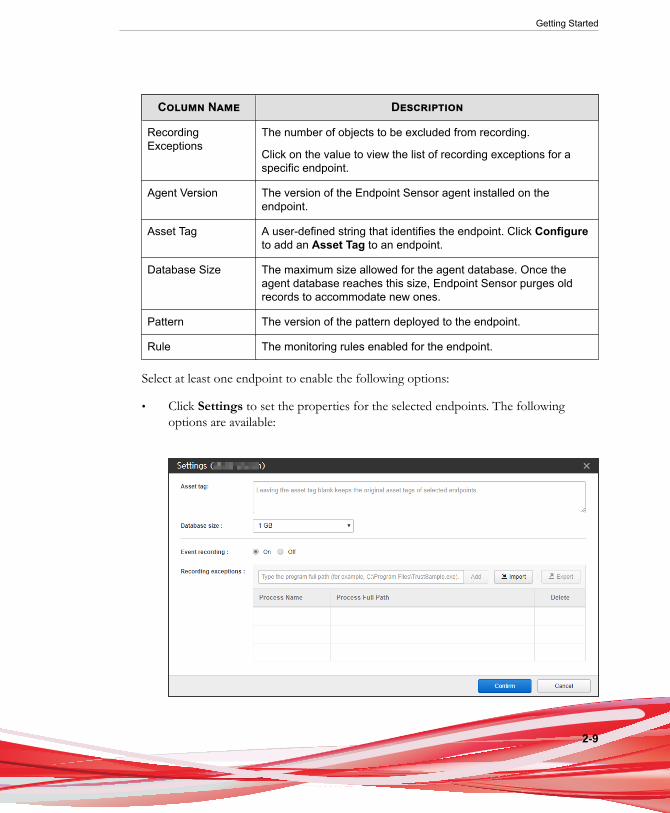
Column Name Description
RecordingExceptions
The number of objects to be excluded from recording.
Click on the value to view the list of recording exceptions for aspecific endpoint.
Agent Version The version of the Endpoint Sensor agent installed on theendpoint.
Asset Tag A user-defined string that identifies the endpoint. Click Configureto add an Asset Tag to an endpoint.
Database Size The maximum size allowed for the agent database. Once theagent database reaches this size, Endpoint Sensor purges oldrecords to accommodate new ones.
Pattern The version of the pattern deployed to the endpoint.
Rule The monitoring rules enabled for the endpoint.
Select at least one endpoint to enable the following options:
• Click Settings to set the properties for the selected endpoints. The followingoptions are available:
Endpoint Sensor 1.6 Update 4 Administrator's Guide
2-10
• Asset tag: Specify an asset tag for the endpoint. When multiple endpoints areselected, specifying an asset tag overwrites the existing asset tags of theselected endpoints. Leave the asset tag blank to keep the original tags of theselected endpoints.
• Database size: Select a maximum size for the agent database. When multipleendpoints are selected, specifying a new size overwrites the existing databasesize of the selected endpoints.
• Event recording: Toggles event recording for the selected endpoints. This isuseful if the selected endpoint is undergoing maintenance (for example,installing system updates) and it is required to temporarily stop the agent.When multiple endpoints are selected, toggling event recording overwrites theexisting setting of the selected endpoints.
• Recording exceptions: Specify the full path to the object (.exe files only) tobe excluded from event recording. Click Export to save the Recordingexceptions list as a .csv file.
When multiple endpoints are selected:
• Recording exceptions does not display any data.
• Append to existing lists adds any new exception specified to theexisting exceptions of all selected endpoints. This is the default option.
• Overwrite existing lists replaces the existing exceptions of all selectedendpoints.
• Click Remove to remove the endpoint from the list of managed endpoints.
Note
• Once removed, Endpoint Sensor will not be able to manage the endpoint, andthe endpoint will no longer be available for investigation purposes. If you needto re-register the endpoint, contact Trend Micro support.
• Removing an endpoint from this list does not uninstall the agent on theendpoint. For details on uninstalling an agent, see the Endpoint SensorInstallation Guide.
Getting Started
2-11
• Click Upgrade to upgrade all registered endpoints.
NoteThe upgrade feature is available for Endpoint Sensor servers with versions 1.6Update 3 and later. Additionally, only Endpoint Sensor agents released after the 1.6Update 3 (Build 3092) version can be automatically upgraded. To upgrade agents withversions lower than 1.6 Update 3 (Build 3092), reinstall the agents manually.
• If the Endpoint Sensor server is integrated with OfficeScan, use the TrendMicro Endpoint Sensor Deployment Tool to manually install agents to selectedendpoints.
For details, see Installing the Trend Micro Endpoint Sensor Agent on page A-13.
• Other installation methods may be available depending on your environment.For assistance on other installation methods, contact Trend Micro support.
Use Search to locate a specific endpoint by using any of the following criteria:
• Host Name: Specify the host name of the endpoint you want to locate.
• IP Address: Specify a range of IP addresses to locate.
• Asset Tag: Specify the asset tag of the endpoint you want to locate.
Use the following options to manage this list:
• Use Filters to filter the list by tags. Select one or more tags to display only theendpoints with that tag.
• Use the pagination control at the bottom of the list to display 10, 25, 50 or 100endpoints at a time.

3-1
Chapter 3
Performing an InvestigationThis section provides information on how to use Endpoint Sensor to perform aninvestigation.
Topics include:
• Running an Investigation on page 3-2
• Investigating Historical Records on page 3-9
• Investigating System Snapshots on page 3-13
• Analyzing the Results on page 3-18
• Investigation Troubleshooting on page 3-32
Endpoint Sensor 1.6 Update 4 Administrator's Guide
3-2
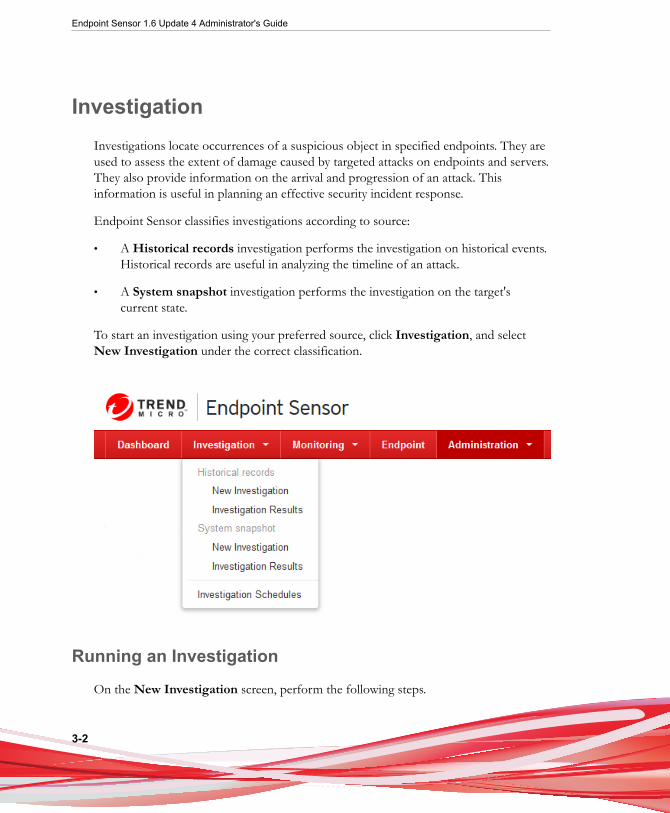
InvestigationInvestigations locate occurrences of a suspicious object in specified endpoints. They areused to assess the extent of damage caused by targeted attacks on endpoints and servers.They also provide information on the arrival and progression of an attack. Thisinformation is useful in planning an effective security incident response.
Endpoint Sensor classifies investigations according to source:
• A Historical records investigation performs the investigation on historical events.Historical records are useful in analyzing the timeline of an attack.
• A System snapshot investigation performs the investigation on the target'scurrent state.
To start an investigation using your preferred source, click Investigation, and selectNew Investigation under the correct classification.
Running an Investigation
On the New Investigation screen, perform the following steps.
Performing an Investigation
3-3
Procedure
1. Specify a unique Name for the investigation.
2. Specify a Period.
Endpoint Sensor performs the investigation on events that occurred during theperiod specified. The following options are available:
• All logged dates performs the investigation on all data, regardless of date.
• Custom range limits the investigation to a specific time period.
3. Select a Target.
Endpoint Sensor performs the investigation on all endpoints by default. However,to perform the investigation on specific endpoints only, click to show theSelect Targets screen. This screen allows you to choose which endpoints toinclude in the investigation.
For details, see Selecting Targets on page 3-4.
4. Specify Tags.
Tags are user defined strings used to identify this investigation. Type multiple tagsby separating each individual tag with a comma. These tags appear in the Resultsscreen table and are useful in locating your investigation later.
5. Specify a Schedule to set how often the investigation repeats.
The following options are available:
• Run Once: The investigation runs only once.
• Repeat: The investigation starts on the specified Start date and repeats on adaily, weekly or monthly basis, until the specified End date is reached.
For details, see Adding a Schedule on page 3-6.
6. Select an investigation method and specify valid criteria.
• For methods applicable for Historical Records, see Investigating Historical Recordson page 3-9.
Endpoint Sensor 1.6 Update 4 Administrator's Guide
3-4
• For methods applicable for System Snapshot, see Investigating System Snapshotson page 3-13.
Once the investigation starts, Endpoint Sensor updates the following screens:
• The investigation is added to the Results screen.
For details, see Investigation Results on page 3-20.
• If the investigation recurrence has been set to Repeat, the given schedule nameappears in the Schedule screen.
For details, see Managing Schedules on page 3-8.
• Data from finished investigations is added to the Dashboard screen.
For details, see Dashboard on page 2-4.
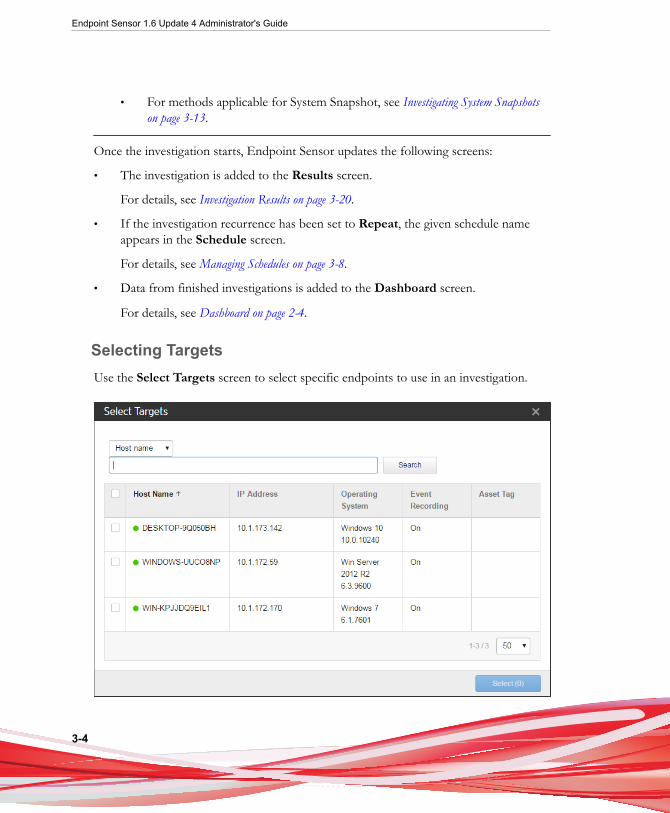
Selecting TargetsUse the Select Targets screen to select specific endpoints to use in an investigation.
Performing an Investigation
3-5
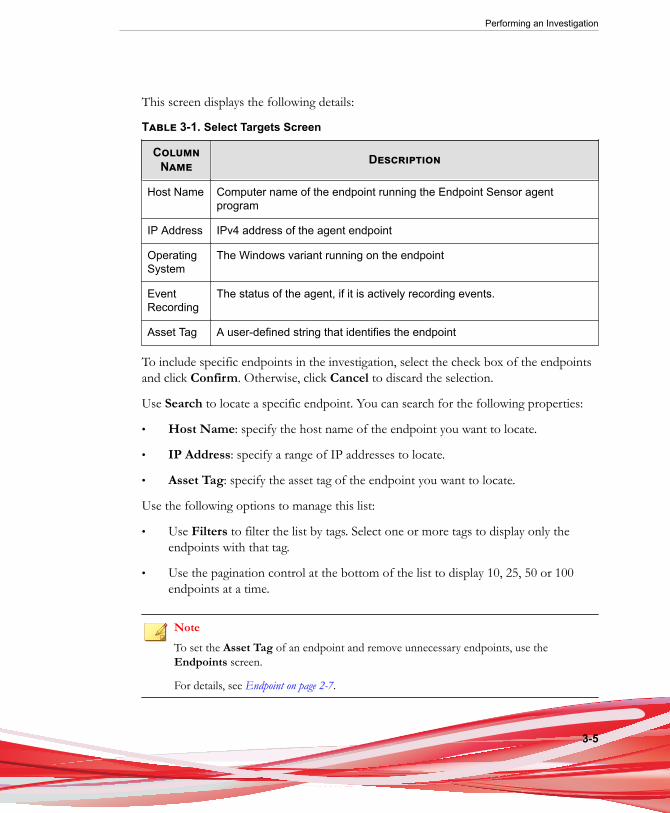
This screen displays the following details:
Table 3-1. Select Targets Screen
ColumnName Description
Host Name Computer name of the endpoint running the Endpoint Sensor agentprogram
IP Address IPv4 address of the agent endpoint
OperatingSystem
The Windows variant running on the endpoint
EventRecording
The status of the agent, if it is actively recording events.
Asset Tag A user-defined string that identifies the endpoint
To include specific endpoints in the investigation, select the check box of the endpointsand click Confirm. Otherwise, click Cancel to discard the selection.
Use Search to locate a specific endpoint. You can search for the following properties:
• Host Name: specify the host name of the endpoint you want to locate.
• IP Address: specify a range of IP addresses to locate.
• Asset Tag: specify the asset tag of the endpoint you want to locate.
Use the following options to manage this list:
• Use Filters to filter the list by tags. Select one or more tags to display only theendpoints with that tag.
• Use the pagination control at the bottom of the list to display 10, 25, 50 or 100endpoints at a time.
NoteTo set the Asset Tag of an endpoint and remove unnecessary endpoints, use theEndpoints screen.
For details, see Endpoint on page 2-7.
Endpoint Sensor 1.6 Update 4 Administrator's Guide
3-6
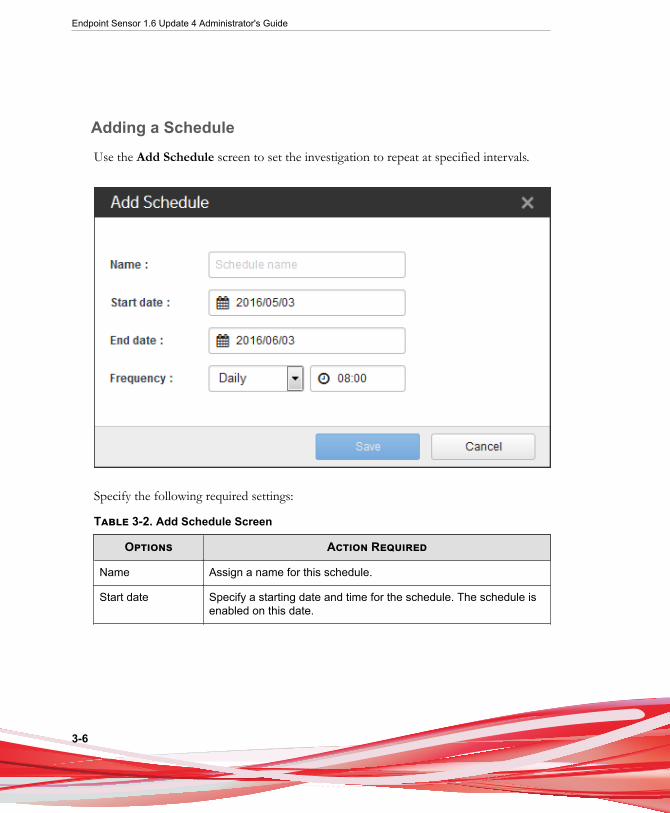
Adding a ScheduleUse the Add Schedule screen to set the investigation to repeat at specified intervals.
Specify the following required settings:
Table 3-2. Add Schedule Screen
Options Action Required
Name Assign a name for this schedule.
Start date Specify a starting date and time for the schedule. The schedule isenabled on this date.
Performing an Investigation
3-7
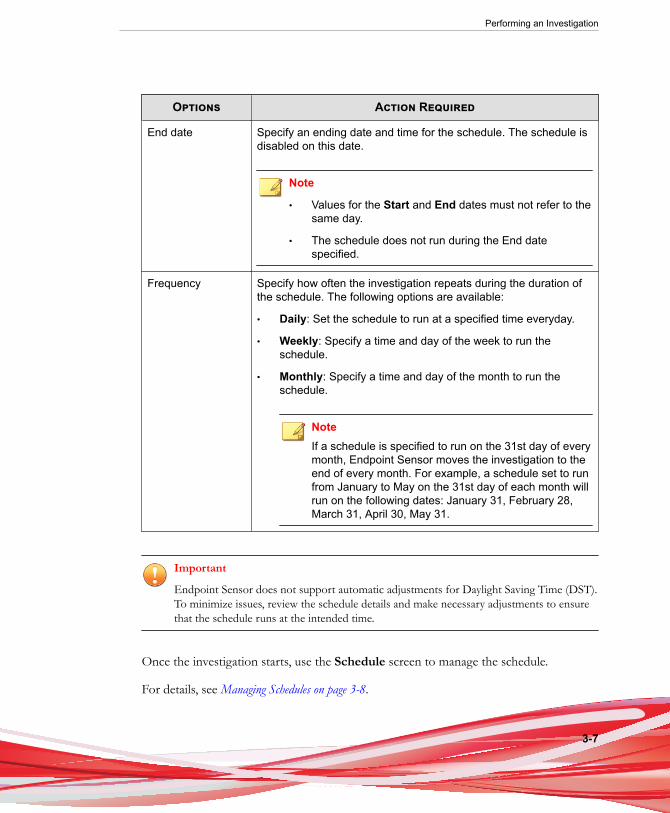
Options Action Required
End date Specify an ending date and time for the schedule. The schedule isdisabled on this date.
Note
• Values for the Start and End dates must not refer to thesame day.
• The schedule does not run during the End datespecified.
Frequency Specify how often the investigation repeats during the duration ofthe schedule. The following options are available:
• Daily: Set the schedule to run at a specified time everyday.
• Weekly: Specify a time and day of the week to run theschedule.
• Monthly: Specify a time and day of the month to run theschedule.
NoteIf a schedule is specified to run on the 31st day of everymonth, Endpoint Sensor moves the investigation to theend of every month. For example, a schedule set to runfrom January to May on the 31st day of each month willrun on the following dates: January 31, February 28,March 31, April 30, May 31.
Important
Endpoint Sensor does not support automatic adjustments for Daylight Saving Time (DST).To minimize issues, review the schedule details and make necessary adjustments to ensurethat the schedule runs at the intended time.
Once the investigation starts, use the Schedule screen to manage the schedule.
For details, see Managing Schedules on page 3-8.

Endpoint Sensor 1.6 Update 4 Administrator's Guide
3-8
Managing Schedules
Use the Investigation Schedules screen to manage all investigation schedules.
The following table lists the schedule details available for review:
Table 3-3. Schedule Details
Column Name Description
Schedule Name The name given to the schedule.
Status The current status of the schedule.
Frequency The recurrence pattern set for the schedule.
Next Schedule The time when the next investigation occurs.
Start The start date of a schedule. After this date, the schedule runs theinvestigation repeatedly until the End date is reached.
End The end date of a schedule. The investigation no longer runs onand after this date.
History The number of times the investigation has repeated.
Select at least one schedule to activate the following options:
Performing an Investigation
3-9
• Click Toggle Status > Disable to temporarily disable the schedule.
• Click Toggle Status > Enable to enable a disabled schedule.
• Click Remove to remove the schedule.
Use the following options to manage this list:
• Use Filters to filter the list by tags. Select one or more tags to display only theendpoints with that tag.
• Use the pagination control at the bottom of the list to display 10, 25, 50 or 100endpoints at a time.
Note
• To add a schedule, run a new investigation.
For more details, see Investigation on page 3-2.
• Endpoint Sensor does not support automatic adjustments for Daylight Saving Time(DST). To minimize issues, review the schedule details and make necessaryadjustments to ensure that the schedule runs at the intended time.
For details, see Dashboard on page 2-4.
Investigating Historical RecordsTo investigate historical records, click Investigation and select New Investigationunder the Historical records category.
Endpoint Sensor uses the following methods to investigate historical records.
Endpoint Sensor 1.6 Update 4 Administrator's Guide
3-10
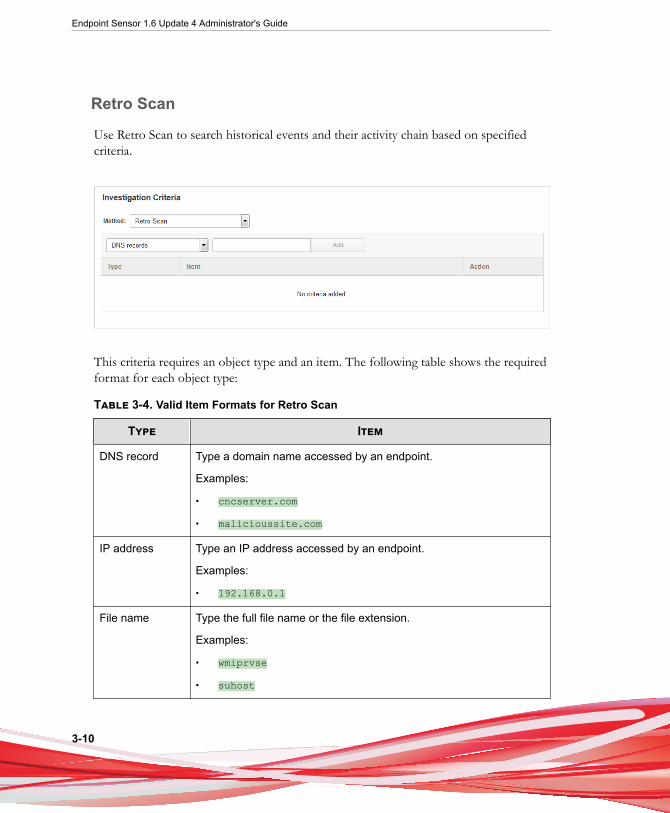
Retro Scan
Use Retro Scan to search historical events and their activity chain based on specifiedcriteria.
This criteria requires an object type and an item. The following table shows the requiredformat for each object type:
Table 3-4. Valid Item Formats for Retro Scan
Type Item
DNS record Type a domain name accessed by an endpoint.
Examples:
• cncserver.com
• malicioussite.com
IP address Type an IP address accessed by an endpoint.
Examples:
• 192.168.0.1
File name Type the full file name or the file extension.
Examples:
• wmiprvse
• suhost
Performing an Investigation
3-11
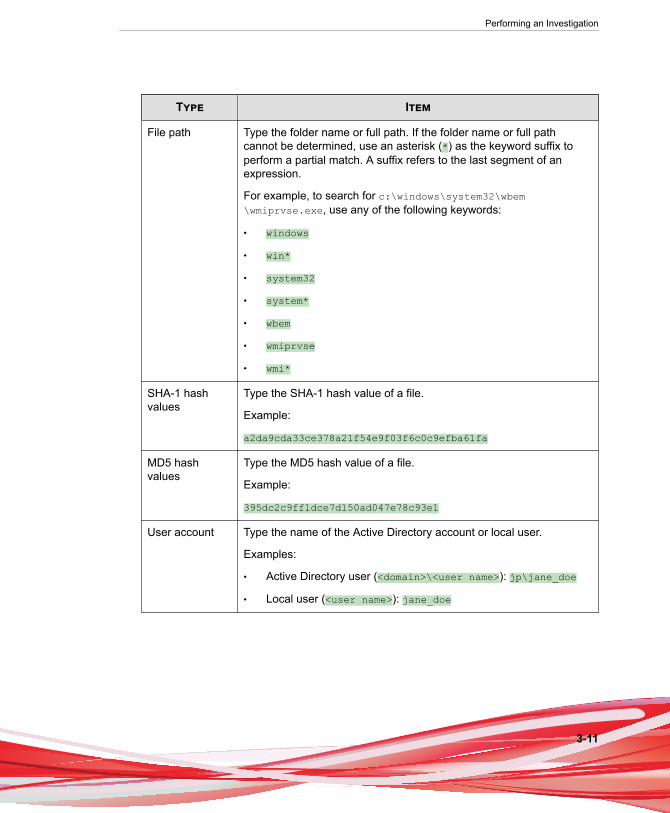
Type Item
File path Type the folder name or full path. If the folder name or full pathcannot be determined, use an asterisk (*) as the keyword suffix toperform a partial match. A suffix refers to the last segment of anexpression.
For example, to search for c:\windows\system32\wbem\wmiprvse.exe, use any of the following keywords:
• windows
• win*
• system32
• system*
• wbem
• wmiprvse
• wmi*
SHA-1 hashvalues
Type the SHA-1 hash value of a file.
Example:
a2da9cda33ce378a21f54e9f03f6c0c9efba61fa
MD5 hashvalues
Type the MD5 hash value of a file.
Example:
395dc2c9ff1dce7d150ad047e78c93e1
User account Type the name of the Active Directory account or local user.
Examples:
• Active Directory user (<domain>\<user name>): jp\jane_doe
• Local user (<user name>): jane_doe
Endpoint Sensor 1.6 Update 4 Administrator's Guide
3-12
Note
• A Retro Scan investigation can include up to 128 search criteria.
• Free-form search supports partial matching of terms, provided that the term does notinclude spaces.
• Search conditions are NOT case-sensitive.
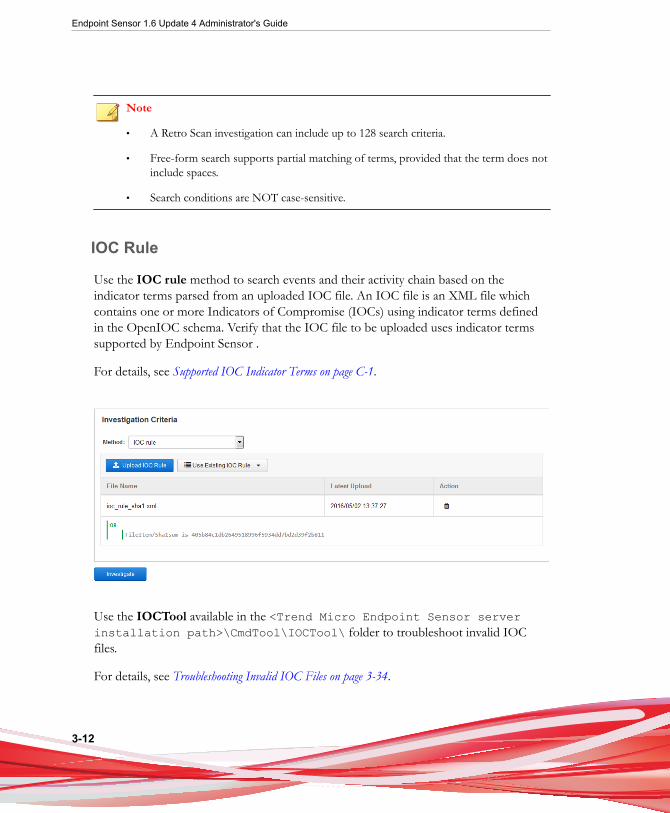
IOC Rule
Use the IOC rule method to search events and their activity chain based on theindicator terms parsed from an uploaded IOC file. An IOC file is an XML file whichcontains one or more Indicators of Compromise (IOCs) using indicator terms definedin the OpenIOC schema. Verify that the IOC file to be uploaded uses indicator termssupported by Endpoint Sensor .
For details, see Supported IOC Indicator Terms on page C-1.
Use the IOCTool available in the <Trend Micro Endpoint Sensor serverinstallation path>\CmdTool\IOCTool\ folder to troubleshoot invalid IOCfiles.
For details, see Troubleshooting Invalid IOC Files on page 3-34.
Performing an Investigation
3-13
Note
• The maximum file size for an IOC file is 1024KB.
• Endpoint Sensor can store a total of 10 IOC files. Once this limit is reached,Endpoint Sensor hides the Upload IOC Rule button. Delete one or more IOC filesto show the Upload IOC Rule button again.
• Once uploaded, the IOC file is available for all future investigations. Ensure that anIOC file is selected before you start the investigation.
Investigating System Snapshots
To investigate system snapshots, click Investigation and select New Investigationunder the System snapshot category.
Endpoint Sensor uses the following methods to investigate system snapshots.
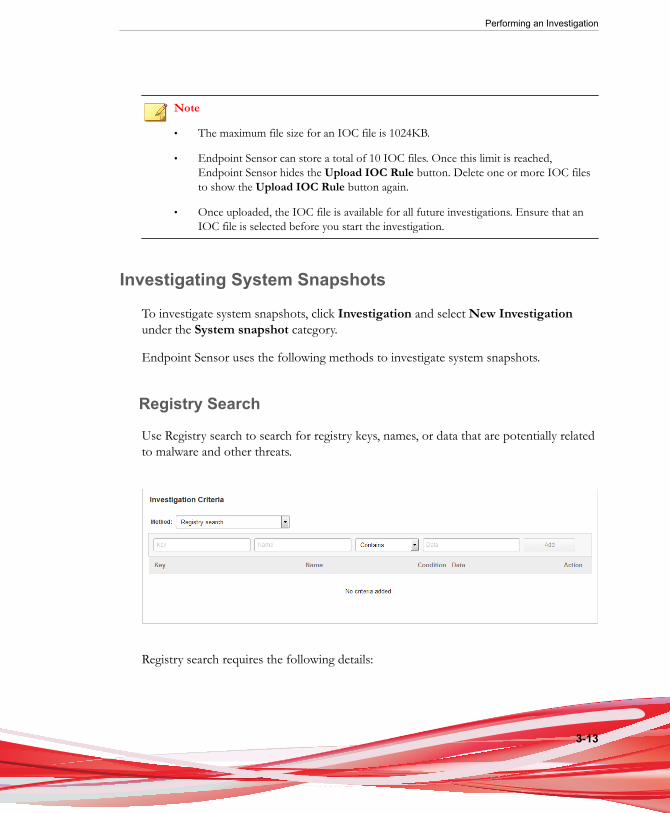
Registry Search
Use Registry search to search for registry keys, names, or data that are potentially relatedto malware and other threats.
Registry search requires the following details:
Endpoint Sensor 1.6 Update 4 Administrator's Guide
3-14
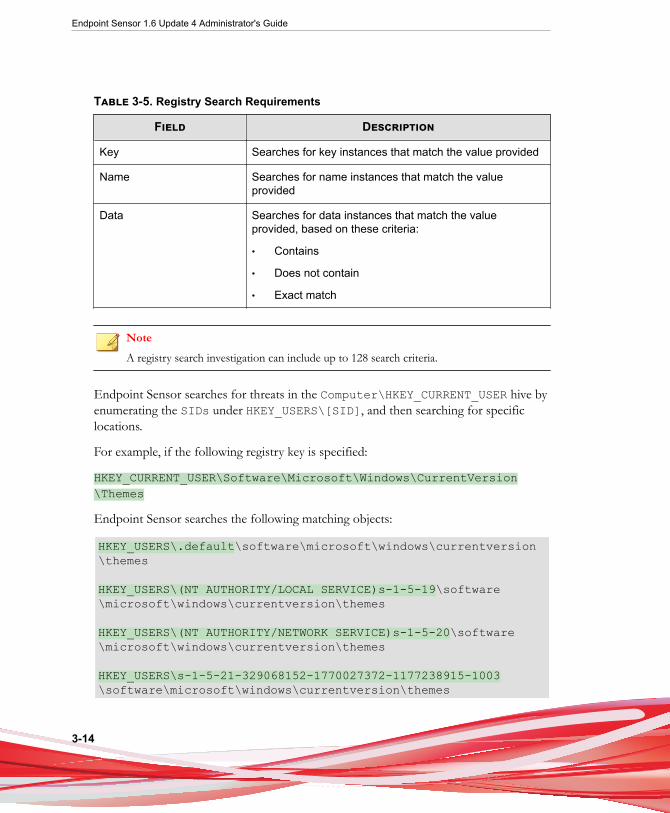
Table 3-5. Registry Search Requirements
Field Description
Key Searches for key instances that match the value provided
Name Searches for name instances that match the valueprovided
Data Searches for data instances that match the valueprovided, based on these criteria:
• Contains
• Does not contain
• Exact match
NoteA registry search investigation can include up to 128 search criteria.
Endpoint Sensor searches for threats in the Computer\HKEY_CURRENT_USER hive byenumerating the SIDs under HKEY_USERS\[SID], and then searching for specificlocations.
For example, if the following registry key is specified:
HKEY_CURRENT_USER\Software\Microsoft\Windows\CurrentVersion\Themes
Endpoint Sensor searches the following matching objects:
HKEY_USERS\.default\software\microsoft\windows\currentversion\themes
HKEY_USERS\(NT AUTHORITY/LOCAL SERVICE)s-1-5-19\software\microsoft\windows\currentversion\themes
HKEY_USERS\(NT AUTHORITY/NETWORK SERVICE)s-1-5-20\software\microsoft\windows\currentversion\themes
HKEY_USERS\s-1-5-21-329068152-1770027372-1177238915-1003\software\microsoft\windows\currentversion\themes
Performing an Investigation
3-15
HKEY_USERS\(VM_XP003/Administrator)s-1-5-21-329068152-1770027372-1177238915-500\software\microsoft\windows\currentversion\themes
HKEY_USERS\(NT AUTHORITY/SYSTEM)s-1-5-18\software\microsoft\windows\currentversion\themes
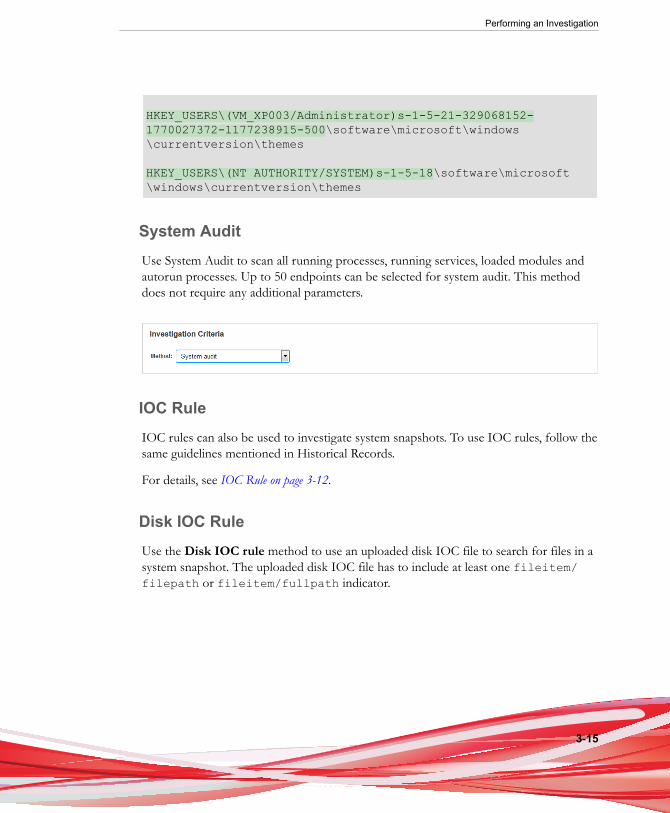
System AuditUse System Audit to scan all running processes, running services, loaded modules andautorun processes. Up to 50 endpoints can be selected for system audit. This methoddoes not require any additional parameters.
IOC RuleIOC rules can also be used to investigate system snapshots. To use IOC rules, follow thesame guidelines mentioned in Historical Records.
For details, see IOC Rule on page 3-12.
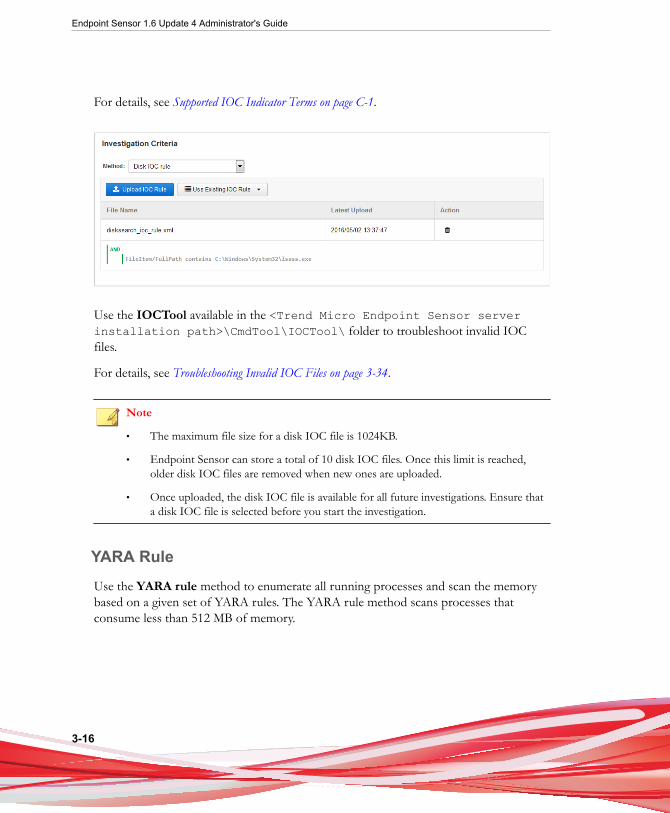
Disk IOC RuleUse the Disk IOC rule method to use an uploaded disk IOC file to search for files in asystem snapshot. The uploaded disk IOC file has to include at least one fileitem/filepath or fileitem/fullpath indicator.
Endpoint Sensor 1.6 Update 4 Administrator's Guide
3-16
For details, see Supported IOC Indicator Terms on page C-1.
Use the IOCTool available in the <Trend Micro Endpoint Sensor serverinstallation path>\CmdTool\IOCTool\ folder to troubleshoot invalid IOCfiles.
For details, see Troubleshooting Invalid IOC Files on page 3-34.
Note
• The maximum file size for a disk IOC file is 1024KB.
• Endpoint Sensor can store a total of 10 disk IOC files. Once this limit is reached,older disk IOC files are removed when new ones are uploaded.
• Once uploaded, the disk IOC file is available for all future investigations. Ensure thata disk IOC file is selected before you start the investigation.
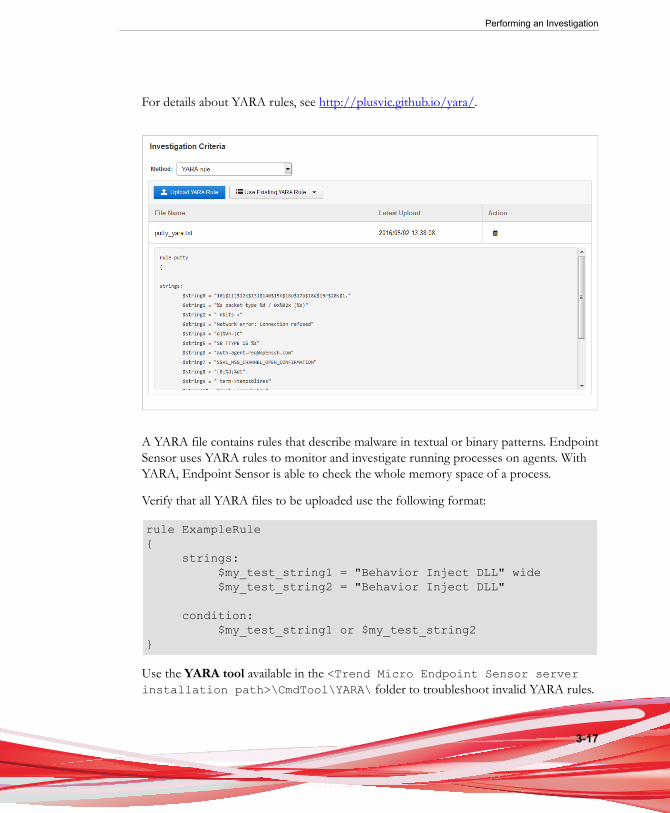
YARA RuleUse the YARA rule method to enumerate all running processes and scan the memorybased on a given set of YARA rules. The YARA rule method scans processes thatconsume less than 512 MB of memory.
Performing an Investigation
3-17
For details about YARA rules, see http://plusvic.github.io/yara/.
A YARA file contains rules that describe malware in textual or binary patterns. EndpointSensor uses YARA rules to monitor and investigate running processes on agents. WithYARA, Endpoint Sensor is able to check the whole memory space of a process.
Verify that all YARA files to be uploaded use the following format:
rule ExampleRule{ strings: $my_test_string1 = "Behavior Inject DLL" wide $my_test_string2 = "Behavior Inject DLL" condition: $my_test_string1 or $my_test_string2}
Use the YARA tool available in the <Trend Micro Endpoint Sensor serverinstallation path>\CmdTool\YARA\ folder to troubleshoot invalid YARA rules.
Endpoint Sensor 1.6 Update 4 Administrator's Guide
3-18
For details, see Troubleshooting Invalid YARA Rules on page 3-35.
Note
• The maximum file size for a YARA file is 1024KB.
• Endpoint Sensor can store a total of 10 YARA files. Once this limit is reached, olderYARA files are removed when new ones are uploaded.
• Once uploaded, the YARA file is available for all future investigations. Ensure that aYARA file is selected before you start the investigation.
YARA Sample for Driver Files
The following YARA file sample searches for driver files based on a given set of strings:
rule APT_driver{ strings: $s1 = "Services\\riodrv32" wide ascii $s2 = "riodrv32.sys" wide ascii $s3 = "svchost.exe" wide ascii $s4 = "wuauserv.dll" wide ascii $s5 = "arp.exe" wide ascii $pdb = "projects\\auriga" wide ascii
condition: all of ($s*) or $pdb}
Analyzing the ResultsPerform the following steps to analyze the investigation results.
Procedure
1. Click Investigation, and select the correct result screen for your investigationsource.
Performing an Investigation
3-19
2. On the Results screen, monitor the progress of the investigation. Wait for theinvestigation to show a processing status. Click on the investigation name to viewmore information.
For details, see Investigation Results on page 3-20.
3. On the Information screen, view the investigation activity. Endpoint Sensorinvestigates each endpoint. Once finished with the investigation for an endpoint,Endpoint Sensor updates the screen in real-time to add the result for that endpoint.It then proceeds to investigate the next endpoint.
For details, see Information on page 3-22.
4. Review the results using the tools available in Endpoint Sensor :
• Result Details on page 3-24
• Root Cause Chain on page 3-25
• Recorded Objects on page 3-31
Endpoint Sensor 1.6 Update 4 Administrator's Guide
3-20
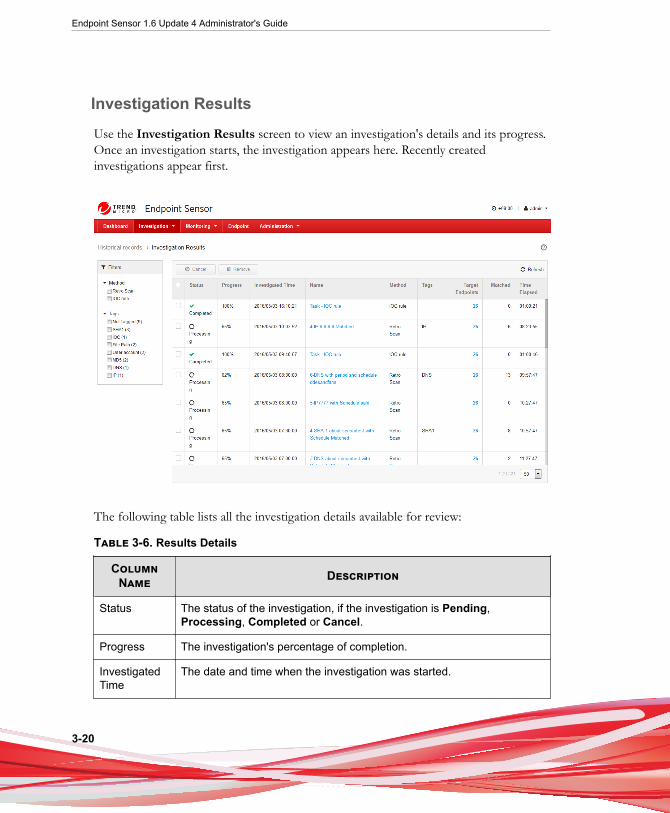
Investigation Results
Use the Investigation Results screen to view an investigation's details and its progress.Once an investigation starts, the investigation appears here. Recently createdinvestigations appear first.
The following table lists all the investigation details available for review:
Table 3-6. Results Details
ColumnName Description
Status The status of the investigation, if the investigation is Pending,Processing, Completed or Cancel.
Progress The investigation's percentage of completion.
InvestigatedTime
The date and time when the investigation was started.
Performing an Investigation
3-21
ColumnName Description
Name The name given to the investigation.
Method The method used by the investigation.
Tags The user-defined string given when the investigation was created.
For details, see Investigation on page 3-2.
TargetEndpoints
The number of endpoints included in the investigation.
For details, see Selecting Targets on page 3-4.
Matched The number of matching objects found on the endpoint.
Time Elapsed Time elapsed since the investigation started.
Use the following options to manage the investigations:
• Click Cancel to stop the progress of the investigation. However, results forendpoints already investigated are still available for review. Cancelled investigationscannot be resumed.
Note
• After the investigation has been cancelled, the Trend Micro Endpoint Sensorserver may show the status of some endpoints as still being processed forinvestigation. The server stops updating the screen once an investigation iscancelled. However, if an endpoint is in the middle of being investigated, TrendMicro Endpoint Sensor will finish the investigation for that endpoint, but willno longer proceed with the remaining endpoints.
• If a previous investigation is cancelled and a new investigation is started, thenew investigation may some time to start. If the user cancels the investigation,investigations for all remaining pending endpoints are dropped, but Trend MicroEndpoint Sensor will still complete the investigation for the currentlyinvestigated endpoint before stopping completely. This investigation can takesome time to complete. Note that the previous investigation has to completelystop before a new investigation can begin.
Endpoint Sensor 1.6 Update 4 Administrator's Guide
3-22
• Click Remove to remove the investigation from the list. The investigation and allendpoint data related to the investigation will be removed from the server.Removed investigations cannot be recovered.
• Use Filters to filter the list by tags. Select one or more tags to display only theendpoints with that tag.
• Use the pagination control at the bottom of the list to display 10, 25, 50 or 100endpoints at a time.
To view more details, click the investigation's Name.
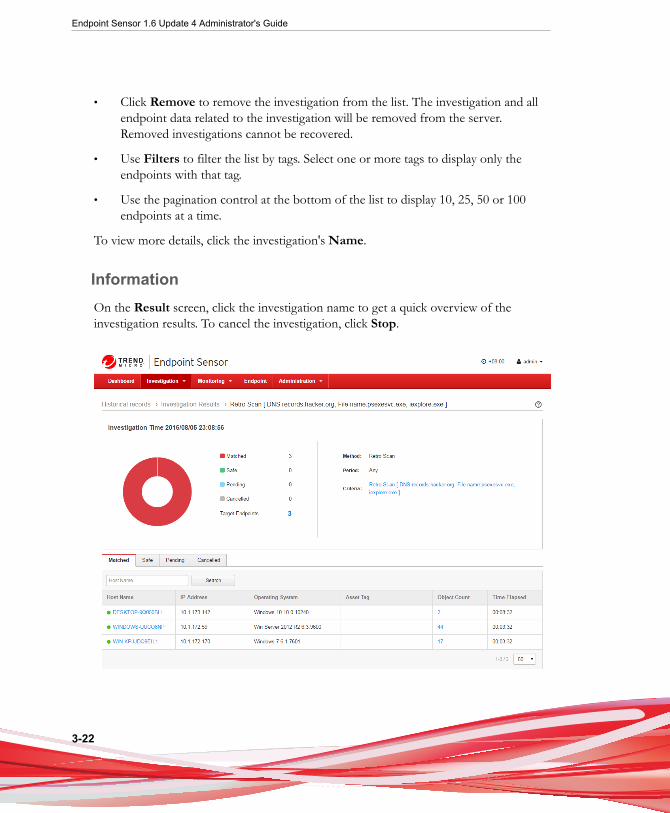
InformationOn the Result screen, click the investigation name to get a quick overview of theinvestigation results. To cancel the investigation, click Stop.
Performing an Investigation
3-23
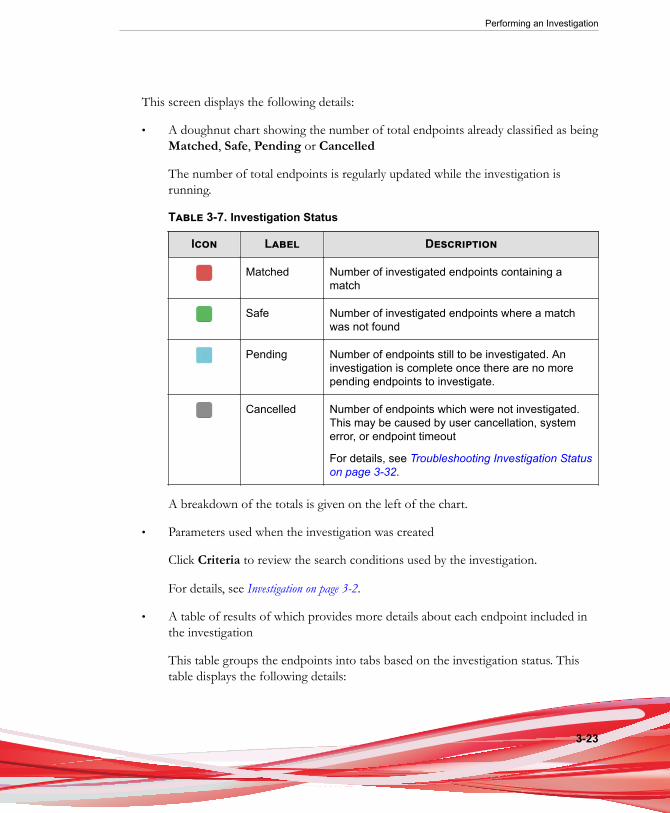
This screen displays the following details:
• A doughnut chart showing the number of total endpoints already classified as beingMatched, Safe, Pending or Cancelled
The number of total endpoints is regularly updated while the investigation isrunning.
Table 3-7. Investigation Status
Icon Label Description
Matched Number of investigated endpoints containing amatch
Safe Number of investigated endpoints where a matchwas not found
Pending Number of endpoints still to be investigated. Aninvestigation is complete once there are no morepending endpoints to investigate.
Cancelled Number of endpoints which were not investigated.This may be caused by user cancellation, systemerror, or endpoint timeout
For details, see Troubleshooting Investigation Statuson page 3-32.
A breakdown of the totals is given on the left of the chart.
• Parameters used when the investigation was created
Click Criteria to review the search conditions used by the investigation.
For details, see Investigation on page 3-2.
• A table of results of which provides more details about each endpoint included inthe investigation
This table groups the endpoints into tabs based on the investigation status. Thistable displays the following details:
Endpoint Sensor 1.6 Update 4 Administrator's Guide
3-24
Column Name Description
Host Name The host name of the endpoint. Click the endpoint's hostname to go to that endpoint's Matched Endpoint screen.
For details, see Result Details on page 3-24.
IP Address The IPv4 address of the endpoint.
Operating System The version of Windows installed on the endpoint.
Asset Tag The tags associated with the endpoint.
Object Count The number of matched objects found on the endpoint.
Time Elapsed Time elapsed since the investigation started.
Click View Investigation Criteria to review the search conditions used by theinvestigation.
For details, see Investigation on page 3-2.
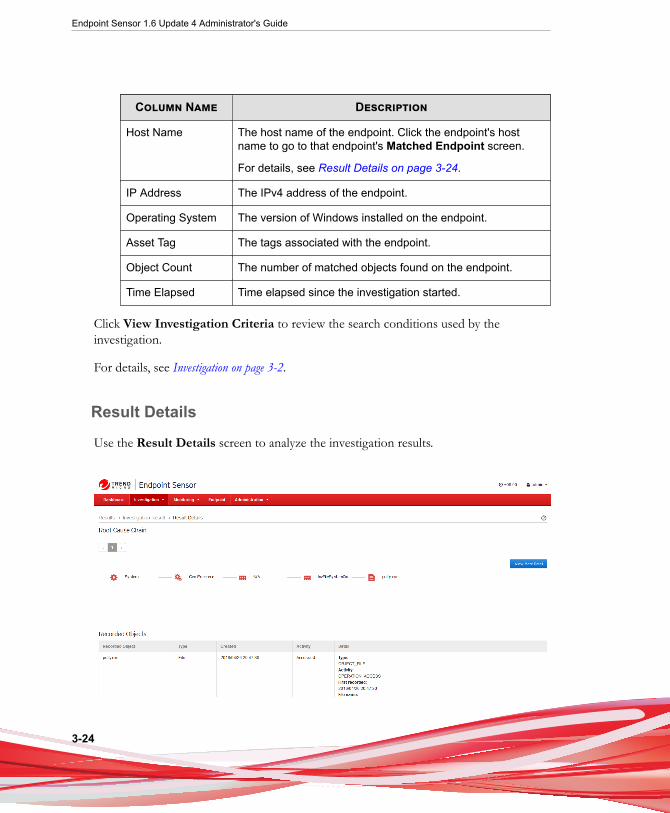
Result Details
Use the Result Details screen to analyze the investigation results.
Performing an Investigation
3-25
NoteTo return to the previous Investigation Result screen, use the breadcrumb navigation atthe top.
The Matched Endpoint screen is composed of the following areas:
• Root Cause Chain displays a visual representation of the matched object and allits related objects. It presents an analysis of events by showing the objects used bythe matched object to execute.
To narrow your investigation down to specific items on the root cause chain, clickView More Details.
For details, see Root Cause Chain on page 3-25.
• Recorded Objects displays details about the matched object and all its relatedobjects. Details shown here come from the Objects List screen.
For details, see Recorded Objects on page 3-31.
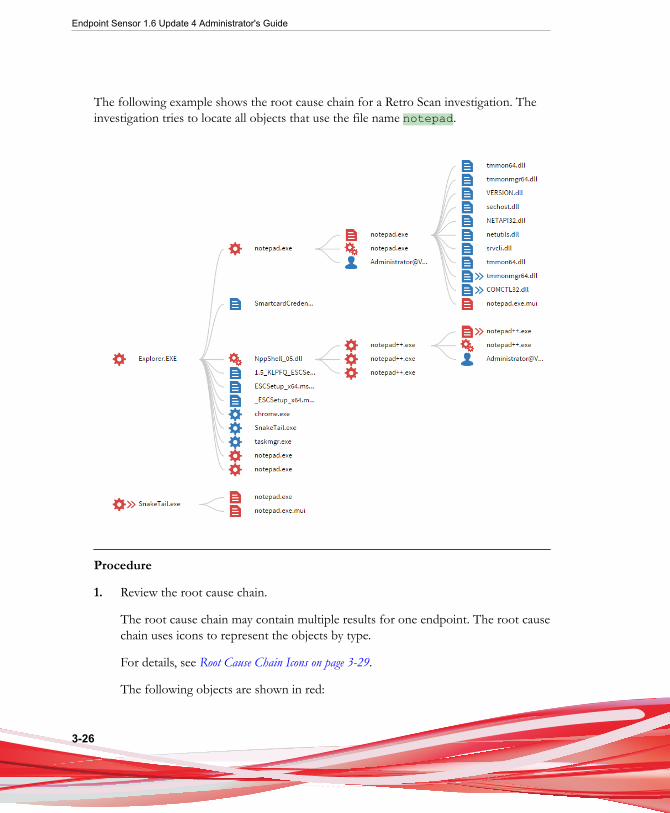
Root Cause ChainThe Root Cause Chain screen displays a visual analysis of the objects involved in anevent.
Endpoint Sensor 1.6 Update 4 Administrator's Guide
3-26
The following example shows the root cause chain for a Retro Scan investigation. Theinvestigation tries to locate all objects that use the file name notepad.
Procedure
1. Review the root cause chain.
The root cause chain may contain multiple results for one endpoint. The root causechain uses icons to represent the objects by type.
For details, see Root Cause Chain Icons on page 3-29.
The following objects are shown in red:
Performing an Investigation
3-27
• The matched object. This is the object that meets the search criteria set by theinvestigation.
• All the dependencies of the matched object. These are the objects required torun the matched object.
All other objects in the chain (that did not contribute to the execution of thematched object) are shown in blue. Objects that branch out of the matched objectare also shown in blue.
2. Review all the objects (both red and blue). If one of the objects appears suspicious,select the object and perform any of the following:
• Use the tooltip on the left to review the details of the selected object. Thesedetails come from the Object List screen. For details, see Recorded Objects onpage 3-31.
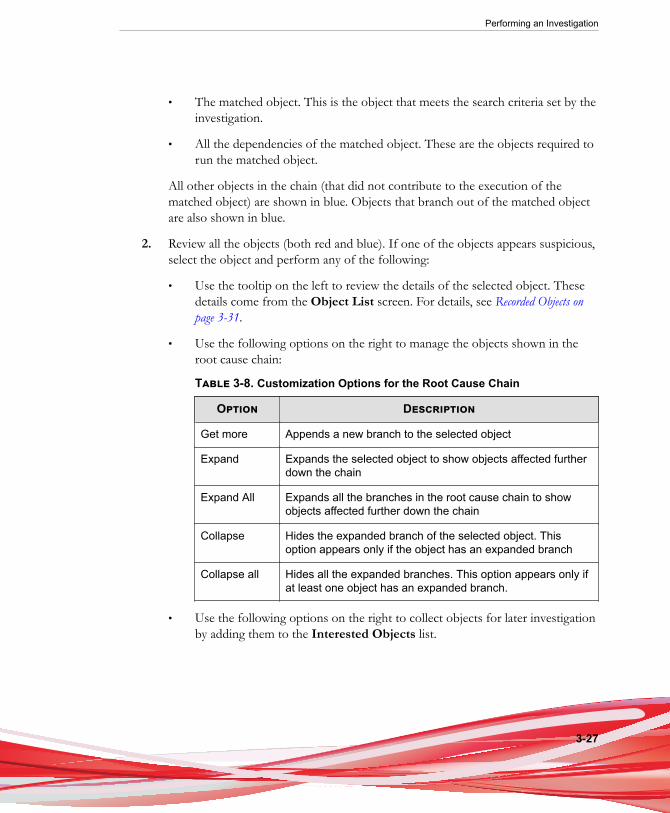
• Use the following options on the right to manage the objects shown in theroot cause chain:
Table 3-8. Customization Options for the Root Cause Chain
Option Description
Get more Appends a new branch to the selected object
Expand Expands the selected object to show objects affected furtherdown the chain
Expand All Expands all the branches in the root cause chain to showobjects affected further down the chain
Collapse Hides the expanded branch of the selected object. Thisoption appears only if the object has an expanded branch
Collapse all Hides all the expanded branches. This option appears only ifat least one object has an expanded branch.
• Use the following options on the right to collect objects for later investigationby adding them to the Interested Objects list.
Endpoint Sensor 1.6 Update 4 Administrator's Guide
3-28
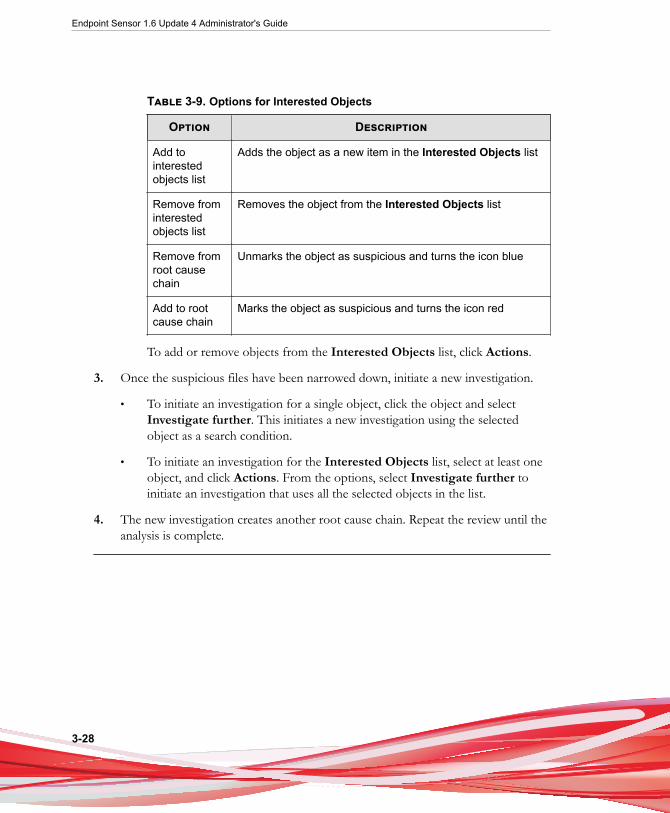
Table 3-9. Options for Interested Objects
Option Description
Add tointerestedobjects list
Adds the object as a new item in the Interested Objects list
Remove frominterestedobjects list
Removes the object from the Interested Objects list
Remove fromroot causechain
Unmarks the object as suspicious and turns the icon blue
Add to rootcause chain
Marks the object as suspicious and turns the icon red
To add or remove objects from the Interested Objects list, click Actions.
3. Once the suspicious files have been narrowed down, initiate a new investigation.
• To initiate an investigation for a single object, click the object and selectInvestigate further. This initiates a new investigation using the selectedobject as a search condition.
• To initiate an investigation for the Interested Objects list, select at least oneobject, and click Actions. From the options, select Investigate further toinitiate an investigation that uses all the selected objects in the list.
4. The new investigation creates another root cause chain. Repeat the review until theanalysis is complete.
Performing an Investigation
3-29
Note
Use the following options to navigate the root cause chain:
• Use the Contents list to view all objects shown in red. The objects are organizedaccording to the root cause chain they belong to. Click an item in the Contents list tocenter that item on the root cause chain area.
• To increase the space available for the root cause chain area, click and to hidethe Interested Objects and the Contents list respectively.
• Use the Current Screen to determine the location of the object in relation to the areaof the root cause chain.
• The gray box represents the full area of the root cause chain. This box expandsas more branches are added to the initial root cause chain.
• The box with the blue outline represents the current area being viewed. If thescreen is resized, this box resizes to match the new screen size.
Root Cause Chain Icons
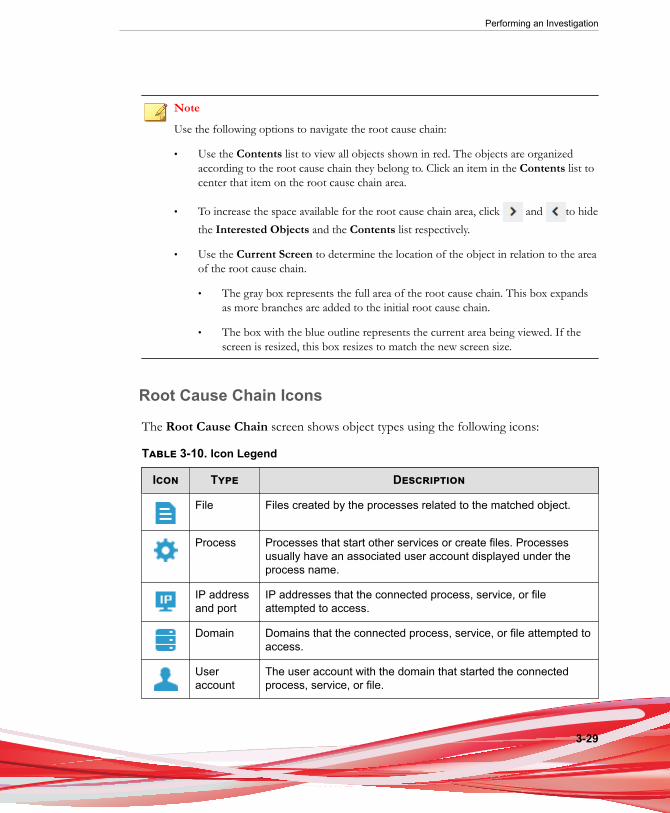
The Root Cause Chain screen shows object types using the following icons:
Table 3-10. Icon Legend
Icon Type Description
File Files created by the processes related to the matched object.
Process Processes that start other services or create files. Processesusually have an associated user account displayed under theprocess name.
IP addressand port
IP addresses that the connected process, service, or fileattempted to access.
Domain Domains that the connected process, service, or file attempted toaccess.
Useraccount
The user account with the domain that started the connectedprocess, service, or file.

Endpoint Sensor 1.6 Update 4 Administrator's Guide
3-30
Icon Type Description
Service Services that create files, or start other processes and services.Services usually have an associated user account displayedunder the service name.
Registry Registry operations implemented by a process, service ormodule, especially for autorun processes.
AutorunProcess
Registry entries that launch processes and services duringsystem startup.
Module Modules loaded by a process or service to perform a routine.
Mutex Objects used in coordinating mutually exclusive access to ashared resource.
Semaphore A software flag with a value that indicates the status of acommon resource.
Inject API APIs used by the matched object to inject itself or any of itsdependencies into a process.
WinINetAPI
APIs that are used for network connection and informationtransfer.
Downloaded file
Files that are downloaded from a URL.
Unknown Unknown modules and files.
InternetAPI
APIs that are used to connect to the Internet via application level.For example, HTTP/FTP.
NoteClick Legend to view the icon descriptions.
Performing an Investigation
3-31
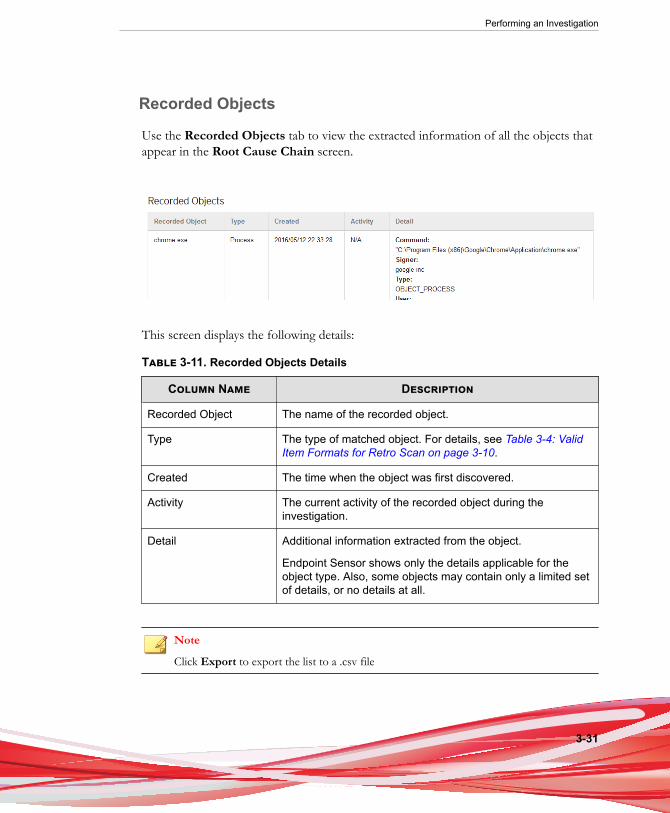
Recorded Objects
Use the Recorded Objects tab to view the extracted information of all the objects thatappear in the Root Cause Chain screen.
This screen displays the following details:
Table 3-11. Recorded Objects Details
Column Name Description
Recorded Object The name of the recorded object.
Type The type of matched object. For details, see Table 3-4: ValidItem Formats for Retro Scan on page 3-10.
Created The time when the object was first discovered.
Activity The current activity of the recorded object during theinvestigation.
Detail Additional information extracted from the object.
Endpoint Sensor shows only the details applicable for theobject type. Also, some objects may contain only a limited setof details, or no details at all.
Note
Click Export to export the list to a .csv file
Endpoint Sensor 1.6 Update 4 Administrator's Guide
3-32
Investigation TroubleshootingThe following topics describe specific potential issues involving investigations.
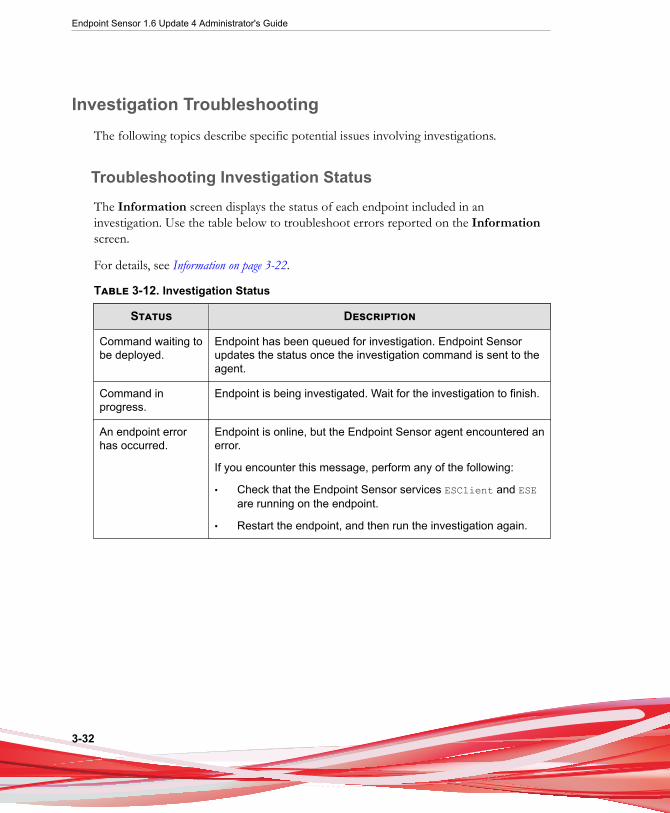
Troubleshooting Investigation StatusThe Information screen displays the status of each endpoint included in aninvestigation. Use the table below to troubleshoot errors reported on the Informationscreen.
For details, see Information on page 3-22.
Table 3-12. Investigation Status
Status Description
Command waiting tobe deployed.
Endpoint has been queued for investigation. Endpoint Sensorupdates the status once the investigation command is sent to theagent.
Command inprogress.
Endpoint is being investigated. Wait for the investigation to finish.
An endpoint errorhas occurred.
Endpoint is online, but the Endpoint Sensor agent encountered anerror.
If you encounter this message, perform any of the following:
• Check that the Endpoint Sensor services ESClient and ESEare running on the endpoint.
• Restart the endpoint, and then run the investigation again.
Performing an Investigation
3-33
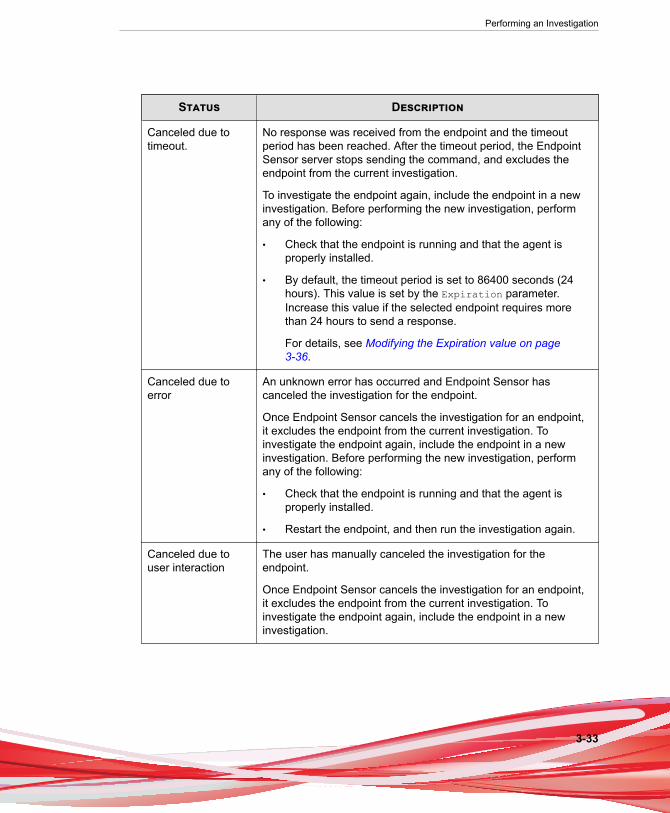
Status Description
Canceled due totimeout.
No response was received from the endpoint and the timeoutperiod has been reached. After the timeout period, the EndpointSensor server stops sending the command, and excludes theendpoint from the current investigation.
To investigate the endpoint again, include the endpoint in a newinvestigation. Before performing the new investigation, performany of the following:
• Check that the endpoint is running and that the agent isproperly installed.
• By default, the timeout period is set to 86400 seconds (24hours). This value is set by the Expiration parameter.Increase this value if the selected endpoint requires morethan 24 hours to send a response.
For details, see Modifying the Expiration value on page3-36.
Canceled due toerror
An unknown error has occurred and Endpoint Sensor hascanceled the investigation for the endpoint.
Once Endpoint Sensor cancels the investigation for an endpoint,it excludes the endpoint from the current investigation. Toinvestigate the endpoint again, include the endpoint in a newinvestigation. Before performing the new investigation, performany of the following:
• Check that the endpoint is running and that the agent isproperly installed.
• Restart the endpoint, and then run the investigation again.
Canceled due touser interaction
The user has manually canceled the investigation for theendpoint.
Once Endpoint Sensor cancels the investigation for an endpoint,it excludes the endpoint from the current investigation. Toinvestigate the endpoint again, include the endpoint in a newinvestigation.
Endpoint Sensor 1.6 Update 4 Administrator's Guide
3-34
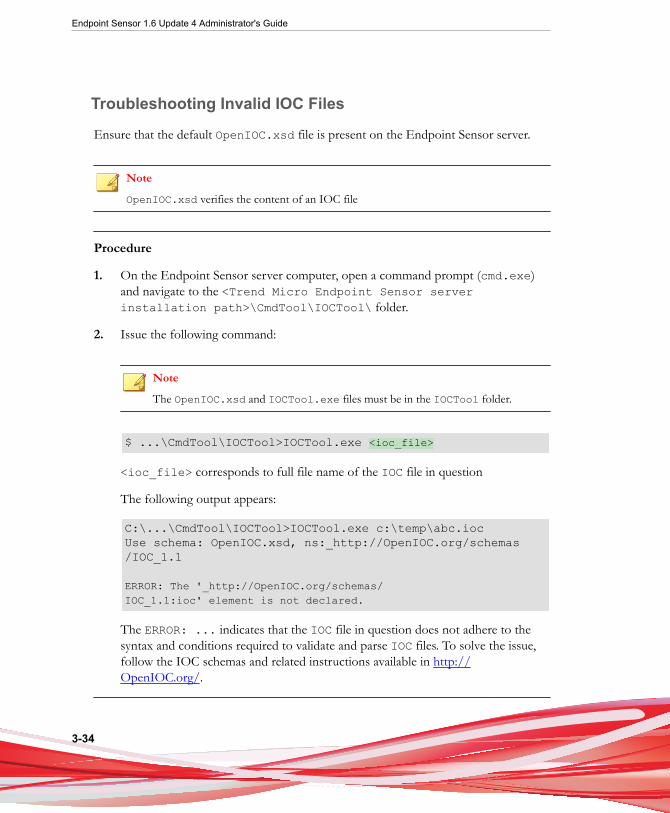
Troubleshooting Invalid IOC Files
Ensure that the default OpenIOC.xsd file is present on the Endpoint Sensor server.
Note
OpenIOC.xsd verifies the content of an IOC file
Procedure
1. On the Endpoint Sensor server computer, open a command prompt (cmd.exe)and navigate to the <Trend Micro Endpoint Sensor serverinstallation path>\CmdTool\IOCTool\ folder.
2. Issue the following command:
Note
The OpenIOC.xsd and IOCTool.exe files must be in the IOCTool folder.
$ ...\CmdTool\IOCTool>IOCTool.exe <ioc_file>
<ioc_file> corresponds to full file name of the IOC file in question
The following output appears:
C:\...\CmdTool\IOCTool>IOCTool.exe c:\temp\abc.iocUse schema: OpenIOC.xsd, ns:_http://OpenIOC.org/schemas/IOC_1.1
ERROR: The '_http://OpenIOC.org/schemas/IOC_1.1:ioc' element is not declared.
The ERROR: ... indicates that the IOC file in question does not adhere to thesyntax and conditions required to validate and parse IOC files. To solve the issue,follow the IOC schemas and related instructions available in http://OpenIOC.org/.

Performing an Investigation
3-35
Troubleshooting Invalid YARA Rules
Procedure
1. On the Endpoint Sensor server, open a command prompt (cmd.exe) and navigateto the <Trend Micro Endpoint Sensor server installation path>\CmdTool\YARA folder.
2. Issue the following command:
$...\CmdTool\YARA>yara –m <YARA_file>
<YARA_file> corresponds to full file name of the YARA file in question.
Note
For additional command line options, refer to the YARA documentation online:
http://yara.readthedocs.org/en/latest/commandline.html
The following output appears:
$:\...\CmdTool\YARA>yara –m c:\invalid.yarac:\invalid.yara(6): error: untermindated stringc:\invalid.yara(6): error: syntax error, unexpected $end, expecting _REGEXP_
The error: ... results indicate that the YARA file in question does not adhere to thesyntax required to validate and parse YARA files. To solve the issue, follow theinstructions available from http://plusvic.github.io/yara/.
Troubleshooting Server Database Size
The Endpoint Sensor server uses a database to store its records. By default, the databasegrows in size as it records more information. However, the database may be configuredto limit itself to a fixed size. To change the server database size, perform the followingprocedure:
Endpoint Sensor 1.6 Update 4 Administrator's Guide
3-36
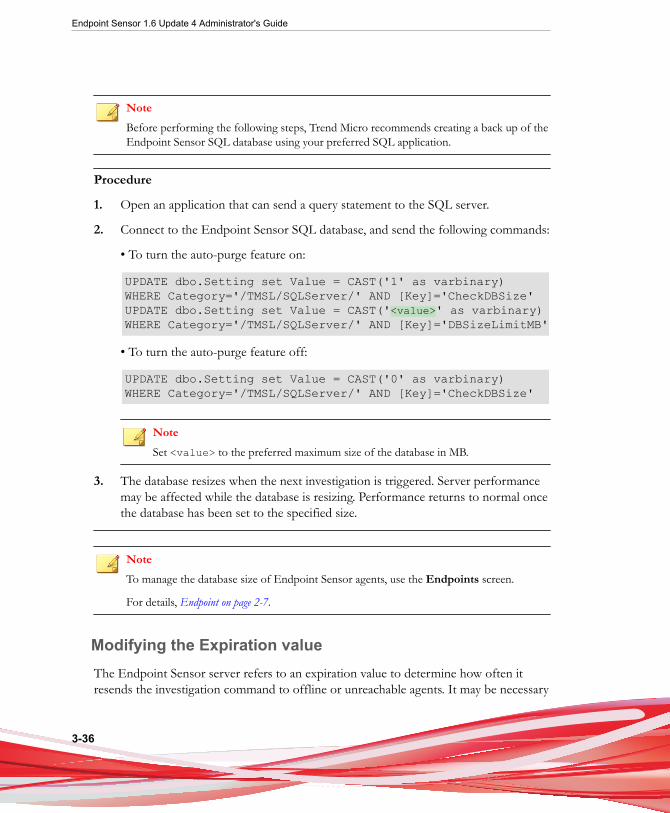
NoteBefore performing the following steps, Trend Micro recommends creating a back up of theEndpoint Sensor SQL database using your preferred SQL application.
Procedure
1. Open an application that can send a query statement to the SQL server.
2. Connect to the Endpoint Sensor SQL database, and send the following commands:
• To turn the auto-purge feature on:
UPDATE dbo.Setting set Value = CAST('1' as varbinary) WHERE Category='/TMSL/SQLServer/' AND [Key]='CheckDBSize'UPDATE dbo.Setting set Value = CAST('<value>' as varbinary) WHERE Category='/TMSL/SQLServer/' AND [Key]='DBSizeLimitMB'
• To turn the auto-purge feature off:
UPDATE dbo.Setting set Value = CAST('0' as varbinary) WHERE Category='/TMSL/SQLServer/' AND [Key]='CheckDBSize'
NoteSet <value> to the preferred maximum size of the database in MB.
3. The database resizes when the next investigation is triggered. Server performancemay be affected while the database is resizing. Performance returns to normal oncethe database has been set to the specified size.
NoteTo manage the database size of Endpoint Sensor agents, use the Endpoints screen.
For details, Endpoint on page 2-7.
Modifying the Expiration valueThe Endpoint Sensor server refers to an expiration value to determine how often itresends the investigation command to offline or unreachable agents. It may be necessary
Performing an Investigation
3-37
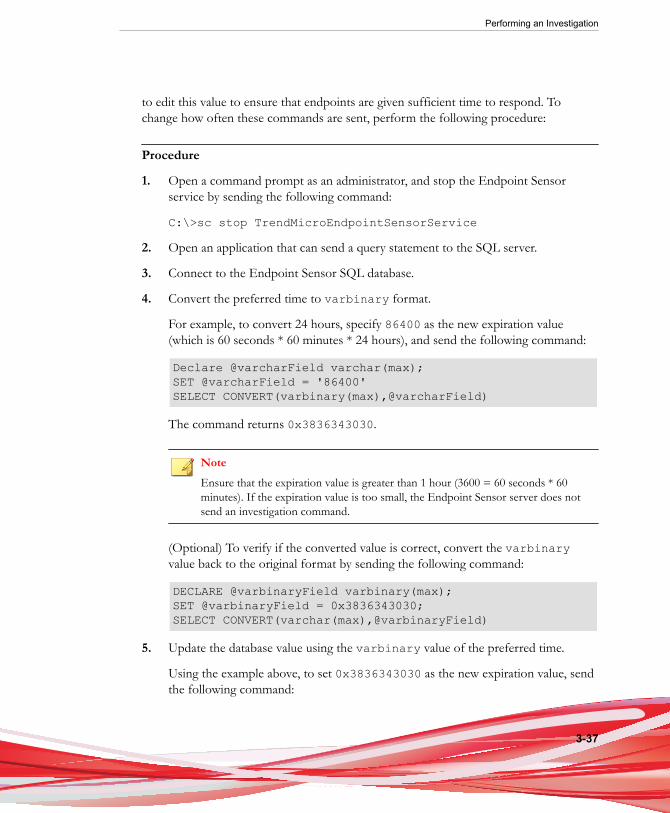
to edit this value to ensure that endpoints are given sufficient time to respond. Tochange how often these commands are sent, perform the following procedure:
Procedure
1. Open a command prompt as an administrator, and stop the Endpoint Sensorservice by sending the following command:
C:\>sc stop TrendMicroEndpointSensorService
2. Open an application that can send a query statement to the SQL server.
3. Connect to the Endpoint Sensor SQL database.
4. Convert the preferred time to varbinary format.
For example, to convert 24 hours, specify 86400 as the new expiration value(which is 60 seconds * 60 minutes * 24 hours), and send the following command:
Declare @varcharField varchar(max);SET @varcharField = '86400'SELECT CONVERT(varbinary(max),@varcharField)
The command returns 0x3836343030.
NoteEnsure that the expiration value is greater than 1 hour (3600 = 60 seconds * 60minutes). If the expiration value is too small, the Endpoint Sensor server does notsend an investigation command.
(Optional) To verify if the converted value is correct, convert the varbinaryvalue back to the original format by sending the following command:
DECLARE @varbinaryField varbinary(max);SET @varbinaryField = 0x3836343030;SELECT CONVERT(varchar(max),@varbinaryField)
5. Update the database value using the varbinary value of the preferred time.
Using the example above, to set 0x3836343030 as the new expiration value, sendthe following command:
Endpoint Sensor 1.6 Update 4 Administrator's Guide
3-38
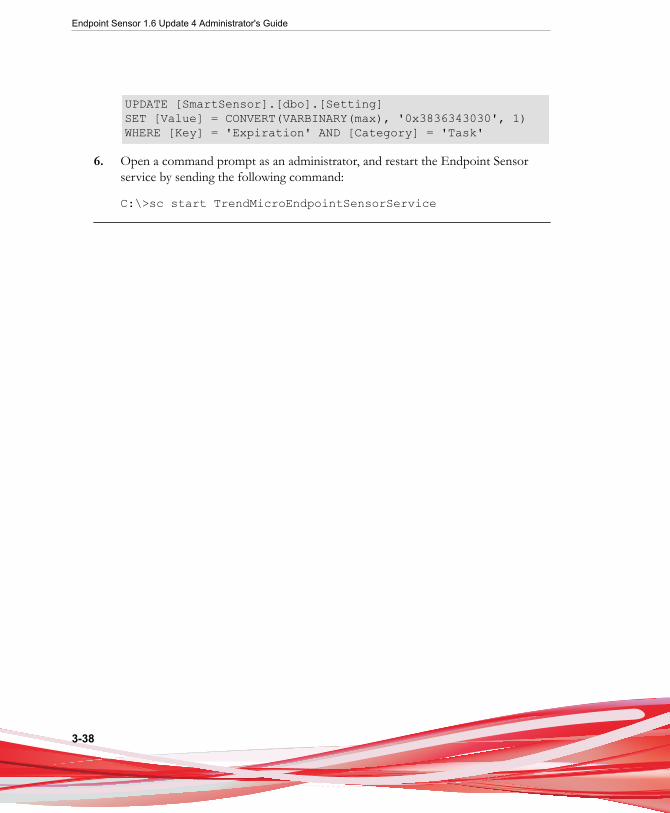
UPDATE [SmartSensor].[dbo].[Setting]SET [Value] = CONVERT(VARBINARY(max), '0x3836343030', 1)WHERE [Key] = 'Expiration' AND [Category] = 'Task'
6. Open a command prompt as an administrator, and restart the Endpoint Sensorservice by sending the following command:
C:\>sc start TrendMicroEndpointSensorService
4-1
Chapter 4
Monitoring FilesThis section provides information on how to use Endpoint Sensor to monitorendpoints for suspicious files.
Topics include:
• Monitoring on page 4-2
• Submitted for Analysis on page 4-7
• Monitoring Log on page 4-10
• Purging Monitoring Tables on page 4-13
Endpoint Sensor 1.6 Update 4 Administrator's Guide
4-2
MonitoringTo protect against attacks, Endpoint Sensor can monitor each endpoint for specific filesthrough the use of monitoring rules. Monitoring rules follow the same IOC format usedin investigations. Administrators can define and upload monitoring rules customized totheir needs. Endpoint Sensor also comes with a preloaded IOC rule provided by TrendMicro which automatically updates to ensure protection against the latest threats.
Once a monitored file is found, Endpoint Sensor can either collect the file in a specificlocation, or send the file to Deep Discovery Analyzer for further analysis.
For details, see Deep Discovery Analyzer Integration on page 4-7.
The Monitoring menu contains the following options to configure the monitoringbehavior:
• Monitoring Settings: Use this screen to manage monitoring rules. Monitoringrules use the IOC format.
• Submitted for Analysis: Use this screen to view the analysis results of files sent toDeep Discovery Analyzer.
• Monitoring Log: Use this screen to view all collected files.
Monitoring is disabled by default. To start monitoring, go to Monitoring >Monitoring Settings and perform the following steps:
Procedure
1. Select Enable monitoring and submission to enable the monitoring andcollection of files.
2. Upload a customized IOC file to add specific files to monitor. By default, TrendMicro Endpoint Sensor uses the provided IOC file from Trend Micro.
For details, see Monitoring Rules on page 4-3.
3. Configure monitoring settings.
For details, see Submission Settings on page 4-5.
Monitoring Files
4-3
4. Click Save to start monitoring.
5. Review the following screens to view monitoring results.
• Submitted for Analysis shows the analysis results of the files sent to DeepDiscovery Analyzer
For details, see Submitted for Analysis on page 4-7.
• Monitoring Log shows details of all files collected by Trend Micro EndpointSensor.
For details, see Monitoring Log on page 4-10.
Monitoring Rules
Use the Monitoring Rules tab to view and manage monitoring rules. Monitoring rulescome from the following sources:
• Trend Micro
Displays monitoring rules provided by Trend Micro. The following table lists all thedetails available for review:
Table 4-1. Trend Micro monitoring rules
Column name Description
Rule Name Name of the rule
Version Version information for the rule
Latest Update Date and time when the rule was uploaded
Action Commands available to interact with the rule
• User defined
Shows all the custom monitoring rules uploaded by the user. The following tablelists all the details available for review:
Endpoint Sensor 1.6 Update 4 Administrator's Guide
4-4
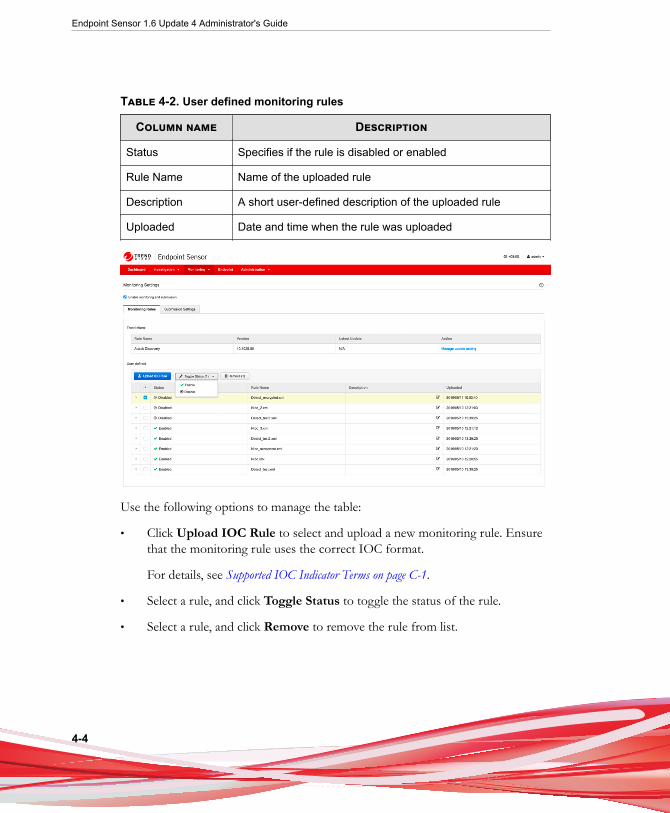
Table 4-2. User defined monitoring rules
Column name Description
Status Specifies if the rule is disabled or enabled
Rule Name Name of the uploaded rule
Description A short user-defined description of the uploaded rule
Uploaded Date and time when the rule was uploaded
Use the following options to manage the table:
• Click Upload IOC Rule to select and upload a new monitoring rule. Ensurethat the monitoring rule uses the correct IOC format.
For details, see Supported IOC Indicator Terms on page C-1.
• Select a rule, and click Toggle Status to toggle the status of the rule.
• Select a rule, and click Remove to remove the rule from list.
Monitoring Files
4-5
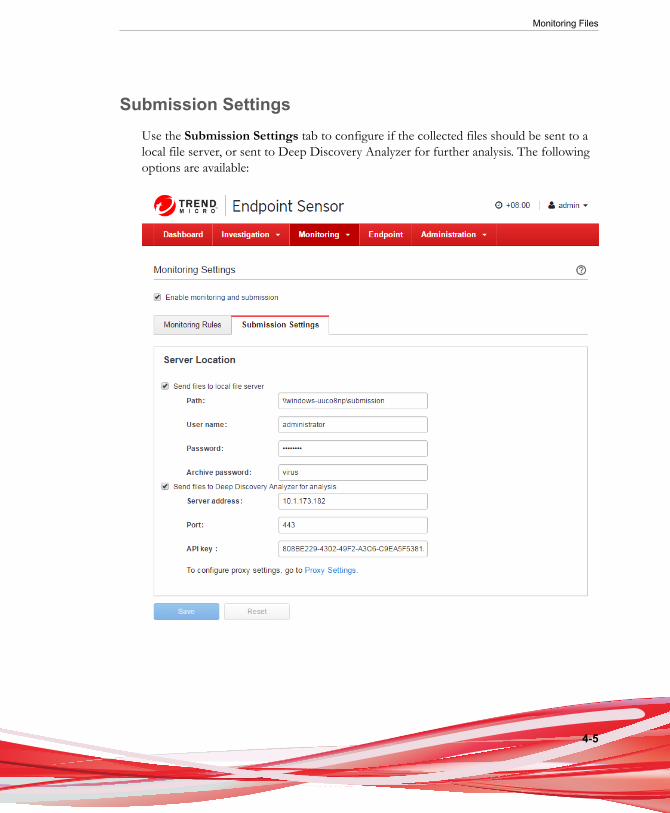
Submission SettingsUse the Submission Settings tab to configure if the collected files should be sent to alocal file server, or sent to Deep Discovery Analyzer for further analysis. The followingoptions are available:
Endpoint Sensor 1.6 Update 4 Administrator's Guide
4-6
Table 4-3. Destination
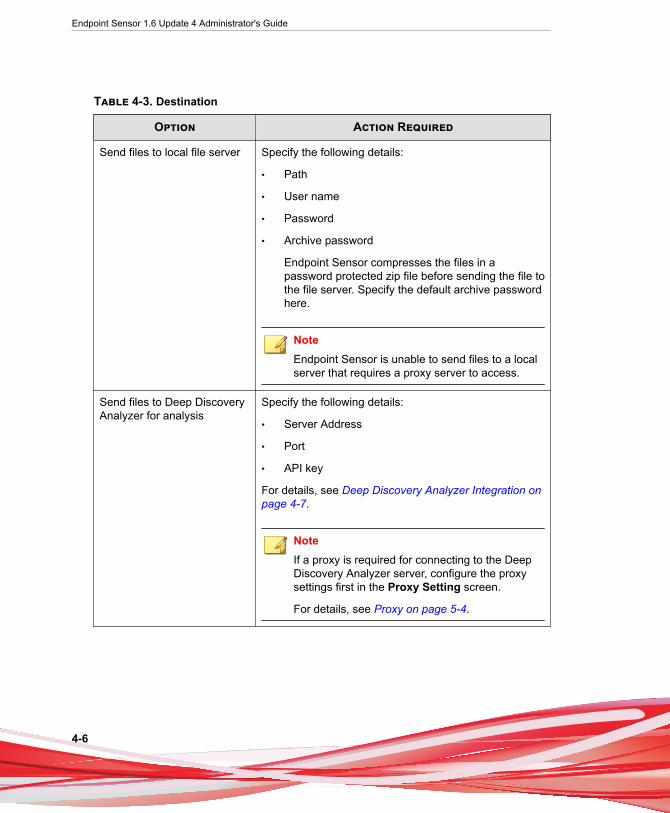
Option Action Required
Send files to local file server Specify the following details:
• Path
• User name
• Password
• Archive password
Endpoint Sensor compresses the files in apassword protected zip file before sending the file tothe file server. Specify the default archive passwordhere.
NoteEndpoint Sensor is unable to send files to a localserver that requires a proxy server to access.
Send files to Deep DiscoveryAnalyzer for analysis
Specify the following details:
• Server Address
• Port
• API key
For details, see Deep Discovery Analyzer Integration onpage 4-7.
NoteIf a proxy is required for connecting to the DeepDiscovery Analyzer server, configure the proxysettings first in the Proxy Setting screen.
For details, see Proxy on page 5-4.
Monitoring Files
4-7
Deep Discovery Analyzer Integration
For integration, obtain the following information from a Deep Discovery Analyzerserver installed on the same network:
• API key. This is available on the Deep Discovery Analyzer management console, inHelp > About.
• Deep Discovery Analyzer IP address. If unsure of the IP address, check the URLused to access the Deep Discovery Analyzer management console. The IP addressis part of the URL.
• Deep Discovery Analyzer SSL port 443.
Note
• Endpoint Sensor supports integration with Deep Discovery Analyzer 5.1 and later.
• If the Deep Discovery Analyzer API key changes after integration, clear the old DeepDiscovery Analyzer settings from Endpoint Sensor before specifying a new API key.
• Since the Endpoint Sensor agents send the samples directly to Deep DiscoveryAnalyzer server, ensure that the Endpoint Sensor agents have network access to theDeep Discovery Analyzer server to be integrated.
For details, refer to the documentation available at:
http://docs.trendmicro.com/en-us/enterprise/deep-discovery-analyzer.aspx
Submitted for AnalysisOnce Endpoint Sensor finds a file matching the attributes defined in the monitoringrule, it uploads the file to a local server, or sends the file to Deep Discovery Analyzer.Use the Submitted for Analysis screen to view all collected files submitted to DeepDiscovery Analyzer. The following table lists all the details available for review:
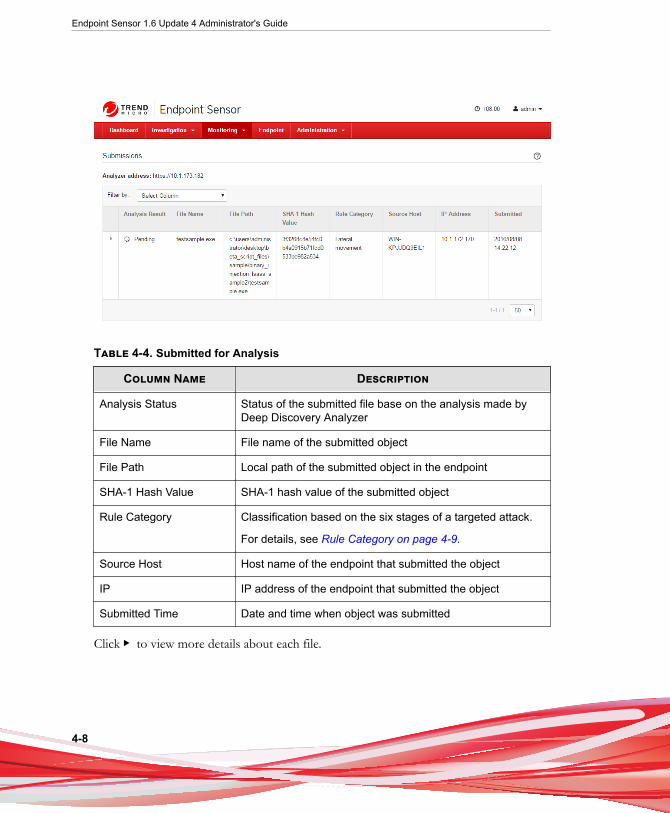
Endpoint Sensor 1.6 Update 4 Administrator's Guide
4-8
Table 4-4. Submitted for Analysis
Column Name Description
Analysis Status Status of the submitted file base on the analysis made byDeep Discovery Analyzer
File Name File name of the submitted object
File Path Local path of the submitted object in the endpoint
SHA-1 Hash Value SHA-1 hash value of the submitted object
Rule Category Classification based on the six stages of a targeted attack.
For details, see Rule Category on page 4-9.
Source Host Host name of the endpoint that submitted the object
IP IP address of the endpoint that submitted the object
Submitted Time Date and time when object was submitted
Click ▶ to view more details about each file.
Monitoring Files
4-9
Rule CategoryEndpoint Sensor classifies the analyzed files based on the object's behavior and origin.
Table 4-5. Rule Categories
Stage Behavior Description
Intelligencegathering
Performs extensive research using readily available publicinformation, network scanning tools, social media, and othersources to identify promising points of entry, and uncover thestructure of existing defenses
Point of entry Uses tactics and techniques used to gain entry to a network,including but not limited to:
• Sending emails with a malicious file attachment, or a link to amalicious URL
• Compromising a legitimate web site to download malware
• Directly hacking the target system
• Penetrating a partner’s network and hitching a ride into yoursvia normal communication
• Using unsecured or third-party networks (hotel, coffee shop,airport, etc.)
• Delivering attack code via a USB or other removable storagemedia
Command-and-control (C&C)
Initiates communication with a C&C server to deliver information,receive instructions, and download other malware. This allowsattackers to actively respond to security efforts, or to newinformation about the network. C&C traffic can occur to/from atrusted IP address or a malicious host, using various communicationand encryption protocols.
Lateral movement Identifies other assets within the network that it can use to movefrom system to system. These search for directories, email, andadministration servers to map the internal structure of the networkand obtain credentials to access these systems.

Endpoint Sensor 1.6 Update 4 Administrator's Guide
4-10
Stage Behavior Description
Asset/datadiscovery
Locates the specific servers and services that contain the mostvaluable data by scanning selected ports, monitoring internal traffic,etc.
Data exfiltration Copies data for extraction and monetization, through the use ofencryption, compression, and other techniques to disguise theactivity. Data is transmitted to external locations, where it will be putup for sale on the black market.
Attack accomplice Runs functions that assist in the routines of other malware involvedin the attack.
User defined Files specified by the user through user-defined IOC files.
The classification is based mainly on the six stages of a targeted attack.
For details, refer to the documentation available at:
http://www.trendmicro.com/us/enterprise/challenges/advance-targeted-attacks/#what-happens-during-an-attack.
Monitoring LogUse the Monitoring Logs screen to view all files collected by the monitoring process.
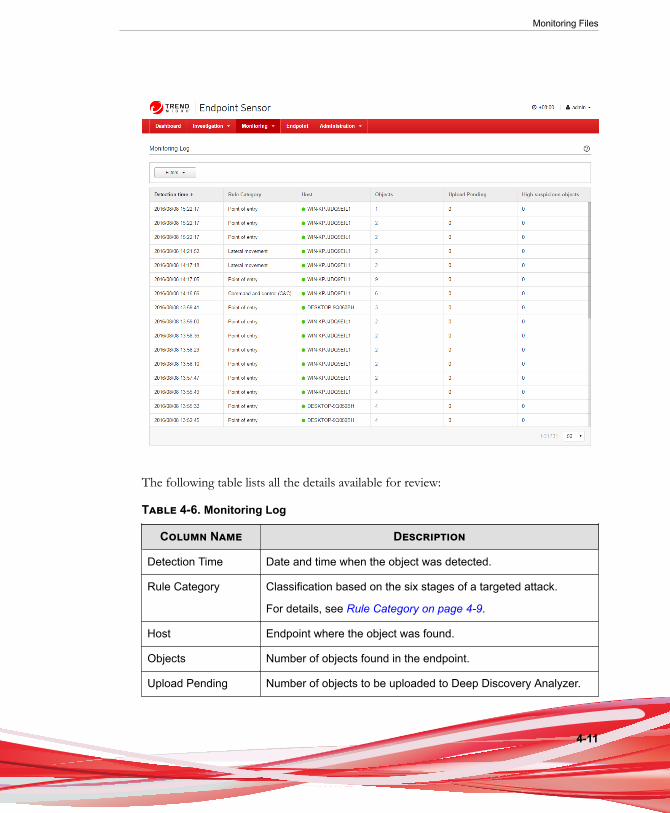
Monitoring Files
4-11
The following table lists all the details available for review:
Table 4-6. Monitoring Log
Column Name Description
Detection Time Date and time when the object was detected.
Rule Category Classification based on the six stages of a targeted attack.
For details, see Rule Category on page 4-9.
Host Endpoint where the object was found.
Objects Number of objects found in the endpoint.
Upload Pending Number of objects to be uploaded to Deep Discovery Analyzer.
Endpoint Sensor 1.6 Update 4 Administrator's Guide
4-12
Column Name Description
High SuspiciousObjects
Number of objects classified as highly suspicious by DeepDiscovery Analyzer.
Use Filters to filter this list by Detection, Host, Objects, Category and Risk Level.
To view more details about a collected object, click the value in the Objects, UploadPending or High Suspicious Objects column to open the Object List screen. Thisscreen contains the following details for review:
Table 4-7. Object List
Column Description
Object Name Name of the object collected.
Object Type Type of the object collected.
Analysis Result Severity level based on the analysis by Deep Discovery Analyzer
File Path Local path which specifies the location of the object in theendpoint
Upload Location Uniform Naming Convention (UNC) path which specifies thelocation of the server where the object was sent.
Detection Time Date and time when the object was detected.
Signer Name Name of the signer, if the object was signed
Use the following options to manage the list:
• The list can be filtered by Upload Status and Analysis Result.
• Click Upload Location path to copy the UNC location to the clipboard.
NoteThe UNC path is given using the Windows format. It may be necessary to modify thepath to use the copied string in a different operating system.

Monitoring Files
4-13
Purging Monitoring TablesIt may be necessary to purge the Submitted for Analysis and Monitoring Log tablesto improve server performance. To purge the Submitted for Analysis and MonitoringLog tables, perform the following procedure:
Procedure
1. Install SQL Server Management Studio.
2. Open SQL Server Management Studio, locate and connect to the EndpointSensor database SMARTSENSOR.
3. Open Programmability > Stored Procedures.
4. Locate and right-click the following items. For each item, click Execute StoredProcedure.... On the screen that appears, update the values according to yourpreference.
Stored Procedure Description
dbo.SP_IRB_DeleteInspectedReportByDay Stored procedure purgesreports n days before today.
dbo.SP_IRB_DeleteInspectedReportByNumber Stored procedure purges noldest reports.
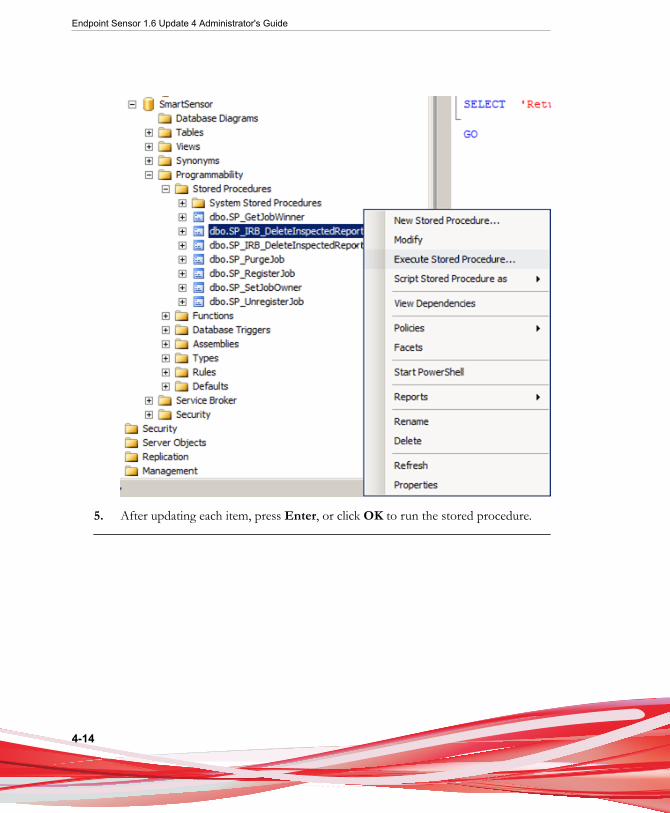
Endpoint Sensor 1.6 Update 4 Administrator's Guide
4-14
5. After updating each item, press Enter, or click OK to run the stored procedure.
5-1
Chapter 5
Managing Trend Micro EndpointSensor
This section describes how to perform administrative tasks to configure EndpointSensor .
Topics include:
• Updates on page 5-2
• Proxy on page 5-4
• Management Console on page 5-5
• Accounts on page 5-6
• About on page 5-8
• License on page 5-9
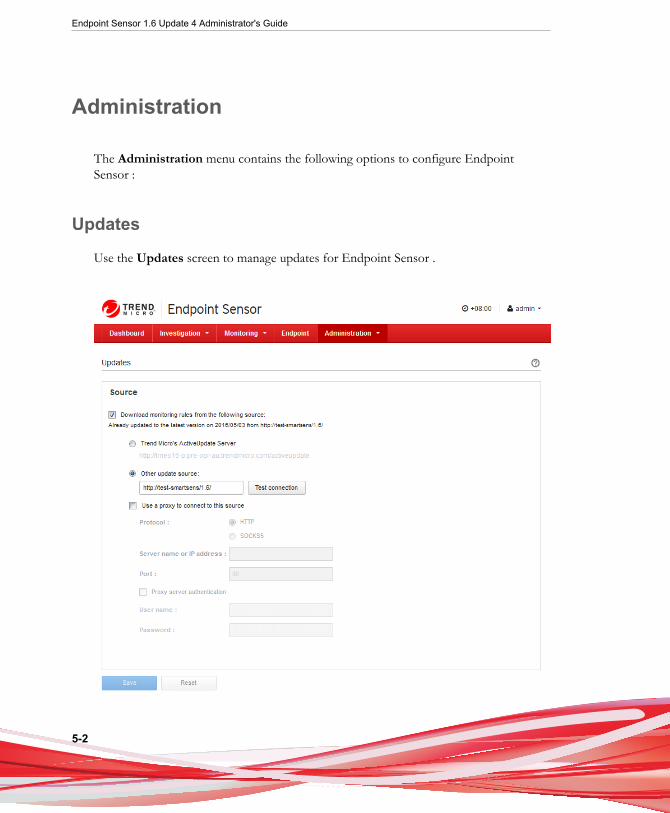
Endpoint Sensor 1.6 Update 4 Administrator's Guide
5-2
Administration
The Administration menu contains the following options to configure EndpointSensor :
Updates
Use the Updates screen to manage updates for Endpoint Sensor .
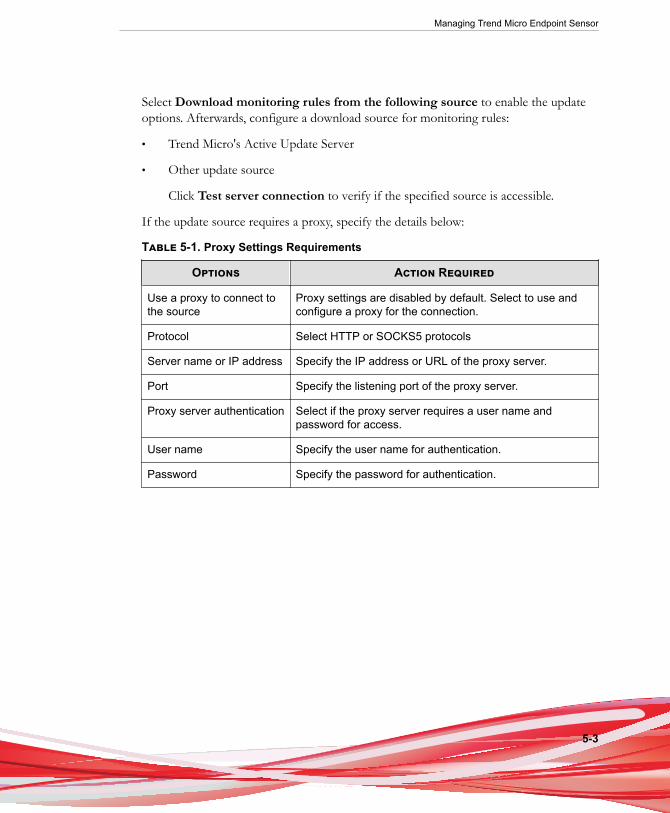
Managing Trend Micro Endpoint Sensor
5-3
Select Download monitoring rules from the following source to enable the updateoptions. Afterwards, configure a download source for monitoring rules:
• Trend Micro's Active Update Server
• Other update source
Click Test server connection to verify if the specified source is accessible.
If the update source requires a proxy, specify the details below:
Table 5-1. Proxy Settings Requirements
Options Action Required
Use a proxy to connect tothe source
Proxy settings are disabled by default. Select to use andconfigure a proxy for the connection.
Protocol Select HTTP or SOCKS5 protocols
Server name or IP address Specify the IP address or URL of the proxy server.
Port Specify the listening port of the proxy server.
Proxy server authentication Select if the proxy server requires a user name andpassword for access.
User name Specify the user name for authentication.
Password Specify the password for authentication.
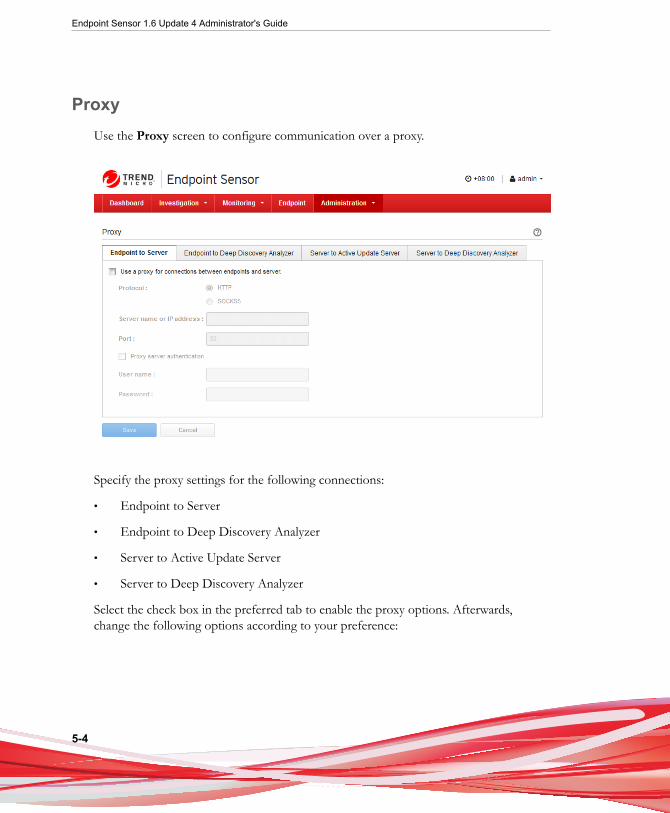
Endpoint Sensor 1.6 Update 4 Administrator's Guide
5-4
ProxyUse the Proxy screen to configure communication over a proxy.
Specify the proxy settings for the following connections:
• Endpoint to Server
• Endpoint to Deep Discovery Analyzer
• Server to Active Update Server
• Server to Deep Discovery Analyzer
Select the check box in the preferred tab to enable the proxy options. Afterwards,change the following options according to your preference:

Managing Trend Micro Endpoint Sensor
5-5
Table 5-2. Proxy Requirements
Options Action Required
Protocol Select HTTP or SOCKS5 protocols
Server name or IP address Specify the IP address or URL of the proxy server.
Port Specify the listening port of the proxy server.
Proxy server authentication Select if the proxy server requires a user name andpassword for access.
User name Specify the user name for authentication.
Password Specify the password for authentication.
NoteThe Endpoint Sensor management console sets the proxy settings for new agents only. Tochange the proxy settings of existing agents, contact Trend Micro support.
Management ConsoleUse the Management Console screen to configure settings for Endpoint Sensor .
Change the following options according to your preference:
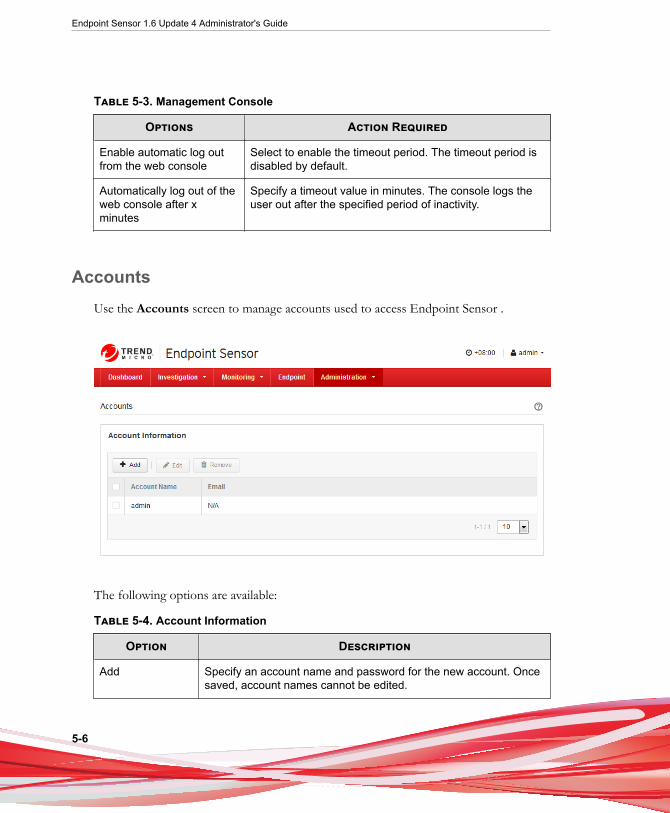
Endpoint Sensor 1.6 Update 4 Administrator's Guide
5-6
Table 5-3. Management Console
Options Action Required
Enable automatic log outfrom the web console
Select to enable the timeout period. The timeout period isdisabled by default.
Automatically log out of theweb console after xminutes
Specify a timeout value in minutes. The console logs theuser out after the specified period of inactivity.
AccountsUse the Accounts screen to manage accounts used to access Endpoint Sensor .
The following options are available:
Table 5-4. Account Information
Option Description
Add Specify an account name and password for the new account. Oncesaved, account names cannot be edited.
Managing Trend Micro Endpoint Sensor
5-7
Option Description
Edit Edits the password for the selected account. Account names cannotbe edited. Select at least one account to activate this option.
Remove Removes the selected account from the list. Select at least oneaccount to activate this option.
Endpoint Sensor uses the following criteria to check the password strength:
• The password is 8 to 64 characters long
• The password contains:
• at least one number
• at least one lower-case character
• at least one upper-case character
• at least one symbol character
• The password does not contain any of these unsupported symbols: |><\" orspace
TipFollow the guidelines below to select a secure password:
• Use a long password. Trend Micro recommends using a password of at least 10characters, but longer passwords are preferred.
• Avoid names or words in dictionaries.
• Use a combination of mixed-case letters, numbers, and other characters.
• Avoid simple patterns such as “101010” or “abcde.”
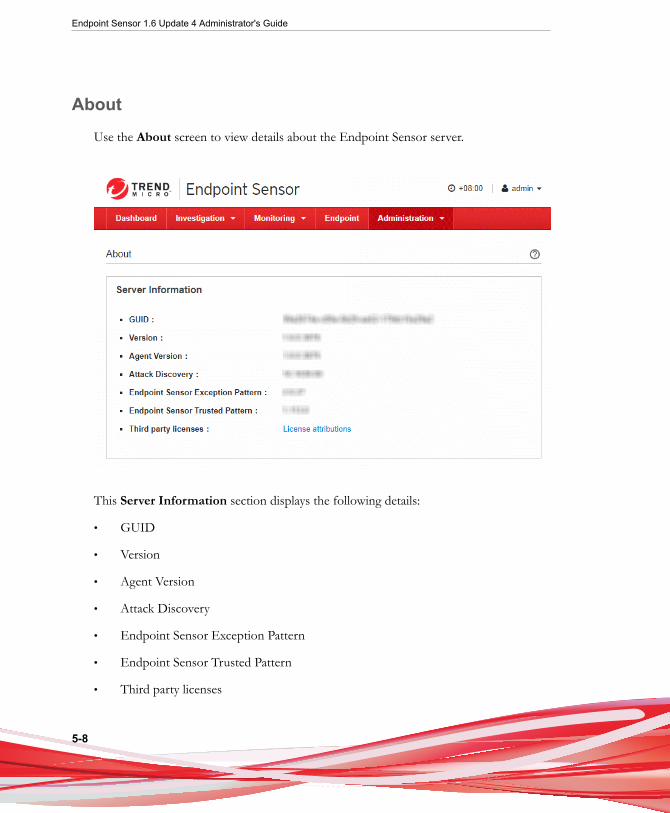
Endpoint Sensor 1.6 Update 4 Administrator's Guide
5-8
AboutUse the About screen to view details about the Endpoint Sensor server.
This Server Information section displays the following details:
• GUID
• Version
• Agent Version
• Attack Discovery
• Endpoint Sensor Exception Pattern
• Endpoint Sensor Trusted Pattern
• Third party licenses
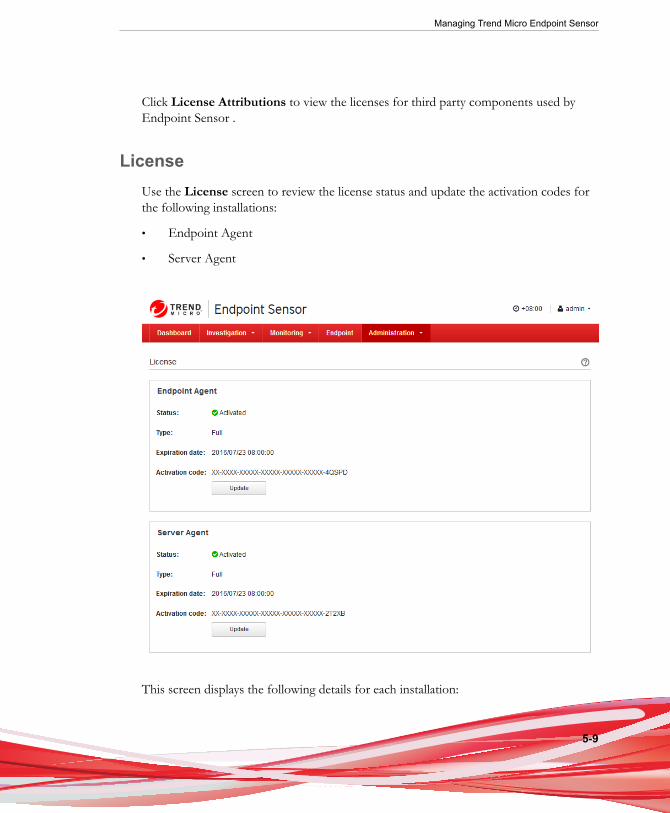
Managing Trend Micro Endpoint Sensor
5-9
Click License Attributions to view the licenses for third party components used byEndpoint Sensor .
LicenseUse the License screen to review the license status and update the activation codes forthe following installations:
• Endpoint Agent
• Server Agent
This screen displays the following details for each installation:

Endpoint Sensor 1.6 Update 4 Administrator's Guide
5-10
Table 5-5. License Details
Detail Description
Activation Code Displays the Activation Code of the product. Click Update totype a new Activation Code.
Status Displays the status of the Activation Code. Status may be anyof the following values:
• Grace period
• Activated
• Not activated
• Near expiry date
• Expired
Type Displays the type of Activation Code. Type may be any of thefollowing values:
• Full
• Invalid
Expiration date Displays the date when the Activation Code will expire.
NoteContact your Trend Micro representative if any of the following conditions are true:
• The Status of the Activation Code is displayed as Near expiry date, Grace Periodor Expired.
• The Type of the Activation Code is displayed as Invalid.
• The Expiration date of the Activation Code has already passed.

6-1
Chapter 6
Technical SupportLearn about the following topics:
• Troubleshooting Resources on page 6-2
• Contacting Trend Micro on page 6-3
• Sending Suspicious Content to Trend Micro on page 6-4
• Other Resources on page 6-5
Endpoint Sensor 1.6 Update 4 Administrator's Guide
6-2
Troubleshooting ResourcesBefore contacting technical support, consider visiting the following Trend Micro onlineresources.
Using the Support PortalThe Trend Micro Support Portal is a 24x7 online resource that contains the most up-to-date information about both common and unusual problems.
Procedure
1. Go to http://esupport.trendmicro.com.
2. Select from the available products or click the appropriate button to search forsolutions.
3. Use the Search Support box to search for available solutions.
4. If no solution is found, click Contact Support and select the type of supportneeded.
Tip
To submit a support case online, visit the following URL:
http://esupport.trendmicro.com/srf/SRFMain.aspx
A Trend Micro support engineer investigates the case and responds in 24 hours orless.
Threat EncyclopediaMost malware today consists of blended threats, which combine two or moretechnologies, to bypass computer security protocols. Trend Micro combats this complexmalware with products that create a custom defense strategy. The Threat Encyclopedia
Technical Support
6-3
provides a comprehensive list of names and symptoms for various blended threats,including known malware, spam, malicious URLs, and known vulnerabilities.
Go to http://about-threats.trendmicro.com/us/threatencyclopedia#malware to learnmore about:
• Malware and malicious mobile code currently active or "in the wild"
• Correlated threat information pages to form a complete web attack story
• Internet threat advisories about targeted attacks and security threats
• Web attack and online trend information
• Weekly malware reports
Contacting Trend MicroIn the United States, Trend Micro representatives are available by phone or email:
Address Trend Micro, Incorporated
225 E. John Carpenter Freeway, Suite 1500
Irving, Texas 75062 U.S.A.
Phone Phone: +1 (817) 569-8900
Toll-free: (888) 762-8736
Website http://www.trendmicro.com
Email address [email protected]
• Worldwide support offices:
http://www.trendmicro.com/us/about-us/contact/index.html
• Trend Micro product documentation:
http://docs.trendmicro.com
Endpoint Sensor 1.6 Update 4 Administrator's Guide
6-4
Speeding Up the Support Call
To improve problem resolution, have the following information available:
• Steps to reproduce the problem
• Appliance or network information
• Computer brand, model, and any additional connected hardware or devices
• Amount of memory and free hard disk space
• Operating system and service pack version
• Version of the installed agent
• Serial number or Activation Code
• Detailed description of install environment
• Exact text of any error message received
Sending Suspicious Content to Trend MicroSeveral options are available for sending suspicious content to Trend Micro for furtheranalysis.
Email Reputation Services
Query the reputation of a specific IP address and nominate a message transfer agent forinclusion in the global approved list:
https://ers.trendmicro.com/
Refer to the following Knowledge Base entry to send message samples to Trend Micro:
http://esupport.trendmicro.com/solution/en-US/1112106.aspx
Technical Support
6-5
File Reputation Services
Gather system information and submit suspicious file content to Trend Micro:
http://esupport.trendmicro.com/solution/en-us/1059565.aspx
Record the case number for tracking purposes.
Web Reputation Services
Query the safety rating and content type of a URL suspected of being a phishing site, orother so-called "disease vector" (the intentional source of Internet threats such asspyware and malware):
http://global.sitesafety.trendmicro.com/
If the assigned rating is incorrect, send a re-classification request to Trend Micro.
Other ResourcesIn addition to solutions and support, there are many other helpful resources availableonline to stay up to date, learn about innovations, and be aware of the latest securitytrends.
Download Center
From time to time, Trend Micro may release a patch for a reported known issue or anupgrade that applies to a specific product or service. To find out whether any patchesare available, go to:
http://www.trendmicro.com/download/
If a patch has not been applied (patches are dated), open the Readme file to determinewhether it is relevant to your environment. The Readme file also contains installationinstructions.
Endpoint Sensor 1.6 Update 4 Administrator's Guide
6-6
Documentation FeedbackTrend Micro always seeks to improve its documentation. If you have questions,comments, or suggestions about this or any Trend Micro document, please go to thefollowing site:
http://www.trendmicro.com/download/documentation/rating.asp

AppendicesAppendix

A-1
Appendix A
OfficeScan IntegrationThe following content explains how to use the Trend Micro Endpoint SensorDeployment Tool OfficeScan plug-in to deploy Endpoint Sensor across an enterprisewith endpoints managed by OfficeScan.
Topics include:
• About Trend Micro OfficeScan Integration on page A-2
• About Plug-in Manager on page A-2
• Installing OfficeScan on page A-3
• Agent Installation Considerations When Using OfficeScan on page A-4
• Using the Trend Micro Endpoint Sensor Deployment Tool on page A-4
• Trend Micro Endpoint Sensor Agent Deployment Tasks on page A-11
• The OfficeScan Agent Tree on page A-14
Endpoint Sensor 1.6 Update 4 Administrator's Guide
A-2
About Trend Micro OfficeScan IntegrationOfficeScan protects enterprise networks from malware, network viruses, web-basedthreats, spyware, and mixed threat attacks. An integrated solution, OfficeScan consists ofan agent that resides at the endpoint and a server program that manages all agents.
The agent guards the endpoint and reports its security status to the server. The server,through the web-based management console, makes it easy to set coordinated securitypolicies and deploy updates to every agent.
NoteFor information about OfficeScan, see the supporting documentation at:
http://docs.trendmicro.com/en-us/enterprise/officescan.aspx
Use the OfficeScan Trend Micro Endpoint Sensor Deployment Tool plug-in to deployEndpoint Sensor agents to OfficeScan managed endpoints. You can select endpointsbased on specific criteria and see the status of the deployment.
After the Trend Micro Endpoint Sensor Deployment Tool plug-in deploys the EndpointSensor agent software, the Endpoint Sensor agent synchronizes to the Endpoint Sensorserver specified in the plug-in. OfficeScan does not manage Endpoint Sensor agents orperform investigations. The OfficeScan agent and the Endpoint Sensor agent areindependent on the same endpoint.
About Plug-in ManagerOfficeScan includes a framework called Plug-in Manager that integrates new solutionsinto the existing OfficeScan environment. To help ease the management of thesesolutions, Plug-in Manager provides at-a-glance data for the solutions in the form ofwidgets.
NoteNone of the plug-in solutions currently support IPv6. The server can download thesesolutions but is not able to deploy the solutions to pure IPv6 Trend Micro EndpointSensor agents or pure IPv6 hosts.

OfficeScan Integration
A-3
Plug-in Manager delivers the following:
• Native Product Features
Some native OfficeScan features are licensed separately and activated through Plug-in Manager. In this release, two features fall under this category, namely, TrendMicro Virtual Desktop Support and OfficeScan Data Protection.
• Plug-in programs
Plug-in programs are not part of the OfficeScan program. The plug-in programshave separate licenses and management consoles. Access the management consolesfrom within the OfficeScan web console. Examples of plug-in programs are TrendMicro OfficeScan ToolBox and Trend Micro Security (for Mac).
• Dashboard tabs and widgets
The OfficeScan Summary screen requires Plug-in Manager to display the tabs andwidgets used to monitor the OfficeScan server and agent protection status.
This document provides a general overview of plug-in program installation andmanagement and discusses plug-in program data available in widgets. Refer to specificplug-in program documentation for details on configuring and managing the program.
Installing OfficeScanFor information about installing and configuring OfficeScan, see the documentationavailable at:
http://docs.trendmicro.com/en-us/enterprise/officescan.aspx
For information on how to prepare the OfficeScan Trend Micro Endpoint SensorDeployment Tool before deploying agents, see the Endpoint Sensor Installation andMigration Guide.
Endpoint Sensor 1.6 Update 4 Administrator's Guide
A-4
Agent Installation Considerations When UsingOfficeScan
When using OfficeScan to install the Endpoint Sensor agent, check that yourenvironment meets the following criteria:
• The server must have one of the following versions of OfficeScan installed:
• OfficeScan version 10.6
• OfficeScan version 10.6 Service Pack 1
• OfficeScan version 10.6 Service Pack 2
• OfficeScan version 10.6 Service Pack 3
• OfficeScan version 11
• OfficeScan version 11 Service Pack 1
• OfficeScan XG
• The server must have Microsoft Internet Explorer 9 or later installed.
• The OfficeScan installation must have Plug-in Manager installed.
• The OfficeScan installation must not be installed in an Apache HTTP Serverenvironment. Endpoint Sensor does not support Apache HTTP Serverenvironments.
Using the Trend Micro Endpoint SensorDeployment Tool
This section outlines how to configure OfficeScan in order to install or uninstall theTrend Micro Endpoint Sensor Deployment Tool.
Topics include:
• Trend Micro Endpoint Sensor Deployment Tool Installation on page A-5
OfficeScan Integration
A-5
• Plug-in Program Management on page A-6
• Trend Micro Endpoint Sensor Deployment Tool Uninstallation on page A-6
• Deployment Tool Error Codes on page A-7
Trend Micro Endpoint Sensor Deployment ToolInstallation
Plug-in programs display on the Plug-in Manager console. Use the console todownload, install, and manage the programs. Plug-in Manager downloads the installationpackage for the plug-in program from the Trend Micro ActiveUpdate server or from acustom update source, if one has been properly set up. An Internet connection isnecessary to download the package from the ActiveUpdate server.
When Plug-in Manager downloads an installation package or starts the installation, Plug-in Manager temporarily disables other plug-in program functions such as downloads,installations, and upgrades.
Plug-in Manager does not support plug-in program installation or management from theTrend Micro Control Manager single sign-on function.
Installing Trend Micro Endpoint Sensor Deployment Tool
Procedure
1. Open the OfficeScan web console and click Plug-in Manager in the main menu.
2. On the Plug-in Manager screen, go to the Endpoint Sensor plug-in section andclick Download.
The size of the plug-in program package displays beside the Download button.Plug-in Manager stores the downloaded package to <OSCE serverinstallation folder>\PCCSRV\Download\Product.
Monitor the progress or navigate away from the screen during the download.
3. Click Agree to install the plug-in program.
Endpoint Sensor 1.6 Update 4 Administrator's Guide
A-6
Monitor the progress or navigate away from the screen during the download.
After the installation, the current plug-in program version displays on the Plug-inManager screen.
Note
• If OfficeScan encounters problems downloading or installing the package, check theserver update logs on the OfficeScan web console. On the main menu, click Logs >Server Update.
• Trend Micro recommends using Internet Explorer 9 to access Trend Micro EndpointSensor Deployment Tool.
Plug-in Program ManagementConfigure settings and perform program-related tasks from the plug-in program’smanagement console, which is accessible from each OfficeScan web console. Tasksinclude activating the program and deploying the plug-in program agent to endpoints.Consult the documentation of the specific plug-in program for details on configuringand managing the program.
Managing Trend Micro Endpoint Sensor Deployment Tool
Procedure
1. Open the OfficeScan web console and click Plug-in Manager in the main menu.
2. On the Plug-in Manager screen, go to the plug-in program section and clickManage Program.
Trend Micro Endpoint Sensor Deployment ToolUninstallation
Uninstall a plug-in program in the following ways:
OfficeScan Integration
A-7
• Uninstall the OfficeScan server, which uninstalls Plug-in Manager and all installedplug-in programs. For instructions on uninstalling the OfficeScan server, see theOfficeScan Installation and Upgrade Guide.
• Uninstall the plug-in program from the Plug-in Manager console.
WARNING!
Uninstalling the Trend Micro Endpoint Sensor Deployment Tool automatically uninstallsall agents listed in the agent tree. To ensure that all agents uninstall properly, use the agenttree to uninstall all agents first before uninstalling the Trend Micro Endpoint SensorDeployment Tool.
For details, see Uninstalling the Trend Micro Endpoint Sensor Agent on page A-17.
Uninstalling Trend Micro Endpoint Sensor Deployment Toolfrom the Plug-in Manager Console
Procedure
1. Open the OfficeScan web console and click Plug-in Manager in the main menu.
2. On the Plug-in Manager screen, go to the plug-in program section and clickUninstall.
3. Refresh the Plug-in Manager screen after the uninstallation.
The plug-in program is available for reinstallation.
Deployment Tool Error Codes
The following error codes may appear while using the Trend Micro Endpoint SensorDeployment Tool. Use the following list for potential solutions to issues you mayencounter.
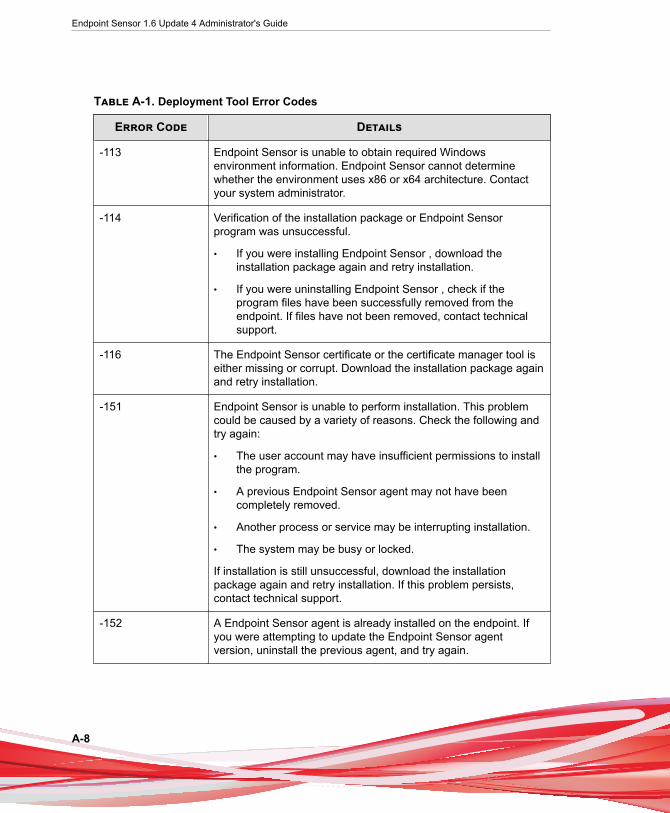
Endpoint Sensor 1.6 Update 4 Administrator's Guide
A-8
Table A-1. Deployment Tool Error Codes
Error Code Details
-113 Endpoint Sensor is unable to obtain required Windowsenvironment information. Endpoint Sensor cannot determinewhether the environment uses x86 or x64 architecture. Contactyour system administrator.
-114 Verification of the installation package or Endpoint Sensorprogram was unsuccessful.
• If you were installing Endpoint Sensor , download theinstallation package again and retry installation.
• If you were uninstalling Endpoint Sensor , check if theprogram files have been successfully removed from theendpoint. If files have not been removed, contact technicalsupport.
-116 The Endpoint Sensor certificate or the certificate manager tool iseither missing or corrupt. Download the installation package againand retry installation.
-151 Endpoint Sensor is unable to perform installation. This problemcould be caused by a variety of reasons. Check the following andtry again:
• The user account may have insufficient permissions to installthe program.
• A previous Endpoint Sensor agent may not have beencompletely removed.
• Another process or service may be interrupting installation.
• The system may be busy or locked.
If installation is still unsuccessful, download the installationpackage again and retry installation. If this problem persists,contact technical support.
-152 A Endpoint Sensor agent is already installed on the endpoint. Ifyou were attempting to update the Endpoint Sensor agentversion, uninstall the previous agent, and try again.
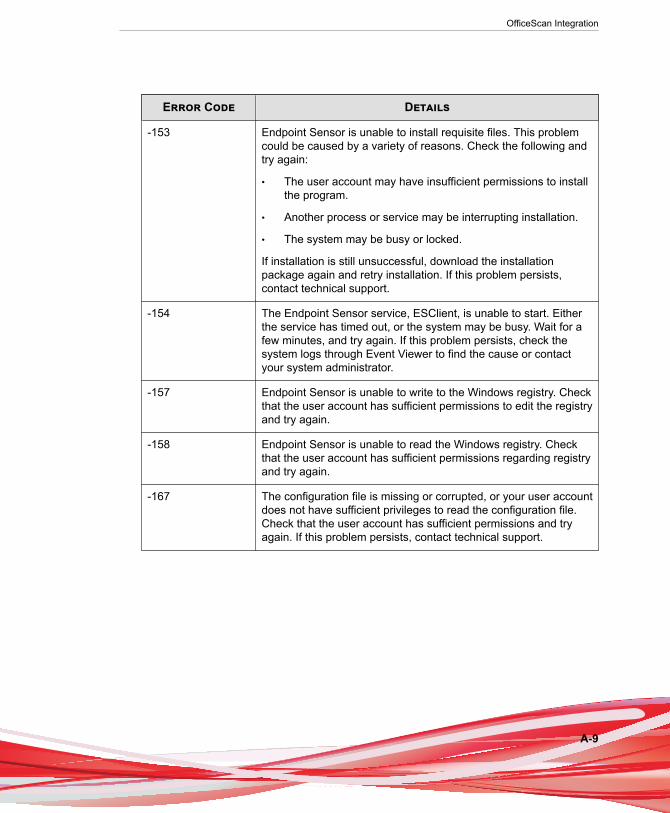
OfficeScan Integration
A-9
Error Code Details
-153 Endpoint Sensor is unable to install requisite files. This problemcould be caused by a variety of reasons. Check the following andtry again:
• The user account may have insufficient permissions to installthe program.
• Another process or service may be interrupting installation.
• The system may be busy or locked.
If installation is still unsuccessful, download the installationpackage again and retry installation. If this problem persists,contact technical support.
-154 The Endpoint Sensor service, ESClient, is unable to start. Eitherthe service has timed out, or the system may be busy. Wait for afew minutes, and try again. If this problem persists, check thesystem logs through Event Viewer to find the cause or contactyour system administrator.
-157 Endpoint Sensor is unable to write to the Windows registry. Checkthat the user account has sufficient permissions to edit the registryand try again.
-158 Endpoint Sensor is unable to read the Windows registry. Checkthat the user account has sufficient permissions regarding registryand try again.
-167 The configuration file is missing or corrupted, or your user accountdoes not have sufficient privileges to read the configuration file.Check that the user account has sufficient permissions and tryagain. If this problem persists, contact technical support.
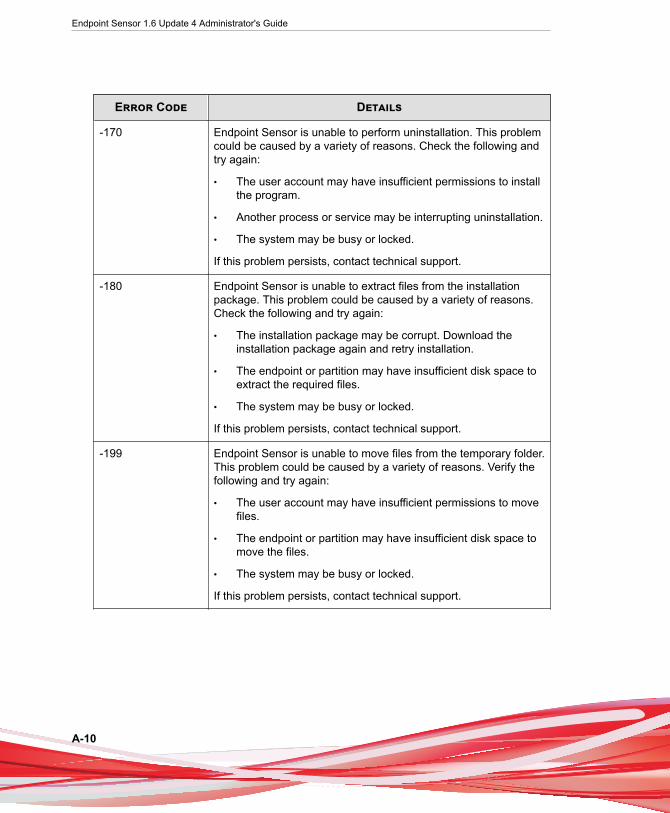
Endpoint Sensor 1.6 Update 4 Administrator's Guide
A-10
Error Code Details
-170 Endpoint Sensor is unable to perform uninstallation. This problemcould be caused by a variety of reasons. Check the following andtry again:
• The user account may have insufficient permissions to installthe program.
• Another process or service may be interrupting uninstallation.
• The system may be busy or locked.
If this problem persists, contact technical support.
-180 Endpoint Sensor is unable to extract files from the installationpackage. This problem could be caused by a variety of reasons.Check the following and try again:
• The installation package may be corrupt. Download theinstallation package again and retry installation.
• The endpoint or partition may have insufficient disk space toextract the required files.
• The system may be busy or locked.
If this problem persists, contact technical support.
-199 Endpoint Sensor is unable to move files from the temporary folder.This problem could be caused by a variety of reasons. Verify thefollowing and try again:
• The user account may have insufficient permissions to movefiles.
• The endpoint or partition may have insufficient disk space tomove the files.
• The system may be busy or locked.
If this problem persists, contact technical support.
OfficeScan Integration
A-11
Trend Micro Endpoint Sensor AgentDeployment Tasks
The following procedure explains how to install Endpoint Sensor agents.
Procedure
1. Install and open the Trend Micro Endpoint Sensor Deployment Tool plug-in.
For details, see Using the Trend Micro Endpoint Sensor Deployment Tool on page A-4.
2. Configure the Endpoint Sensor server and download the agent installation package.
For details, see Downloading the Installation Package on page A-11.
3. Install the Endpoint Sensor agent program to selected endpoints.
For information on using Agent Tree to select domains and agents, see Agent TreeSpecific Tasks on page A-14.
For information about agent installation, see Installing the Trend Micro Endpoint SensorAgent on page A-13.
Once installation is complete, each OfficeScan agent acts independently of eachEndpoint Sensor agent.
4. On the Summary screen, verify that all agents have been installed.
For information about the Summary screen, see Monitoring Trend Micro EndpointSensor Agents on page A-14.
5. Use the Endpoint Sensor management console to manage agents and performinvestigations.
Downloading the Installation PackageBefore you can deploy the Endpoint Sensor agents, you must specify the location wherethe Endpoint Sensor server downloads the agent installation package.
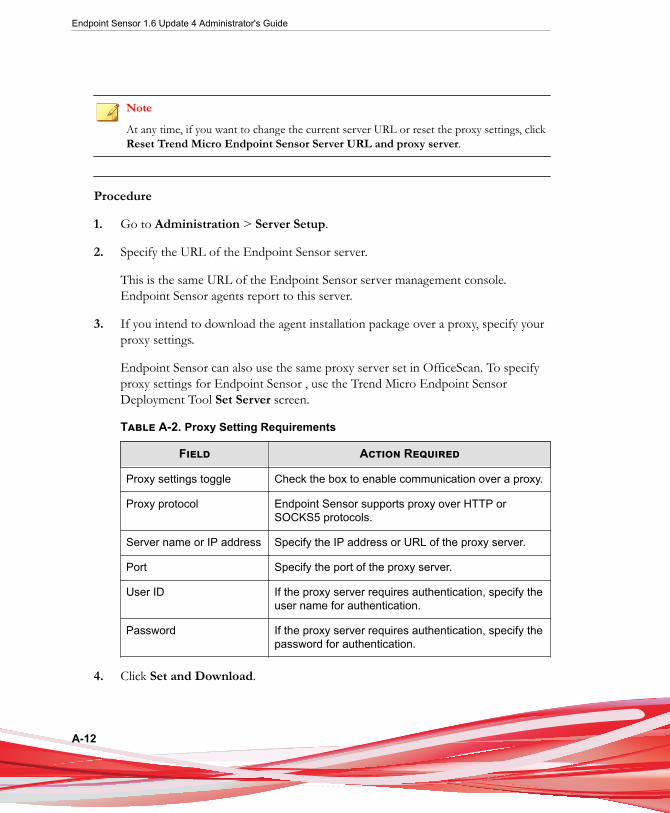
Endpoint Sensor 1.6 Update 4 Administrator's Guide
A-12
Note
At any time, if you want to change the current server URL or reset the proxy settings, clickReset Trend Micro Endpoint Sensor Server URL and proxy server.
Procedure
1. Go to Administration > Server Setup.
2. Specify the URL of the Endpoint Sensor server.
This is the same URL of the Endpoint Sensor server management console.Endpoint Sensor agents report to this server.
3. If you intend to download the agent installation package over a proxy, specify yourproxy settings.
Endpoint Sensor can also use the same proxy server set in OfficeScan. To specifyproxy settings for Endpoint Sensor , use the Trend Micro Endpoint SensorDeployment Tool Set Server screen.
Table A-2. Proxy Setting Requirements
Field Action Required
Proxy settings toggle Check the box to enable communication over a proxy.
Proxy protocol Endpoint Sensor supports proxy over HTTP orSOCKS5 protocols.
Server name or IP address Specify the IP address or URL of the proxy server.
Port Specify the port of the proxy server.
User ID If the proxy server requires authentication, specify theuser name for authentication.
Password If the proxy server requires authentication, specify thepassword for authentication.
4. Click Set and Download.
OfficeScan Integration
A-13
Endpoint Sensor tests the connection to the server, sets the server for EndpointSensor agent management, and then attempts to download the latest agentinstallation package from that server.
Note
After configuration, the screen changes to show which server has been set up. Todownload the latest agent installation package, click Get latest package.
Installing the Trend Micro Endpoint Sensor Agent
Note
You can install the Endpoint Sensor agent program to domains or individual agents but notto the root domain.
Procedure
1. Open the plug-in console and go to the Agent Management screen.
2. In the agent tree, select specific domains or agents.
3. Click Deploy Agent.
The Deploy Agent confirmation screen appears.
Important
Verify that the operating system of the endpoints where agents will be deployed issupported by Trend Micro Endpoint Sensor Deployment Tool, as the tool will skipinstallation on endpoints with unsupported operating systems. Trend Micro EndpointSensor will generate a list of the endpoints that the Endpoint Sensor agent was notinstalled on after installation. For details on supported operating systems, refer to theSystem Requirements section of the Installation Guide.
4. Click Install.
Endpoint Sensor begins deploying the agent to the selected endpoints.
Endpoint Sensor 1.6 Update 4 Administrator's Guide
A-14
If Endpoint Sensor agent installation was skipped on any endpoints, EndpointSensor generates a list of those endpoints.
5. Click Close to return to the Agent Management screen.
Monitoring Trend Micro Endpoint Sensor AgentsThe Summary screen shows the installation status of the Endpoint Sensor agents.
The Agent Installation Status widget displays the number of endpoints with theEndpoint Sensor agent installed.
NoteClick the Agents hyperlink to view the agents in the Agent Management tree.
The OfficeScan Agent TreeThe OfficeScan agent tree displays all the agents grouped into domains that the servercurrently manages. Agents are grouped into domains so you can simultaneouslyconfigure, manage, and apply the same configuration to all domain members.
The OfficeScan Agent TreeThe OfficeScan agent tree displays all the agents grouped into domains that the servercurrently manages. This allows administrators to configure, manage, and apply the sameconfiguration to all domain members.
Agent Tree Specific TasksThe agent tree displays when you access certain screens on the web console. Above theagent tree are menu items specific to the screen you have accessed. These menu itemsallow you to perform specific tasks, such as configuring agent settings or initiating agenttasks. To perform any of the tasks, first select the task target and then select a menuitem.

OfficeScan Integration
A-15
The agent tree provides access to the following functions:
• Search for computers: Locate specific endpoints by typing search criteria in thetext box.
• Advanced Search: Click the hyperlink to display the Advanced Search screen.Locate specific endpoints by using specific search criteria.
For details, see Performing an Advanced Search on page A-15.
• Synchronize with OfficeScan: Synchronize the plug-in program’s agent tree withthe OfficeScan server’s agent tree.
For details, see Synchronizing the Agent Tree on page A-16.
• Deploy Agent: Install and deploy Endpoint Sensor agents to selected endpoints orupgrade existing Endpoint Sensor agents to the latest version.
For details, see Installing the Trend Micro Endpoint Sensor Agent on page A-13.
• Uninstall: Uninstall Endpoint Sensor agents from the selected endpoints.
For details, see Uninstalling the Trend Micro Endpoint Sensor Agent on page A-17.
Administrators can also manually search the agent tree to locate endpoints or domains.Specific computer information displays in the table on the right.
Performing an Advanced Search
Procedure
1. Open the plug-in program console. On the Agent Management screen, click theAdvanced Search link.
The Advanced Search screen appears.
2. Search for agents by specifying the available criteria.
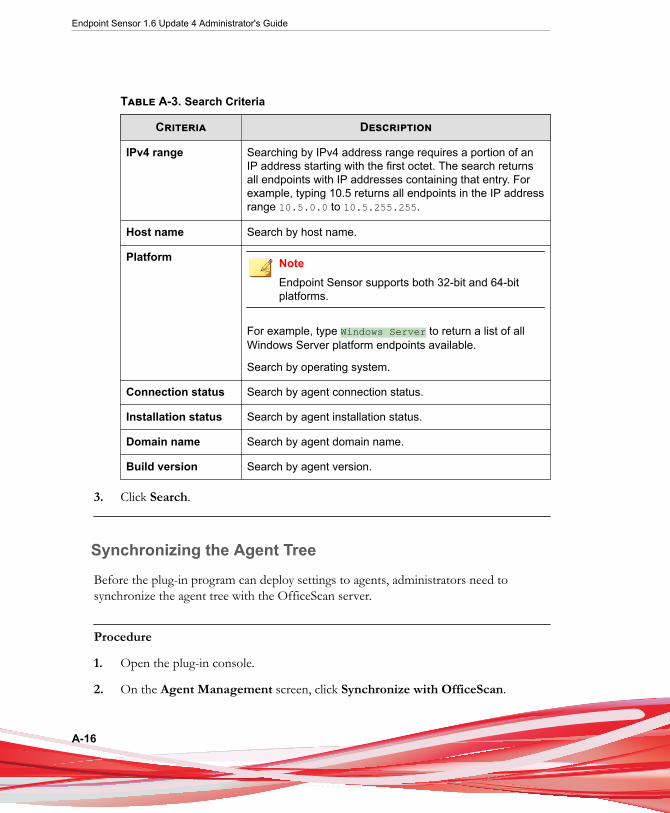
Endpoint Sensor 1.6 Update 4 Administrator's Guide
A-16
Table A-3. Search Criteria
Criteria Description
IPv4 range Searching by IPv4 address range requires a portion of anIP address starting with the first octet. The search returnsall endpoints with IP addresses containing that entry. Forexample, typing 10.5 returns all endpoints in the IP addressrange 10.5.0.0 to 10.5.255.255.
Host name Search by host name.
Platform NoteEndpoint Sensor supports both 32-bit and 64-bitplatforms.
For example, type Windows Server to return a list of allWindows Server platform endpoints available.
Search by operating system.
Connection status Search by agent connection status.
Installation status Search by agent installation status.
Domain name Search by agent domain name.
Build version Search by agent version.
3. Click Search.
Synchronizing the Agent TreeBefore the plug-in program can deploy settings to agents, administrators need tosynchronize the agent tree with the OfficeScan server.
Procedure
1. Open the plug-in console.
2. On the Agent Management screen, click Synchronize with OfficeScan.
OfficeScan Integration
A-17
A confirmation message screen appears.
3. Allow a few moments for the synchronization to complete.
After the synchronization completes, the message The client tree hasbeen successfully synchronized with the OfficeScan serverappears.
4. Click Close to return to the Agent Management screen.
Uninstalling the Trend Micro Endpoint Sensor Agent
Procedure
1. Open the plug-in console and go to the Agent Management screen.
2. In the agent tree, select specific domains or agents.
3. Click Uninstall.
4. Click OK to confirm the uninstallation.
5. Click Close in the confirmation dialog.
6. Monitor the uninstallation of the Endpoint Sensor agent in the Installation Statuscolumn of the Agent Management screen.
TipAllow some time for the uninstallation process to complete. Click the Refresh buttonperiodically to view the updated status.

B-1
Appendix B
Trend Micro Control ManagerIntegration
The following content explains how to integrate Endpoint Sensor with Trend MicroControl Manager.
Topics include:
• About Trend Micro Control Manager on page B-2
• Supported Control Manager Versions on page B-2
• Control Manager Integration in this Release on page B-3
• Registering with Control Manager on page B-4
• Adding the Endpoint Sensor Widgets on page B-5
• Using the Endpoint Sensor Investigation Widget on page B-6
• Using Automatic Updates on page B-7
• Trend Micro Endpoint Sensor Policy on page B-9
Endpoint Sensor 1.6 Update 4 Administrator's Guide
B-2
About Trend Micro Control ManagerTrend Micro Control Manager™ is a central management console that manages TrendMicro products and services at the gateway, mail server, file server, and corporatedesktop levels. The Control Manager web-based management console provides a singlemonitoring point for managed products and services throughout the network.
Control Manager allows system administrators to monitor and report on activities suchas infections, security violations, or virus entry points. System administrators candownload and deploy components throughout the network, helping ensure thatprotection is consistent and up-to-date. Control Manager allows both manual and pre-scheduled updates, and the configuration and administration of products as groups or asindividuals for added flexibility.
Supported Control Manager VersionsEndpoint Sensor supports the following Control Manager versions.
Table B-1. Supported Control Manager versions
Endpoint Sensor version Control Manager version
1.6 Update 4 • 6.0 SP3 Patch 3
• 7.0 Patch 1
Important
Additional hot fixes need to be installed to enhance integration between Control Managerand Endpoint Sensor . Contact Trend Micro support for details.
Apply the latest patches and critical hot fixes for these Control Manager versions toenable Control Manager to manage Endpoint Sensor . To obtain the latest patches andhot fixes, visit the Trend Micro Update Center at:
http://www.trendmicro.com/download

Trend Micro Control Manager Integration
B-3
After installing Endpoint Sensor , register it to Control Manager and then configuresettings for Endpoint Sensor on the Control Manager management console. See theControl Manager documentation for information on managing Endpoint Sensor servers.
Note
• Control Manager 6.0 supports Internet Explorer versions 8 to 11. However, to useControl Manager for configuring settings, managing policies, and viewing investigationresults of the registered Endpoint Sensor servers, Internet Explorer 10 and above isrecommended.
• Control Manager 7.0 supports Internet Explorer 11, Edge and Google Chrome.
• For known issues related to the integration between Endpoint Sensor and ControlManager, refer to the Control Manager readme.
Control Manager Integration in this ReleaseThis release includes the following features and capabilities when managing EndpointSensor servers from Control Manager:
• Use uploaded IOC files in Control Manager to initiate investigations directly toEndpoint Sensor from the Control Manager console.
• Register multiple Endpoint Sensor servers. Control Manager can start simultaneousinvestigations on multiple Endpoint Sensor servers.
• Pull data from Endpoint Sensor investigation results. The data is then displayed ina Control Manager widget.
• Create and deploy policies to Endpoint Sensor servers registered with ControlManager.
For details, see the Creating and Deploying Policies on page B-10.
• Manage monitoring rules in Control Manager.
For details, see Managing Monitoring Rules on page B-10.
• Configure and deploy Submission settings to Endpoint Sensor servers registeredwith Control Manager.
Endpoint Sensor 1.6 Update 4 Administrator's Guide
B-4
For details, see Managing Submission Settings on page B-12.
Registering with Control Manager
Procedure
1. Open the Control Manager management console.
To open the Control Manager console on any endpoint on the network, open aweb browser and type the following:
https:// <Control Manager server name> /Webapp/index.html
Where <Control Manager server name> is the IP address or host name ofthe Control Manager server
2. Depending on the version of Control Manager, perform the following:
• For Control Manager 6.0 SP3 Patch 3:
Go to Administration > Managed Servers.
• For Control Manager 7.0:
Go to Administration > Managed Servers > Server Registration.
3. On the screen that appears, select Trend Micro Endpoint Sensor as the ServerType, and then click Add.
4. In the Add Server screen, provide the following details:
• Server
• Display name
• User name
• Password
5. Click Save to add the server to the list. Repeat these steps to add another server.
Trend Micro Control Manager Integration
B-5
Adding the Endpoint Sensor Widgets
Procedure
1. Open the Control Manager management console.
To open the Control Manager console on any endpoint on the network, open aweb browser and type the following:
https:// <Control Manager server name> /Webapp/index.html
Where <Control Manager server name> is the IP address or host name ofthe Control Manager server
2. Depending on the version of Control Manager, perform the following:
• For Control Manager 6.0 SP3 Patch 3:
Go to Dashboard, and click Server Visibility.
• For Control Manager 7.0:
Go to Administration > Managed Servers > Server Registration.
3. On the screen that appears, select Trend Micro Endpoint Sensor as the ServerType, and then click Add.
4. Specify the details of the Endpoint Sensor server to be added, and click Save.
5. Click Close to return to the Dashboard screen.
6. Click Add widgets. On the screen that appears, select the Endpoint Sensorcategory on the left menu.
The following widgets are available:
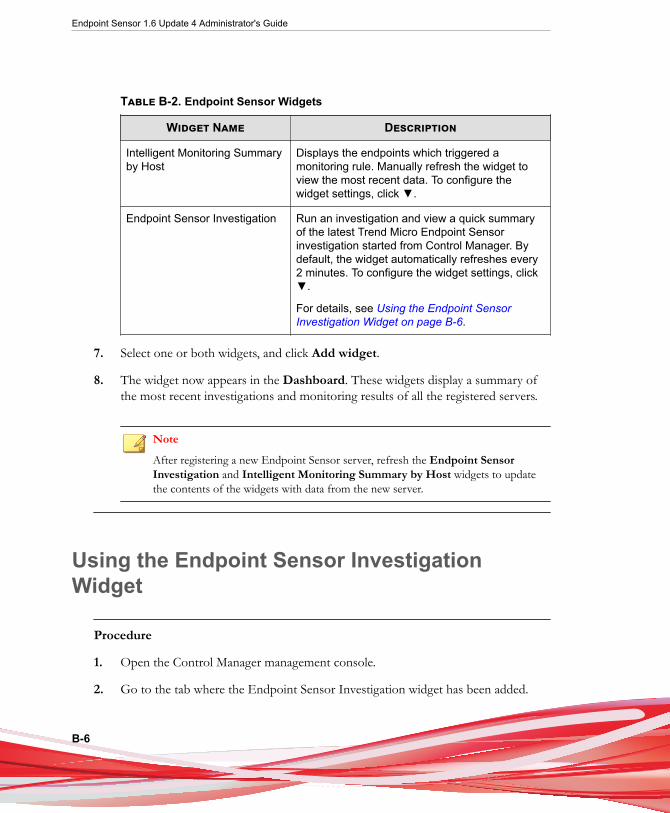
Endpoint Sensor 1.6 Update 4 Administrator's Guide
B-6
Table B-2. Endpoint Sensor Widgets
Widget Name Description
Intelligent Monitoring Summaryby Host
Displays the endpoints which triggered amonitoring rule. Manually refresh the widget toview the most recent data. To configure thewidget settings, click ▼.
Endpoint Sensor Investigation Run an investigation and view a quick summaryof the latest Trend Micro Endpoint Sensorinvestigation started from Control Manager. Bydefault, the widget automatically refreshes every2 minutes. To configure the widget settings, click▼.
For details, see Using the Endpoint SensorInvestigation Widget on page B-6.
7. Select one or both widgets, and click Add widget.
8. The widget now appears in the Dashboard. These widgets display a summary ofthe most recent investigations and monitoring results of all the registered servers.
Note
After registering a new Endpoint Sensor server, refresh the Endpoint SensorInvestigation and Intelligent Monitoring Summary by Host widgets to updatethe contents of the widgets with data from the new server.
Using the Endpoint Sensor InvestigationWidget
Procedure
1. Open the Control Manager management console.
2. Go to the tab where the Endpoint Sensor Investigation widget has been added.
Trend Micro Control Manager Integration
B-7
3. In the Endpoint Sensor Investigation widget, click Start a New Investigation ,and then click Historical Records or System Snapshot, depending on the type ofinvestigation you plan to run.
4. In the screen that appears, specify the required information.
For details, see Running an Investigation on page 3-2.
The Endpoint Sensor Investigation widget also supports importing C&C callbackevents as investigation criteria.
a. On the Endpoint Sensor Investigation widget, click Start a NewInvestigation > Historical Records.
b. Select Retro Scan as the investigation method.
c. Click Import from C&C Callback Events.
d. On the screen that appears, select the C&C callback events that need to beinvestigated, and click OK. The events will be added as investigation criteria.
5. Click Investigate.
The screen refreshes and displays the progress of the investigation.
Note
To stop an ongoing investigation, click Cancel.
6. Once the investigation is finished, the widget shows the number of endpointsclassified as Matched, Safe, Pending or Cancelled during the investigation. Clickthe result of each classification to view more details.
Using Automatic UpdatesTo use Control Manager as a local update server for Endpoint Sensor , perform thefollowing steps:

Endpoint Sensor 1.6 Update 4 Administrator's Guide
B-8
Procedure
1. Set up Control Manager to perform a scheduled download of the followingpatterns:
• Endpoint Sensor Exception Pattern
• Endpoint Sensor Trusted Pattern
• Attack Discovery Pattern
Note
The procedure for configuring Control Manager for automatic updates varies byversion. For details, refer to the documentation of the Control Manager version beingconfigured.
2. Configure Endpoint Sensor to use Control Manager as its update source.
a. Open the Endpoint Sensor server management console.
b. Click Administration > Updates.
c. Enable Download monitoring rules from the following source.
d. Select Other update source, and type the following in the textbox below:
http://<Control Manger server Name>/TVCSDownload/Activeupdate
e. Click Save.
3. Verify that the update process completes successfully in both Control Manager andEndpoint Sensor .
• During the next Control Manager update, Control Manager should includethe Endpoint Sensor patterns.
Note
To download the patterns immediately, select Updates > Manual Downloadin Control Manager.
Trend Micro Control Manager Integration
B-9
• Endpoint Sensor then downloads these patterns from Control Managerduring the next Endpoint Sensor scheduled update.
Trend Micro Endpoint Sensor PolicyControl Manager includes a Policy Management feature which allows administrators toremotely update monitoring rules and deploy submission settings on registered servers.
NoteMultiple Endpoint Sensor policies can be created, but each server can issue only one policyat a time.
For details, see the Control Manager documentation at:
http://docs.trendmicro.com/en-us/enterprise/control-manager.aspx
Preparing the Server for Policy DeploymentBy default, recently added Endpoint Sensor servers are placed in the New Entity folder.The servers have to be moved to another folder to be visible for policy deployment.
Procedure
1. Open the Control Manager management console.
2. Go to Directories > Products, and click Directory Management.
3. In the directory tree, expand the New Entity folder and locate the server you wishto manage.
4. Perform any of the following:
• Drag and drop the server to another folder
• Click Add Folder to create a new folder, and then drag and drop the server tothe new folder.
Endpoint Sensor 1.6 Update 4 Administrator's Guide
B-10
Creating and Deploying Policies
Procedure
1. Open the Control Manager management console.
2. Go to Policies > Policy Management.
3. On the Product drop down, select Trend Micro Endpoint Sensor.
4. Click Create.
5. Click Specify Target(s) and select which Endpoint Sensor servers you wish todeploy to.
6. On the Monitoring Settings section, configure monitoring rules and submissionsettings for the new policy.
7. Click Deploy to immediately start the policy deployment.
Afterwards, Control Manager enforces any subsequent updates to the policy on thetarget Endpoint Sensor servers every 24 hours.
For details, see the Control Manager documentation at:
http://docs.trendmicro.com/en-us/enterprise/control-manager.aspx
Managing Monitoring RulesTake note of the following considerations:
• Managing monitoring rules:
The Monitoring Rules tab displays user-defined rules only. While monitoringrules are shared across policies, the status of a monitoring rule (Enabled/Disabled/remove) is independent for each policy. Administrators can customize policies byselecting which monitoring rules are enabled, disabled, or remove for each policy.New monitoring rules are disabled by default.
Control Manager is limited to remotely controlling monitoring rules in EndpointSensor servers where the rules are part of a Endpoint Sensor policy.
Trend Micro Control Manager Integration
B-11
If a new Endpoint Sensor server is registered, Control Manager automaticallyincludes the new Endpoint Sensor server in its rule deployment schedule. Once thenext deployment schedule is due, Control Manager uploads all active monitoringrules to the newly registered server.
• Uploading monitoring rules:
To upload a monitoring rule, Click Policies > Policies Management , and selectTrend Micro Endpoint Sensor as the Product . Click Create to ceate a newpolicy, or click an existing policy to open the Create / Edit Policy screen. ExpandMonitoring Settings, click Upload IOC Rule > Choose File, and navigate tothe location of the monitoring rule. Click Open to automatically upload themonitoring rule. After the upload is complete, click Save or Deploy.
Note
• It is recommended to specify the target Endpoint Sensor servers beforeuploading the rule.
• The Upload IOC Rule feature is enabled only when there is at least oneEndpoint Sensor server registered to Control Manager.
For details, see Registering with Control Manager on page B-4.
Uploading the same monitoring rule in both Control Manager and in a EndpointSensor server registered with Control Manager may cause conflicts. Regularly keeptrack of the uploaded monitoring rules through the Monitoring Settings screen toavoid duplication.
If a duplicate monitoring rule is encountered, the following message appears:"Unable to upload file. The file already exists in the Endpoint Sensor server. Usethe Endpoint Sensor management console to remove the file first, and try again."
• Changing the status of a monitoring rule:
To change the status of a monitoring rule, click Toggle Status, and select Enableor Disable. Afterwards, update the remote rule of the Endpoint Sensor serversspecified as targets in this policy.
The status of a monitoring rule is independent for each policy.
Endpoint Sensor 1.6 Update 4 Administrator's Guide
B-12
• Removing monitoring rules:
To remove a rule, select the rule and click Remove. The status of the removed rulechanges to remove. Click Save or Deploy to complete the process.
WARNING!
• Removal of a monitoring rule also removes the monitoring rule from all otherEndpoint Sensor policies.
• If the same rule is re-uploaded in a new policy, the old policy will remove therule again during its scheduled run.
If problems persist, contact Trend Micro support for assistance.
Managing Submission SettingsUse the Submission Settings tab to specify if the collected files are sent to a local fileserver, or sent to Deep Discovery Analyzer for further analysis.
For details, see Submission Settings on page 4-5.
Control Manager is unable to configure a proxy connection between Endpoint Sensorendpoints and Deep Discovery Analyzer. To configure a proxy connection betweenEndpoint Sensor endpoints and Deep Discovery Analyzer, use the Proxy screen of theEndpoint Sensor server computer.
For details, see Proxy on page 5-4.
C-1
Appendix C
Supported IOC Indicator Terms
IOC files consist of one or more indicator terms. These indicator terms specify thevariables to use in the investigation. Endpoint Sensor performs the following steps toparse uploaded IOC files:
• Extracts all indicator terms from IOC files
• Converts the supported indicator terms into SQL commands
• Applies these SQL commands as investigation parameters
• Skips all unsupported indicator terms in the IOC file
Endpoint Sensor classifies IOC files as follows:
• Historical records IOCs
IOC files used for investigating historical events. These IOC files are uploaded inHistorical search > IOC files.
For details, see IOC Samples for Historical Records IOCs on page C-12.
• System process IOCs
IOC files used for investigating running system processes based on the currentsystem state. These IOC files are uploaded in System snapshot > IOC files.
For details, see IOC Samples for System Process IOCs on page C-16.
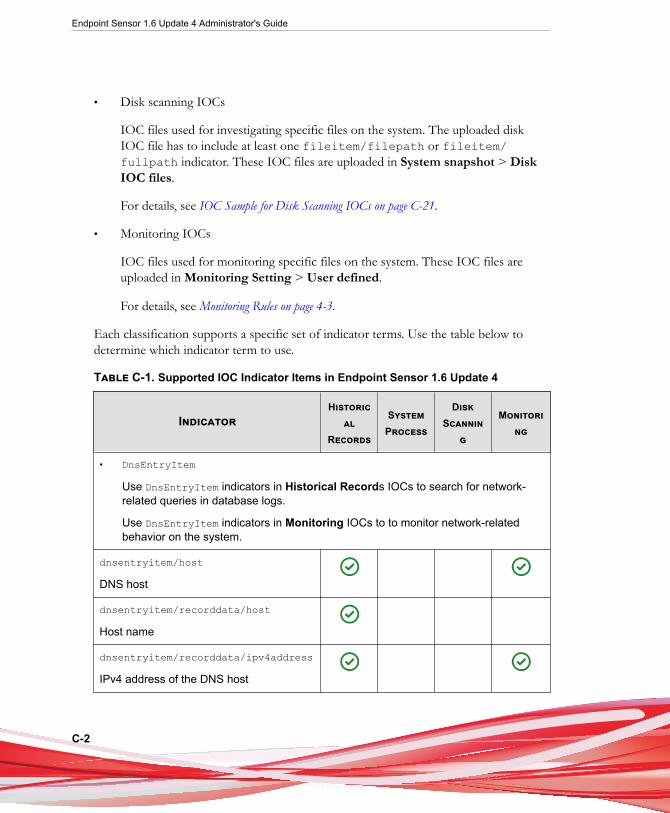
Endpoint Sensor 1.6 Update 4 Administrator's Guide
C-2
• Disk scanning IOCs
IOC files used for investigating specific files on the system. The uploaded diskIOC file has to include at least one fileitem/filepath or fileitem/fullpath indicator. These IOC files are uploaded in System snapshot > DiskIOC files.
For details, see IOC Sample for Disk Scanning IOCs on page C-21.
• Monitoring IOCs
IOC files used for monitoring specific files on the system. These IOC files areuploaded in Monitoring Setting > User defined.
For details, see Monitoring Rules on page 4-3.
Each classification supports a specific set of indicator terms. Use the table below todetermine which indicator term to use.
Table C-1. Supported IOC Indicator Items in Endpoint Sensor 1.6 Update 4
IndicatorHistoric
alRecords
SystemProcess
DiskScannin
g
Monitoring
• DnsEntryItem
Use DnsEntryItem indicators in Historical Records IOCs to search for network-related queries in database logs.
Use DnsEntryItem indicators in Monitoring IOCs to to monitor network-relatedbehavior on the system.
dnsentryitem/host
DNS host
dnsentryitem/recorddata/host
Host name
dnsentryitem/recorddata/ipv4address
IPv4 address of the DNS host
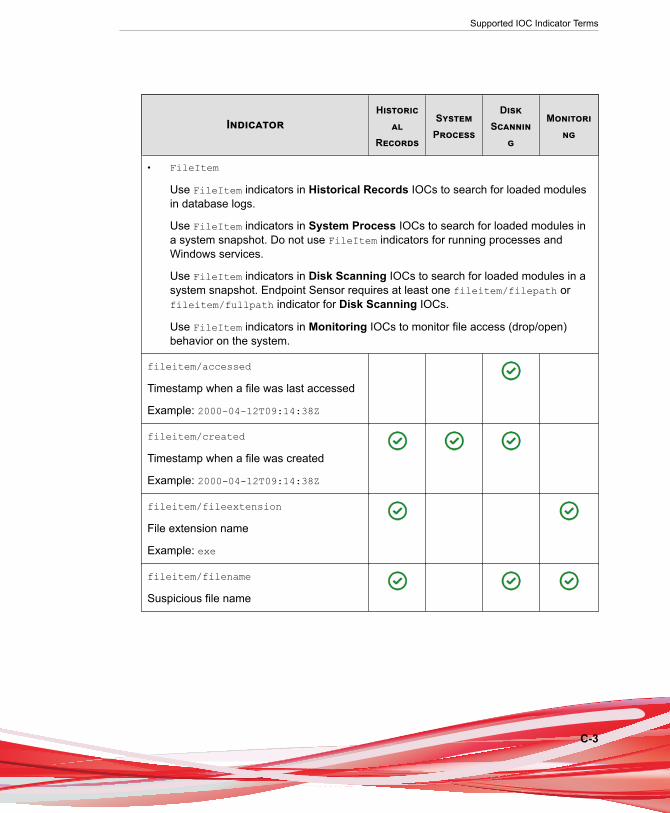
Supported IOC Indicator Terms
C-3
IndicatorHistoric
alRecords
SystemProcess
DiskScannin
g
Monitoring
• FileItem
Use FileItem indicators in Historical Records IOCs to search for loaded modulesin database logs.
Use FileItem indicators in System Process IOCs to search for loaded modules ina system snapshot. Do not use FileItem indicators for running processes andWindows services.
Use FileItem indicators in Disk Scanning IOCs to search for loaded modules in asystem snapshot. Endpoint Sensor requires at least one fileitem/filepath orfileitem/fullpath indicator for Disk Scanning IOCs.
Use FileItem indicators in Monitoring IOCs to monitor file access (drop/open)behavior on the system.
fileitem/accessed
Timestamp when a file was last accessed
Example: 2000-04-12T09:14:38Z
fileitem/created
Timestamp when a file was created
Example: 2000-04-12T09:14:38Z
fileitem/fileextension
File extension name
Example: exe
fileitem/filename
Suspicious file name

Endpoint Sensor 1.6 Update 4 Administrator's Guide
C-4
IndicatorHistoric
alRecords
SystemProcess
DiskScannin
g
Monitoring
fileitem/filepath
Target landing folder without a file name
For Disk Scanning IOCs, add an asterisk(*) after the path to recursively searchsubfolders.
Example: C:\Windows\System32\*
Disk Scanning IOCs require at least onefilepath or fullpath indicator.
fileitem/fullpath
Full target landing folder including the filename
Example: C:\Windows\System32\WinSync.dll
Disk Scanning IOCs require at least onefilepath or fullpath indicator.
fileitem/md5sum
Suspicious file MD5 hash value, inhexadecimal format
fileitem/modified
Timestamp when a file was last modified
Example: 2000-04-12T09:14:38Z
fileitem/peinfo/digitalsignature/certificateissuer
Keywords in the file digital certificate issuersection
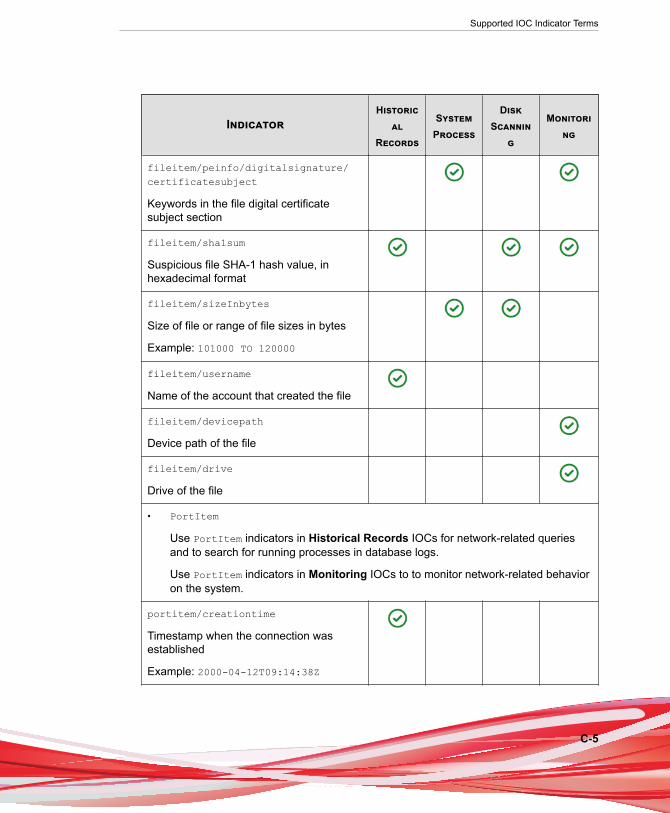
Supported IOC Indicator Terms
C-5
IndicatorHistoric
alRecords
SystemProcess
DiskScannin
g
Monitoring
fileitem/peinfo/digitalsignature/certificatesubject
Keywords in the file digital certificatesubject section
fileitem/sha1sum
Suspicious file SHA-1 hash value, inhexadecimal format
fileitem/sizeInbytes
Size of file or range of file sizes in bytes
Example: 101000 TO 120000
fileitem/username
Name of the account that created the file
fileitem/devicepath
Device path of the file
fileitem/drive
Drive of the file
• PortItem
Use PortItem indicators in Historical Records IOCs for network-related queriesand to search for running processes in database logs.
Use PortItem indicators in Monitoring IOCs to to monitor network-related behavioron the system.
portitem/creationtime
Timestamp when the connection wasestablished
Example: 2000-04-12T09:14:38Z
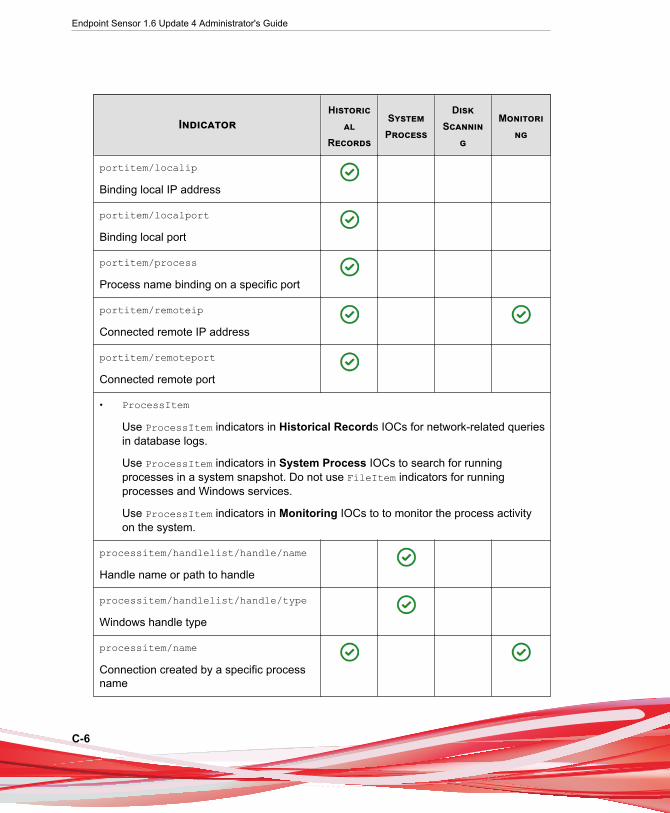
Endpoint Sensor 1.6 Update 4 Administrator's Guide
C-6
IndicatorHistoric
alRecords
SystemProcess
DiskScannin
g
Monitoring
portitem/localip
Binding local IP address
portitem/localport
Binding local port
portitem/process
Process name binding on a specific port
portitem/remoteip
Connected remote IP address
portitem/remoteport
Connected remote port
• ProcessItem
Use ProcessItem indicators in Historical Records IOCs for network-related queriesin database logs.
Use ProcessItem indicators in System Process IOCs to search for runningprocesses in a system snapshot. Do not use FileItem indicators for runningprocesses and Windows services.
Use ProcessItem indicators in Monitoring IOCs to to monitor the process activityon the system.
processitem/handlelist/handle/name
Handle name or path to handle
processitem/handlelist/handle/type
Windows handle type
processitem/name
Connection created by a specific processname
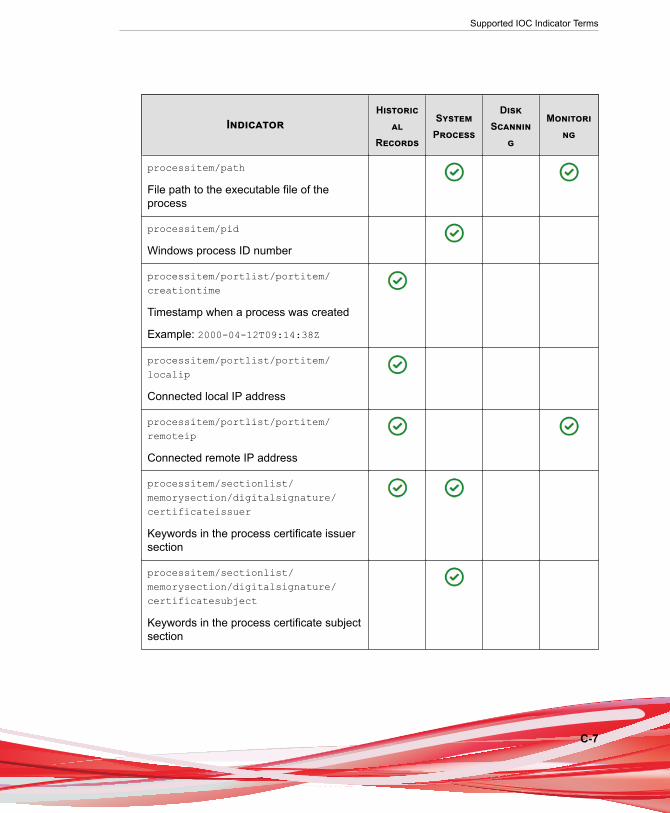
Supported IOC Indicator Terms
C-7
IndicatorHistoric
alRecords
SystemProcess
DiskScannin
g
Monitoring
processitem/path
File path to the executable file of theprocess
processitem/pid
Windows process ID number
processitem/portlist/portitem/creationtime
Timestamp when a process was created
Example: 2000-04-12T09:14:38Z
processitem/portlist/portitem/localip
Connected local IP address
processitem/portlist/portitem/remoteip
Connected remote IP address
processitem/sectionlist/memorysection/digitalsignature/certificateissuer
Keywords in the process certificate issuersection
processitem/sectionlist/memorysection/digitalsignature/certificatesubject
Keywords in the process certificate subjectsection
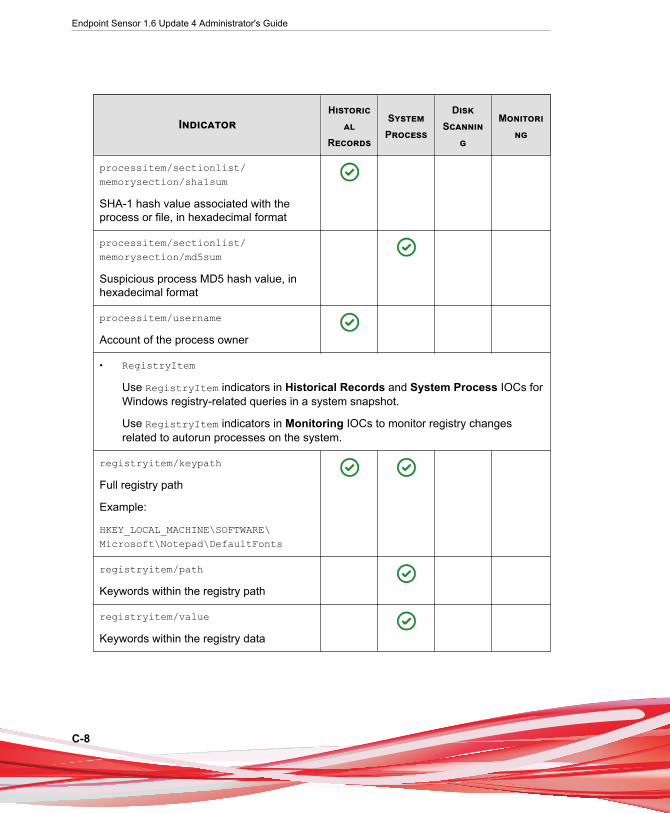
Endpoint Sensor 1.6 Update 4 Administrator's Guide
C-8
IndicatorHistoric
alRecords
SystemProcess
DiskScannin
g
Monitoring
processitem/sectionlist/memorysection/sha1sum
SHA-1 hash value associated with theprocess or file, in hexadecimal format
processitem/sectionlist/memorysection/md5sum
Suspicious process MD5 hash value, inhexadecimal format
processitem/username
Account of the process owner
• RegistryItem
Use RegistryItem indicators in Historical Records and System Process IOCs forWindows registry-related queries in a system snapshot.
Use RegistryItem indicators in Monitoring IOCs to monitor registry changesrelated to autorun processes on the system.
registryitem/keypath
Full registry path
Example:
HKEY_LOCAL_MACHINE\SOFTWARE\Microsoft\Notepad\DefaultFonts
registryitem/path
Keywords within the registry path
registryitem/value
Keywords within the registry data
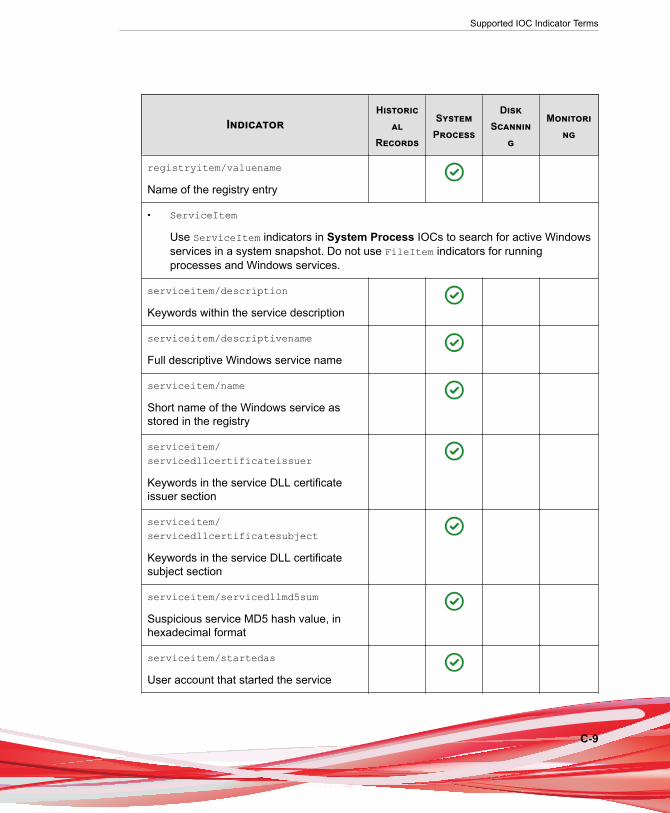
Supported IOC Indicator Terms
C-9
IndicatorHistoric
alRecords
SystemProcess
DiskScannin
g
Monitoring
registryitem/valuename
Name of the registry entry
• ServiceItem
Use ServiceItem indicators in System Process IOCs to search for active Windowsservices in a system snapshot. Do not use FileItem indicators for runningprocesses and Windows services.
serviceitem/description
Keywords within the service description
serviceitem/descriptivename
Full descriptive Windows service name
serviceitem/name
Short name of the Windows service asstored in the registry
serviceitem/servicedllcertificateissuer
Keywords in the service DLL certificateissuer section
serviceitem/servicedllcertificatesubject
Keywords in the service DLL certificatesubject section
serviceitem/servicedllmd5sum
Suspicious service MD5 hash value, inhexadecimal format
serviceitem/startedas
User account that started the service
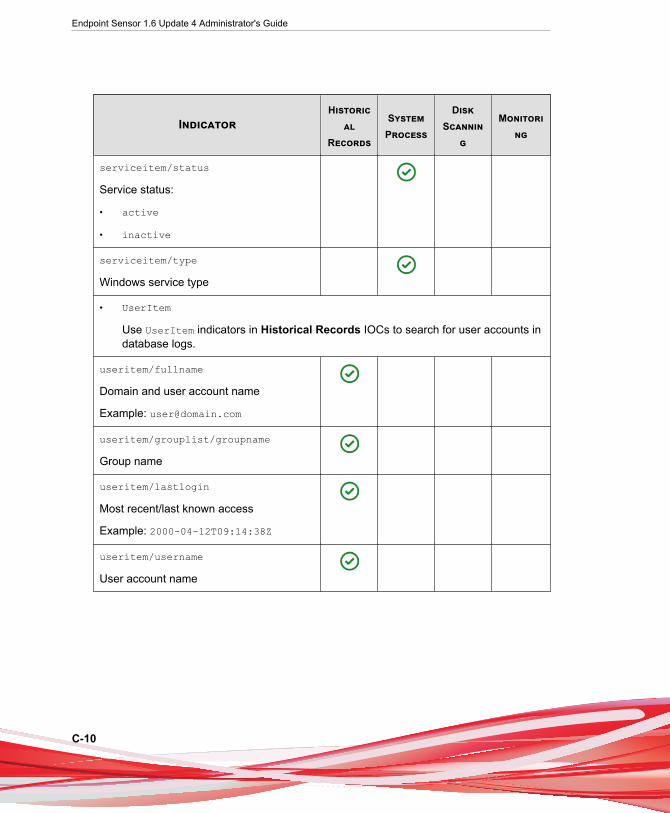
Endpoint Sensor 1.6 Update 4 Administrator's Guide
C-10
IndicatorHistoric
alRecords
SystemProcess
DiskScannin
g
Monitoring
serviceitem/status
Service status:
• active
• inactive
serviceitem/type
Windows service type
• UserItem
Use UserItem indicators in Historical Records IOCs to search for user accounts indatabase logs.
useritem/fullname
Domain and user account name
Example: [email protected]
useritem/grouplist/groupname
Group name
useritem/lastlogin
Most recent/last known access
Example: 2000-04-12T09:14:38Z
useritem/username
User account name

Supported IOC Indicator Terms
C-11
Note
• Ensure that IOC files follow the correct syntax. Follow the IOC schemas and relatedinstructions available in http://OpenIOC.org/.
• Use the IOCTool available in the <Trend Micro Endpoint Sensorinstallation path>\CmdTool\IOCTool\ folder to troubleshoot invalid IOCfiles.
For details, see Troubleshooting Invalid IOC Files on page 3-34.
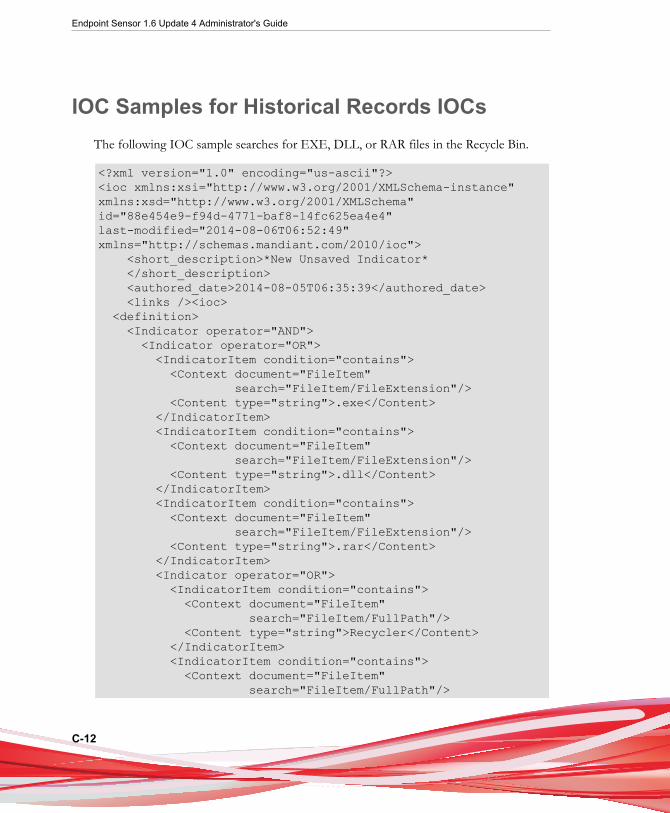
Endpoint Sensor 1.6 Update 4 Administrator's Guide
C-12
IOC Samples for Historical Records IOCsThe following IOC sample searches for EXE, DLL, or RAR files in the Recycle Bin.
<?xml version="1.0" encoding="us-ascii"?><ioc xmlns:xsi="http://www.w3.org/2001/XMLSchema-instance"xmlns:xsd="http://www.w3.org/2001/XMLSchema"id="88e454e9-f94d-4771-baf8-14fc625ea4e4"last-modified="2014-08-06T06:52:49"xmlns="http://schemas.mandiant.com/2010/ioc"> <short_description>*New Unsaved Indicator* </short_description> <authored_date>2014-08-05T06:35:39</authored_date> <links /><ioc> <definition> <Indicator operator="AND"> <Indicator operator="OR"> <IndicatorItem condition="contains"> <Context document="FileItem" search="FileItem/FileExtension"/> <Content type="string">.exe</Content> </IndicatorItem> <IndicatorItem condition="contains"> <Context document="FileItem" search="FileItem/FileExtension"/> <Content type="string">.dll</Content> </IndicatorItem> <IndicatorItem condition="contains"> <Context document="FileItem" search="FileItem/FileExtension"/> <Content type="string">.rar</Content> </IndicatorItem> <Indicator operator="OR"> <IndicatorItem condition="contains"> <Context document="FileItem" search="FileItem/FullPath"/> <Content type="string">Recycler</Content> </IndicatorItem> <IndicatorItem condition="contains"> <Context document="FileItem" search="FileItem/FullPath"/>
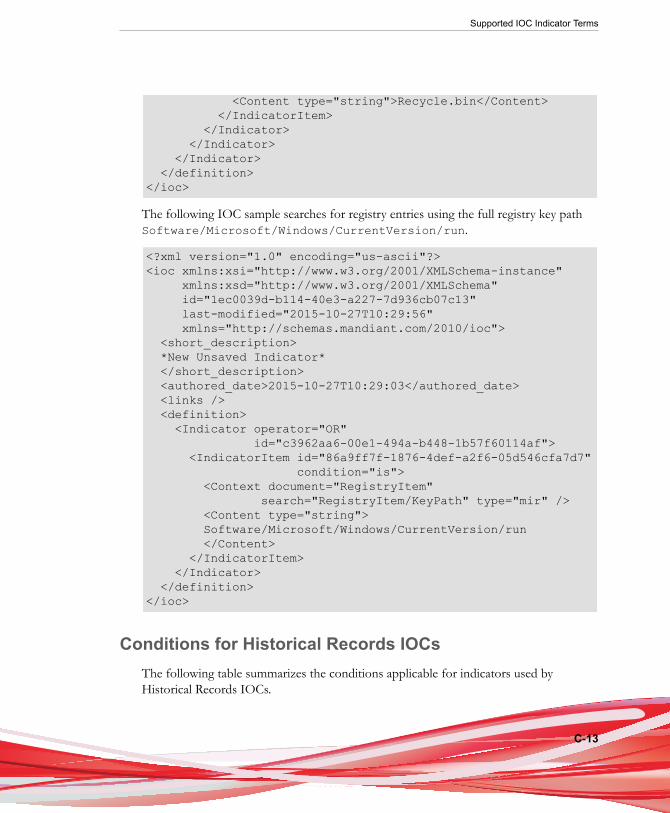
Supported IOC Indicator Terms
C-13
<Content type="string">Recycle.bin</Content> </IndicatorItem> </Indicator> </Indicator> </Indicator> </definition></ioc>
The following IOC sample searches for registry entries using the full registry key pathSoftware/Microsoft/Windows/CurrentVersion/run.
<?xml version="1.0" encoding="us-ascii"?><ioc xmlns:xsi="http://www.w3.org/2001/XMLSchema-instance" xmlns:xsd="http://www.w3.org/2001/XMLSchema" id="1ec0039d-b114-40e3-a227-7d936cb07c13" last-modified="2015-10-27T10:29:56" xmlns="http://schemas.mandiant.com/2010/ioc"> <short_description> *New Unsaved Indicator* </short_description> <authored_date>2015-10-27T10:29:03</authored_date> <links /> <definition> <Indicator operator="OR" id="c3962aa6-00e1-494a-b448-1b57f60114af"> <IndicatorItem id="86a9ff7f-1876-4def-a2f6-05d546cfa7d7" condition="is"> <Context document="RegistryItem" search="RegistryItem/KeyPath" type="mir" /> <Content type="string"> Software/Microsoft/Windows/CurrentVersion/run </Content> </IndicatorItem> </Indicator> </definition></ioc>
Conditions for Historical Records IOCsThe following table summarizes the conditions applicable for indicators used byHistorical Records IOCs.
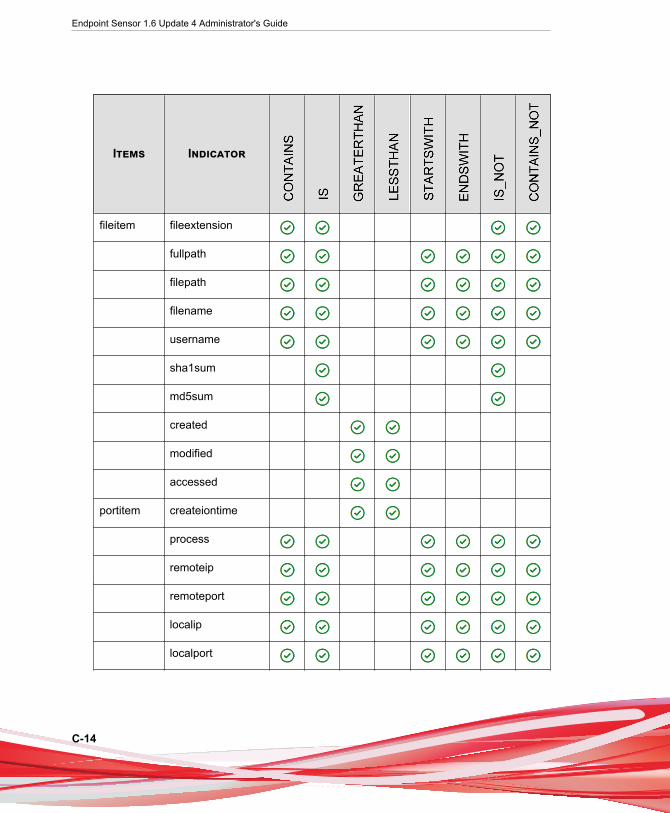
Endpoint Sensor 1.6 Update 4 Administrator's Guide
C-14
Items Indicator
fileitem fileextension
fullpath
filepath
filename
username
sha1sum
md5sum
created
modified
accessed
portitem createiontime
process
remoteip
remoteport
localip
localport
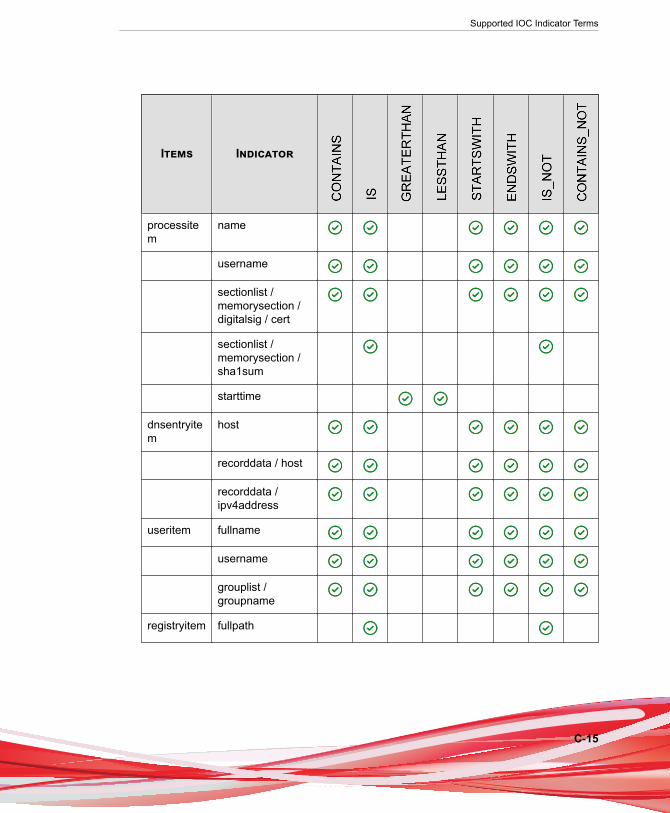
Supported IOC Indicator Terms
C-15
Items Indicator
processitem
name
username
sectionlist /memorysection /digitalsig / cert
sectionlist /memorysection /sha1sum
starttime
dnsentryitem
host
recorddata / host
recorddata /ipv4address
useritem fullname
username
grouplist /groupname
registryitem fullpath
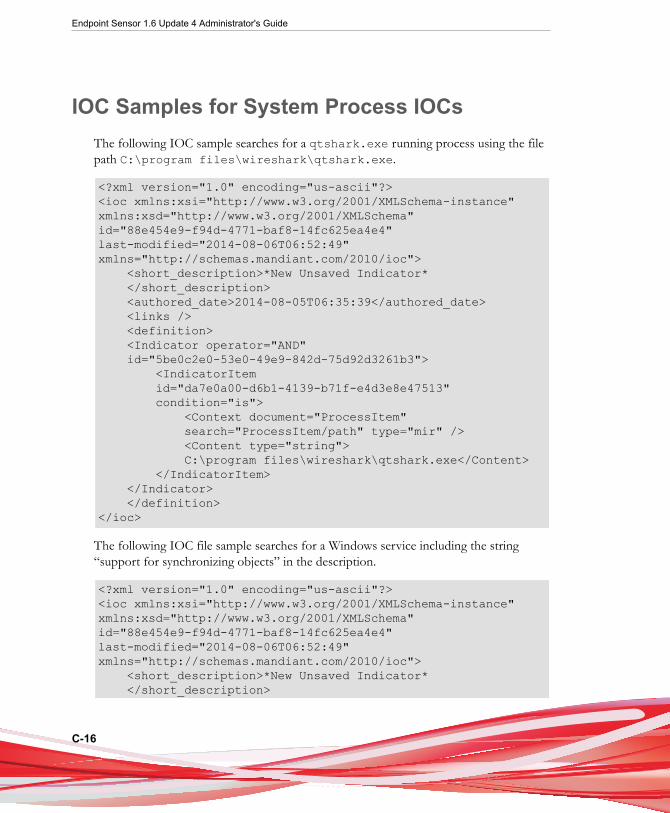
Endpoint Sensor 1.6 Update 4 Administrator's Guide
C-16
IOC Samples for System Process IOCsThe following IOC sample searches for a qtshark.exe running process using the filepath C:\program files\wireshark\qtshark.exe.
<?xml version="1.0" encoding="us-ascii"?><ioc xmlns:xsi="http://www.w3.org/2001/XMLSchema-instance"xmlns:xsd="http://www.w3.org/2001/XMLSchema"id="88e454e9-f94d-4771-baf8-14fc625ea4e4"last-modified="2014-08-06T06:52:49"xmlns="http://schemas.mandiant.com/2010/ioc"> <short_description>*New Unsaved Indicator* </short_description> <authored_date>2014-08-05T06:35:39</authored_date> <links /> <definition> <Indicator operator="AND" id="5be0c2e0-53e0-49e9-842d-75d92d3261b3"> <IndicatorItem id="da7e0a00-d6b1-4139-b71f-e4d3e8e47513" condition="is"> <Context document="ProcessItem" search="ProcessItem/path" type="mir" /> <Content type="string"> C:\program files\wireshark\qtshark.exe</Content> </IndicatorItem> </Indicator> </definition></ioc>
The following IOC file sample searches for a Windows service including the string“support for synchronizing objects” in the description.
<?xml version="1.0" encoding="us-ascii"?><ioc xmlns:xsi="http://www.w3.org/2001/XMLSchema-instance"xmlns:xsd="http://www.w3.org/2001/XMLSchema"id="88e454e9-f94d-4771-baf8-14fc625ea4e4"last-modified="2014-08-06T06:52:49"xmlns="http://schemas.mandiant.com/2010/ioc"> <short_description>*New Unsaved Indicator* </short_description>
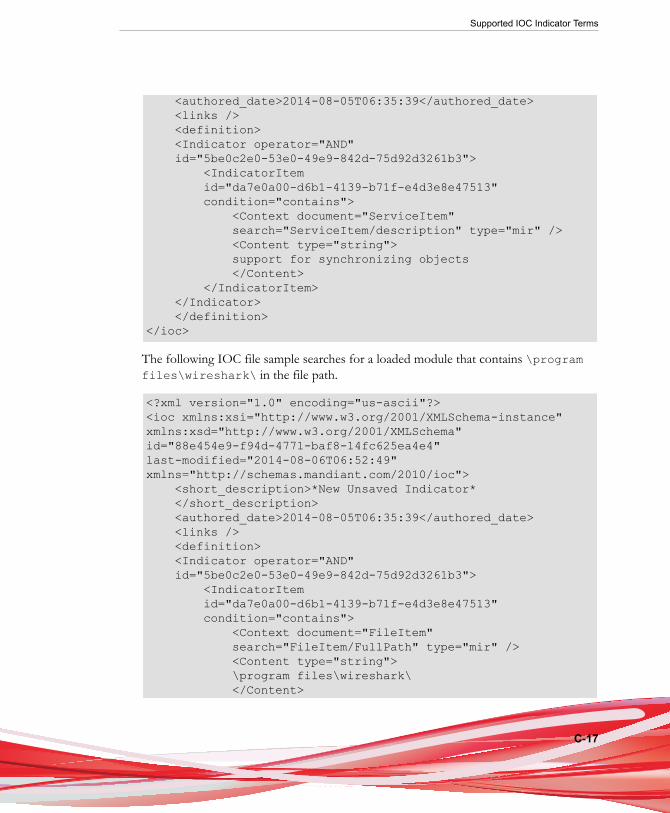
Supported IOC Indicator Terms
C-17
<authored_date>2014-08-05T06:35:39</authored_date> <links /> <definition> <Indicator operator="AND" id="5be0c2e0-53e0-49e9-842d-75d92d3261b3"> <IndicatorItem id="da7e0a00-d6b1-4139-b71f-e4d3e8e47513" condition="contains"> <Context document="ServiceItem" search="ServiceItem/description" type="mir" /> <Content type="string"> support for synchronizing objects </Content> </IndicatorItem> </Indicator> </definition></ioc>
The following IOC file sample searches for a loaded module that contains \programfiles\wireshark\ in the file path.
<?xml version="1.0" encoding="us-ascii"?><ioc xmlns:xsi="http://www.w3.org/2001/XMLSchema-instance"xmlns:xsd="http://www.w3.org/2001/XMLSchema"id="88e454e9-f94d-4771-baf8-14fc625ea4e4"last-modified="2014-08-06T06:52:49"xmlns="http://schemas.mandiant.com/2010/ioc"> <short_description>*New Unsaved Indicator* </short_description> <authored_date>2014-08-05T06:35:39</authored_date> <links /> <definition> <Indicator operator="AND" id="5be0c2e0-53e0-49e9-842d-75d92d3261b3"> <IndicatorItem id="da7e0a00-d6b1-4139-b71f-e4d3e8e47513" condition="contains"> <Context document="FileItem" search="FileItem/FullPath" type="mir" /> <Content type="string"> \program files\wireshark\ </Content>
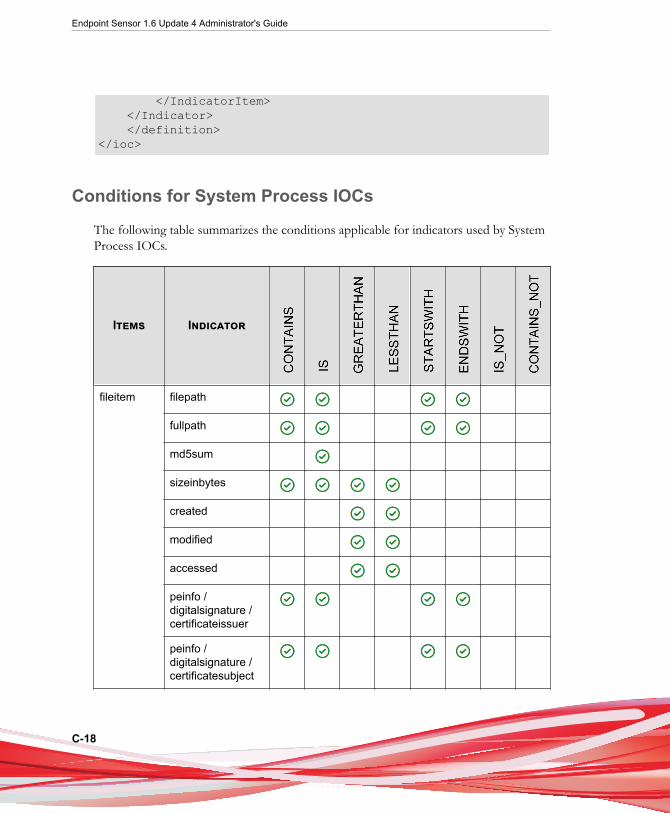
Endpoint Sensor 1.6 Update 4 Administrator's Guide
C-18
</IndicatorItem> </Indicator> </definition></ioc>
Conditions for System Process IOCs
The following table summarizes the conditions applicable for indicators used by SystemProcess IOCs.
Items Indicator
fileitem filepath
fullpath
md5sum
sizeinbytes
created
modified
accessed
peinfo /digitalsignature /certificateissuer
peinfo /digitalsignature /certificatesubject
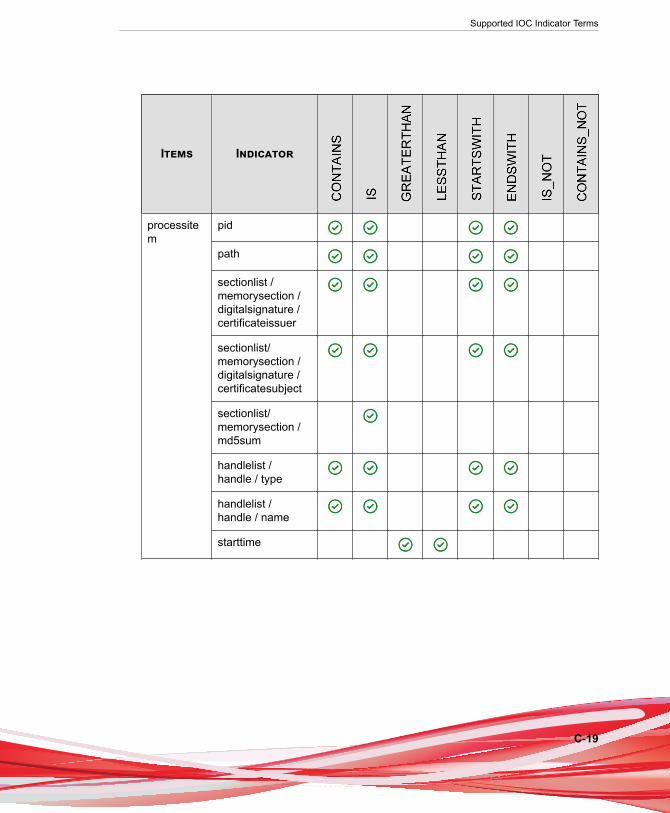
Supported IOC Indicator Terms
C-19
Items Indicator
processitem
pid
path
sectionlist /memorysection /digitalsignature /certificateissuer
sectionlist/memorysection /digitalsignature /certificatesubject
sectionlist/memorysection /md5sum
handlelist /handle / type
handlelist /handle / name
starttime
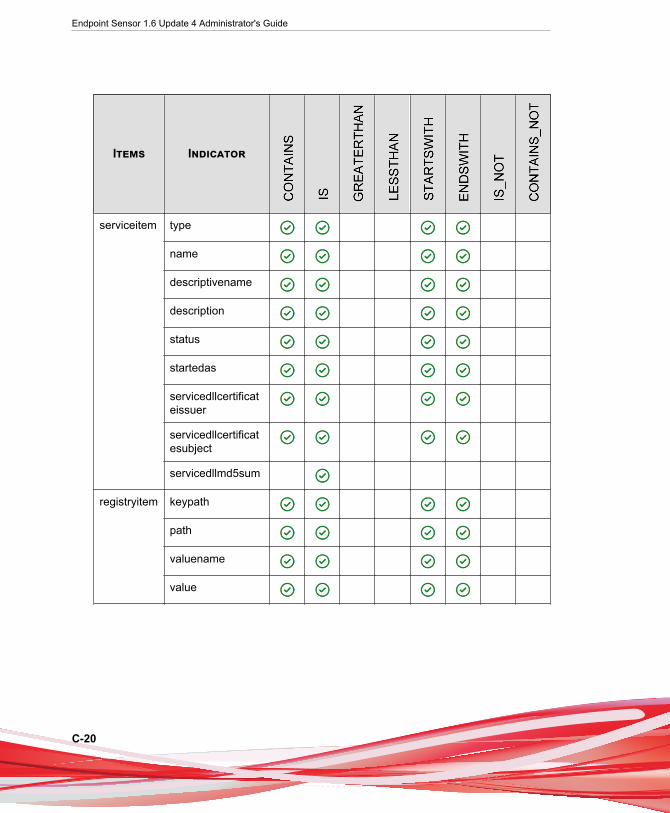
Endpoint Sensor 1.6 Update 4 Administrator's Guide
C-20
Items Indicator
serviceitem type
name
descriptivename
description
status
startedas
servicedllcertificateissuer
servicedllcertificatesubject
servicedllmd5sum
registryitem keypath
path
valuename
value
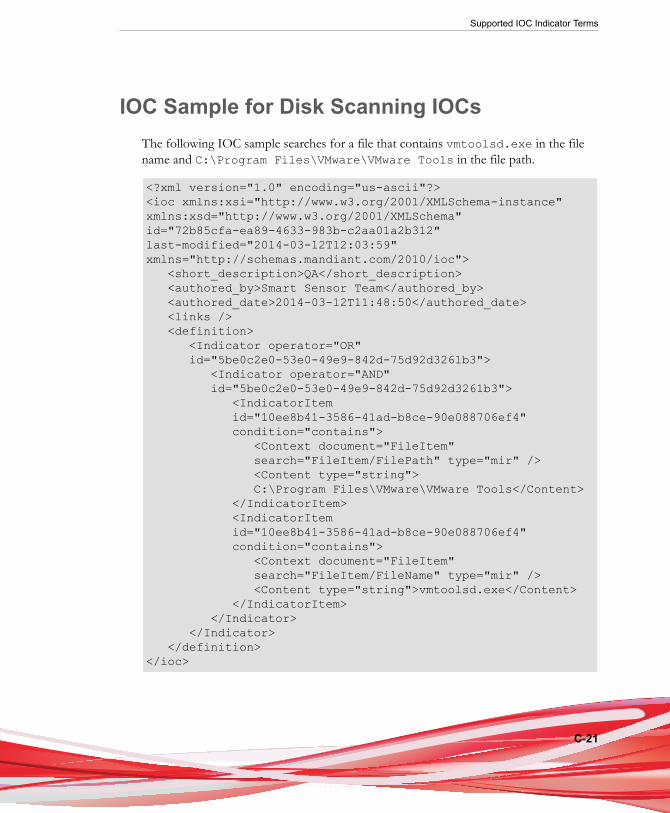
Supported IOC Indicator Terms
C-21
IOC Sample for Disk Scanning IOCsThe following IOC sample searches for a file that contains vmtoolsd.exe in the filename and C:\Program Files\VMware\VMware Tools in the file path.
<?xml version="1.0" encoding="us-ascii"?><ioc xmlns:xsi="http://www.w3.org/2001/XMLSchema-instance"xmlns:xsd="http://www.w3.org/2001/XMLSchema"id="72b85cfa-ea89-4633-983b-c2aa01a2b312"last-modified="2014-03-12T12:03:59"xmlns="http://schemas.mandiant.com/2010/ioc"> <short_description>QA</short_description> <authored_by>Smart Sensor Team</authored_by> <authored_date>2014-03-12T11:48:50</authored_date> <links /> <definition> <Indicator operator="OR" id="5be0c2e0-53e0-49e9-842d-75d92d3261b3"> <Indicator operator="AND" id="5be0c2e0-53e0-49e9-842d-75d92d3261b3"> <IndicatorItem id="10ee8b41-3586-41ad-b8ce-90e088706ef4" condition="contains"> <Context document="FileItem" search="FileItem/FilePath" type="mir" /> <Content type="string"> C:\Program Files\VMware\VMware Tools</Content> </IndicatorItem> <IndicatorItem id="10ee8b41-3586-41ad-b8ce-90e088706ef4" condition="contains"> <Context document="FileItem" search="FileItem/FileName" type="mir" /> <Content type="string">vmtoolsd.exe</Content> </IndicatorItem> </Indicator> </Indicator> </definition></ioc>
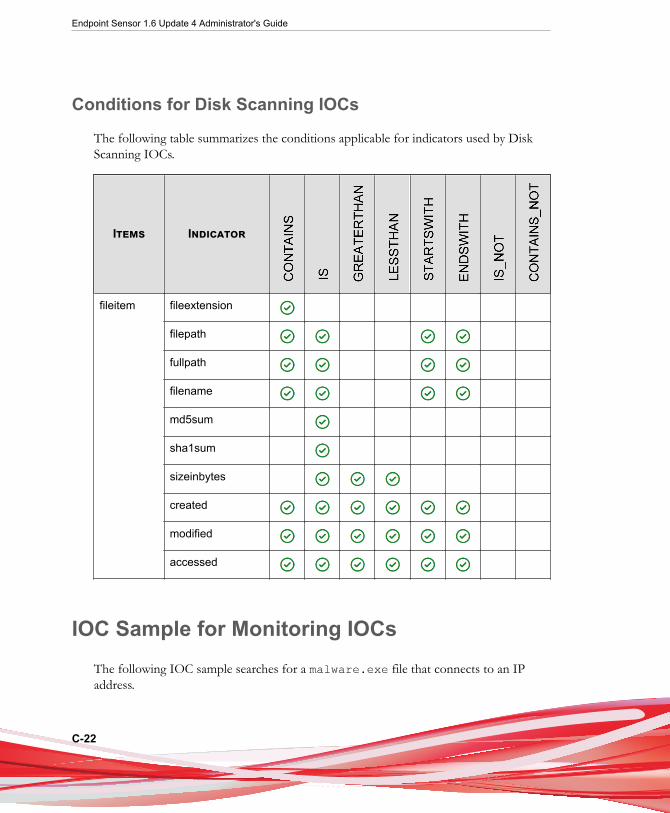
Endpoint Sensor 1.6 Update 4 Administrator's Guide
C-22
Conditions for Disk Scanning IOCs
The following table summarizes the conditions applicable for indicators used by DiskScanning IOCs.
Items Indicator
fileitem fileextension
filepath
fullpath
filename
md5sum
sha1sum
sizeinbytes
created
modified
accessed
IOC Sample for Monitoring IOCsThe following IOC sample searches for a malware.exe file that connects to an IPaddress.
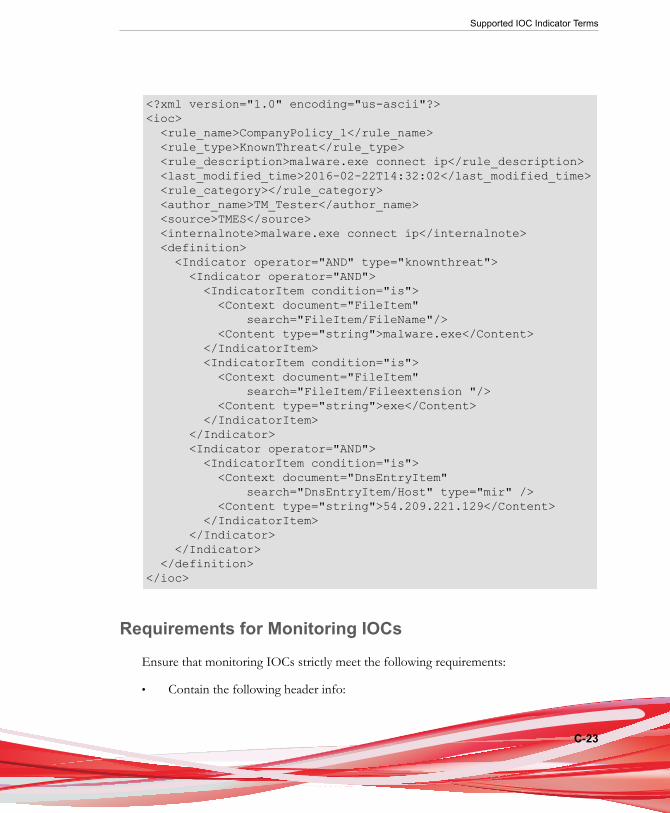
Supported IOC Indicator Terms
C-23
<?xml version="1.0" encoding="us-ascii"?><ioc> <rule_name>CompanyPolicy_1</rule_name> <rule_type>KnownThreat</rule_type> <rule_description>malware.exe connect ip</rule_description> <last_modified_time>2016-02-22T14:32:02</last_modified_time> <rule_category></rule_category> <author_name>TM_Tester</author_name> <source>TMES</source> <internalnote>malware.exe connect ip</internalnote> <definition> <Indicator operator="AND" type="knownthreat"> <Indicator operator="AND"> <IndicatorItem condition="is"> <Context document="FileItem" search="FileItem/FileName"/> <Content type="string">malware.exe</Content> </IndicatorItem> <IndicatorItem condition="is"> <Context document="FileItem" search="FileItem/Fileextension "/> <Content type="string">exe</Content> </IndicatorItem> </Indicator> <Indicator operator="AND"> <IndicatorItem condition="is"> <Context document="DnsEntryItem" search="DnsEntryItem/Host" type="mir" /> <Content type="string">54.209.221.129</Content> </IndicatorItem> </Indicator> </Indicator> </definition></ioc>
Requirements for Monitoring IOCs
Ensure that monitoring IOCs strictly meet the following requirements:
• Contain the following header info:
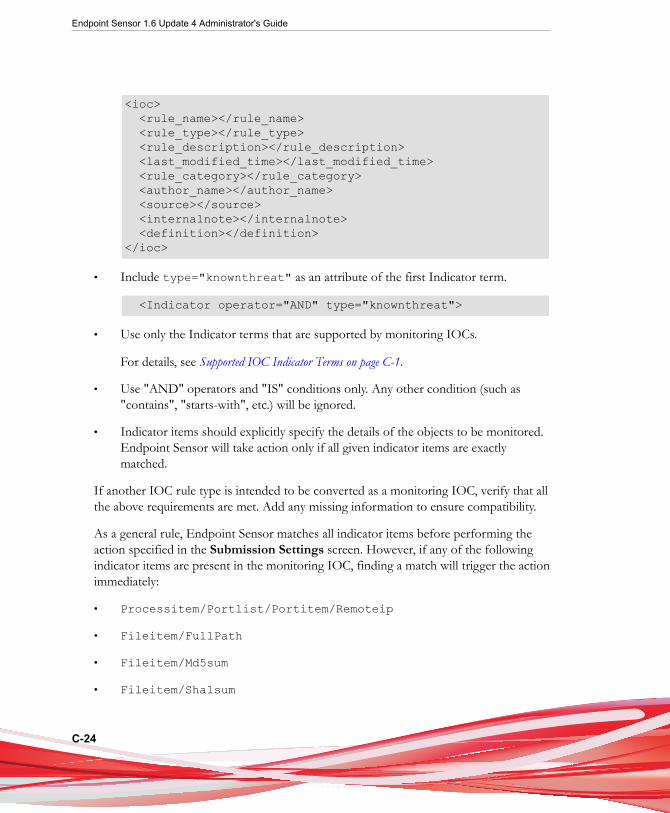
Endpoint Sensor 1.6 Update 4 Administrator's Guide
C-24
<ioc> <rule_name></rule_name> <rule_type></rule_type> <rule_description></rule_description> <last_modified_time></last_modified_time> <rule_category></rule_category> <author_name></author_name> <source></source> <internalnote></internalnote> <definition></definition></ioc>
• Include type="knownthreat" as an attribute of the first Indicator term.
<Indicator operator="AND" type="knownthreat">
• Use only the Indicator terms that are supported by monitoring IOCs.
For details, see Supported IOC Indicator Terms on page C-1.
• Use "AND" operators and "IS" conditions only. Any other condition (such as"contains", "starts-with", etc.) will be ignored.
• Indicator items should explicitly specify the details of the objects to be monitored.Endpoint Sensor will take action only if all given indicator items are exactlymatched.
If another IOC rule type is intended to be converted as a monitoring IOC, verify that allthe above requirements are met. Add any missing information to ensure compatibility.
As a general rule, Endpoint Sensor matches all indicator items before performing theaction specified in the Submission Settings screen. However, if any of the followingindicator items are present in the monitoring IOC, finding a match will trigger the actionimmediately:
• Processitem/Portlist/Portitem/Remoteip
• Fileitem/FullPath
• Fileitem/Md5sum
• Fileitem/Sha1sum
Supported IOC Indicator Terms
C-25
• Portitem/Remoteip
• Dnsentryitem/Host
• Dnsentryitem/Recorddata/Ipv4address
For details, see Submission Settings on page 4-5.

IN-1
IndexAabout
OfficeScan, A-2add schedules, 3-6Administration, 5-2agent
install, A-13monitoring, A-14uninstall, A-17
agent tree, A-14about, A-14specific tasks, A-14synchronize, A-16
appendix, 1
CControl Manager
integration with Trend Micro EndpointSensor, B-3
Ddashboard, 2-4data source
historical records, 3-2system snapshot, 3-2
disk IOC rule, 3-15documentation feedback, 6-6
Eendpoints, 2-7
result details, 3-24
Ffeatures and capabilities, 1-3frequently asked questions, 1-6
Iicons, 3-29information, 3-22installation
agent, A-13plug-in program, A-5status, A-14
investigation, 3-2IOC
disk IOC rule, 3-15rule, 3-12sample for disk scanning IOC, C-21sample for Indicators of Compromise,C-12sample for monitoring IOC, C-22sample for registry IOC, C-13samples for system process IOCs, C-16supported IOC Indicator terms, C-1
IOC rule, 3-12
Mmanagement console, 2-2
Administration, 5-2admin password, 5-7dashboard, 2-4endpoints, 2-7investigation, 3-2investigation results, 3-20logging on, 2-3schedule, 3-8settings, 5-1
matched endpointobject list, 3-31
matched object
Endpoint Sensor 1.6 Update 4 Administrator's Guide
IN-2
icons, 3-29method
disk IOC rule, 3-15IOC rule, 3-12registry search, 3-13Retro Scan, 3-10YARA rule, 3-16
Oobject list, 3-31OfficeScan
synchronize, A-16
Ppassword, 5-7period, 3-3
any, 3-3specific, 3-3
Plug-in Manager, A-2plug-in program
installation, A-5uninstall, A-7
Rrecurrence
repeat, 3-3run once, 3-3
registry search, 3-13result details, 3-24results, 3-20
information, 3-22result details, 3-24root cause chain, 3-25
Retro Scan, 3-10root cause chain, 3-25
contents, 3-29current screen, 3-29
customization options, 3-27
detailed, 3-25
icons, 3-29
options for interested objects, 3-27
Sschedule, 3-3, 3-8
add, 3-6
select targets, 3-4
server, 1-2
database size, 3-36
settings, 5-1
supportresolve issues faster, 6-4
Ttags, 3-3
target, 3-3
select, 3-4
Trend Micro Endpoint Sensorabout, 1-2
server, 1-2
Uuninstallation
agent, A-17
plug-in program, A-7
YYARA rule, 3-16
sample for driver files, 3-18