Conserved Expression of the Arabidopsis ACTT and ACT3 Actin ...
16
The Plant Cell, Vol. 8, 15-30, January 1996 O 1996 American Society of Plant Physiologists Conserved Expression of the Arabidopsis ACTT and ACT3 Actin Subclass in Organ Primordia and Mature Pollen Yong-Qiang An,' Shurong Huang,b John M. McDowell,' Elizabeth C. McKinney,' and Richard 6. Meagher'l' a Department of Genetics, University of Georgia, Athens, Georgia 30602-7223 Lawrence Berkeley Laboratory, University of California-Berkeley, Berkeley, California 94720 Department of Biology, University of North Carolina, Chapel Hill, North Carolina 27599 We have proposed that ancient and divergent classes of plant actin genes have been preserved throughout vascular plant evolution, because they have distinct patterns of gene regulation. The hypothesis was explored for AC7Y and ACT3, which represent one of the six ancient subclasses in the Arabidopsis actin gene family. Comparison of AC7Y and ACT3 cDNA and genomic sequences revealed highly divergent flanking and intron sequences, whereas they encoded nearly identical proteins. Quantification of their leve1 of divergence suggests that they have not shared a common ancestor for 30 to 60 million years. Gene-specific FINA gel blot hybridization and reverse transcriptase-polymerase chain reaction analyses demonstrated that the distribution of AC7Y and ACT3 mRNAs was very similar: both preferentially accumulated at high levels in mature pollen and at very low levels in the other major organs. The 5' flanking regions of both genes, including the promoter, leader exon and intron, and thefirst 19 codons, werefused to the P-giucuronidase (GUS) reporter gene. The expression of these reporter fusions was examined in a large number of transgenic Arabidopsis plants. Histochem- ical assays demonstrated that both ACTT-GUS and ACT3-GUS constructs were expressed preferentially in pollen, pollen tubes, and in all organ primordia, including those in roots, shoots, and the inflorescence. Comparison of the 5' flanking regions of AC7Y and ACT3 revealed a number of short conserved sequences, which may direct their common transcrip- tional and post-transcriptional regulation. The expression patterns observed were distinct from those of any other Arabidopsis actin subclass. The conservation of their expression pattern and amino acid sequences suggests that this actin subclass plays a distinct and required role in the plant cytoskeleton. INTRODUCTION Actin is a fundamental component of the cytoskeleton in all eukaryotes and directs the spatial organization of many crucial subcellular processes. The presence of diverse microfilament configurations has been established in a majority of plant cell types (Parthasarathy et al., 1985; Lloyd, 1991; Meagher and Williamson, 1994). The localization of microfilamentsand some physiologic studies suggest that distinct microfilament arrays govern important processes, including determination of divi- sion plane during cytokinesis, cell elong8!ion, and cell wall deposition, which are Critical to plant development and cell differentiation (Kobayashi et al., 1987; Lloyd, 1991; Cleary et al., 1992). The response of plants to externa1 stimuli, such as the gravitrophism of root growth and light on chloroplaststream- ing and orientation, may also require the actin-based cytoskeleton (White and Sack, 1990; Ytow et al., 1992). The molecular genetic bases for the complex temporal and spa- tia1 regulation of these cytoskeletal processes (Staiger and Schliwa, 1987) are not well understood. To whom correspondence should be addressed Actin is encoded by gene families in most multicellular eu- karyotes. In soybean, the actin gene family encodes at least three subclasses of actin, which are more divergent from one another than vertebrate cytoplasmic actin is from muscle ac- tin (Hightower and Meagher, 1986). Similar observations have been reported in severa1 other plant species (Baird and Meagher, 1987; Drouin and Dover, 1990; McElroyet al., 1990a; Thangavelu et al., 1993). Quantitativeevolutionary studies sug- gest that the different actin subclasses diverged very early in vascular plant evolution, perhaps 300 to 500 million years ago (Hightower and Meagher, 1986). It has been proposedthat such ancient and divergent gene family members have been main- tained in the plant genome because they have distinct patterns of regulation and/or encode proteins with distinct functions. Recent studies have shown that plant actin genes are ex- pressed differentially (Meagher and Williamson, 1994). Three subclasses of soybean actin genes show >10Mold variation in the levels of RNA expressed in various organs. The expres- sion of the p-actin subclass is regulated positively by light and auxin (Hightower and Meagher, 1985). In situ immunolocali-
Transcript of Conserved Expression of the Arabidopsis ACTT and ACT3 Actin ...

The Plant Cell, Vol. 8, 15-30, January 1996 O 1996 American Society of Plant Physiologists
Conserved Expression of the Arabidopsis ACTT and ACT3 Actin Subclass in Organ Primordia and Mature Pollen
Yong-Qiang An,' Shurong Huang,b John M. McDowell,' Elizabeth C. McKinney,' and Richard 6. Meagher'l'
a Department of Genetics, University of Georgia, Athens, Georgia 30602-7223 Lawrence Berkeley Laboratory, University of California-Berkeley, Berkeley, California 94720 Department of Biology, University of North Carolina, Chapel Hill, North Carolina 27599
We have proposed that ancient and divergent classes of plant actin genes have been preserved throughout vascular plant evolution, because they have distinct patterns of gene regulation. The hypothesis was explored for AC7Y and ACT3, which represent one of the six ancient subclasses in the Arabidopsis actin gene family. Comparison of AC7Y and ACT3 cDNA and genomic sequences revealed highly divergent flanking and intron sequences, whereas they encoded nearly identical proteins. Quantification of their leve1 of divergence suggests that they have not shared a common ancestor for 30 to 60 million years. Gene-specific FINA gel blot hybridization and reverse transcriptase-polymerase chain reaction analyses demonstrated that the distribution of AC7Y and ACT3 mRNAs was very similar: both preferentially accumulated at high levels in mature pollen and at very low levels in the other major organs. The 5' flanking regions of both genes, including the promoter, leader exon and intron, and thefirst 19 codons, werefused to the P-giucuronidase (GUS) reporter gene. The expression of these reporter fusions was examined in a large number of transgenic Arabidopsis plants. Histochem- ical assays demonstrated that both ACTT-GUS and ACT3-GUS constructs were expressed preferentially in pollen, pollen tubes, and in all organ primordia, including those in roots, shoots, and the inflorescence. Comparison of the 5' flanking regions of AC7Y and ACT3 revealed a number of short conserved sequences, which may direct their common transcrip- tional and post-transcriptional regulation. The expression patterns observed were distinct from those of any other Arabidopsis actin subclass. The conservation of their expression pattern and amino acid sequences suggests that this actin subclass plays a distinct and required role in the plant cytoskeleton.
INTRODUCTION
Actin is a fundamental component of the cytoskeleton in all eukaryotes and directs the spatial organization of many crucial subcellular processes. The presence of diverse microfilament configurations has been established in a majority of plant cell types (Parthasarathy et al., 1985; Lloyd, 1991; Meagher and Williamson, 1994). The localization of microfilaments and some physiologic studies suggest that distinct microfilament arrays govern important processes, including determination of divi- sion plane during cytokinesis, cell elong8!ion, and cell wall deposition, which are Critical to plant development and cell differentiation (Kobayashi et al., 1987; Lloyd, 1991; Cleary et al., 1992). The response of plants to externa1 stimuli, such as the gravitrophism of root growth and light on chloroplast stream- ing and orientation, may also require the actin-based cytoskeleton (White and Sack, 1990; Ytow et al., 1992). The molecular genetic bases for the complex temporal and spa- tia1 regulation of these cytoskeletal processes (Staiger and Schliwa, 1987) are not well understood.
To whom correspondence should be addressed
Actin is encoded by gene families in most multicellular eu- karyotes. In soybean, the actin gene family encodes at least three subclasses of actin, which are more divergent from one another than vertebrate cytoplasmic actin is from muscle ac- tin (Hightower and Meagher, 1986). Similar observations have been reported in severa1 other plant species (Baird and Meagher, 1987; Drouin and Dover, 1990; McElroyet al., 1990a; Thangavelu et al., 1993). Quantitative evolutionary studies sug- gest that the different actin subclasses diverged very early in vascular plant evolution, perhaps 300 to 500 million years ago (Hightower and Meagher, 1986). It has been proposed that such ancient and divergent gene family members have been main- tained in the plant genome because they have distinct patterns of regulation and/or encode proteins with distinct functions.
Recent studies have shown that plant actin genes are ex- pressed differentially (Meagher and Williamson, 1994). Three subclasses of soybean actin genes show >10Mold variation in the levels of RNA expressed in various organs. The expres- sion of the p-actin subclass is regulated positively by light and auxin (Hightower and Meagher, 1985). In situ immunolocali-
16 The Plant Cell
zation has demonstrated that the h subclass of actins is expressed strongly and preferentially in root protoderm (McLean et al., 1990), whereas the K subclass of actins ac- cumulates in all root tissues except root cap. Two rice actin genes also exhibit differential RNA expression during early seedling development (McElroy et al., 1990a). One rice actin gene, RAcl, is constitutively expressed in many tissues in trans- genic plants (Zhang et al., 1991). JAc25, a tobacco actin gene, was preferentially expressed in mature pollen (Thangavelu et al., 1993). These initial data suggest a diversityof plant actin expression patterns to match the diversity in plant actins.
We hope to understand the forces that have preserved the ancient plant actin gene family and the functions of each actin gene member. This requires a comprehensive characteriza- tion of all actin gene family members in one organism and a detailed examination of the expression pattern of each family member at the tissue level. Arabidopsis appears to be an ex- cellent organism for this undertaking, because it has a relatively simple actin gene family (McDowell et al., 1996) and a small genome that affords a comprehensive characterization (Meyerowitz, 1989). The 10 Arabidopsis actin genes that have been isolated and sequenced in our laboratory, including the two presented herein, probably represent the entire actin gene family (McDowell et al., 1996). Based on the level of replace- ment nucleotide substitution (FINS), the genes are divided into six subclasses, which show the level of divergence observed previously among plant actin family members. Any two sub- classes differ by 3 to 9% RNS and are thought to be >200 million years diverged from a common ancestral sequence (McDowell et al., 1996).
In this study, we present the isolation and characterization of one Arabidopsis actin subclass, that encoding ACTl and AC73, and we explore the hypothesis that the diverse actin gene subclasses are regulated differentially. These two actins are only ~ 3 0 to 60 million years diverged from a common ancestral actin gene (McDowell et al., 1996). Their detailed tissue-specific expression patterns are examined at various developmental stages. ACJl (Nairn et al., 1988) and ACT3 encode nearly iden- tical proteins, with only one conservative amino acid difference, and yet their level of nucleotide divergence isvery high in silent nucleotide sites within codons, in noncoding flanking regions, and in introns. 60th genes were expressed preferentially in mature pollen and pollen tubes and in all organ primordia exami ned.
RESULTS
lsolation and Characterization of AC7Y and ACT3
Two different Arabidopsis genomic libraries were screened with either Dictyostelium actin cDNA or soybean actin genomic DNA fragments as probes. Ninety-one recombinant phages that hy- bridized to either probe were randomly selected from the
positive clones and subjected to partial characterization. Of the 91 clones, six were defined as ACJl and 12 as ACT3. Com- plete sequence analysis revealed that ACTl and ACT3 each encoded 377-amino acid actin proteins that were nearly iden- tical (see Discussion), and these were placed into a separate
A ACTl ATG 20 21 152 356 357 TGA
\ \
2.7kb B g h a m H I
B ACT3 356 357 TGA
\ \
2.1Kb
C T137
. ._ 4 T137 ACT3
Figure 1. Gene Structures and GUS Fusion for ACTl and ACT3, and the Close Linkage between T737 and ACT3.
(A) and (9) The physical structures of ACTl (top) and ACT3 (top) were characterized in detail. 60th ACTl and ACT3 encode 377-amino acid proteins. The translated portions of exons are denoted by heavily striped boxes, untranslated portions of the mature transcripts by open boxes, and introns and nontranscribed flanking regions by lines. The lengths of the introns in base pairs are indicated. The number at the bound- aries of each exon indicates the codon(s) at which the intron is located. lntron 2 splits glycine codon 152 in phase 2. The positions of the trans- lational initiation site (ATG) and stop codon are also indicated. Both ACTl and ACT3 have multiple transcriptional start sites and polyade- nylation sites. The 5’ flanking regions of ACTl (bottom) and ACT3 (bottom), including the promoter region, exon L, intron L, and the first 19 codons, were fused in frame to the GUS reporter gene (boxes la- beled GUS) at the BamHl site of the pBI101.1 binary expression vector. The 3’ region of the nopaline synthase gene (open boxes) provided 3‘ RNA processing and polyadenylation signals. The lengths of the 5’ flanking regions and cloning sites used for fusion constructs are indicated. (C) The partial structure of the T737gene and its proximity to theACT3 gene are shown. A partial sequence of the cDNA, T137, was found -300 bp upstream from ACT3. T137 and ACT3 are transcribed in oppo- site directions (indicated by long arrows), and their TATA boxes (ATAT for T137) are only 270 bp apart (the two-headed arrow). The unique transcriptional start site mapped for T137 is indicated with the arrow labeled (TS). Based on the available T137cDNA sequence, its coding region (heavily striped box) and 5’ UTR (open box) are indicated. The putative translational start codon (ATG) is marked by GTA, because the T737 gene is shown in reverse orientation. nt, nucleotide.

Expression of Actin Genes ACTl and ACT3 17
A a t l -1190 TT A c t 3 -1250 AA
Figure 2. Alignment of the ACTl and ACT3 5' Flanking Sequences Reveals Conserved Elements
Approximately 1.6 kb of 5' flanking sequences, including the first 19 codons of ACT7, were aligned with the corresponding sequence of ACT3. The nucleotides are numbered from the translational initiation site (the A of ATG initiator is +I). ldentical nucleotides shared by both sequences are highlighted with a black background. The first 19 amino acids of ACTl and ACT3 are also identical and are shown under the corresponding nucleotide sequences. The putative TATA boxes, the transcriptional start sites, the 5' and 3'splicing sites of intron L (lines with arrows), and the start codon are indicated. The boundaries of the pyrimidine-rich regions are marked by vertical lines and are numbered. The cDNA, T137, was located upstream and transcribed in the opposite direction from ACT3. The sequences complementary to the T137cDNA are underlined by gray boxes. The translational initiation site (GTA 57, transcription start sites (lines with arrows), and TATA box (3'ATAT) of T737 are marked. ACTl and ACT3 have GenBank accession numbers U39449 and U39480, respectively.
actin subclass (McDowell et al., 1996). ACT7 was identical to the only previously identified Arabidopsis actin gene sequence, which has been partially sequenced (Nairn et al., 1988). Figures 1A and 16 show the complete gene structures of ACT7 and ACT3. Based on comparison with known plant actin sequences, three introns were identified in each coding sequence; all were <138 bp. They were positioned between codons 20 and 21, within codon 152, and between codons 356 and 357. These locations are identical to those in most characterized plant actin genes (Meagher and Williamson, 1994). A few well-character- ized plant actin genes have been shown to contain a large intron in the 5' untranslated region (5' UTR) of the mRNA (McElroy et al., 1990b; Pearson and Meagher, 1990). To determine whether ACT7 and ACT3 have an intron in this position, the 5' UTRs of their cDNAs were amplified from a flower cDNA library by a polymerase chain reaction (PCR) protocol (see de-
tails in Methods). Comparison of the sequences of the PCR products with the genomic sequences revealed that both ACT7 and AC73 had relatively large introns (423 and 483 bp, respec- tively) 10 nucleotides upstream from the ATG initiation codon.
Primer extension analysis of RNA from pollen indicated that ACT7 transcription started at three sites spaced m25 bp apart (Figure 2). The strongest extension product was located at 110 nucleotides (ts2) from the translation starting site of the tran- script. A putative TATA box was found 32 nucleotides upstream of this start site. The two weak primer extension products, tsl and ts3, located the 5'ends of transcripts at 135 and 87 nucleo- tides, respectively, upstream of the translational start site. To confirm that the weaker upstream site was in fact used, we performed a reverse transcriptase-PCR (RT-PCR) analysis of the tsl product. A sense oligonucleotide, ACT1-5S1, homolo- gous to the proposed RNA sequence between the tsl and ts2

18 The Plant Cell
sites, and an antisense oligonucleotide in the first coding exonwere used successfully as primers in a PCR assay to amplifythis sequence from a floral cDNA library (data not shown). Thisresult suggested that some transcription was initiated upstreamof the ts2 site. Ribonuclease protection assays of the ACT3mRNA mapped a cluster of 5' ends ~115 nucleotides from thetranslational initiation codon as shown in Figure 2. The strong-est potential start site was located at 115 nucleotides (ts3),whereas four other weaker products placed sites at 128 (ts1),120 (ts2), 110 (ts4), and 106 (ts5) nucleotides. The TATA box,located 37 nucleotides upstream of this site, is apparently con-served between ACT1 and ACT3. Multiple start sites have beenfound in many of the plant actin transcripts that have beenexamined in detail (Pearson and Meagher, 1990).
Although ACT1 and ACT3 encoded nearly identical proteinswith one conservative amino acid difference (see Discussion),the nucleotide sequences of the introns (data not shown) and5'(Figure 2) and 3'(data not shown) flanking regions were highlydivergent. However, the 5' flanking sequence also containeda few conserved sequence blocks. Most obvious was a 55-bpcontiguous sequence with 50 bp of identity, which includedthe putative TATA box. Eleven more sequence blocks with morethan six nucleotides of identity were found in the 1.5-kb 5' flank-ing sequence. Several short insertions or deletions were alsofound in the 5' flanking region. In addition, each gene had apyrimidine-rich stretch located in the leader exon and the ad-jacent region of its promoter. Within a 108-nucleotide sequencein ACT1, 96 nucleotides were pyrimidines, whereas 75 of 98nucleotides were pyrimidines in the corresponding region ofACT3. In addition, CCT, CCTT, and TTC repeats dominated theACT1 pyrimidine-rich region.
To define precisely the polyadenylation sites of ACT1 andACT3, 3' cDNA fragments of ACT! and ACT3 were amplifiedby a modified 3' rapid amplification of cDNA ends (RACE-PCR)procedure (see Methods) from a flower cDNA library and clonedinto pBluescript II SK+ vector. The 3' ends of a number of in-dependent ACT? and AC73cDNA clones were sequenced. Fourpolyadenylation sites were found in seven independent ACT1clones. They were located 205, 208, 229, and 315 bp down-stream of the stop codon. Polyadenylation at position 208 wasfound in four clones and, thus, it might be a preferential sitefor polyadenylation or an artifact of PCR amplification and clon-ing. Three polyadenylation sites were found among threeclones of ACT3, and they were located 246, 270, and 273 bpdownstream of the stop codon (3' sequences are not shown).
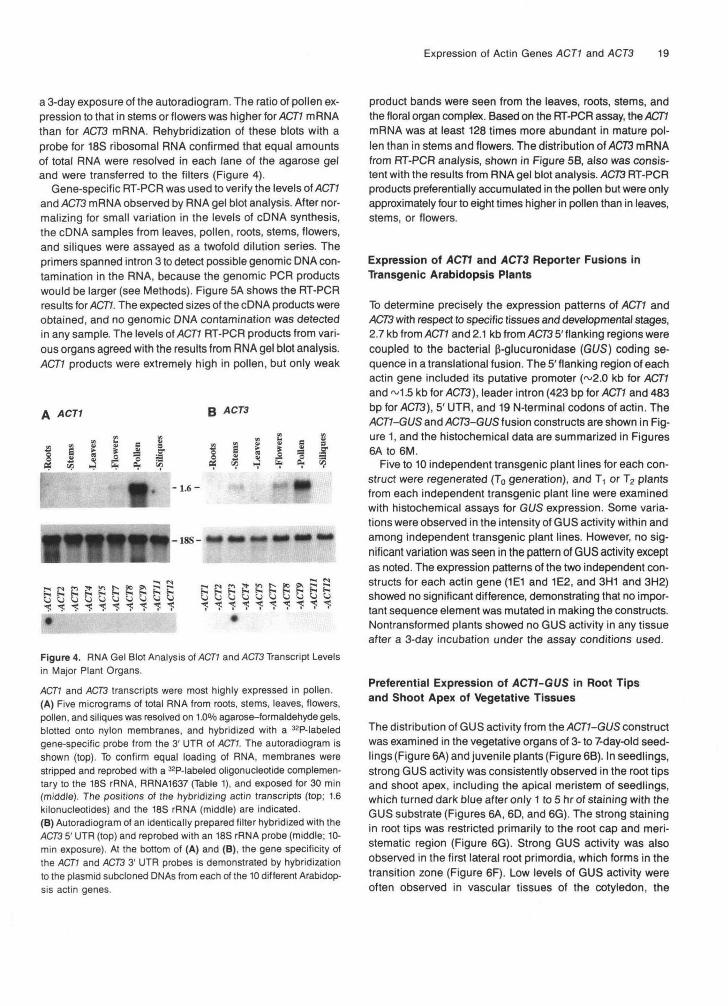
To investigate whether other genes are closely related toACTIand ACT3,5' flanking sequences from ACT1 and ACT3 (2.7 and2.1 kb, respectively) were used as gene-specific probes forArabidopsis genomic DNA. Figures 3A and 3B show the hy-bridization results. Among the five different restriction enzymedigestions (EcoRI, Hindlll, Bglll, Xbal, and Hindi), all produceda single hybridizing band, except the lane containing Xbal for>4C73. From the available sequence, Xbal digestion cleaves1.2 kb upstream of the ACT3 start codon, resulting in twofragments that hybridize to the probe. These and similar ex-
3 ° a -a ?8 .a 1) 1 .afid S3 BQ X 03
B
3
— 243-— 9.5 -— 6.7 -— 4.2 -
— 2.2 -— 2.0 -
Figure 3. Genomic DNA Gel Blot Analysis.ACT1 and ACT3 are each unique sequences in the Arabidopsis genome.(A) Five micrograms of genomic DNA restricted with EcoRI, Hindlll,Bglll, Xbal, or Hincll and resolved on a 0.8% agarose gel was blottedto a nylon membrane and hybridized with a 32P-labeled ACT1 5' re-gion gene-specific probe.(B) A parallel set of restriction endonuclease-digested genomic DNAon a nylon membrane hybridized with the ACT3 5' region gene-spe-cific probe. Positions of the molecular length markers in kilobases areshown between the two autoradiograms. Hybridization conditions aredescribed in Methods.
periments with probes derived from the 3' UTRs (McDowelletal., 1996) strongly suggest that ACT1 and-4C73 are encodedby single genes in Arabidopsis.
Preferential Accumulation of ACT1 and ACT3 mRNA inMature Pollen
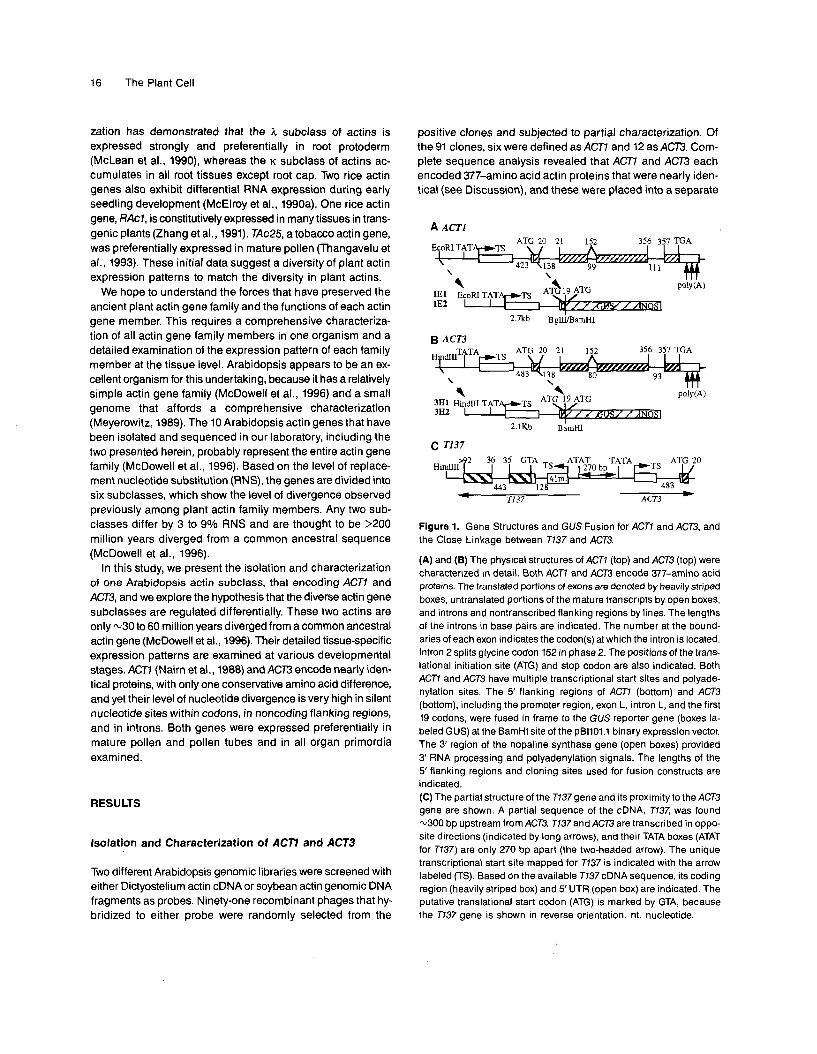
RNA gel blot hybridization was used to investigate the distri-bution of ACT1 and ACTS mRNAs in various organs. The 3'untranslated regions (3' UTRs) of ACT1 and ACT3 were highlydivergent from each other and from the other Arabidopsis ac-tin genes and were used as gene-specific probes for RNA gelblot analysis. The 3' UTRs o\ACT1 and ACT3 did not show cross-hybridization with any other Arabidopsis actin genomic DNA,as shown at the bottom of Figures 4A and 4B. Total RNA wasisolated from roots, stems, leaves, flowers, pollen, and siliquesand loaded in each lane in equal amounts. Both ACT1 and ACTSmRNAs were accumulated preferentially in the pollen and are~1.6 kilonucleotides in length (Figure 4, top). The levels of ACT1RNA were extremely high in pollen, whereas only weak hy-bridization signals were detected in the stems and flowers. Novisible signals were detected in roots, leaves, or siliques after
Expression of Actin Genes ACT1 and ACT3 19
a 3-day exposure of the autoradiogram. The ratio of pollen ex-pression to that in stems or flowers was higher for ACJ1 mRNAthan for ACT3 mRNA. Rehybridization of these blots with aprobe for 18S ribosomal RNA confirmed that equal amountsof total RNA were resolved in each lane of the agarose geland were transferred to the filters (Figure 4).
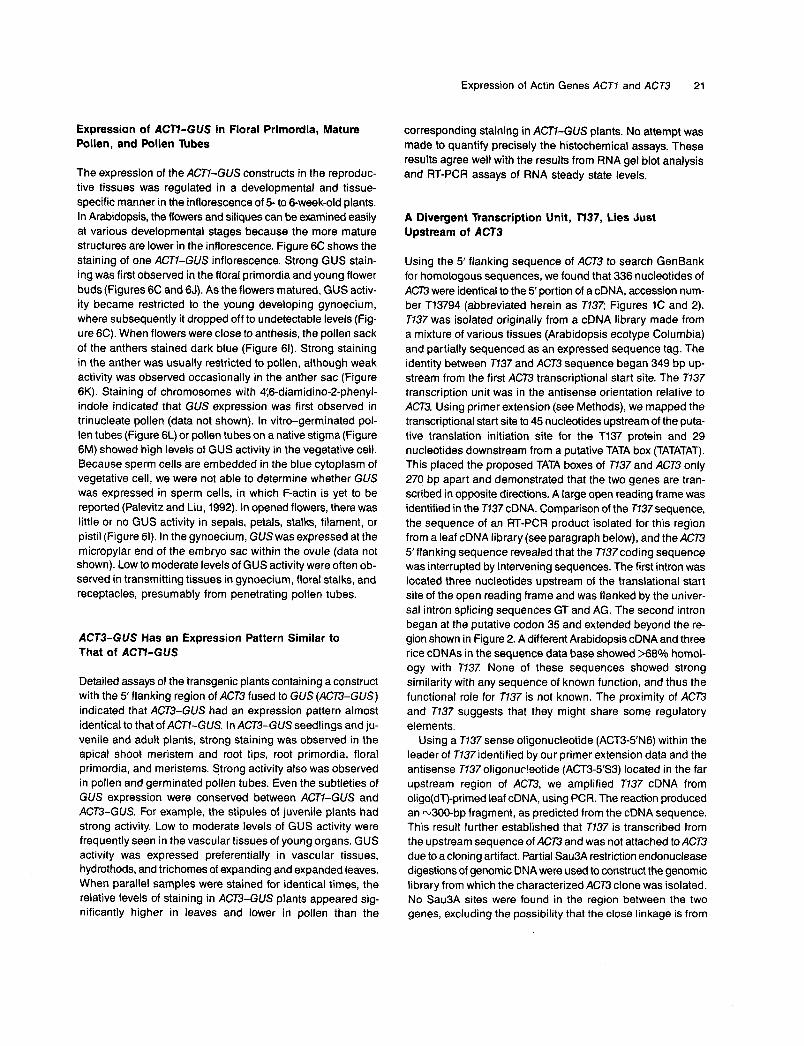
Gene-specific RT-PCR was used to verify the levels of ACT1and ACT3 mRNA observed by RNA gel blot analysis. After nor-malizing for small variation in the levels of cDNA synthesis,the cDNA samples from leaves, pollen, roots, stems, flowers,and siliques were assayed as a twofold dilution series. Theprimers spanned intron 3 to detect possible genomic DNA con-tamination in the RNA, because the genomic PCR productswould be larger (see Methods). Figure 5A shows the RT-PCRresults for ACT1. The expected sizes of the cDNA products wereobtained, and no genomic DNA contamination was detectedin any sample. The levels of ACT1 RT-PCR products from vari-ous organs agreed with the results from RNA gel blot analysis.ACT1 products were extremely high in pollen, but only weak
A ACT1
111!
ACT3
1 §f
-1.6-
6 6 B S B B 6 S B
Figure 4. RNA Gel Blot Analysis of ACT1 and ACT3 Transcript Levelsin Major Plant Organs.ACT1 and ACT3 transcripts were most highly expressed in pollen.(A) Five micrograms of total RNA from roots, stems, leaves, flowers,pollen, and siliques was resolved on 1.0% agarose-formaldehyde gels,blotted onto nylon membranes, and hybridized with a 32P-labeledgene-specific probe from the 3' UTR of ACT1. The autoradiogram isshown (top). To confirm equal loading of RNA, membranes werestripped and reprobed with a 32P-labeled oligonucleotide complemen-tary to the 18S rRNA, RRNA1637 (Table 1), and exposed for 30 min(middle). The positions of the hybridizing actin transcripts (top; 1.6kilonucleotides) and the 18S rRNA (middle) are indicated.(B) Autoradiogram of an identically prepared filter hybridized with theACTS 5' UTR (top) and reprobed with an 18S rRNA probe (middle; 10-min exposure). At the bottom of (A) and (B), the gene specificity ofthe ACJ1 and ACT3 3' UTR probes is demonstrated by hybridizationto the plasmid subcloned DNAs from each of the 10 different Arabidop-sis actin genes.
product bands were seen from the leaves, roots, stems, andthe floral organ complex. Based on the RT-PCR assay, the ACT1mRNA was at least 128 times more abundant in mature pol-len than in stems and flowers. The distribution of ACT3 mRNAfrom RT-PCR analysis, shown in Figure 5B, also was consis-tent with the results from RNA gel blot analysis. ACJ3 RT-PCRproducts preferentially accumulated in the pollen but were onlyapproximately four to eight times higher in pollen than in leaves,stems, or flowers.
Expression of ACT! and ACTS Reporter Fusions inTransgenic Arabidopsis Plants
To determine precisely the expression patterns of ACT1 andACT3 with respect to specific tissues and developmental stages,2.7 kb from ACT1 and 2.1 kb from ACJ3 5' flanking regions werecoupled to the bacterial (J-glucuronidase (GUS) coding se-quence in a translational fusion. The 5' flanking region of eachactin gene included its putative promoter (~2.0 kb for ACT1and^1.5kbforX\C73), leader intron (423 bp for ACT1 and 483bp forX\C73), 5' UTR, and 19 N-terminal codons of actin. TheACT1-GUS and ACT3-GUS fusion constructs are shown in Fig-ure 1, and the histochemical data are summarized in Figures6A to 6M.
Five to 10 independent transgenic plant lines for each con-struct were regenerated (T0 generation), and T, or T2 plantsfrom each independent transgenic plant line were examinedwith histochemical assays for GUS expression. Some varia-tions were observed in the intensity of GUS activity within andamong independent transgenic plant lines. However, no sig-nificant variation was seen in the pattern of GUS activity exceptas noted. The expression patterns of the two independent con-structs for each actin gene (1E1 and 1E2, and 3H1 and 3H2)showed no significant difference, demonstrating that no impor-tant sequence element was mutated in making the constructs.Nontransformed plants showed no GUS activity in any tissueafter a 3-day incubation under the assay conditions used.
Preferential Expression of ACT1-GUS in Root Tipsand Shoot Apex of Vegetative Tissues
The distribution of GUS activity from the ACT1-GUS constructwas examined in the vegetative organs of 3- to 7-day-old seed-lings (Figure 6A) and juvenile plants (Figure 6B). In seedlings,strong GUS activity was consistently observed in the root tipsand shoot apex, including the apical meristem of seedlings,which turned dark blue after only 1 to 5 hr of staining with theGUS substrate (Figures 6A, 6D, and 6G). The strong stainingin root tips was restricted primarily to the root cap and meri-stematic region (Figure 6G). Strong GUS activity was alsoobserved in the first lateral root primordia, which forms in thetransition zone (Figure 6F). Low levels of GUS activity wereoften observed in vascular tissues of the cotyledon, the

20 The Plant Cell
A ACT1Leaves Pollen < <
Crt
•3 CNt" -̂1 T;
OO CN ^ "< N C N C N V D — i Q Q ^ S
00,0^-1 CN o o \ o ( N ~ l T l - - - | l ^ l / ^ ^ S}- „ —— 1 'S' ^H VO CS + 1 Ml
Roots Siliques Stems Flowers
B AC73Root Leaves Stem
Flowers Pollen Siliques
C T137Root Pollen
Stem Flowers Siliques
<N oo v- -
l~\2 CN oo vo i
Figure 5. RT-PCR Analysis of ACT1, ACT3, and 7737Transcript Levelsin Major Plant Organs and Pollen.
hypocotyl, and the youngest portions of the root, whereas theother tissues of the seedling showed no or little GUS activity(Figure 6A). The variability in young vascular tissue expres-sion can be seen by comparing Figures 6A, 6D, and 6F.
In juvenile plants ~3 weeks old, the root system showed es-sentially the same expression pattern as in seedlings (Figure6B). GUS activity continued at the highest levels in the roottips and was strong in lateral root primordia. Little or no GUSactivity was observed in tissues surrounding the lateral rootprimordia, including the pericycle, which differentiates into theprimordia. This suggests that the activation of ACT1-GUS tran-scription was concomitant with the initiation of the lateral rootprimordia (Figure 6H). Low to moderate levels of GUS activitywere again observed in the young vascular tissue (Figure 6B).
In aerial tissues of juvenile plants, the shoot apex continuedto show the higher levels of GUS activity (Figure 6E). The ad-jacent stipules also stained dark blue (Figure 6E). Expandingand expanded leaves showed highly variable levels of GUSactivity. The staining in expanded leaves from different trans-genic plants ranged from no GUS activity to moderate levelsof GUS activity. The younger leaves consistently showed muchhigher levels of GUS activity than older leaves (Figure 6B).In those plants in which GUS was still expressed in fully ex-panded leaves, the activity was located preferentially in thevascular tissue, hydrathodes, and trichomes.
(A) Total RNA from leaves, pollen, roots, stems, flowers, and siliqueswas reverse transcribed. Five nanograms of cDNA from each organwas dispensed in a twofold dilution series. For example, the first sam-ple (1x) has 2.5 ng of input cDNA, the second (2x) has 1.25 ng, thethird (4x) has 0.625 ng, the fourth (8x) has 0.312 ng, and so forth.Each sample was then subjected to ACT1 gene-specific PCR amplifi-cation of a 3' portion of the gene spanning one intron in the genomicDNA. One-tenth of the product was resolved in a 1.5% agarose gel.The tissues and the level of dilution (1x to512x)are indicated abovethe corresponding products. The dilution half-point (i.e., the dilutionbetween the lowest cDNA input that produced a visible band and thecDNA input at which the reaction is still saturated) was estimated (seeMethods).(B) An identically prepared dilution series of cDNAs was subjectedto ACT3 gene-specific PCR amplification of a 3' portion of the genespanning one intron in the genomic DNA.(C) An identically prepared dilution series of cDNAs was subjectedto 7737 gene-specific PCR amplification of a 5' portion of the genespanning one intron in the genomic DNA.The positive controls ( +DNA) contain the PCR amplification productsof ACTT, ACT3, and 7737 genomic DNA and indicate the position ofa band expected if any cDNA sample was contaminated with genomicDNA. The negative controls (- DNA) contain the reaction products with-out input DNA. Alul-digested pBR322 was used as a size standard.(See details in Methods.)
Expression of Actin Genes ACJ7 and ACJ3 21
Expression of ACTI-GUS in Floral Primordia, Mature Pollen, and Pollen Tubes
The expression of the ACT1-GUS constructs in the reproduc- tive tissues was regulated in a developmental and tissue- specific manner in the inflorescence of 5- to 6-week-old plants. In Arabidopsis, the flowers and siliques can be examined easily at various developmental stages because the more mature structures are lower in the inflorescence. Figure 6C shows the staining of one ACT7-GUS inflorescence. Strong GUS stain- ing was first observed in the floral primordia and young flower buds (Figures 6C and 6J). As the flowers matured, GUS activ- ity became restricted to the young developing gynoecium, where subsequently it dropped off to undetectable levels (Fig- ure 6C). When flowers were close to anthesis, the pollen sack of the anthers stained dark blue (Figure 61). Strong staining in the anther was usually restricted to pollen, although weak activity was observed occasionally in the anther sac (Figure 6K). Staining of chromosomes with 4:6-diamidino-2-phenyC indole indicated that GUS expression was first observed in trinucleate pollen (data not shown). In vitro-germinated pol- len tubes (Figure 6L) or pollen tubes on a native stigma (Figure 6M) showed high levels of GUS activity in the vegetative cell. Because sperm cells are embedded in the blue cytoplasm of vegetative cell, we were not able to determine whether GUS was expressed in sperm cells, in which F-actin is yet to be reported (Palevitz and Liu, 1992). In opened flowers, there was little or no GUS activity in sepals, petals, stalks, filament, or pistil (Figure 61). In the gynoecium, GUS was expressed at the micropylar end of the embryo sac within the ovule (data not shown). Low to moderate levels of GUS activity were often ob- served in transmitting tissues in gynoecium, floral stalks, and receptacles, presumably from penetrating pollen tubes.
ACT3-GUS Has an Expression Pattern Similar to That of ACn-GUS
Detailed assays of the transgenic plants containing a construct with the 5'flanking region of ACT3 fused to GUS (ACT3-GUS) indicated that ACT3-GUS had an expression pattern almost identical to that of ACT1-GUS. In ACT3-GUS seedlings and ju- venile and adult plants, strong staining was observed in the apical shoot meristem and root tips, root primordia, floral primordia, and meristems. Strong activity also was observed in pollen and germinated pollen tubes. Even the subtleties of GUS expression were conserved between ACT1-GUS and ACT3-GUS. For example, the stipules of juvenile plants had strong activity. Low to moderate levels of GUS activity were frequently seen in the vascular tissues of young organs. GUS activity was expressed preferentially in vascular tissues, hydrothods, and trichomes of expanding and expanded leaves. When parallel samples were stained for identical times, the relative levels of staining in ACT3-GUS plants appeared sig- nificantly higher in leaves and lower in pollen than the
corresponding staining in ACT7-GUS plants. No attempt was made to quantify precisely the histochemical assays. These results agree well with the results from RNA gel blot analysis and RT-PCR assays of RNA steady state levels.
A Divergent Transcription Unit, TI37, Lies Just Upstream of ACT3
Using the 5' flanking sequence of ACT3 to search GenBank for homologous sequences, we found that 336 nucleotides of ACT3 were identical to the 5 portion of a cDNA, accession num- ber T13794 (abbreviated herein as 7737; Figures 1C and 2). T137 was isolated originally from a cDNA library made from a mixture of various tissues (Arabidopsis ecotype Columbia) and partially sequenced as an expressed sequence tag. The identity between T737 and ACT3 sequence began 349 bp up- stream from the first ACT3 transcriptional start site. The T137 transcription unit was in the antisense orientation relative to ACT3. Using primer extension (see Methods), we mapped the transcriptional start site to 45 nucleotides upstream of the puta- tive translation initiation site for the T137 protein and 29 nucleotides downstream from a putative TATA box (TATATAT). This placed the proposed TATA boxes of T137 and ACT3 only 270 bp apart and demonstrated that the two genes are tran- scribed in opposite directions. A large open reading frame was identified in the T737 cDNA. Comparison of the Jl37sequence, the sequence of an RT-PCR product isolated for this region from a leaf cDNA library(see paragraph below), and theACT3 5'flanking sequence revealed that the T737coding sequence was interrupted by intervening sequences. The first intron was located three nucleotides upstream of the translational start site of the open reading frame and was flanked by the univer- sal intron splicing sequences GT and AG. The second intron began at the putative codon 35 and extended beyond the re- gion shown in Figure 2. A different Arabidopsis cDNA and three rice cDNAs in the sequence data base showed >68% homol- ogy with T13Z None of these sequences showed strong similarity with any sequence of known function, and thus the functional role for T737 is not known. The proximity of ACT3 and T137 suggests that they might share some regulatory elements.
Using a T737 sense oligonucleotide (ACT3-5"6) within the leader of T737identified by our primer extension data and the antisense T737 oligonuc!eotide (ACT3-5S3) located in the far upstream region of ACT3, we amplified T737 cDNA from oligo(dT)-primed leaf cDNA, using PCR. The reaction produced an -300-bp fragment, as predicted from the cDNA sequence. This result further established that 7137 is transcribed from the upstream sequence of ACT3 and was not attached to ACT3 dueto a cloning artifact. Partia1 Sau3A restriction endonuclease digestions of genomic DNA were used to construct the genomic library from which the characterized ACT3 clone was isolated. No Sau3A sites were found in the region between the two genes, excluding the possibility that the close linkage is from

22 The Plant Cell
Figure 6. ACT1-GUS and ACT3-GUS Fusions Are Highly Expressed in Organ Primordia and Mature Pollen.
The expression of translational fusions of the ACT1 and ACJ3 5' regions (Figure 1) with the GUS reporter gene was examined in transgenic Arabidopsisplants. ACT1-GUS expression in plants and organs as visualized by histochemical staining is shown.
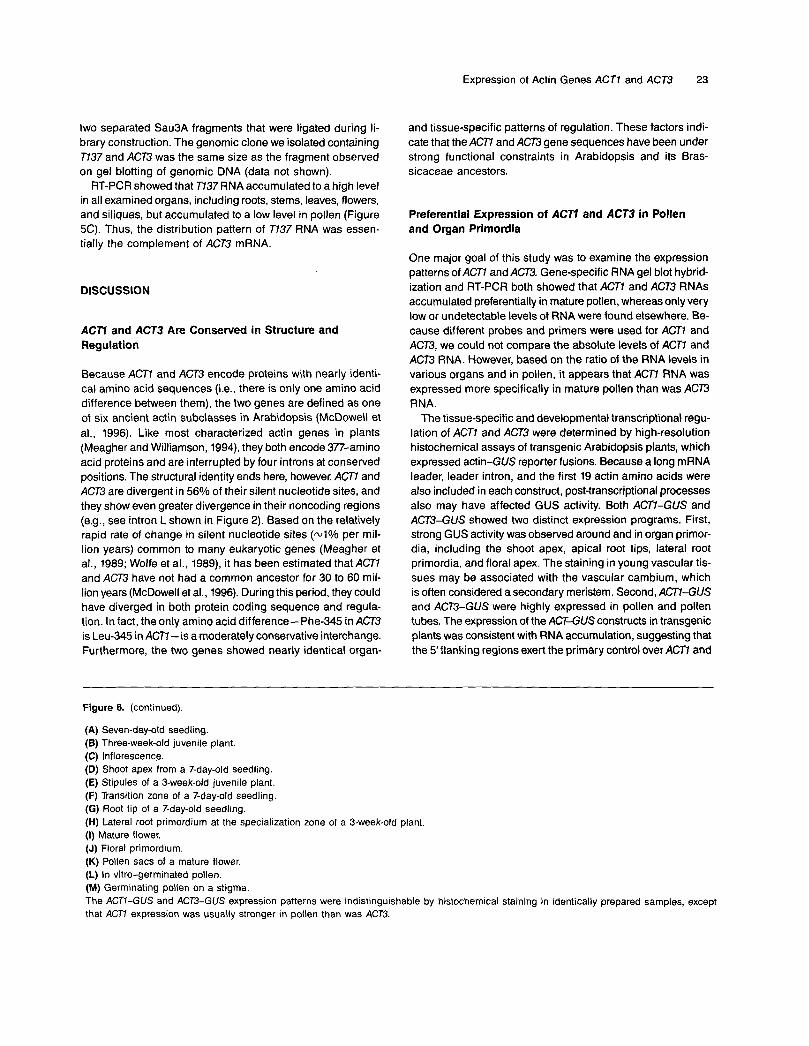
Expression of Actin Genes ACTl and ACT3 23
two separated Sau3A fragments that were ligated during li- brary construction. The genomic clone we isolated containing T737 and ACT3 was the same size as the fragment observed on gel blotting of genomic DNA (data not shown).
RT-PCR showed that T737 RNA accumulated to a high level in all examined organs, including roots, stems, leaves, flowers, and siliques, but accumulated to a low level in pollen (Figure 5C). Thus, the distribution pattern of T737 RNA was essen- tially the complement of ACT3 mRNA.
DISCUSSION
AC77 and ACT3 Are Conserved in Structure and Regulation
Because ACTl and ACT3 encode proteins with nearly identi- cal amino acid sequences (i.e., there is only one amino acid difference between them), the two genes are defined as one of six ancient actin subclasses in Arabidopsis (McDowell et al., 1996). Like most characterized actin genes in plants (Meagher and Williamson, 1994), they both encode 377-amino acid proteins and are interrupted by four introns at conserved positions. The structural identity ends here, however. ACT7 and ACT3 are divergent in 56% of their silent nucleotide sites, and they show even greater divergence in their noncoding regions (e.g., see intron L shown in Figure 2). Based on the relatively rapid rate of change in silent nucleotide sites (4% per mil- lion years) common to many eukaryotic genes (Meagher et al., 1989; Wolfe et al., 1989), it has been estimated that ACT7 and ACT3 have not had a common ancestor for 30 to 60 mil- lion years (McDowell et al., 1996). During this period, they could have diverged in both protein coding sequence and regula- tion. In fact, the only amino acid difference-Phe-345 in ACT3 is Leu-345 in ACT7- is a moderately conservative interchange. Furthermore, the two genes showed nearly identical organ-
and tissue-specific patterns of regulation. These factors indi- cate that the ACTl and ACT3 gene sequences have been under strong functional constraints in Arabidopsis and its Bras- sicaceae ancestors.
Preferential Expression of AC77 and ACT3 in Pollen and Organ Primordia
One major goal of this study was to examine the expression patterns of ACT7 and ACT3. Gene-specific RNA gel blot hybrid- ization and RT-PCR both showed that ACTl and ACT3 RNAs accumulated preferentially in mature pollen, whereas only very low or undetectable levels of RNA were found elsewhere. Be- cause different probes and primers were used for ACTl and ACT3, we could not compare the absolute levels of ACTl and ACT3 RNA. However, based on the ratio of the RNA levels in various organs and in pollen, it appears that ACT7 RNA was expressed more specifically in mature pollen than was ACT3 RNA.
The tissue-specific and developmental transcriptional regu- lation of ACT7 and ACT3 were determined by high-resolution histochemical assays of transgenic Arabidopsis plants, which expressed actin-GUS reporter fusions. Because a long mRNA leader, leader intron, and the first 19 actin amino acids were also included in each construct, post-transcriptional processes also may have affected GUS activity. 60th ACT7-GUS and ACT3-GUS showed two distinct expression programs. First, strong GUS activity was observed around and in organ primor- dia, including the shoot apex, apical root tips, lateral root primordia, and floral apex. The staining in young vascular tis- sues may be associated with the vascular cambium, which is often considered a secondary meristem. Second, ACT7-GUS and ACT3-GUS were highly expressed in pollen and pollen tubes. The expression of the ACT-GUS constructs in transgenic plants was consistent with RNA accumulation, suggesting that the 5’flanking regions exert the primary control over ACTl and
Figure 6. (continued).
(A) Seven-day-old seedling. (E) Three-week-old juvenile plant. (C) Inflorescence. (D) Shoot apex from a Fday-old seedling. (E) Stipules of a 3-week-old juvenile plant. (F) Transition zone of a Fday-old seedling. (G) Root tip of a Fday-old seedling. (H) Lateral root primordium at the specialization zone of a 3-week-old plant. (I) Mature flower. (J) Floral primordium. (K) Pollen sacs of a mature flower. (L) In vitro-germinated pollen. (M) Germinating pollen on a stigma. The ACT1-GUS and ACT3-GUS expression patterns were indistinguishable by histochemical staining in identically prepared samples, except that ACTl expression was usually stronger in pollen than was ACT3.

24 The Plant Cell
ACT3 steady state RNA levels. The concordance of actin RNAs and GUS expression levels also suggests that there is little, if any, differential control over translational efficiency, unlike the results for the ACP-ACT8 subclass (Y.-Q. An, J.M. McDowell, S. Huang, E.C. McKinney, S. Chambliss, and R.B. Meagher, unpublished results).
Expression of the ACT7 and ACT3 fusion constructs was not absolutely limited to the mature pollen and meristematic tis- sues. Low to moderate levels of GUS product were often detected in leaves, the embryo sac, transmitting tissues in the gynoecium, receptacles, and floral stalks. Similar observations have been reported for other pollen-specific and meristem- specific genes (Twell et al., 1990; Medford et al., 1991; McCormick, 1993). For example, an a-tubulin gene is expressed in mature pollen and also is expressed in the tapetum, recep- tacle, and some vegetative tissues (Carpenter et al., 1992). Moreover, in rats, a wide range of ectopic expression of the striated muscle isoactins as well as an extended expression of the smooth muscle a-actin were reported (McHugh et al., 1991). Because regulatory systems evolve over millions of years, mutation acts on a sequence with a long previous his- tory (Meagher, 1995), making it difficult to determine whether these patterns are of functional significance or accidents of evolution. Thus, whereas it is possible that these diverse ACT7 and ACT3 expression patterns representa requirement for ac- tin, it seems likely that some patterns of expression represent accidents of the combinatorial control of a complex promoter (Cavener, 1987; Dickinson, 1988). From an evolutionary view- point, present-day regulatory systems may not represent the most efficient solution but rather one solution that works, and the misexpression of gene products in tissues where they are not needed can escape “selection” so long as it is not harmful. The possible functions of the ACT7 and AC73 genes and pro- teins in the actin cytoskeleton are discussed below.
Potential Elements Affecting AC77, ACT3, and 7737 Regulation
A number of pollen-specific and meristem-specific genes have been characterized, and initial data suggest that their expres- sion is regulated at the transcriptional leve1 (Twell et al., 1990; Medford et al., 1991; Carpenter et al., 1992). The almost iden- tical pollen- and meristem-specific expression patterns of ACT7 and ACT3 suggest that important regulatory elements should be preserved in their 5‘ flanking regions. One 55-bp region upstream that included the putative TATA box contained 50 bp of identical sequence. Very little homology of significance was found farther upstream. A few conserved elements have been identified in other pollen-specific genes that determine levels of expression but not necessarily pollen specificity (Twell et al., 1990; Carpenter et al., 1992). We did not find significant sequence homology for these elements within ACT7 or ACT3.
A relatively large intron was revealed in the 5’ UTRs of ACT7 and ACT3. Large introns interrupting the mRNA leader are not common among plant genes but are found in actin genes from rice, tobacco, soybean, and vertebrates (Nakajima-lijima et al.,
1985; McElroy et al., 1990b; Pearson and Meagher, 1990; Thangavelu et al., 1993). McElroy et al. (1990b) reported that the intron in the 5’UTR of rice actin, RAc7, is essential for strong expression in electroporated rice protoplasts. Recent studies in our laboratory have shown that the deletion of the corre- sponding intron and part of the 5’ UTR from the constitutively expressed ACT2 Arabidopsis actin gene almost completely abolishes expression of a GUSfusion in transgenic plants (Y.-Q. An and R.B. Meagher, unpublished data). The leader exons of ACT7 and ACT3 also have a pyrimidine-rich stretch (PuPy) from the transcriptional start sites extending into the first exon, as has been observed in soybean and rice actin genes (McElroy et al., 1990b; Pearson and Meagher, 1990). The PuPy sequence may play an important regulatory role in a number of genes, including the maize Alcohol dehydrogenasel gene and human c-myc gene (Cooney et al., 1988; Lu and Ferl, 1992). The poten- tia1 biological functions of the conserved sequences in the 5’ UTRs of ACT7 and ACT3 are under examination.
We were surprised to find a divergent transcript (T737) that initiated very close to and in the 5‘ flanking region of ACT3. T737 has a large open reading frame and appears to encode a protein; however, the function of this protein is not known. There does not appear to be a sequence similar to T737 up- stream of ACT7, unless its homolog is located beyond the region we have sequenced. We have not looked for T737 homologs by gel analysis. Interestingly, the TATA boxes of AC73 and T737 were separated only by 270 bp. Higher eukaryotic genes are usually separated by thousands of base pairs, even in the small genome of Arabidopsis. It has been reported that the human dihydrofolate reductase gene and a mismatched repair pro- tein gene are organized in a divergent configuration with their transcriptional start sites separated by only 90 bp. A 165-bp fragment is sufficient to direct the accurate bidirectional tran- scription of both human genes (Shimada et al., 1989). RNA gel blot and RT-PCR analyses showed that the RNA expres- sion pattern of T737 is distinct from that of ACT3 and perhaps even complementary. It seems quite possible that the expres- sion of one gene impacts the other. Fo? example, the expression of AC73 may repress T737expression in pollen by competition between the shared regulatory elements for transcription fac- tors, as demonstrated for p- and E-glObin genes in chicken (Foley and Engel, 1992). The small space between ACT3 and T737 suggests that the promoter sequences required for their expression are both very compact. This view is further sup- ported by the lack of sequence homology between the ACT7 and ACB promoter region beyond the 55-bp conserved region associated with their TATA boxes. Alternatively, some of the required prornoter elements in all three genes might be located elsewhere, such as in the introns disrupting their 5’ UTRs (see above).
Cytoskeletal Functions of the ACTl and ACT3 Proteins
The strong pollen and organ primordial expression observed for ACT7 and ACT3 suggests a few potential roles for these ac- tins in pollen tube and primordial development. The nature

Expression of Actin Genes ACTl and ACT3 25
of pollen tube growth is different from that of most other plant cells because it is restricted to the tip region (Steer and Steer, 1989). Extensive studies indicate that actin plays an impor- tant role in pollen germination and tube growth (Steer and Steer, 1989; Steer, 1990; Mascarenhas, 1993). Throughout these stages, the actin arrays are very dynamic, changing from large spherical “storage” bodies in pollen grains to microfilament bun- dles oriented predominantly parallel to the growth a i s in pollen tubes (Heslop-Harrison et al., 1986; Tiwari and Polito, 1988). The actin cytoskeleton is credited with “pulling” the two gener- ative cells down through the pollen tube. A dense network of microfilaments located just behind the tube apex is thought to transport building materials to the rapidly expanding tip (Perdue and Parthasarathy, 1985; Pierson et al., 1986; Lancelle et al., 1987). Given the strength of ACT7 and ACT3 expression in pollen, it is likely they participate in some or all of these activities.
Among the eight highly expressed Arabidopsis actins, only ACT7-GUS and ACT3-GUS were expressed preferentially around and in the meristematic tissues. Recent studies have indicated that actin plays important roles in determining the position and formation of cell division planes. Because most plant cells do not migrate, regulating the division plane of individual cells in the meristem is central to programmed de- velopment in plants (Meagher and Williamson, 1994). The preprophase band of actin is thought to help determine the position and angle of the division plane, because later in de- velopment the phragmoplast grows out to the site previously occupied by the band. Actins may aid in the proper narrowing of the preprophase band and outgrowth of the phragmoplast to the division site (Palevitz, 1987; Mineyuki and Gunning, 1990). Thus, ACT7 and ACT3 also may be involved in pro- grammed cell development.
Evolution of the AC7Y and ACT3 Actin Subclass
ACT7 and ACT3 are 3 to 9% divergent in RNS from the six other expressed Arabidopsis actins and thus have not shared a com- mon ancestor with these genes for ~ 1 5 0 to 450 million years (McDowell et al., 1996). Evidence that ACT7 and ACT3 actin belong to an ancient and conserved subclass comes also from comparisons with aciins in other organisms. ACT7 and ACT3 are typically 12 to 17% diverged in RNS from animal and fun- gal actins and as much as 10% divergent from most other plant actins. However, they are only m3% divergent from the pollen- specific tobacco actin gene, Tac25 (Thangavelu et al., 1993; McDowell et al., 1996). Arabidopsis and tobacco are at least 100 to 110 million years diverged from a common ancestor. Thus, the conservation of RNS and pollen-specific gene ex- pression suggests that Tac25, ACT7, and ACT3 are orthologs, separated by the divergence of common ancestral organisms (McDowell et al., 1996). Furthermore, it suggests that both the protein sequence and the regulation of this ancient actin sub- class have been subject to strong constraint throughout dicot and possibly angiosperm evolution.
The detailed expression patterns of Arabidopsis actin genes from five other subclasses also have been examined in our laboratory. The expression of ACT7 and ACT3 is distinct from that of any other actin subclass. The ACT4 and ACT72 subclass is the most similar in protein sequence to ACT7 and ACT3 (S. Huang, Y.-Q. An, J.M. McDowell, E.C. McKinney, and R.B. Meagher, unpublished results). This subclass is expressed preferentially in pollen but is not expressed in organ primor- dia. ACJ72 also is strongly expressed in the root cap and pericycle surrounding lateral root primordia (S. Huang, Y.-Q. An, J.M. McDowell, E.C. McKinney, and R.B. Meagher, unpub- lished results). ACT77, the next most divergent subclass, is expressed in pollen; in addition, it is the major actin gene ex- pressed during inflorescence and ovule development (S. Huang, Y.-Q. An, J.M. McDowell, E.C. McKinney, and R.B. Meagher, unpublished results). The ACT2-ACT8 subclass is the most divergent in sequence and shows an expression pat- tern that is the most divergent from that of ACT7 and ACT3. The ACT2-ACT8 subclass is expressed strongly and constitu- tively in most of the vegetative tissues both early and late in development, but it is not expressed in pollen or ovule (Y.-Q. An, J.M. McDowell, S. Huang, E.C. McKinney, S. Chambliss, and R.B. Meagher, unpublished results). ACT7 has a pattern similar to that of ACT8 but is restricted to young developing vegetative tissues and is only weakly expressed in pollen (J.M. McDowell, S. Huang, E.C. McKinney, Y.-Q. An, and R.B. Meagher, unpublished results). All of these subclasses are expressed at some leve1 during early vascular tissue devel- opment. These data reveal remarkably complex genetic control of the actin cytoskeleton. Considering the relatively extreme protein sequence divergence found in this and other plant ac- tin gene families, there may be a requirement for equally complex families of actin binding proteins (McDowell et al., 1996).
ACTl and ACM share common sequences and regulation in spite of being millions of years diverged from a common ancestor. This probably reflects conservation of their DNA and protein sequences and a requirement for pollen- and organ primordium-specific expression of these actin proteins. The expression of these two genes appears to have a strong de- velopmental component that may be linked to the ancient evolution of microspores and organ primordia (Meagher, 1995). Future genetic studies, in particular the analysis of plant actin mutants (McKinney et al., 1995), will dissect the required com- ponents of ACTl and ACT3 expression and distinguish them from accidents of evolution.
METHODS
lsolation of AC7Y and ACT3 Genomic Clones
Following the procedure described by McDowell et al (1996), two Arabr- dopsis thalrana ecotype Columbia genomic libraries provided by J Mulligan and R Davis (Stanford University, Stanford, CA) and B Hauge and H Goodman (Massachusetts General Hospital, Cambridge, MA) were screened with a Drctyostehum actin cDNA fragment or soybean

26 The Plant Cell
actin genomic DNA. Randomly selected positive clones were partially sequenced with degenerate actin-specific oligonucleotides to iden- tify the distinct actin genes (McDowell et al., 1996). The ACTI clones were shown to be identical in sequence to a partially sequenced Arabidopsis actin gene described previously (Nairn et al., 1988). Plas- mid subclones of this genomic sequence were generously supplied by R. Ferl (University of Florida, Gainsville, FL) for further character- ization. By following standard cloning techniques, an ~4.0-kb Hindlll restriction fragment of ACT3 genomic DNA was subcloned into pBluescript II SK+ (Stratagene) to produce pAAc3.
Sequence Determination and Analysis
ACT7 and ACT3 genomic and cDNA clone sequencing was conducted by dideoxy chain termination methods using Sequenase (United States Biochemical Corp.) and fmol DNA sequencing (Promega) kits follow- ing the protocols provided by the manufacturem, except that several degenerate actin-specific primers were used (McDowell et al., 1996). Sequences were managed using the Genetics Computer Group (Madi- son, WI) sequence analysis software package (Devereaux et al., 1984) provided by the University of Georgia Biological Sequence computa- tion facility. The DNA sequences upstream from codon 19 of ACTl and ACT3 were aligned with the Genetics Computer Group's Pileup pro- gram and displayed with a Boxshade program provided by the University of Georgia Biological Sequence Computation Facility.
McKinney, and R.B. Meagher, unpublished results). RNA gel blotting was performed using a gene-specific 3' UTR sequence probe prepared by PCR amplification. The PCR primem for the ACT7 and ACB probes were ACTI-376s and ACT1-3'N2 (Table 1) and ACT3-376s and ACT3- 3"1, respectively. Five micrograms of total RNA for each tissue was resolved in a 1% agarose-formaldehyde gel (Sambrook et al., 1989) and blotted onto a nylon membrane (0.45 pM; Millipore). The filters were prehybridized overnight in 1 x RNA hybridization mixture (Thompson et al., 1992) containing 40% formamide at 48OC. Hybridi- zations were performed for 24 hr using the conditions described above with -3 x 10⁶ cpmlmL each gene-specific probe labeled at -6 x 10⁸ cpmlpg of DNA by the random primer method (Feinberg and Vogelstein, 1983). Filters were washed once at 48OC for 15 min in 2 x SSC, 0.2% SDS, and two times for 15 min in 1 x SSC, 0.2% SDS. After drying briefly, the filters were exposed to X-film (Kodak) with two intensifying screens at -7OOC for 1 to 3 days. Gene specificity of the probes was confirmed by hybridization to dot blots containing the nine other Arabidopsis actin genomic DNA. No cross-hybridization was ob- served to the incorrect clone (Figure 4). rRNA hybridization was used to monitor equal loading and transfer of the RNA samples. The RNA gel blots were stripped and rehybridized with a 26-nucleotide 18s rRNA antisense oligonucleotide, RRNA1637 (Table I), as described previ- ously by Tanzer and Meagher (1994). The hybridization was performed at 48OC for 20 hr with -10' cpm of the probe labeled at -106 cpmlpmol of oligonucleotide. Filters were washed three times, for 15 min each, at48OC in 2 x SSC, 0.5% SDS. After brief drying, the filters were exposed to x-ray film for 10 to 30 min with two intensifying screens.
DNA Gel Blot Analysis Revene Transcriptase-PCR Analysis
Genomic DNA was isolated from Arabidopsis ecotype Columbia as described previously by McLean et al. (1988). The DNA was digested, fractionated on 0.8% agarose gels at 40 V for 16 hr, and transferred to a nylon membrane (Biotrans Plus) in a Transvac vacuum blotter (Hoefer Inc.. San Francisco, CA). according to manufacturer's instruc- tions. The DNA was fixed to the membrane by 3 min of UV irradiation and 2 hr of baking at 80°C. The polymerase chain reaction (PCR) frag- ments containing the 2.7 kb of 5'flanking sequences of the ACT7 gene (or 2.1-kb 5'region of ACT3) were labeled by the random primer method (Feinberg and Vogelstein, 1983) to a specific activity of -0.5 x 10⁹ cpmlpg. The probe was hybridized to the blot in 6 x SSC (1 x SSC is 0.15 M NaCI, 0.015 M sodium citrate). 5 x Denhardt's solution (1 x Denhardt's solution is 0.02% Ficoll, 0.02% PVF: and 0.02% BSA), 40% formamide, 0.2% SDS at 56OC for 48 hr. The blot was washed four times for 10 min at 56OC in 0.5 x SSC, 0.2% SDS, and exposed to X-Omat x-ray film (Kodak) with one intensifying screen for 48 hr at -70%. The specificity of the 5'probes for ACTI or ACT3 was confirmed by hybridizing to dot blots containing the nine other Arabidopsis actin genes in an experiment similar to that described below for the 3' un- translated region (UTR) probes. No cross-hybridization was observed (data not shown).
RNA Preparation and RNA Gel Blot Analysis
Seven-day-old seedlings, the roots, stems, and leaves of 3- to 4-week- old juvenile plants, and the flowers (-90% unopened) and siliques of 5- to 6-week-old plants were collected into liquid nitrogen and stored at -7OOC before use. Total RNA was prepared from these tissues (Logemann et al., 1987). Pollen RNA was prepared following a previ- ously described protocol (S. Huang, V.-Q. An, J.M. McDowell, E.C.
Samples of total RNA (5 pg) from seedlings, roots, stems, leaves, flavers, pollen, and siliques were reverse transcribed into cDNA in 50-pL reac- tions with eight units of avian myoblastosis virus reverse transcriptase (Promega) and primed with 40 pmol of oligo(dT) in the manufacturer's recommended buffer. The leve1 of cDNA synthesis was measured by assaying DNA concentration with Hoechst dye in a DNA minifluorom- eter (Hoefer, lnc.), following the manufacturer's instructions. The total yield typically ranged from 100 to 300 ng. An aliquot of the cDNA was dispensed in a twofold dilution series in the PCR buffer described be- l o ~ , such that the first sample in the series contained 2.5 ng of cDNA. The oligonucleotide primers (50 pmol of each) ACT327S and ACTI- 3N2 for ACT7, ACT327S and ACT3-3'Nl for ACT3, and ACT3-5'S3 and ACT3-5"6 for TI37(Table 1) were used to amplify each diluted cDNA sample. For the actin cDNAs, the amplified region included the last intron junction for the actin cDNAs and the first intron junction for the T737cDNA. Potential genomic DNA contamination could be ruled out based on the length of the products, because the genomic products would have been 4 0 0 bp longer than the cDNA products. The 100- pL PCRs were subjected to 45 cycles at 94OC (1 min), 42OC (1 min), and 72OC (30 sec) in a buffer containing 0.1 mM deoxynucleotide triphosphates, 2.5 pg of linear acrylamide carrier, 50 mM KCI, 10 mM Tris-HCI, pH 8.8, 1.5 mM MgCI2, and 0.1% Triton X-100 (Promega) and initiated by adding one unit of Taq polymerase. One-tenth of each sam- ple was resolved on a 1.5% agarose gel and stained with ethidium bromide. In tissues in which the transcript was expressed most strongly, the highest cDNA concentrations gave approximately the same prod- uct yield (saturation). The point at which the diluted cDNA gave approximately half of that yield was designated the dilution half-point. Each dilution series was performed several times with independent RNA preparations.
Expression of Actin Genes ACTl and ACT3 27
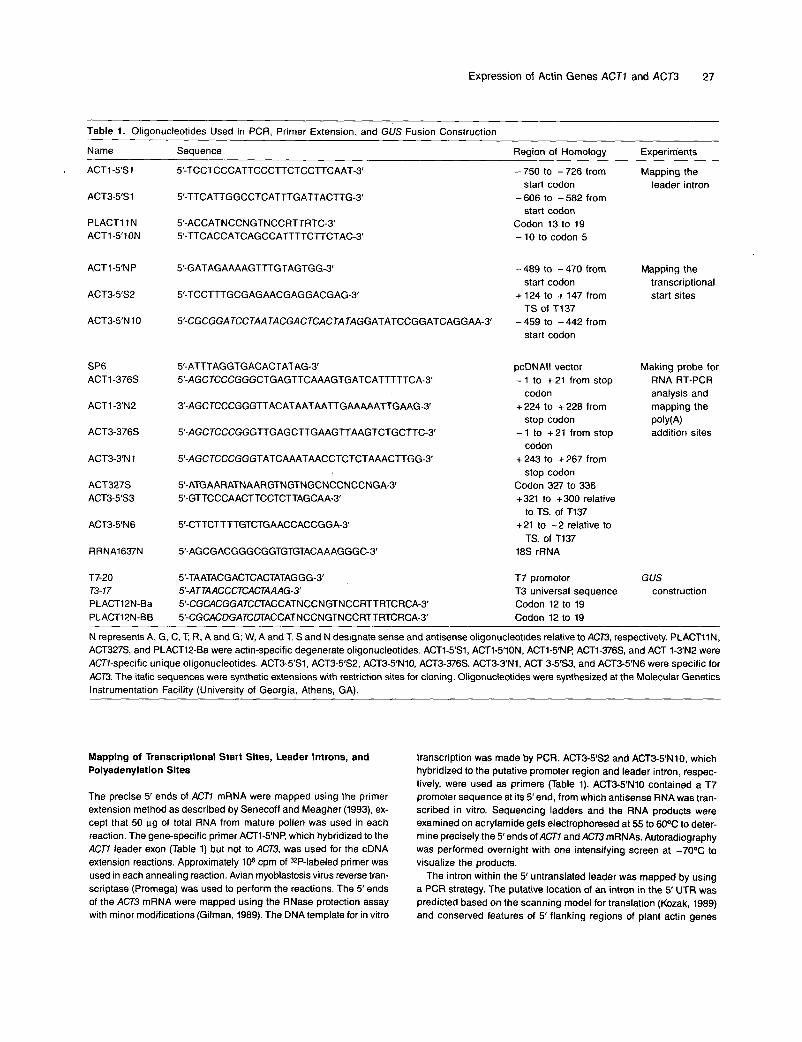
Table 1. Oligonucleotides Used in PCR. Primer Extension, and GUS Fusion Construction
Name Sequence Region of Homology Experim’ents
I ACTl-5’Sl 5‘-TCCTCCCATTCCCTTCTCCTTCAAT-3’ - 750 to - 726 from start codon
-606 to -582 from start codon
Codon 13 to 19 - 10 to codon 5
Mapping the leader intron
ACT3-5’Sl 5‘-TTCATTGGCCTCATTTGATTACTTG-3‘
PLACTI 1N ACTI-5’10N
5’-ACCATNCCNGTNCCRTTRTC-3’ 5’-TTCACCATCAGCCATTTTCTTCTAC-3‘
ACTI-5’NP 5'-G ATAG AAAAGTTTGTAGTGG-3
5‘-TCCTTTGCGAGAACGAGGACGAG-3’
5’-CGCGGA TCCTAA TACGACTCACTA TAGGATATCCGGATCAGGAA-3‘
-489 to -470 from
+ 124 to + 147 from
-459 to -442 from
start codon
TS of T137
start codon
Mapping the transcriptional start sites ACT3-5S2
ACT3-5’NI O
SP6 ACT1-376s
ACTl-3”2
5'-ATTTAGGTG ACACTAT AG-3' 5’-AGCTCCCGGGCTGAGTTCAAAGTGATCATTTTTCA-Y
3'-AGCTCCCGGGTTACAT AATAATTGAAAAATTGAAG-3'
5‘-AGCTCCCGGGTTGAGCTTGAAGTTAAGTCTGCTTC-3’
5‘-AGCTCCCGGGTATCAAATAACCTCTCTAAACTTGG-3’
pcDNAll vector - 1 to +21 from stop
codon + 224 to + 228 from
stop codon - 1 to + 21 from stop
codon +243 to +267 from
stop codon Codon 327 to 336 +321 to +300 relative
to TS. of T137 +21 to -2 relative to
TS. of T137 18s rRNA
Making probe for
analysis and mapping the
addition sites
RNA RT-PCR
POlY(A) ACT3-376s
ACT3-3’N 1
ACT327S ACT3-5’S3
5‘-ATGAARATNAARGTNGTNGCNCCNCCNGA-3’ 5’-GTTCCCAACTTCCTCTTAGCAA-3’
ACT3-5’N6 5’-CTTCTTTTGTCTGAACCACCGGA-3’
RRNA1637N 5‘-AGCGACGGGCGGTGTGTACAAAGGGC-3’
T7-20 T3- 7 7 PLACT12N-Ba PLACT12N-E6
5'-TA ATACG ACTCACTATAG G G-3’ 5‘-ATTAACCCTCACTAAAG-3’ 5’-CGCACGGATCCTACCATNCCNGTNCCRTTRTCRCA-3’ 5’-CGCACDGATC!XACCATNCCNGTNCCRTTRTCRCA-3‘
T7 promotor T3 universal sequence Codon 12 to 19 Codon 12 to 19
GUS construction
N represents A, G. C, T, R. A and G; W, A and T. S and N designate sense and antisense oligonucleotides relative to ACT3, respectively. PLACTIIN, ACT327S, and PLAGT12-Ea were actin-specific degenerate oligonucleotides. ACT1-5’3, ACTI-S‘ION, ACT1-5’NP ACT1-376S, and ACT 1-3‘NZ were ACT7-specific unique oligonucleotides. ACT3-5’S1, ACT3-5‘S2, ACT3-5”10, ACT3-376s. ACT3-3’N1, ACT 3-5’S3, and ACT3-5’N6 were specific for ACT3. The italic sequences were synthetic extensions with restriction sites for cloning. Oligonucleotides were synthesized at the Molecular Genetics lnstrumentation Facility (University of Georgia, Athens, GA).
Mapping of Transcriptional Start Sites, Leader Introns, and Polyadenylation Sites
The precise 5’ ends of ACTl mRNA were mapped using the primer extension method as described by Senecoff and Meagher (1993), ex- cept that 50 pg of total RNA from mature pollen was used in each reaction. The gene-specific primer ACT1-5’NP which hybridized to the ACT7 leader exon (Table 1) but not to ACT3. was used for the cDNA extension reactions. Approximately 106 cpm of =P-labeled primer was used in each annealing reaction. Avian myoblastosis virus reverse tran- scriptase (Promega) was used to perform the reactions. The 5‘ ends of the ACT3 mRNA were mapped using the RNase protection assay with minor modifications (Gilman, 1989). The DNA template for in vitro
transcription was made by PCR. ACT3-5S2 and ACT3-5”10, which hybridized to the putative promoter region and leader intron, respec- tively, were used as primers (Table 1). ACT3-5’NlO contained a T7 promoter sequence at its 5’end, from which antisense RNA was tran- scribed in vitro. Sequencing ladders and the RNA products were examined on acrylamide gels electrophoresed at 55 to 6OoC to deter- mine precisely the 5’ends of ACT7 and ACT3 mRNAs. Autoradiography was performed overnight with one intensifying screen at -70% to visualize the products.
The intron within the 5‘ untranslated leader was mapped by using a PCR strategy. The putative location of an intron in the 5’ UTR was predicted based on the scanning model for translation (Kozak, 1989) and conserved features of 5’ flanking regions of plant actin genes

28 The Plant Cell
(Pearson and Meagher, 1990). A sense primer and an antisense primer, which were located in the putative leader exon and first coding exon, respectively, were used to PCR amplify the RNA leader intron junc- tions. TheACT7 and AC73 products were amplified from oligo(dT)-primed floral and pollen cDNA, respectively. The primers ACT1-551 and ACTI- 5‘10N were used for ACT7; ACT3-5’SI and PLACTllN were used for AC73 (Table 1). Comparing the cDNA sequence of the PCR product with the genomic sequence localized the leader introns.
The 3’polyadenylation sites were mapped by a prccedure modified from the protocol for 3’ rapid amplification on cDNA ends (Frohman et al., 1988) and ligation-mediated PCR (Mueller and Wold, 1989). A plasmid cDNA library was prepared from mature flowers by Invitro- gen (San Diego, CA). The 3’ UTRs of the actin cDNAs were PCR amplified from this library as follows.
Sense oligonucleotide primers (25 nucleotides) homologous for a region of ACT7 (or ACB), including the terminal amino acid codon 376, the stop codon, and 19 nucleotides of the 3‘ UTR with an Xmal site and 7-bp clamp at its 5‘ end, ACT1-376s (or ACT3-376S), and a 25- nucleotide vector oligonucleotide, Sp6-25, were used as the PCR primers (Table 1). The Sp6-25 oligonucleotide flanks several restric- tion sequences on the pcDNAll vector (Invitrogen), one of which is Sacl. Ten nanograms of the plasmid library cDNA was used as the template in 100-pL PCR containing 1 x PCR buffer (50 mM KCI, 1.5 mM MgC12, 10 mM Tris-HCI, pH 9.0, 0.1% Triton X-IOO), the four deox- ynucleotide triphosphates at 0.2 mM each, 15 pmol each PCR primer, and two units of Taq polymerase (Promega). PCR amplifications were performed with the following program: 94OC for 2 min; 45 cycles of 94OC for 30 sec, 48OC for 30 sec, 72OC for 30 sec; 1 cycle of 94% for 1 min, 48OC for 2 min, and 72OC for 7 min. PCR products were then digested with Sacl and Xmal and cloned into the corresponding pBluescript I1 SK+ (Stratagene) replacement region. Positive clones were screened by PCR for actin 3‘ inserts of different sizes. Repre- sentative clones of different sizes were sequenced, and the polyadenylation sites were determined by the presence of a poly(A) sequence in the cDNAs in comparison with the genomic sequence.
GUS Reporter Constructs
The Arabidopsis ACT7 actin genomic clone pAtc4, which was gener- ously provided by R. Ferl, contains a 4.0-kb EcoRl fragment in pUC8 that includes a 2.7-kb 5’flanking sequence upstream of the translational start site (Nairn et al., 1988). A modified ligation-mediated PCR method (Y.-0. An, J.M. McDowell, S. Huang, E.C. McKinney, S. Chambliss, and R.B. Meagher, unpublished results) was used to amplify the 2.7-kb 5’ flanking region and introduce appropriate restriction sites at both ends. The primers, PLACTIPN-BB (24 bases complementary to codons 12 to 19 and an 11-base sequence containing a Bglll restriction site at codon 19) and T7-20 (a vector oligonucleotide), were used for the PCR amplification (Table 1). The 2.1-kb AC73 5’ flanking region frag- ment was obtained by PCR amplification of pAAc3, using T7-20 and PLACT12N-Ba as the primers (Table 1). PLACT12N-Ba is similar to PLACTl2N-BB, but it contains a BamHl site at codon 19.
A 2.7-kb Hindlll-Bgll-digested ACT7 PCR product and a 2.1-kb Hindlll- BamHI-digested ACT3 PCR product were ligated with Hindlll- BamHI-digested pBI101.1 (Jefferson et al., 1987) to produce the actin p-glucuronidase (GUS) translational fusion constructs ACT7-GUS and ACT3-GUS. A total of 27 codons. including eight codons created from the vector sequence, were added to the N terminus of the wild-type GUS sequence. The 3 region of nopaline synthase gene was used in this vector to direct polyadenylation (Jefferson et al., 1987). Two con-
structs, each from an independent PCR (1El and 1E2 from the ACT7 5‘ region; 3H1 and 3H2 from the AC73 5’ region) were made for each gene to control for potential PCR-generated mutations in regulatory elements. The expression patterns of all constructs were compared with the control for effects of possible PCR-generated mutations and to increase the total number of transgenic plants examined. Approxi- mately 500 bp of sequence upstream from the fusion sites were examined, and O- to 2-bp changes from the parent sequence were found in each; however, none of these changes produced reading frame shifts or occurred in any conserved elements (see Results and Discussion). The constructs were mobilized into Agrobacferium tumdaciens LBA4404 after a direct transformation protocol (An et al., 1988).
Plant Transformation and Growth
T-DNAs carrying the ACT7-GUS and ACTJ-GUS constructs were trans- formed into Arabidopsis embryos, and To plants were regenerated as described previously by Marton and Browse (1991), with modifications (Y.-Q. An, J.M. McDowell, S. Huang, E.C. McKinney, S. Chambliss, and R.B. Meagher, unpublished results). T1 transgenic seeds from the To plants were germinated, and plants were grown in 85 agar-based medium plus 50 mg/L kanamycin without sucrose or vitamins under a 16-hr photoperiod at 22OC. Seedlings (3 to 7 days old) and juvenile plants (4 weeks old) were harvested for histochemical GUS assays. After 3 to 4 weeks on plates, juvenile plants were transferred into soil for flowering. Inflorescence, flowers, and siliques were examined from 5- to 6-week-old plants. All histochemical assay data presented in this study were obtained from Tl or T2 plants.
Histochemical GUS Assays
Histochemical assays for GUS activity were conducted according to the protocol described previously by Jefferson et al. (1987), with some modification. Fresh tissue samples were fixed in 90% acetone on ice for 1 hr and then were washed in 50 mM NaPO,, pH 7.0, twice for 30 min each (Hemerly et al., 1993). GUS staining was performed by in- cubating tissues in 50 mM NaPO,, pH 7.0, containing 0.5% Triton X-100, 0.5 mM X-gluc (Jersey Lab Supply, Livingston, NJ), 0.5 mM K,[Fe(CN)& and 0.5 mM K4[Fe(CN),] for 1 to 24 hr at 37%. The stained tissues were washed once with the 50 mM NaPO,, pH 7.0, and bleached in several changes of 70% ethanol. The samples were examined and photographed under a Wild M5A dissecting microscope (Heerbrugg, Switzerland) and Zeiss Standard 16 compound micro- scope (Oberkochen, Germany) using Kodak Ektachrome 64T Professional Film.
ACKNOWLEDGMENTS
This work was supported by a basic research grant from the Molecu- lar Cytology Study Section of the National lnstitutes of Health (NIH) to R.B.M. An NIH training grant to the Genetics Department at the University of Georgia supported J.M.M. Y.-Q.A. submitted portions of this work in his Ph.D. dissertation. We thank Julie Senecoff, Dima Belostotsky, and Michael Weise for their help with several technical and scientific problems and the computational analysis of sequences and Wayne Parrott and Ronald Nagao for reading drafts of the manu- script. We also thank Dr. Robert Ferl for providing his ACT7 genomic clone.
Expression of Actin Genes ACT7 and ACT3 29
Received July 31, 1995; accepted November 2, 1995.
REFERENCES
An, G., Ebert, P.R., Mitra, A., and Ha, S.B. (1988). Binary vectors. In Plant Molecular Biology, S.B. Gelvin and R.A. Schilperoot, eds (Amsterdam: Martinus Nijhoff), pp. 1-19.
Baird, W.V., and Meagher, R.B. (1987). A complex gene superfamily encodes actin in petunia. EMBO J. 6, 3223-3231.
Carpenter, J.L., Ploense, S., Snustad, D.P., and Silflow, C.D. (1992). Preferential expression of an a-tubulin gene of Arabidopsis in pol- len. Plant Cell 4. 557-571.
Cavener, D.R. (1987). Combinatorial control of structural genes in Dro- sophila: Solutions that work for the animal. BioEssays 7, 103-107.
Cleary, A.L., Brown, R.C., and Lemmon, B.E. (1992). Microtubule arrays during mitosis in monoplastidic root tip cells of Isoefes. Pro- toplasma 167, 123-133.
Cooney, M., Czernuuewicz, G., Postel, E.H., Flint, S.J., and Hogan, M.E. (1988). Site-specific oligonucleotide binding represes tran- scription of the human c-myc gene in vitro. Science 241, 456-459.
Devereaux, J., Haeberli, P., and Smithies, O. (1984). A comprehen- sive set of sequence analysis programs for the VAX. Nucleic Acids Res. 12, 387495.
Dickinson, W.J. (1988). On the architecture of regulatory systems: Evolutionary insights and implications. BioEssays 8, 204-208.
Drouin, G., and Dover, G.A. (1990). lndependent gene evolution in the potato actin gene family demonstrated by phylogenetic procedures for resolving gene conversions and the phylcgeny of angiosperm actin genes. J. MOI. Evol. 31, 132-150.
Feinberg, A.P., and Vogelstein, B. (1983). A techniquefor radiolabeling DNA restriction endonuclease fragments to high specific activity. Anal. Biochem. 132, 6-13 and addendum.
Foley, K.P., and Engel, J.D. (1992). Individual stage Selector element mutations lead to reciproca1 changes in B- vs E-globin gene tran- scription: Genetic confirmation of promoter competition during globin gene switching. Genes Dev. 6, 730-744.
Frohman, M.A., Dush, M.K., and Martin, G.R. (1988). Rapid produc- tion of full-length cDNAs from rare transcripts: Amplification using a single genespecific oligonucleotide primer. Proc. Natl. Acad. Sci. USA 85, 8998-9002.
Gilman, M. (1989). Ribonuclease protection assay. In Current Protocols in Molecular Biology, F.M. Ausubel, R. Brent, R.E. Kingston, D.D. Moore, J.G. Seidman, J.A. Smith, and K. Struhl, eds(New York: John Wiley and Son), pp. 4.7.1-4.7.8.
Hemerly, A.S., Ferreira, P., Engler, J.D., Van Montagu, M., Engler, G., and Ind , D. (1993). cdc2a expression in Arabidopsis is linked with competence for cell division. Plant Cell 5, 1711-1723.
Heslop-Harrison, J., Heslop-Harrison, Y., Cresti, M., Tieui, A., and Ciampolini, R. (1986). Actin during pollen germination. J. Cell Sci.
Hightower, R.C., and Meagher, R.B. (1985). Divergence and differential
Hightower, R.C., and Meagher, R.B. (1986). The molecular evolution
86, 1-8.
expression of soybean actin genes. EMBO J. 4, 1-8.
of actin. Genetics 114, 315-332.
Jefferson, R.A., Kavanagh, T.A., and Bevan, M.W. (1987).,GUS fu- sions: e-Glucuronidase as a sensitive and versatile gene fusion marker in higher plants. EMBO J. 6, 3901-3907.
Kobayashi, H., Fukuda, H., and Shibaoka, H. (1967). Reorganiza- tion of actin filaments associated with the differentiation of tracheary elements in Zinnia mesophyll cells. Protoplasma 138, 69-71.
Kozak, M. (1989). The scanning model for translation: An update. J. Cell Biol. 108, 229-241.
Lancelle, S.A., Cresti, M., and Hepler, P.K. (1987). Ultrastructure of the cytoskeleton in freeze substituted pollen tubes of Nicofiana alata. Protoplasma 140, 141-150.
Lloyd, C.W., ed (1991). The Cytoskeletal Basis of Plant Growth and Form. (London: Academic Press).
Logemann, J., Schell, J., and Willmitzer, L. (1987). lmproved method of isolation of FINA from plant tissues. Anal. Biochem. 163, 16-20.
Lu, G., and Ferl, R.J. (1992). Site-specific oligodeoxynucleotide binding to maize Adhl gene promoter represes Adhl-GUS gene expres- sion in vivo. Plant MOI. Biol. 19, 715-723.
Marton, L., and Browse, J. (1991). Facile transformation of Arabidop- sis. Plant Cell Rep. 10, 235-239.
Mascarenhas, J.P. (1993). Molecular mechanisms of pollen tube growth and differentiation. Plant Cell 5, 1303-1314.
McCormick, S. (1993). Male gametophyte development. Plant Cell5,
McDowell, J.M., Huang, S., McKinney, E.C., An, Y.-Q., and Meagher, R.B. (1996). Arabidopsis thaliana contains ten actin genes encod- ing six ancient protein subclasses. Genetics, in press.
McElroy, D., Rothenberg, M., Reece, K.S., and Wu, R. (1990a). Char- acterization of the rice (Oryza sativa) actin gene family. Plant MOI. Biol. 15, 257-268.
McElroy, D., Zhang, W., Cao, J., and Wu, R. (1990b). lsolation of an efficient actin promotor for use in rice transformation. Plant Cell 2, 163-171.
McHugh, K.M., Crawford, K., and Lessard, J.L. (1991). A compre- hensive analysis of the developmental and tissue-specific expression of the isoactin multigene family in the rat. Dev. Biol. 148, 442-458.
McKinney, E.C., Ali, N., Traut, A., Feldmann, K.A., Belostotsky, D.A., McDowell, J.A., and Meagher, R.B. (1995). Sequence based identification of T-DNA insertion mutations in Arabidopsis: Actin mu- tants acf2-7 and act4-7. Plant J. 8, 613-622.
McLean, B.G., Eubanks, S., and Meagher, R.B. (1990). Tissue spe- cific expression of divergent actins in soybean root. Plant Cell 2, 335-344.
McLean, M., Baird, W.V., Gerats, A.G.M., and Meagher, R.B. (1988). Determination of copy number and linkage relationships among five actin gene subfamilies in Petunia hybrida. Plant MOI. Biol. 11,
Meagher, R.B. (1995). The impact of historical contingency on gene phylogeny: Plant actin diversity. In Evolutionary Biology, Vol. 28, M.K. Hecht, R.J. Maclntyre, and MT. Clegg, eds(New York: Plenum Press),
Meagher, R.B., and Williamson, R.E. (1994). The plant cytoskele- ton. In Arabidopsis, E. Meyerowitz and C. Somerville, eds (Cold Spring Harbor, NY: Cold Spring Harbor Laboratories), pp. 1049-1084.
Meagher, R.B., Berry-Lowe, S., and Rice, K. (1989). Molecular evo- lution of the small subunit of ribulose bisphosphate carboxylase: Nucleotide substitution and gene conversion. Genetics 123,845-863.
1265-1275.
663-672.
pp. 195-215.

30 The Plant Cell
Medford, J.I., Elmer, J.S., and Klee, H.J. (1991). Molecular cloning and characterization of genes expressed in shoot apical meristems. Plant Cell 3, 359-370.
Meyerowitz, E.M. (1989). Arabidopsis, a useful weed. Cell56,263-269
Mineyuki, Y., and Gunning, B.E.S. (1990). A role for preprophase bands of microtubules in maturation of new cell walk, and a general proposal on the function of preprophase band sites in cell division in higher plants. J. Cell Sci. 97, 527-537.
Mueller, P.R., and Wold, B. (1989). In vivo footprinting of a muscle specific enhancei by ligation mediated PCR. Science 246,780-786.
Nairn, C.J., Winesett, L., and Ferl, R.J. (1988). Nucleotide sequence of an actin gene from Arabidopsis thaliana. Gene 65, 247-257.
Nakajima-lijima, S., Hamada, H., Reddy, P., and Kakunaga, T. (1985). Molecular structure of the human cytoplasmic p-actin gene: Interspe- cies homology of sequences in the introns. Proc. Natl. Acad. Sci.
Palevitz, B.A. (1987). Actin in the preprophase band of Allium cepa. J. Cell Biol. 104, 1515-1520.
Palevitz, B.A., and Liu, B. (1992). Microfilaments (Factin) in genera- tive cells and sperm: An evaluation. Sex. Plant Reprod. 5, 89-100.
Parthasarathy, M.V., Perdue, T.D., Witzmun, A., and Alvernaz, J. (1985). Actin network as a normal component of the cytoskeleton in many vascular plant cells. Am. J. Bot. 72, 1318-1323.
Pearson, L., and Meagher, R.B. (1990). Diverse soybean actin tran- scripts contain a large intron in the 5’untranslated leader: Structural similarity to vertebrate muscle actin genes. Plant MOI. Biol. 14,
Perdue, T.D., and Parthasarathy, M.V. (1985). In situ localization of F-actin in pollen tubes. Eur. J. Cell Biol. 39, 13-20.
Pierson, E.S., Derksen, J., and Traas, J.A. (1986). Organization of microfilaments and microtubules in pollen tubes grown in vitro or in vivo in various angiosperms. Eur. J. Cell Biol. 41, 14-18.
Sambrook, J., Fritsch, E.F., and Maniatis, T. (1989). Molecular Clon- ing: A Laboratory Manual. (Cold Spring Harbor, NV: Cold Spring Harbor Laboratory).
Senecoff, J., and Meagher, R.B. (1993). lsolating the Arabidopsis thaliana genes for de nmo purine synthesis by suppression of Escher- ichia coli mutants: 5’-Phosphoribosyl-5-aminoimadazole synthetase. Plant Physiol. 103, 387-399.
USA 82, 6133-6137.
’ ’
513-526.
Shimada, T., Fujii, H., and Lin, H. (1989). A 165-base pair sequence between the dihydrofolate reductase gene and thedivergently tran- scribed upstream gene is sufficent for bidirectional transcriptional activity. J. Biol. Chem. 264, 20171-20174.
Staiger, C.J., and Schliwa, M. (1987). Actin localization and function in higher plants. Protoplasma 141, 1-12.
Steer, M.W. (1990). Role of actin in tip growth. In Tip Growth in Plant and Funga1 Cells, I.B. Heath, ed (San Diego, CA: Academic Press),
Steer, M.W., andSteer, J.M. (1989). Pollen tube tipgrowth. New Phytol.
Tanzer, M.M., and Meagher, R.B. (1994). Faithful degradation of soy- bean rbcS mRNA in vitro. MOI. Cell. Biol. 14, 2640-2650.
Thangavelu, M., Belostotsky, D., Bevan, M.W., Flavell, R.B., Rogers, H.J., and Lonsdale, D.M. (1993). Partia1 characterization of the Nico- tiana tabacum actin gene family: Evidence for pollen specific expression of one of the gene family members. MOI. Gen. Genet.
Thompson, D.M., Tanzer, M.M., and Meagher, R.B. (1992). Degra- dation products of the mRNA encoding the small subunit of ribulose-l,5-bisphosphate carboxylase in soybean and transgenic petunia. Plant Cell 4, 47-58.
Tiwari, S.C., and Polito, V.S. (1988). Organization of the cytoskeleton in pollen tubes of Pyrus communis: A study employing conventional and freeze su bstitution electron microscopy, immunofluorescence, and rhodamine-phalloidin. Protoplasma 147, 100-112.
Twell, D., Yamaguchi, J., and McCormick, S. (1990). Pollen-specifc gene expression in transgenic plants: Coordinate regulation of two different tomato gene promoters during microsporogenesis. Devel- opment 109, 705-713.
White, R.G., and Sack, R.D. (1990). Actin microfilaments in the presumptive statocytes of root caps and coleoptiles. Am. J. Bot. 77,
Wolfe, K.H., Sharp, P.M., and Li, W.-H. (1989). Rates of synonymous substitution in plant nuclear genes. J. MOI. Evol. 29, 208-211.
Ytow, N., Yamada, T., and Ishizaka, S. (1992). Mechanics of the chlo- roplast rotation in Mougeotia: Measurement of angular velocity by laser diffractometry. Cell Motil. Cytoskeleton 23, 102-110.
Zhang, W., McElroy, D., and Wu, R. (1991). Analysis of rice Actl 5’ region activity in transgenic rice plants. Plant Cell 3, 1155-1165.
pp. 119-145.
111, 323-358.
240, 290-295.
17-26.