Consequences of Armed Con ict in the Middle East and...
92
Consequences of Armed Conflict in the Middle East and North Africa Region * Scott Gates 1,3 , H˚ avard Hegre 1,2 , H˚ avard Mokleiv Nyg˚ ard 1,2 , and H˚ avard Strand 1 1 Centre for the Study of Civil War, (PRIO) 2 University of Oslo 3 Norwegian University of Science & Technology November 23, 2010 * We thank the World Bank and the Norwegian Ministry of Foreign Affairs for support. We are grateful to the WDR and MNA team at the World Bank as well as participants at the World Bank’s Cyprus consultation meeting for valuable comments and inputs. We especially thank Colin Scott, Lene Lind, Phil Keefer and Gary Milante at the World Bank, as well as Simon Hug, Kaare Strøm and other participants at the CSCW Working Group meeting and participants at the PRIO-World Bank MENA Workshop, especially Michael Alvarez, for their valuable comments. In addition we thank Siri Aas Rustad for assistance. 1
Transcript of Consequences of Armed Con ict in the Middle East and...

Consequences of Armed Conflict in the Middle East and North
Africa Region ∗
Scott Gates1,3, Havard Hegre1,2, Havard Mokleiv Nygard1,2, and Havard Strand1
1Centre for the Study of Civil War, (PRIO)2University of Oslo
3Norwegian University of Science & Technology
November 23, 2010
∗We thank the World Bank and the Norwegian Ministry of Foreign Affairs for support. We are grateful tothe WDR and MNA team at the World Bank as well as participants at the World Bank’s Cyprus consultationmeeting for valuable comments and inputs. We especially thank Colin Scott, Lene Lind, Phil Keefer and GaryMilante at the World Bank, as well as Simon Hug, Kaare Strøm and other participants at the CSCW WorkingGroup meeting and participants at the PRIO-World Bank MENA Workshop, especially Michael Alvarez, fortheir valuable comments. In addition we thank Siri Aas Rustad for assistance.
1

Executive Summary
The consequences of violent conflict are profound and far reaching. Modern technologies
of war gives armies the capacity to kill scores of people efficiently and brutally. But the
consequences of war extend far beyond direct battlefield casualties. Although media at-
tention usually stops soon after a ceasefire has been signed, this is when the most dramatic
consequences kick in. We examine three types of consequences: economic, political and
health. A great deal of analysis has been carried out in the past decade on the the economic
consequences of war. A central finding of this literature is that war, especially civil war, is
a development issue. Conflict at once is both a consequence of lacking development, and
a cause of it. This has the potential of locking countries in a conflict trap. For the Middle
East and North Africa (MENA) region we also find traces of this economic conflict trap.
Wars have a lingering effect on growth; conflict both pushes a country off its initial growth
path, and slows it down long after the conflict has ended. The gravest consequences for the
MENA region are not economic, but political. The political far outweighs the economic.
Whereas many African countries are trapped in an economic conflict trap, many MENA
countries find themselves in a Political Conflict Trap.
We argue that conflict in the MENA region increases human rights abuses, inhibits
democratization and exacerbates social fragility. Furthermore, we find that for many of
the political consequences the effects of conflict are considerably more detrimental for
MENA countries than for war-torn countries in other regions. A MENA country which
experienced a durable war has a significantly higher probability of being in a situation
where “murders, disappearance and torture are a common part of life”. The mechanism
causing this is state securitization. War induces insecurity for leaders and this causes
them to resort to political incarceration, brutal subjugation and torture. Moreover, the
refreshing spray of a democratic wave has failed to reach the MENA region. The region’s
authoritarian and semi-democratic regimes are, by global standards, remarkably stable
and long-lived. Regimes with little or no constraints on the scope and authority of the
executive seem to receive a significant war dividend. That is, unconstrained regimes which
have experienced conflict endure much longer than those that have not. The pattern seen
elsewhere in the world, where wars often act as catalyst for positive social change, is wholly
absent in the MENA region.
The MENA political conflict trap does not merely have consequences for politics.
We also find marked effects of conflict on infant mortality, life expectancy and adequate
access to water. Nonetheless, mortality is in turn exacerbated by political factors. We
find for example that conflict increases infant mortality of a country by around 1 %.
2

In real terms this means that conflict causes an excess amount of infant deaths which
is on par with direct battle deaths. For every person killed in fighting, an infant that
would otherwise have survived dies as a consequence of that fighting. The main reason for
these excess deaths is the deterioration of health infrastructure. The securitization effect
we find for MENA countries, diverts resources away from building and rebuilding health
infrastructure or adequate sewage and water systems, and this exacerbates mortality. The
cause of increased mortality is not combat, but rather oppressive and inefficient regimes
caught in a political conflict trap.
3

CONTENTS CONTENTS
Contents
I Conflict in the MENA Region 7
1 Introduction 7
2 Conflict Trends in the MENA region, A General Overview 82.1 Trends in Number of Conflict and Battle Deaths . . . . . . . . . . . . . . . . . 82.2 Where are the Conflicts? . . . . . . . . . . . . . . . . . . . . . . . . . . . . . . . 10
3 How Conflict Affects the MENA Region Differently 123.1 Summary of Results for MDG Goals for MENA and the World . . . . . . . . . 13
II Development Consequences of Conflict 16
4 Economic Consequences 164.1 GDP Growth . . . . . . . . . . . . . . . . . . . . . . . . . . . . . . . . . . . . . 16
5 Health and Mortality Consequences 215.1 Battle Deaths . . . . . . . . . . . . . . . . . . . . . . . . . . . . . . . . . . . . . 215.2 Surplus Mortality . . . . . . . . . . . . . . . . . . . . . . . . . . . . . . . . . . . 225.3 Mechanisms . . . . . . . . . . . . . . . . . . . . . . . . . . . . . . . . . . . . . . 29
6 Political consequences 326.1 Human Rights Abuses . . . . . . . . . . . . . . . . . . . . . . . . . . . . . . . . 326.2 Changes to Formal Political Institutions . . . . . . . . . . . . . . . . . . . . . . 366.3 Trends For the MENA Region . . . . . . . . . . . . . . . . . . . . . . . . . . . . 406.4 Specific Regime-Type Consequence of Conflict . . . . . . . . . . . . . . . . . . . 416.5 Power-sharing Arrangements . . . . . . . . . . . . . . . . . . . . . . . . . . . . 496.6 Gender Parity . . . . . . . . . . . . . . . . . . . . . . . . . . . . . . . . . . . . . 516.7 Social Fragility . . . . . . . . . . . . . . . . . . . . . . . . . . . . . . . . . . . . 53
III The Political Conflict Trap 56
7 A Political Conflict Trap in the MENA Region 567.1 MENA Exceptionalism . . . . . . . . . . . . . . . . . . . . . . . . . . . . . . . . 597.2 Primary Commodities and Conflict . . . . . . . . . . . . . . . . . . . . . . . . . 59
8 Policy Implications 618.1 What Can Aid Donors Do? . . . . . . . . . . . . . . . . . . . . . . . . . . . . . 628.2 Conclusion . . . . . . . . . . . . . . . . . . . . . . . . . . . . . . . . . . . . . . 64
A Appendix 65A.1 Methodology . . . . . . . . . . . . . . . . . . . . . . . . . . . . . . . . . . . . . 65A.2 Conflict Country Categories . . . . . . . . . . . . . . . . . . . . . . . . . . . . . 67A.3 MDG indicators Used in the Analysis . . . . . . . . . . . . . . . . . . . . . . . 67A.4 Model Specification . . . . . . . . . . . . . . . . . . . . . . . . . . . . . . . . . . 67A.5 Regression Results . . . . . . . . . . . . . . . . . . . . . . . . . . . . . . . . . . 70A.6 Economic Growth . . . . . . . . . . . . . . . . . . . . . . . . . . . . . . . . . . 87
4

LIST OF FIGURES LIST OF TABLES
List of Figures
1 Trends in Number of Active Conflicts in the WORLD and MENA Region . . . 92 Trends in Number of Active Conflicts in the WORLD and MENA Region,
Internal and International . . . . . . . . . . . . . . . . . . . . . . . . . . . . . . 103 Distribution of Conflict in MENA Region, 1980 . . . . . . . . . . . . . . . . . . 124 Distribution of Conflict in MENA Region, 1995 . . . . . . . . . . . . . . . . . . 125 Distribution of Conflict in MENA Region, 2004 . . . . . . . . . . . . . . . . . . 136 Distribution of Average GDP per Capita Rates 2007, by Conflict . . . . . . . . 177 Trends in GDP Level, All Countries, 1990–2008 . . . . . . . . . . . . . . . . . . 188 Trends in GDP Level, MENA, 1990–2008 . . . . . . . . . . . . . . . . . . . . . 199 The Effect of War on Economic Growth . . . . . . . . . . . . . . . . . . . . . . 2010 Trends in Number of Battle Deaths in the WORLD and MENA Region, 1946–
2008 . . . . . . . . . . . . . . . . . . . . . . . . . . . . . . . . . . . . . . . . . . 2211 Distribution of Average Infant Mortality Rates 2007, by Conflict Category . . . 2412 Trends in Infant Mortality Rates, 1990–2008 . . . . . . . . . . . . . . . . . . . . 2513 Distribution of Average Life Expectancy Rates 2007, by Conflict Category . . . 2714 Distribution of Average Water Access Rates 2007, by Conflict Category . . . . 2915 Political Terror Scale by Conflict Categories . . . . . . . . . . . . . . . . . . . . 3316 Political Terror Scale by Post-Conflict Categories . . . . . . . . . . . . . . . . . 3517 Multidimensional Institutional Representation of Political Systems (MIRPS) . . 3818 Regime Type Trends for MENA . . . . . . . . . . . . . . . . . . . . . . . . . . 4019 Regime Type Trends for All Other Regions . . . . . . . . . . . . . . . . . . . . 4120 Executive Constraints . . . . . . . . . . . . . . . . . . . . . . . . . . . . . . . . 4521 Cost of Repression . . . . . . . . . . . . . . . . . . . . . . . . . . . . . . . . . . 4822 Distribution of Female Primary Education, Year 2000 . . . . . . . . . . . . . . 5223 Distribution of Female to Male Life Expectancy, Year 2000 . . . . . . . . . . . 53A-1 The Percentage of Population Suffering from Undernourishment, by Conflict
Status and State Fragility in 2000 . . . . . . . . . . . . . . . . . . . . . . . . . . 68A-2 GDP Growth, MENA Countries Only, 1990–2008 . . . . . . . . . . . . . . . . . 87
List of Tables
1 List of Armed Conflicts in the Middle East/North Africa Region, 1960–2008 . . 112 Summary of Results, Millenium Development Goals . . . . . . . . . . . . . . . 153 Millenium Development Goals, Population Affected, 2005 . . . . . . . . . . . . 154 Regime Stability by Region and Regime Type . . . . . . . . . . . . . . . . . . . 425 Regime Stability by Region and Regime Type for Conflict and Post-Conflict
Countries . . . . . . . . . . . . . . . . . . . . . . . . . . . . . . . . . . . . . . . 436 Durability of Three Different Levels of Executive Constraints by Conflict Status. 457 Tabulation of Country Years by Conflict and Oil-producing Status for MENA
Countries . . . . . . . . . . . . . . . . . . . . . . . . . . . . . . . . . . . . . . . 608 Tabulation of Countries by Conflict and Oil-producing Status . . . . . . . . . . 61A-1 Cross Section Analysis, Secondary Education Attainment . . . . . . . . . . . . 70A-2 Cross Section Analysis, Female Primary Education . . . . . . . . . . . . . . . 72A-3 Cross Section Analysis, Growth in GDP Capita . . . . . . . . . . . . . . . . . 73A-4 Cross Section Analysis, Infant Mortality Rates . . . . . . . . . . . . . . . . . . 74A-5 Cross Section Analysis, Life Expectancy . . . . . . . . . . . . . . . . . . . . . . 75A-6 Cross Section Analysis, Logged Infant Mortality . . . . . . . . . . . . . . . . . 76A-7 Cross Section Analysis, Female to Male Ratio . . . . . . . . . . . . . . . . . . 77
5

Background Paper: Consequences of Armed Conflict November 23, 2010
A-8 Cross Section Analysis, Access to Water . . . . . . . . . . . . . . . . . . . . . . 78A-9 Effect of Conflict on Annual Growth in GDP per Capita (PPP, logged), 1960–
2005, OLS with Panel-Corrected Standard Errors . . . . . . . . . . . . . . . . 79A-10 Fixed-Effects Analysis, Infant Mortality Rates, 1970–2005 . . . . . . . . . . . . 80A-11 Fixed-Effects Analysis, Life Expectancy, 1970–2005 . . . . . . . . . . . . . . . 81A-12 Fixed-Effects Analysis, Access to Water, 1990–2005 . . . . . . . . . . . . . . . 82A-13 Fixed-Effects Analysis, Parity in Primary School Enrollment, 1970–2005 . . . 83A-14 Fixed-Effects Analysis, Female to Male Life Expectancy, 1970–2005 . . . . . . 84A-15 Effect of Conflict on Riots, 1960–2006 . . . . . . . . . . . . . . . . . . . . . . . 85A-16 Effect of Conflict on Political Terror Scale, 1970–2005 . . . . . . . . . . . . . . 86
6

Background Paper: Consequences of Armed Conflict November 23, 2010
Part I
Conflict in the MENA Region
1 Introduction
War, especially civil war, is a development issue. War kills, but the consequences extend far
beyond those killed or wounded. In addition to battlefield casualties, armed conflict leads
to forced migration and the destruction of a societies’ infrastructure. Social, political, and
economic institutions are indelibly harmed. The consequences of war for development are
profound.
As a region the Middle East and North Africa (MENA) face considerable risk of conflict.
War, especially interstate and internationalized civil war, has ripped apart the region. This
paper explores the impact of these wars on the region. The paper provides a statistical analysis
of the consequences of conflict. More specifically, the effects of armed conflict on development
are evaluated with respect to health and mortality; economic growth; the political institutions
of a state; and human rights. This report also evaluates the direct and indirect mechanisms
through which violent conflict degrades the quality of life.
Not all consequences of conflict are measurable or have ever been measured. Indeed, many
consequences of armed conflict are not incorporated in our analysis, such as the increased
number of young males with war experience, accumulation of light weapons, erosion of trust,
etc. Such problems of missing data and unmeasurable data make it especially difficult to assess
systematically the consequences of conflict.1 We therefore focus primarily on the measurable
consequences of war in terms of its effect on economic, health, and political indicators.
These three dimensions, economic, health, and political, are interrelated. Political factors
in the MENA region trump the others. In contrast to other regions of the world where an
economic conflict trap is evident, in the MENA region this dynamic is as not evident. Conflict
1To paraphrase Donald Rumsfeld missing data are ‘known unknowns’ and unmeasurable data are ‘unknownunknowns’. The problem of missingness is serious. Data collection in war-torn countries is problematic. Toaddress this problem we interpolate the data. We can only discuss and interpret unmeasurable phenomena.Statistical analysis is of course impossible.
7

Background Paper: Consequences of Armed Conflict November 23, 2010
does affect economic growth, but nevertheless, in the MENA region the political consequences
are so much stronger. We refer to these effects as the Political Conflict Trap.
The consequences of war are profound and clearly evident. The quality of life is consistently
downgraded by armed conflict. Given the extent of conflict in the MENA region, development
policy needs to account for these effects. More particularly, the securitization of MENA
states, which constitute a fundamental aspect of the political conflict trap, affects budgets,
the implementation of health and economic policy, and the general policy environment.
2 Conflict Trends in the MENA region, A General Overview
2.1 Trends in Number of Conflict and Battle Deaths
The trend in the incidence of armed conflict2 in the MENA region and globally from 1945 to
2008 is shown in Figure 1. The figure shows a strong and fairly steady increase in the number
of conflicts up until the early 1990s, and then a strong decline for the next 10 years. The
increase in the 1970s and 1980s is probably a result of the Cold War era, during which the
superpowers and their allies fought and supported a broad range of wars and minor conflicts.
The decrease in the number of conflicts following the end of the Cold War did not come
immediately, because of the political instability in a large number of countries as communist
regimes were disbanded. Up until about 1993, the number of new armed conflicts exceeded
the number terminated.
Over the past five years the positive trend of the 1990s seems to have changed and we
observe a noticeable increase in the number of conflicts in the world. The reasons for this
increase are not clear. Possibly, the war on terror which has again led a superpower to both
actively fight wars and to lend its support to other conflict actors constitute an important
factor. Indeed, of the five major conflicts, i.e. conflicts that incurred more than 1000 battle
deaths a year, that were ongoing in 2008, the US and her allies were involved in four.
Looking at the trend for the Middle East and North Africa, we see a fairly similar picture3.
2These data are taken from the PRIO-Uppsala Armed Conflict Database. An armed conflict is definedas a contested incompatibility involving at least 25 battle deaths per year and in which at least one of thebelligerents is a state. See Gleditsch et al. (2002). Also see Appendix A.1.1.
3There is a widely held belief that the Gulf Cooperation Countries (GCC), i.e. Kuwait, Bahrain, SaudiArabia, Qatar, UAE and Oman, are substantially different from the other MENA countries and therefore thatyou can not compare across the two set. We have run all the analysis in this paper with a dummy markingGCC countries to see if we find statistically significant differences. Apart from female education we do not.
8

Background Paper: Consequences of Armed Conflict November 23, 2010
The level of conflict was fairly moderate until the late 1970s. Some of the conflicts in this pe-
riod were associated with decolonization, whereas other conflicts relate to issues of statehood,
in particular the Palestinian conflict. During the 1980s and well into the 1990s, the incidence
of conflict in the MENA region increased, with the Iran-Iraq war and the Algerian Civil War
as the two most intense conflicts. While the second half of the 1990s has been more peaceful
than the previous, the past decade has again witnessed more violence in the region.
The trend in the MENA region is not dissimilar from that of the rest of the world. Sørli,
Gleditsch and Strand (2005) reach a similar conclusion regarding the causes of conflict in
this region. While the region is known for its particular religious configuration and strong
dependence on oil, these variables do not explain more or less of conflict in this region than
in others.
Figure 1: Trends in Number of Active Conflicts in the WORLD and MENA Region
Figure 2 shows the same trends broken down into two categories: internal (left panel)
and international (right panel) conflicts. For the international category we group interstate
wars and civil conflicts that involve intervention from international actors together. Civil
conflict clearly is the dominant form of conflict. Proportionally the MENA region experiences
9

Background Paper: Consequences of Armed Conflict November 23, 2010
Figure 2: Trends in Number of Active Conflicts in the WORLD and MENA Region, Internaland International
a significant share of the globe’s international conflict.
Table 1 lists the conflicts in the MENA region included in this analysis (Gleditsch et al.
2002). The first column gives side a and the second column side b to the conflict. In intrastate
conflict side a is the government, while side b is the rebel group. Columns three and four
give the start and end year for the conflict, and the last column reports the intensity of the
conflict with “Minor” implying between 25 and 999 battle related deaths in a year, and “War”
implying more than 1000 battle deaths. For a conflict to be included at least one of the parties
have to be the government of a state, with states defined according to the list provided by
Gleditsch and Ward (1999).
2.2 Where are the Conflicts?
The maps in figures 3, 4 and 5 show the distribution of conflict for the MENA countries in
1980, 1995 and 2004. The MENA countries are colored grey, and the conflict regions are
marked with hatches. These maps show the geographic extent of conflicts in the region as
snapshots taken from a single year in each decade. The maps also indicate where conflict
occurred in neighboring countries outside the MENA region. The transnational aspects of
conflict are particularly relevant to MENA as several conflicts involve neighbors from other
regions. These conflicts are particularly relevant for Djibouti, Iraq, and Iran.
10

Background Paper: Consequences of Armed Conflict November 23, 2010
Tab
le1:
Lis
tof
Arm
edC
onflic
tsin
the
Mid
dle
Eas
t/N
orth
Afr
ica
Reg
ion,
1960
–200
8
Sid
eA
Sid
eB
Fir
stY
ear
Las
tY
ear
Hig
hes
tIn
tensi
ty
Alg
eria
Moro
cco
1963
1963
Min
orT
akfir
wa’
lH
ijra
,G
IA,
AIS
,A
QIM
1991
2008
War
Lib
yaC
had
1987
1987
War
Dji
bou
tiE
ritr
ea20
0820
08M
inor
FR
UD
1991
1994
Min
orF
RU
D–
AD
1999
1999
Min
or
Egy
pt
al-
Gam
a’a
al-I
slam
iyya
1993
1998
Min
or
Fra
nce
FL
N19
6019
62W
ar
Iran
AP
CO
1979
1980
Min
orIr
aq19
7419
88W
arJond
ullah,
PJA
K20
0520
08M
inor
KD
PI
1966
1996
War
ME
K19
7920
01W
ar
Iraq
Al-
Mah
di
Arm
y,R
JF
,A
nsa
ral
-Isl
am,
ISI
2004
2008
War
Aust
ralia,
UK
,U
SA
2003
2003
War
Kuw
ait
1990
1991
War
Milit
ary
fact
ion
(for
ces
ofB
riga
die
rA
rif)
,N
CR
C19
6319
63W
arSC
IRI
1982
1996
War
KD
P,
PU
K,
KD
P-Q
M19
6119
96W
ar
Isra
elE
gypt,
Jord
an,
Syri
a19
6719
73W
arH
ezb
olla
h19
9020
06M
inor
Pal
esti
nia
nin
surg
ents
1960
2008
Min
or
Leb
anon
LA
A,
LN
M,
Am
al,
NU
F,
Hob
eika
fact
ion,
Aou
nfa
ctio
n19
7519
90W
ar
Moro
cco
Milit
ary
fact
ion
(for
ces
ofM
oham
edM
adb
ouh)
1971
1971
Min
orP
OL
ISA
RIO
1975
1989
Min
or
Nor
thY
emen
Sou
thY
emen
1972
1979
Min
orN
atio
nal
Dem
ocr
atic
Fro
nt
1980
1982
Min
orR
oyalist
s19
6219
70W
ar
Om
anP
FL
O19
7219
75M
inor
Sau
di
Ara
bia
JSM
1979
1979
Min
or
Sou
thY
emen
Yem
enit
eS
oci
alis
tP
arty
-Is
mai
lfa
ctio
n19
8619
86W
ar
Syri
aM
usl
imB
roth
erhood
1979
1982
War
Milit
ary
fact
ion
loya
lto
Ata
ssi
and
Zea
yen
1966
1966
Min
or
Tun
isia
Fra
nce
1961
1961
War
Res
ista
nce
Arm
eeT
unis
ienn
e19
8019
80M
inor
Yem
enD
emocr
atic
Rep
ub
lic
ofY
emen
1994
1994
War
UK
(South
Yem
en)
FL
OS
Y19
6419
67M
inor
11

Background Paper: Consequences of Armed Conflict November 23, 2010
Figure 3: Distribution of Conflict in MENA Region, 1980
Figure 4: Distribution of Conflict in MENA Region, 1995
3 How Conflict Affects the MENA Region Differently
Is the MENA region different from other regions in terms of the consequences of conflict?
In the following section we provide an overview of the effect of conflict on the Millennium12

Background Paper: Consequences of Armed Conflict November 23, 2010
Figure 5: Distribution of Conflict in MENA Region, 2004
Development Goals. These goals are more or less universally accepted as the benchmarks for
evaluating development. The following section juxtaposes the effect of war on MDGs in the
World and in the MENA region. The overview shows that the consequences of conflict for
development are less detrimental in the MENA region than in the world as a whole (excluding
the OECD countries).
This section is meant to place the MENA region in a global context. In the following
sections we analyze the effect of conflict on economic, health and mortality and political
factors for the MENA region on its own.
3.1 Summary of Results for MDG Goals for MENA and the World
In a series of statistical analyzes, we have investigated how conflict affects the achievement
of the millennium development goals. These analyses are based on data for all countries in
the world. For most indicators, the effect of conflict is likely to be independent of the region
the country is located within. For our global assessment we also investigated the effect of a
country having a fragile status on the the different Millennium development goals.
We analyze the effect of conflict on seven of the millennium development goals. Table 2
13

Background Paper: Consequences of Armed Conflict November 23, 2010
lists these MDGs as well as the various indicators we analyze to gauge the effect of conflict
on the attainment of the goals. As table 2 indicates, for the world as a whole, we find
clear detrimental effects of conflict on undernourishment, poverty, life expectancy, GDP per
capita, primary school enrollment, secondary school enrollment, gender ratio in primary school
enrollment, gender ratios in life expectancy, infant mortality, under 5 year old mortality, and
on access to water. The effect of conflict is unclear (small coefficient and large standard error)
for the proportion having a health care professional attending a birth and access to sanitation.
The effect of war on HIV is positive – meaning that war actually helps a country move towards
achieving that MDG.
For the MENA countries in contrast, the effect of conflict is detrimental for life expectancy,
primary school enrollment gender ratios, infant mortality, and access to water. For some re-
lationships in the MENA region, the effect of conflict is unclear (small coefficient and large
standard error) – for undernourishment, primary school enrollment, secondary school enroll-
ment, and under five year old mortality. We find no effect of war on poverty or access to
sanitation.
As discussed below, these effects are quite strong. Five years of sustained conflict with
only a moderate amount of direct fatalities (on average) push 3–4% of the population into
undernourishment. We also find conflicts to generate a surplus infant mortality at the same
level as the direct deaths – for every soldier killed in battle, one infant dies that would otherwise
have survived through the indirect effects of conflict.
For some of the MDGs we do not find clear effects. This is partly due to incomplete
data – the indicators we use for MDG1 and MDG4 are among those with best coverage. We
find clearer effects of indicators that change relatively rapidly, such as GDP per capita or
undernourishment. It is harder to identify clear causal effects of conflict for variables that
change more slowly.
Our analysis is fairly conservative, focusing exclusively on change within countries. This
means that we cannot make much use of information for countries that have remained in
conflict over the entire period for which we have data. There is no doubt whatsoever that
fragile states and conflict countries are further from achieving the millennium development
goals than countries without such problems.
Table 3 compares the mean and median values across a series of indicators of the MDGs
14
Background Paper: Consequences of Armed Conflict November 23, 2010
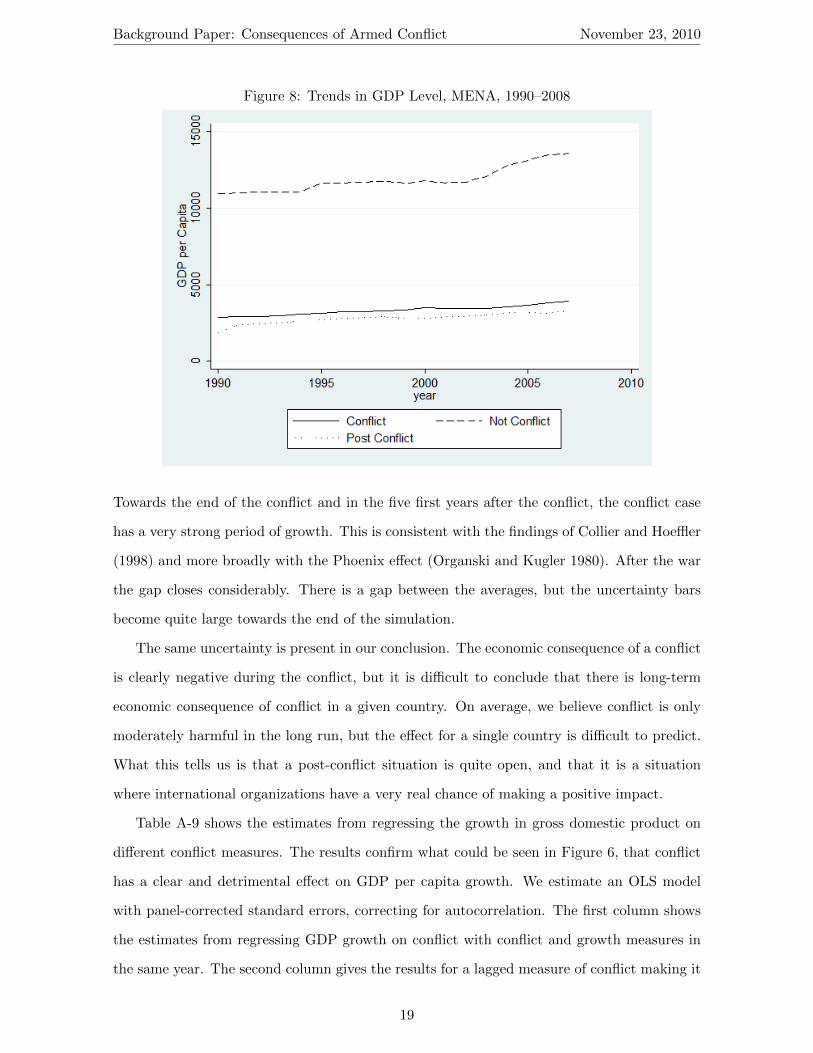
Table 2: Summary of Results, Millenium Development Goals
MDG Label Indicator Effect of Effect ofConflict World Conflict MENA
MDG 1 Ending Poverty Undernourishment Detrimental Uncleara
MDG 1 and Hunger Poverty Headcount Detrimental No effectb
MDG 1 Life expectancy Detrimental Detrimentalc
MDG 1 GDP per capita Detrimental Detrimental
MDG 2 Universal Prim. Sch. Enrollment Detrimental UnclearMDG 2 Education Sec. Sch. Attainment Detrimental Unclear
MDG 3 Gender Parity Primary School ratio Detrimental UnclearMDG 3 Life expectancy Unclear Unclear
MDG 4 Child Mortality Infant Mortality Detrimental DetrimentalMDG 4 Under-5 Mortality Detrimental Unclear
MDG 5 Maternal Mortality Birth Attendance Unclear Ambiguousd
MDG 6 Combat HIV/AIDS Proportion HIV positive Positive No effect
MDG 7 Environmental Access to Water Detrimental DetrimentalMDG 7 Sustainability Access to Sanitation Unclear No effect
a Unclear denotes large Standard Errors (SE) and high Coeffecientb No effect denotes large SE and low coefficientsc Detrimental denotes low SE and a substantial negative effectd Ambiguous denotes that the statistical effect has more than one theoretical explanation
Table 3: Millenium Development Goals, Population Affected, 2005
MDG Label Indicator Developing Countries MENA countriesMDG Label Indicator Median (Mean) Median (Mean)
MDG 1 Ending Poverty and Hunger Undernourishment 6% (12%) 5% (8%)MDG 1 GDP per capita (USD) 1452 (3578) 5119 (8727)MDG 2 Universal Education Primary Sch. Enrollment 91% (89%) 89% (86%)MDG 2 Sec. Sch. Attainment 71% (70%) 75% (69%)MDG 3 Gender Parity Female Primary Sch. 97% (95%) 97% (95%)
Life Expectancy Ratio 1.06 (1.07) 1.05 (1.05)MDG 4 Child Mortality Infant Mortality per 1000 20 (32) 19 (26)MDG 4 Under-5 Mortality per 1000 25 (44) 25 (31)MDG 5 Maternal Mortality Birth Attendance 97% (82%) 98% (94%)MDG 6 Combat HIV/AIDS Proportion HIV positive 0.5 (2.4) 0.48 (.1)MDG 7 Environmental Access to Water 86% (80%) 96% (91%)MDG 7 Sustainability Access to Sanitation 65% (62%) 85% (81%)
for MENA states and all the other developing countries.4
4We have excluded from our analysis all countries labeled as industrialized in the first World DevelopmentReport (1977), except for South Africa. We redefine South Africa as a developing country. This list correspondswith the OECD member states).
15

Background Paper: Consequences of Armed Conflict November 23, 2010
Part II
Development Consequences of Conflict
4 Economic Consequences
In this section we examine the economic consequences of conflict. There is a large literature
on the economic conflict trap (Collier et al. 2003), which posits that underdevelopment is
both a cause and a consequence of conflict. That is, economic underdevelopment increases
the likelihood of conflict, and conflict exacerbates economic underdevelopment. For the world
in general, in some respects nearly all the millennium development goals are affected by the
destructiveness of armed conflict. Indeed, for Sub-Saharan Africa and South Asia we find
quite dramatic effects of conflict on a number of development indicators. For the MENA
region the effects are less dramatic. We find an effect of conflict on economic growth. But
this effect is much less profound than for the world as a whole. This may be due to the size
of the region, but it is more likely due to the point of departure for most MENA countries.
The initial values for the MENA region are quite different from much of the developing world,
which may go a long way in mitigating the effects of conflict. We find that given a reasonably
high starting point in terms of development, the speed of recovery from conflict in economic
terms can be quite impressive.
4.1 GDP Growth
Figure 65 shows the mean GDP per capita across countries that have not had conflict, those
that are in conflict and those having recently experienced conflict. The figure shows that
the difference between conflict and non-conflict countries is greater in the MENA region than
globally. The bar for post-conflict countries shows that while these countries generally exhibit
higher GDP per capita than conflict countries, they are significantly lower than the no-conflict
5The median value in each group is given by the vertical line inside the box in the center of each box-whisker combination. The outer values of this box are the 25th and 75th percentiles. The whiskers representthe ‘adjacent values’ (Tukey 1977) – the upper adjacent value is the largest value smaller than x75+ 3
2(x75−x25).
The dots represent extreme observations outside the adjacent values.
16

Background Paper: Consequences of Armed Conflict November 23, 2010
countries.
Figure 6: Distribution of Average GDP per Capita Rates 2007, by Conflict
These box-and-whisker diagrams provide an elegant way to visualize a variety of descriptive
statistics. The main problem with them is that they are static. Figures 7 and 8, therefore,
show the trends over time in GDP per capita across three groups of countries: A set that
have not had conflict, A set consisting of countries in conflict and a third set consisting of
post-conflict countries. The first group consists of all countries that have not had any conflict
in the period 1980–2008, labeled ”Not Conflict” in the figures. The second group is made up
of the countries that had conflict in the period 1980–1990, but not in the period 1990–2008.
These are labeled ”Post Conflict”. The final category consists of the countries that have had
conflict in the period 1990–2008, which is labeled ”Conflict”. The rationale for using this
classification rather than a yearly classification of actual conflict status is to maintain the
focus on the consequence of conflict. If we used an exact classification of conflict category,
the overall trend would be very dependent on particular countries jumping between categories
rather than the overall average differences between the categories. 6
Figure 7 shows all countries in the world. Figure 8 shows only the MENA country trends.
6An alternative would be to use moving averages, but this would be more suitable for longer time series.Another alternative would be to use GDP growth as the Y-axis. We provide a illustration of this model inFigure A-2 along with a discussion of why this presentation is problematic.
17

Background Paper: Consequences of Armed Conflict November 23, 2010
Evident from Figures 7 and 8 is that while the general pattern is one of globally improving
GDP per capita over time, there are significant differences between conflict-affected countries
on the one hand and peaceful countries on the other. Conflict and post-conflict countries are
developing at similar rates – they tend to be poor and remain poor. This is consistent with
the Collier et al. (Collier et al. 2003) notion of an economic conflict trap. In the MENA
sample, the post-conflict countries are actually slightly poorer than the countries in conflict,
but this is due to the strong influence of Israel.
Figure 7: Trends in GDP Level, All Countries, 1990–2008
So far, we have examined the difference in averages between countries across the conflict
categories statically and over time. In this we explicitly did not allow countries to move across
categories. These graphs therefore can not shed any light on the consequences of conflict on
a given country. To account for the individual country trends and idiosyncracies we ran a
fixed effect regression analysis. Based on this model, we simulate the effect of thirteen years
of war from 1974 to 1986 on a simulated average MENA country (a hypothetical composite
defined from our analysis of the data). Figure 9 presents the estimated effect of war on GDP
level over time. The red dots are the simulated average for a case with no conflict, and the
blue line is the simulated average level for a case with a 1974–1986 war. The bars indicate the
uncertainty of the conflict case estimates. The figure show a dramatic gap during the conflict.
18
Background Paper: Consequences of Armed Conflict November 23, 2010
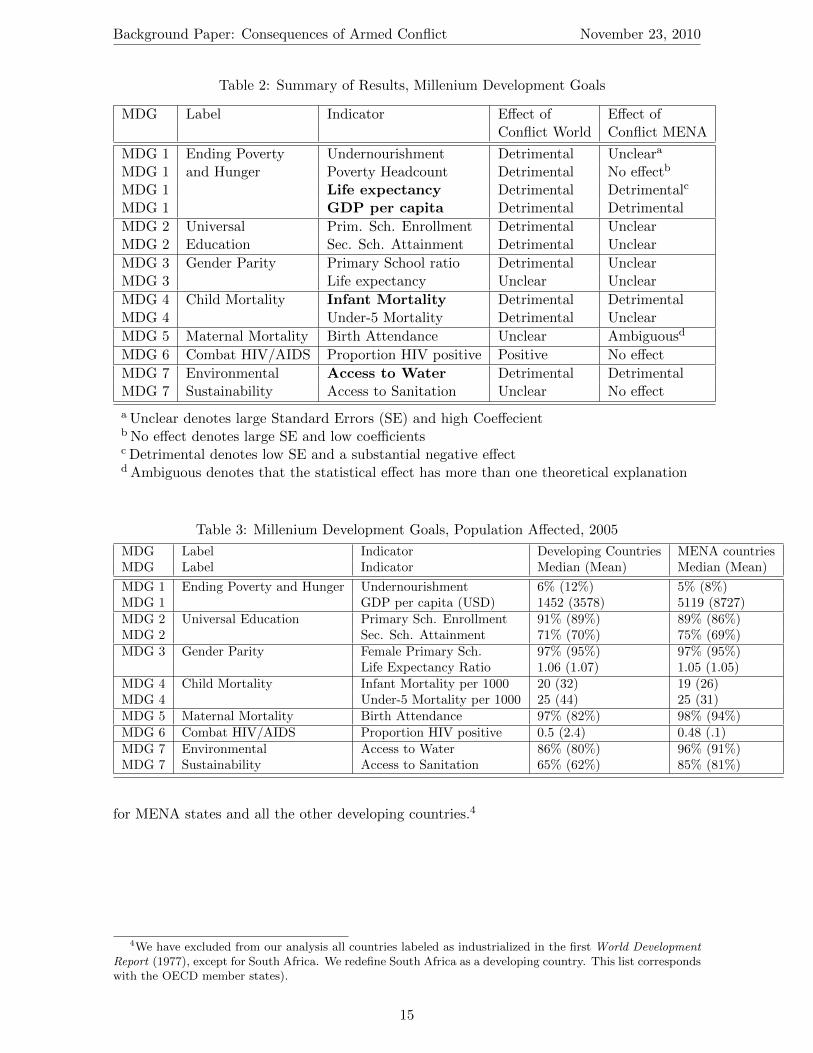
Figure 8: Trends in GDP Level, MENA, 1990–2008
Towards the end of the conflict and in the five first years after the conflict, the conflict case
has a very strong period of growth. This is consistent with the findings of Collier and Hoeffler
(1998) and more broadly with the Phoenix effect (Organski and Kugler 1980). After the war
the gap closes considerably. There is a gap between the averages, but the uncertainty bars
become quite large towards the end of the simulation.
The same uncertainty is present in our conclusion. The economic consequence of a conflict
is clearly negative during the conflict, but it is difficult to conclude that there is long-term
economic consequence of conflict in a given country. On average, we believe conflict is only
moderately harmful in the long run, but the effect for a single country is difficult to predict.
What this tells us is that a post-conflict situation is quite open, and that it is a situation
where international organizations have a very real chance of making a positive impact.
Table A-9 shows the estimates from regressing the growth in gross domestic product on
different conflict measures. The results confirm what could be seen in Figure 6, that conflict
has a clear and detrimental effect on GDP per capita growth. We estimate an OLS model
with panel-corrected standard errors, correcting for autocorrelation. The first column shows
the estimates from regressing GDP growth on conflict with conflict and growth measures in
the same year. The second column gives the results for a lagged measure of conflict making it
19

Background Paper: Consequences of Armed Conflict November 23, 2010
Figure 9: The Effect of War on Economic Growth
possible to assess the impact of a conflict up until 10 years ago on GDP growth in any given
year. Columns five and six correspond to one and two but for these we substituted a categorical
conflict measure for a continuous measure of battle deaths. As model 1 shows, one year of
minor conflict reduces the growth in GDP of between 1% and 2%. If we switch from conflict
to battle deaths the results remain largely the same. As for the lingering effect of conflict we
find that a significant negative effect of a conflict that ended last year on growth this year.
Although the results indicate that this negative effect continues for up to four years, these
results are not statistically significant. We control for regional effects by including dummy
variables for every region, using the OECD countries as the reference category. For the model
with a battle deaths measure, column four, we find a significant negative effect for the MENA
dummy. This means that the economic consequences of conflict (as measured across MDGs)
are more severe in the MENA region than among the OECD countries, but less severe than
in areas such as Sub-Saharan Africa or South Asia.
20

Background Paper: Consequences of Armed Conflict November 23, 2010
5 Health and Mortality Consequences
We now turn to the consequences of conflict for health and mortality. More precisely, we
analyze and estimate the effect of violent conflict on infant mortality rates, life expectancy
and access to adequate sources of water. Access to water is considered a question of health
since inadequate access to water increases the risk of outbreak and spreading of e.g. diarrhea-
related diseases. In addition to these more indirect causes of conflict, we will also examine
direct consequences of conflict on health through battle deaths. We will show that although
battle deaths are the most visible effect of conflict, the big killers actually come in the wake
of these direct deaths.
In an influential article, Ghobarah, Huth and Russett (2003) argue that civil wars have
a long term effect on civilian suffering. Analyzing the World Health Organization’s measure
of so-called Disability Adjusted Life Years (DALYs) they argue that 8.01 million DALYs
were lost in 1999 from civil wars during the period 1991–97. The authors build on these
findings in a later article (Ghobarah, Huth and Russett 2004) and argue that the additional
burden of death and disability caused by the lingering effects of civil wars, is nearly double
the immediate and direct effect of these war. Civil wars, they argue, “directly effects all the
major contributors to health: exposure to disease, medical care, public health interventions,
and overall socio-economic conditions” (Ghobarah, Huth and Russett 2004, 871).
The most comprehensive and recent study of the effects of conflict on health was carried
out by Iqbal (2010). Following up on an earlier article, (Iqbal 2006), she argues that conflict
results in a deterioration in public health, mainly because of the effect of conflict on both
general infrastructure and health infrastructure. All of these authors are adopting, by and
large, the line of argumentation first proposed by King and Murray (2001) on the need to
focus on human security.
5.1 Battle Deaths
Figure 10 shows the trend in battle-related fatalities in the post-WWII period. It is worth
noting that the peaks in the graph are modest relative to the number of fatalities experienced
during the two world wars. Up until the mid 1970s the conflicts in East Asia completely
dominate the picture. The Chinese Civil War, the Korean War, the Vietnamese War and
21

Background Paper: Consequences of Armed Conflict November 23, 2010
the Cambodian Civil War were dramatic events that overshadow all other conflicts in this
period. However, after the Vietnamese invasion of Cambodia, East Asian contributions to the
battle-related fatalities have been modest. The first Arab-Israeli war of 1948 is the first in a
series of large wars in the MENA region. The Algerian war of independence is one of the most
serious conflicts during the 1950s and accounts for a large share of the total battle-related
fatalities during this decade. After 1980 the MENA region has contributed a major share of
global conflict fatalities. The war between Iran and Iraq (1980–88) is by far the most deadly of
these, but the later internal conflicts in Iraq also contribute significantly to the overall trend.
Figure 10: Trends in Number of Battle Deaths in the WORLD and MENA Region, 1946–2008
5.2 Surplus Mortality
5.2.1 Infant Mortality
Figure 11 provides an initial and somewhat crude look at the effect of conflict on infant
morality. The figure shows the mean logged infant mortality, measured as the number of
infants per 1000 who die before reaching one year of age, in the year 2008 across conflict and
region. Clearly the non-conflict countries perform much better in terms of infant mortality
than conflict-affected countries. This holds for both the world and for the MENA region,
22

Background Paper: Consequences of Armed Conflict November 23, 2010
but the differences in means between non-conflict and conflict countries are greater globally
than for MENA countries. Figure 12 shows the same distribution over time. As the figure
reveals, all countries, regardless of conflict category, have experienced an improvement in
infant mortality rates. Conflict and post-conflict countries however clearly lag behind the the
non-conflict countries. Although the situation is improving, the conflict countries are both
improving more slowly and starting at a higher rate than non-conflict countries. This means
that a surplus of infants die in conflict and post-conflict countries that would, all else being
equal, have survived in non-conflict countries. Next we run two sets of regression analysis.
The first one looks at the effect of conflict on infant mortality rates. In this we estimate the
effect of past conflict on present infant mortality rates. In the second we look at the effect
of conflict on the improvement in infant mortality rates. We thus not only look at the direct
effect of conflict on crude mortality rates, but also examine how conflict affects a country’s
ability to achieve the Millennium Development Goal of reducing infant mortality rates. Both
regression tables can be found in the appendix.
In terms of our first measure the analysis show that one year of conflict increases the
infant mortality with 1.17 %, see table A-10. For a typical MENA country (excluding Israel)
this corresponds to an increase in infant mortality from 63.4 per 1000 live births to 64.5 per
1000. At first glance that might not seem like a substantial increase. In a typical country
however 250.000 infants are born every year. An increase in infant mortality from 63.4 to
64.5 corresponds to an extra death toll of 275 infants. Five years of conflict increases the
estimate to 2750 infants. This implies that conflict results in surplus death of infants on the
same magnitude as direct battle deaths.
There are mainly two mechanisms causing these excess deaths. The first and most obvious
is, of course, deaths occurring due to fighting. The number of deaths caused by this will
largely be a function of the technology used and the strategy and tactics employed in the war.
Kalyvas and Balcelles (2010b) analyze the technology of rebelion by considering the strength
of the state and the rebel organization. A weak insurgency fighting a strong state will fight
differently from a relatively strong insurgency fighting a strong state. At the one extreme
thus we find infant deaths caused by aerial bombardment or artillery shelling. An example
would be Israeli attacks on Gaza City during the 2008 war. On the other extreme we find
deaths caused by guerilla raids on cities or villages. Clearly the former type will result in
23

Background Paper: Consequences of Armed Conflict November 23, 2010
many more infant deaths than the later. Given that the Middle East has a high proportion
of interstate wars, as discussed above, and that these wars tend to be characterized more
by bombardment and shelling than guerilla raids, it is actually not surprising that we find
a greater effect of conflict on infant mortality for the MENA subset of countries than for
the world average. It should be noted here that different kinds of warfare will differ in their
effect on various health indicator. HIV/AIDS rates in contrast to infant mortality rates might
be more affected by guerilla warfare than by more conventional warfare. As Iqbal and Zorn
(2010, 152) argue, guerrilla warfare is characterized by “substantial interaction between rebel
combatants and civilians, with the result that such conflicts’ direct effects on HIV transmission
will be substantial as well”.
Figure 11: Distribution of Average Infant Mortality Rates 2007, by Conflict Category
These direct deaths, however, are only a part of the surplus deaths caused by conflict.
Although it is hard to measure the exact ratio, most probably a greater number of infant
deaths occur due to the indirect effects of conflict. These indirect effects range from disruption
of health infrastructure, which obviously affect an infants chance of surviving, to increased
spread of diseases. As discussed below in relation to access to water epidemiological research
argues that disease, and especially diarrhea, has a greater effect on mortality rates than direct
battle deaths (Degomme and Guha-Sapir 2010). Degomme and Guha-Sapir (2010, 297) study
24

Background Paper: Consequences of Armed Conflict November 23, 2010
Figure 12: Trends in Infant Mortality Rates, 1990–2008
Darfur and argue that “more than 80% of excess deaths were not a result of [the] violence.
(...) but the main cause of mortality during the stabilization period were diseases such as
diarrhoea”. Such excess deaths are the result of an increased spread of disease, which in turn
drive up infant mortality rates. The increased spread may be caused by the inability of states
to provide health services for their population during war time, or to conditions in e.g. refugee
camps that increases the transmission of disease. By and large people do not die battle-related
deaths after the point at which a cease-fire is decleared7. Excess deaths due to the spread
of disease and the disintegration of health infrastructure, on the other hand, leads to higher
mortality rates for years after the violent conflict has ended.
Conflict, however, does not only effect the infant morality rate, it also effects changes in
these rates. We examine this by looking at the effect of conflict on the trajectory of im-
provement or worsening of infant mortality rates. The results of that analysis is found in the
appendix, A-10. The results clearly show that conflict does not only have a detrimental effect
on crude rates, it also affects the rate of improvement. Although we do not find significant
results for minor conflict, i.e. less than 1000 battle related deaths, for major wars we find a
7This of course is not completely true. Deaths due to e.g. land-mines and unexploded ordinance often killpeople long after a a truth have been declared. Such deaths are of course battle-related deaths.
25
Background Paper: Consequences of Armed Conflict November 23, 2010
significant and substantial detrimental effect. Conflict not only hurts a country’s infant mor-
tality rates in the years immediately following conflict. The effect lingers on. The main reason
for this lingering effect is, probably, the weakening of institutions of governance, especially
health infrastructure, through conflict, that in turn makes it harder for countries to catch up
with the non-conflict countries.
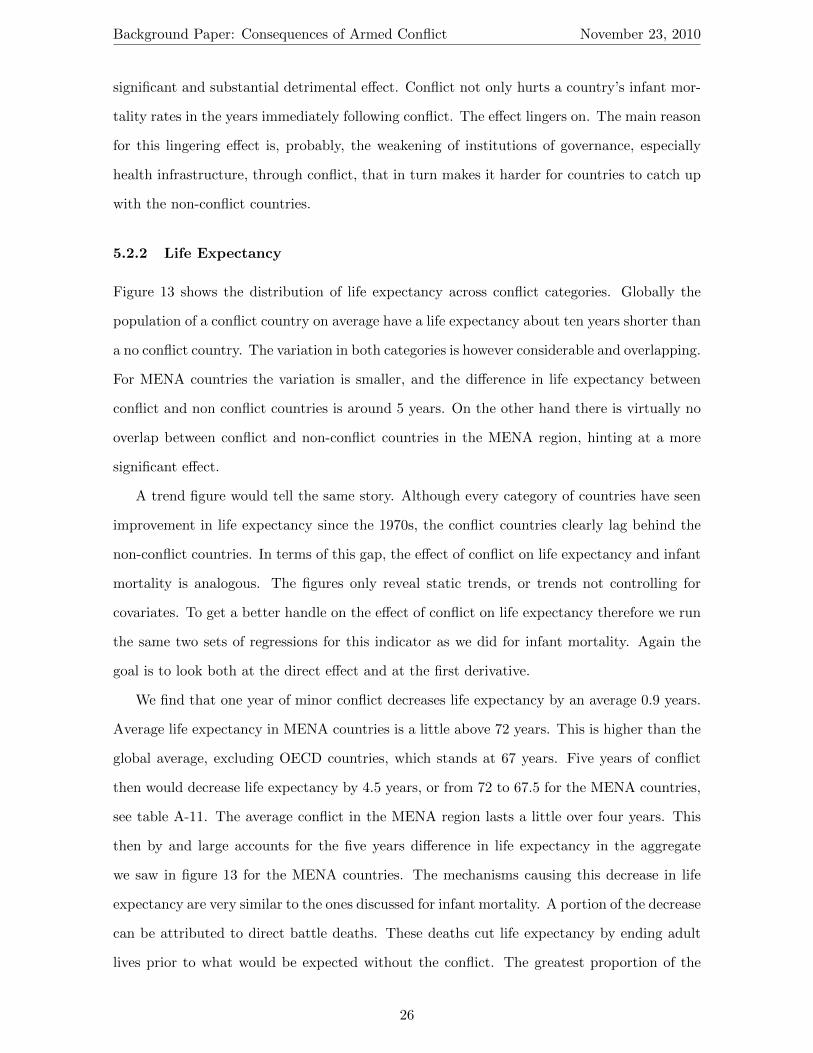
5.2.2 Life Expectancy
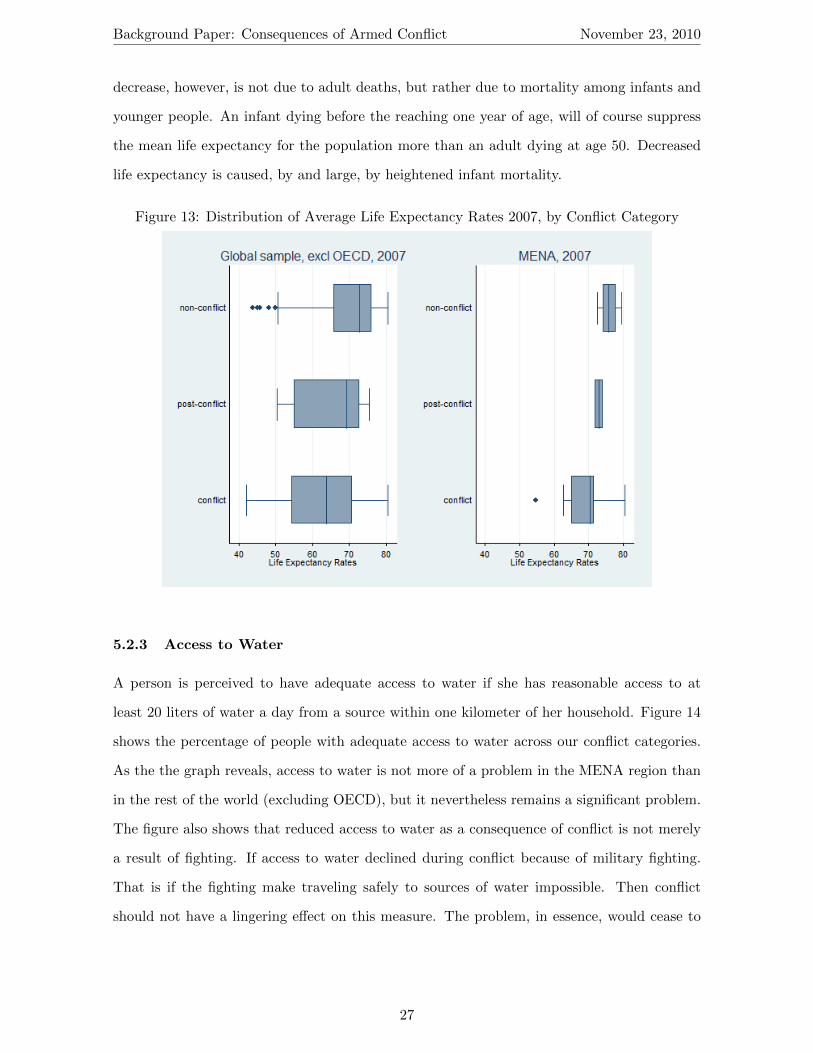
Figure 13 shows the distribution of life expectancy across conflict categories. Globally the
population of a conflict country on average have a life expectancy about ten years shorter than
a no conflict country. The variation in both categories is however considerable and overlapping.
For MENA countries the variation is smaller, and the difference in life expectancy between
conflict and non conflict countries is around 5 years. On the other hand there is virtually no
overlap between conflict and non-conflict countries in the MENA region, hinting at a more
significant effect.
A trend figure would tell the same story. Although every category of countries have seen
improvement in life expectancy since the 1970s, the conflict countries clearly lag behind the
non-conflict countries. In terms of this gap, the effect of conflict on life expectancy and infant
mortality is analogous. The figures only reveal static trends, or trends not controlling for
covariates. To get a better handle on the effect of conflict on life expectancy therefore we run
the same two sets of regressions for this indicator as we did for infant mortality. Again the
goal is to look both at the direct effect and at the first derivative.
We find that one year of minor conflict decreases life expectancy by an average 0.9 years.
Average life expectancy in MENA countries is a little above 72 years. This is higher than the
global average, excluding OECD countries, which stands at 67 years. Five years of conflict
then would decrease life expectancy by 4.5 years, or from 72 to 67.5 for the MENA countries,
see table A-11. The average conflict in the MENA region lasts a little over four years. This
then by and large accounts for the five years difference in life expectancy in the aggregate
we saw in figure 13 for the MENA countries. The mechanisms causing this decrease in life
expectancy are very similar to the ones discussed for infant mortality. A portion of the decrease
can be attributed to direct battle deaths. These deaths cut life expectancy by ending adult
lives prior to what would be expected without the conflict. The greatest proportion of the
26
Background Paper: Consequences of Armed Conflict November 23, 2010
decrease, however, is not due to adult deaths, but rather due to mortality among infants and
younger people. An infant dying before the reaching one year of age, will of course suppress
the mean life expectancy for the population more than an adult dying at age 50. Decreased
life expectancy is caused, by and large, by heightened infant mortality.
Figure 13: Distribution of Average Life Expectancy Rates 2007, by Conflict Category
5.2.3 Access to Water
A person is perceived to have adequate access to water if she has reasonable access to at
least 20 liters of water a day from a source within one kilometer of her household. Figure 14
shows the percentage of people with adequate access to water across our conflict categories.
As the the graph reveals, access to water is not more of a problem in the MENA region than
in the rest of the world (excluding OECD), but it nevertheless remains a significant problem.
The figure also shows that reduced access to water as a consequence of conflict is not merely
a result of fighting. If access to water declined during conflict because of military fighting.
That is if the fighting make traveling safely to sources of water impossible. Then conflict
should not have a lingering effect on this measure. The problem, in essence, would cease to
27

Background Paper: Consequences of Armed Conflict November 23, 2010
be a problem the day a cease-fire was called.8 In such a case, post-conflict countries should
not perform worse than non-conflict countries on this measure. Nonetheless, they do. The
effect of conflict, therefore, goes beyond this issue of physical separation. Access to water is
also closely related to the the two previous mortality measures we analyzed. As noted above
diarrhea is one of the biggest killers in the wake of conflict. The spread of this disease is
closely related to the availability of adequate drinking water.
For our analysis we estimate two sets of regressions, the results can be found in the
appendix, see table A-12. The results show that one year of minor conflict decrease the
population with adequate access to water with close to 0.9 percentage points. In an average
MENA country close to 10 % of the population lacks adequate access to water. After five
years of conflict 14.54 % of the population would not have adequate access to water. In a
MENA country with average population this corresponds to adding a little over 51.000 people
to the segment of the population without adequate access to water according to our estimates.
Clearly that is a substantial effect of conflict.
We argued above that the detrimental effect of conflict on access to water is not just due
to fighting decreasing the mobility of a country’s population. To better analyze that claim we
estimate our regression analysis with a lagged conflict measure. The substantial effect of the
lagged conflict measure seems to confirm this claim. We also find a significant effect of conflict
on the rate of change in access to water rates. This corresponds with the previous indicators.
Conflict affects a state’s ability to provide adequate water supplies for its population even after
the conflict has ended, and this accounts for the detrimental effect of conflict on improvement
in access rates. This decrease in water accessibility can occur through the destruction of
infrastructure, especially pipes and pumping stations.
Such infrastructure destruction would set the country back on this indicator, but it ac-
counts poorly for the long term damage we see through the analyzes of the improvement gap.
Infrastructure after all is relatively easy to rebuild, and after large scale conflicts international
funds are often amassed to help with precisely such types of rebuilding. Our finding that
conflict has an enduring effect on access to water must consequently be accounted for through
other causes as well. One potential mechanism relates to the political conflict trap. During
conflict government funds are shifted from “butter to guns”, and the weak institutions that
8That might be an overstatement. Once again land-mines and unexploded ordinance can take huge deathtolls after fighting has stopped
28

Background Paper: Consequences of Armed Conflict November 23, 2010
Figure 14: Distribution of Average Water Access Rates 2007, by Conflict Category
we argue often result from conflict in the MENA region may be unable to shift focus back to
“butter” and thus rebuild critical infrastructure in an adequate way. The authors of the 2009
Arab Human Development Report also argue that there is a connection between conflict and
access to water, but they stress instead the lack of cooperation on “water usage and man-
agements” which they argue is “heavily affected by prevailing political tension and ongoing
conflicts” (United Nations Development Programme, Regional Bureau for Arab States 2009).
They point, thus, to a possible additional mechanism to ones we have discussed.
5.3 Mechanisms
How does conflict cause a deterioration in health and mortality? What are the specific mecha-
nisms? In an influential article, Ghobarah, Huth and Russett (2003) argue that civil wars have
a long term effect on civilian suffering. Analyzing the World Health Organization’s measure
of so-called Disability Adjusted Life Years (DALYs) they argue that 8.01 million DALYs were
lost in the year 1999 from civil wars that occurred during the period 1991–97. In Ghobarah,
Huth and Russett (2004), they argue that the additional burden of death and disability caused
by the lingering effects of civil wars, is nearly double the immediate and direct effect of these
war. Civil wars, they argue, “directly effects all the major contributors to health: exposure
29

Background Paper: Consequences of Armed Conflict November 23, 2010
to disease, medical care, public health interventions, and overall socio-economic conditions”
(Ghobarah, Huth and Russett 2004, 871). Iqbal (2010) indicate in a comprehensive empirical
study that a considerable amount of differences between countries indeed can be attributed
to conflict over and beyond factors that explain both variables.
There are a number of good reasons to think that conflicts do have a causal effect. Gho-
barah, Huth and Russett (2003, 191–192) suggest a useful theoretical framework for analyzing
the effect of conflict and fragility on the development outcomes summarized in the MDGs.
Noting that “health conditions are shaped by the interplay of exposure to conditions that cre-
ate varying risks of death and disease for different groups in society and the ability of groups
in society to gain access to health care and receive the full range of benefits produced by the
health-care system”, they first list four sources of differences in health outcomes:
1. The extent to which populations are exposed to conditions that increase the risk of
death, disease, and disability
2. The financial and human resources available for addressing the public health needs of
populations
3. The level of resources actually allocated to public health needs by the private and public
sectors
4. The degree to which resources actually allocated to public health are efficiently utilized
Civil wars directly expose populations to conditions that increase mortality and disability,
point 1 above. The most obvious source is of course battle deaths. Mortality increases and
life expectancy decreases through deaths incurred as a direct consequence of fighting. The
effect of this mechanism on aggregate life expectancy and mortality levels depend on the
technology of war utilized by the warring parties. Conflict characterized by low-scale guerilla
warfare will produce much fewer battle deaths than conflict in which artillery shelling and
aerial bombardment is used. By and large, however, the indirect effects of conflict are likely
to be much greater than the direct effects. This is not only true for intra-state wars. “For
instance the influenza-epidemic that spread in 1918 and 1919 killed more people than the
deaths resulted directly from military activity in World War I (...) some of the causes of the
magnitude that epidemic reached included the mass movement of armed forces, the conditions
30

Background Paper: Consequences of Armed Conflict November 23, 2010
in which soldiers lived in the trenches, and the effects of mustard gas and fumes generated by
some weapons” (Iqbal 2010, 40). Civil wars also often displace large populations, and their
temporary accommodation often expose them to new risk factors. As noted by Ghobarah,
Huth and Russett (2003, 192), “epidemic diseases – tuberculosis, measles, pneumonia, cholera,
typhoid, paratyphoid, and dysentery – are likely to emerge from crowding, bad water, and poor
sanitation in camps, while malnutrition and stress compromise people’s immune systems”.
Even without displacement, conflict may destroy pre-existing local health facilities as well
as blocking access to proximate facilities because of the risks involved in traveling through con-
flict zones. This is particularly true for infant and under-five mortality as well as birth-related
maternal mortality. Epidemiological research shows that disease, and especially diarrhea, has
a greater effect on mortality rates than direct battle deaths. Degomme and Guha-Sapir (2010,
297) study Darfur and argue that “more than 80% of excess deaths were not a result of [the]
violence. (...) but the main cause of mortality during the stabilization period were diseases
such as diarrhoea”. Such excess deaths are the result of an increased spread of disease, which
in turn drive up infant mortality rates. The increased spread may be caused by the inability
of states to provide health services for their population during war time, or to conditions in
e.g. refugee camps that increases the transmission of disease. Ghobarah, Huth and Russett
(2003, 192) further note that violence often escalates in the aftermath of war, adding to the
mortality and disability rates.
Civil wars also affect the second and third points above. Military expenditures invariable
increase during war and local economies may be disrupted. The effect is to reduce health
spending. In cases where distinct population groups are perceived as the opposition, the
government will often be tempted to cut off public spending in their territory at the same
time as the military contest is likely to be most intense in the opposition’s home region.
Finally, conflict reduces the efficiency of the public health resources that are allocated.
Again in the words of Ghobarah, Huth and Russett (2003, 193), “ wartime destruction and
disruption of the transportation infrastructure (roads, bridges, railroad systems; communica-
tions and electricity) weakens the ability to distribute clean water, food, medicine, and relief
supplies, both to refugees and to others who stay in place.” Medical personnel tend to leave
conflict zones if they can, leaving the poorest and most immobile behind. Ghobarah et al.
note, military forces often deliberately target health facilities and transportation infrastruc-
31

Background Paper: Consequences of Armed Conflict November 23, 2010
ture to weaken the opposition.
6 Political consequences
Armed conflict is defined as the organized use of violence over political issues, and we should
therefore expect the political consequences of conflict to be significant. In this section we will
not focus on the policies of conflict as such, but on the consequences of conflict. We show that
conflict has consequences for the broader institutional framework that constitute the political
system and for the real policies that politicians produce within this framework. We show that
this in turn has important consequences for development and long-term peace, which we label
a political conflict trap.
The most immediate political consequence of armed conflict is that large parts of society
become securitized. Policies usually deemed unacceptable by the public can be implemented
with reference to the security of the state. Freedom of speech can be effectively limited through
associating certain political stances with “the terrorists”.
Securitization can lead to political and social exclusion, which in turn is highly destabi-
lizing. Several regimes in the MENA regions have attempted to combine authoritarian rule
while maintaining an open and inclusive political strategy. When this inclusive strategy fails,
the only way to voice opposition is through riots and violence. Suppressing popular revolts is
very costly, and further securitized the political climate. In the end, these half-way attempts
at opening up have often led to further suppression or return to armed conflict.
6.1 Human Rights Abuses
Arendt (1970) argue that a strong autocrat does not have to violently suppress its citizens.
Both government and opposition know what the outcome of a challenge will be. The Moscow
show trials are a prime example of how an autocracy can keep its population under tight
control with a modest and inexpensive use of force. Dissent will be more likely to occur in
weaker regimes, where opposition groups doubt the regime’s ability to maintain control. It is
in this setting we expect the most thorough and visible human rights abuses.
Most research on the prevalence of human rights abuses (see Davenport (2007a) for a
good review) find that the presence of a threat to the regime increases the risk that the
32
Background Paper: Consequences of Armed Conflict November 23, 2010
regime will engage in repressive policies (designed to address perceived threats to the regime).
Armed conflict, by definition, threatens the regime. In a securitized environment we tend
to see flagrant violations of human rights - torture, disappearances, political incarcerations,
discrimination, and brutal subjugation.
While underdevelopment in itself can be seen as a human rights violation, we focus here
on the more traditional definition of human rights as civil and political rights. Some countries
have developed economically under repressive regimes. However, the literature on this subject
point out that human rights abuses are associated with poor development (Barro 1997; Isham,
Kaufmann and Pritchett 1997). The World Bank has subsequently in concert with major
donor countries highlighted human rights abuses as a developmental issue (Palacio 2006).
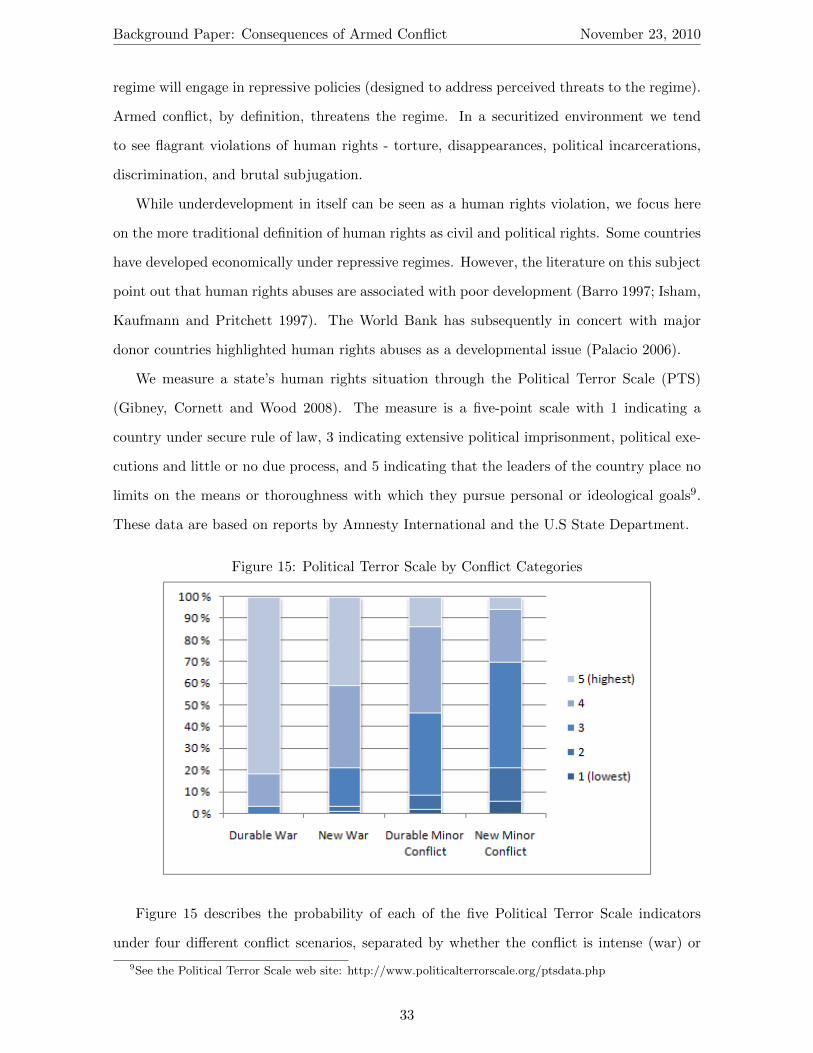
We measure a state’s human rights situation through the Political Terror Scale (PTS)
(Gibney, Cornett and Wood 2008). The measure is a five-point scale with 1 indicating a
country under secure rule of law, 3 indicating extensive political imprisonment, political exe-
cutions and little or no due process, and 5 indicating that the leaders of the country place no
limits on the means or thoroughness with which they pursue personal or ideological goals9.
These data are based on reports by Amnesty International and the U.S State Department.
Figure 15: Political Terror Scale by Conflict Categories
Figure 15 describes the probability of each of the five Political Terror Scale indicators
under four different conflict scenarios, separated by whether the conflict is intense (war) or
9See the Political Terror Scale web site: http://www.politicalterrorscale.org/ptsdata.php
33
Background Paper: Consequences of Armed Conflict November 23, 2010
less violent (Minor conflict) and whether the conflict erupted recently (New) or not (Durable).
The unit in Figure 15 is country-year observations, and the size of the bars are based on
predictions from a regression based simulation using Clarify (King, Tomz and Wittenberg
2000). The regression results used in this simulation is described in Table A-16.10
The results enforce the point made above. A MENA country with a durable war is more
than 80% likely to be in the least favorable category, with large-scale human right violations,
and more than 95% likely to be in the worst two. Human rights violations becomes more
severe as a war continues, but even in the first year, a country with an internal war is 80%
likely to be in either the worst or the second worst category.
There is a significant difference between full war, as seen in Algeria, Iraq or Lebanon, and
less violent conflicts, as seen in Iran. A country in a durable minor conflict has a very high
probability of being in category 4, but a small probability of being in the worst category. This
is even more apparent early in a minor conflict, where we see more than 70% probability of
scoring a 3 or lower score on the Political Terror Scale.
Globally conflict countries have a political terror scale one point above that of no conflict
countries. That might not sound like much. The difference, however, between a score of 2 and
3 on the political terror scale, is the difference between “a limited amount of imprisonment
(...) However, few persons are affected, torture and beatings are exceptional” and “extensive
political imprisonment”.
Severe violence begets securitization which in turn begets serious human rights abuses.
Minor conflict, in contrast, results in far less securitized environment, and results in limited
human rights abuses. The threat of terrorism exacerbates this causal relationship. Minor
conflicts, involving terrorist attacks on civilians, can produce severe securitized environments,
particularly in the MENA region. The mere threat of terror often results in human rights
abuses.
6.1.1 Human Rights Violations in Post-Conflict Countries
When we move from the conflict to the post-conflict context, we observe a significant im-
provement in human rights practices. We see no long-term effect from minor conflicts, but
civil wars seem to have an effect beyond their termination. The securitization of the political
10We use five annual lags of the political terror variable, which should be sufficient to guard against theplausible hypothesis of reversed causality.
34

Background Paper: Consequences of Armed Conflict November 23, 2010
environment persists. This effect is partly contingent on political institutions, as post-conflict
autocracies are somewhat more oppressive than the regions semi-democracies. Figure 16 de-
scribes the post-conflict probabilities for each PTS category. Again, the darker colors are the
better categories.
Figure 16: Political Terror Scale by Post-Conflict Categories
The gradual improvement of human rights in post-conflict situations can be due to the
effect Arendt pointed out. After years of large-scale repression, dissidents lose their strength
and are subdued, which in turn reduces the need for suppression. 11
11However, we cannot dismiss a competing methodological explanation that countries with good governanceare less likely to fall back into conflict and thereby producing a biased sample for the more durable post-conflictsocieties. We thank Alex Kremer for his helpful comments on this topic
35
Background Paper: Consequences of Armed Conflict November 23, 2010
A disturbing finding is that most post-conflict MENA countries, regardless of regime
type, have a troublesome human rights record. The most prevalent situation is category 3 or
extensive political imprisonments, murders and habeas corpus violations, which is what both
Amnesty International and the US State Department describe as the situation in Lebanon in
2008.
Our analysis shows that after 6 years the post-conflict situation approaches the pre-war
situation, in which the two most disturbing levels of the PTS are seldom seen. Large-scale
human rights violations in the MENA region are in other words a conflict and immediate
post-conflict phenomenon.
Comparing the two different political systems, we see that post-conflict autocracies are
more likely to implement the worst human right violations. Although the difference in per-
centage points remains rather small, a clear majority of the worst post-conflict human rights
regimes are autocracies. Why is this so? We will use the following sections to outline an
explanation.
6.2 Changes to Formal Political Institutions
We will briefly define a number of central terms, then give an overview of the trends in the
region, discuss the underlying mechanisms that we see connecting conflict to the current state
of affairs and assess what we believe are the core challenges ahead.
6.2.1 What Institutions?
Nobel laureate Douglass North (1990) defines institutions as the rule of the game in society,
or the set of formal and informal rules that together constrains individuals and their actions.
These can be unwritten social norms or more formal laws. At the far end of this spectrum we
find the formal political institutions from which political power arises. There are three core
issues that together decide the formation and distribution of formal political power:
1. How did the president, prime minister, monarch, etc. become the chief political executive
officer of his or her country? Is this office reserved for a single person, filled through
competition within a small elite, or is it open to anyone?
2. To what extent did the process involve the general public in a meaningful way? Many
36

Background Paper: Consequences of Armed Conflict November 23, 2010
dictators hold elections, and they often get an impressive part of the vote, but the
election is a scam. Participation becomes meaningful when politicians are sensitive to
how the public choose to participate (Strøm 1992).
3. How far can the executive branch execute its authority before it is checked by some
other, formal institution? The separation of powers into three branches of government
is a prerequisite for a system of checks and balances. Independent judicial systems,
constitutional review by an elected assembly and federalism are the most common ways
of limiting the power of an executive. The effect of these checks and balances are a more
transparent political system and safeguards against abuse of power.
Eckstein (1973) label these three dimensions of formal institutions for recruitment, partici-
pation, and executive constraint. A regime which has an open form of recruitment, large-scale
effective participation and significant limits on the executive power is labeled a democracy,
whereas an autocracy has closed recruitment channels, no popular participation and no limits
to the executive power.
Huntington (1991), among others, argue that there is a qualitative difference between
democracies and non-democracies, and that this qualitative difference is more important than
any other aspect: Is the government elected or not? Przeworski et al. (2000) take the issue
one step further and defines democracies as countries where governments lose elections. While
such dichotomous definitions have their strengths, such as clarity and parsimony, they do not
pay sufficient attention to the heterogeneity of the non-democracies. The non-democratic
regimes comes in many different forms and shapes, and it is important to separate between
them, particularly for the MENA region.
6.2.2 A Multidimensional Representation of Political Systems
We label the regimes that are neither autocracies nor democracies as Semi-democracies. While
they are often analyzed as a consistent category, they are anything but that. Apartheid South
Africa is institutionally very different from Kenya. Morocco is different from Algeria. Yemen
is different from Iran. Figure 17 illustrates how Gates et al. (2006) conceptualize the variation
among different regimes. In the upper right corner all three dimensions are aligned towards
distributing political power between the branches of government, and the voters. In the lower
37

Background Paper: Consequences of Armed Conflict November 23, 2010
left corner, political power is concentrated among a small group of people.
Saudi Arabia is an good example of a regime in the lower left corner. Political power sits
in the hands of a very small group of people, which is self-recruiting. Israel is in the other end
of the cube, with a very competitive political system where power is distributed among several
institutions and where all citizens have a say in popular election. However, if one would count
the about 4.1 million palestinians as a disenfranchised part of the electorate, Israel would slide
downwards along the upper right edge of the cube.
Figure 17: Multidimensional Institutional Representation of Political Systems (MIRPS)
The question of stability is clearly dependent on regime type. Both democracies and
autocracies are institutionally consistent. That is, the different institutions work towards the
same end, whether it is the separation of power or the opposite. Gurr (1974) and Gates
et al. (2006) show how instability arises from a situation in which different institutions pull
in different directions. The most unstable situation is a system with highly contested election
but no independent review of the executive branch between elections. These systems are
typically found in Sub-Saharan Africa.
As an example, Iran’s elections gave people a chance to voice an alternative to the current
political platform. With no constitutional mechanism to address the religious foundation of
38

Background Paper: Consequences of Armed Conflict November 23, 2010
the Islamic Republic, popular discontent is by default illegal and the system’s ugliest side
showed itself. The pre-election screening of candidates by the Council of Guardians means
that Executive Recruitment in Iran is a mix between competition and designation. The
electorate can choose between different candidates, but not freely so. The presence of an
elected parliament provides some minimum levels of constraints, but the real constraint lies
with the President and the religious Council of Experts. In sum this puts Iran anno 2000
somewhere close to the middle of the left side of the cube. Over the last decade, several
changes have been made to concentrate power in the Wali Faqih and the Presidency, and in
light of the very disputed elections in 2009, Iran has moved downwards into the Autocratic
corner.
Algeria represents a very different form of semidemocracy. The 2004 re-election of Boute-
flika was recognized as free and fair by the international society. Yet, it is an open question
how free and fair the election would have been if the winner was deemed unacceptable by the
military. The 2007 legislative elections were a setback in comparison, as low confidence in
the electorate led to a dismal turnout of 35%, and the 2009 presidential elections re-elected
Bouteflika for a third time with more than 90% of the votes. However, the Algerian system
do have some institutional limitations on the executive power. The lack of political competi-
tion and low participation is a significant problem but the relatively well-respected division
of power is a positive aspect of the Algerian political system. As a result, Algeria’s regime is
placed on the lower right part of the cube.
A third form of semi-democracy is the type we find in Jordan, where the executive power
is under strict control by the King, but where opposition groups can present some form of
dissent through a parliament. There is some form of participation in this regime, and there is
some form of constraints on the executive, albeit not very large. This form of semi-democracy
seems to be quite prevalent in the Middle East and North Africa. To the extent that the
public is invited to be a part of the system, their inputs are not always welcomed. Most,
if not all, MENA countries have banned political parties and movements from time to time.
Yet, many of these regimes are surprisingly durable.
39

Background Paper: Consequences of Armed Conflict November 23, 2010
6.3 Trends For the MENA Region
When we look at the regional trend for the time period 1960-2004 versus the trend for the
rest of the world, the Middle East and North Africa region stands out as very authoritarian.
No democratic wave has ever broken on the shores of this region, which has created a gap
between MENA and the rest of the world. While a majority of countries in the non-MENA
group are democracies in 2004, close to a majority of MENA-countries are dictatorships. In
fact, we only observe one democracy in this region in this period, namely Israel, which has its
own idiosyncratic institutional challenges. Lebanon has since 2004 transformed, and can be
counted among the democracies.
Figure 18: Regime Type Trends for MENA
We observe an increase in the number of semi-democracies after the end of the cold war,
which mirrors a similar trend in the global picture. The 2004 figures for the MENA region
indicate equality between the numbers of autocracies and semi-democracies. Whereas semi-
democracies have been seen as a form of transitory governance, the MENA semi-democracies
are seemingly not on a transition towards liberal democracy. For the world as whole, democ-
racies and autocracies are much more stable than other regimes (Gates et al. 2006), but figure
18 tell a different story for the MENA region.
40

Background Paper: Consequences of Armed Conflict November 23, 2010
Figure 19: Regime Type Trends for All Other Regions
6.4 Specific Regime-Type Consequence of Conflict
The causes of institutional instability appear to be unique for a given institutional arrange-
ment. For instance, strong economic development can be beneficial for a democracy, but not
necessarily so for a dictatorship. Indeed no high-income democracy has ever failed, but many
countries, such as Spain and Chile, have made the transition to democracy after long periods
of economic growth (Londregan and Poole 1996).
The close empirical co-variation of liberal democracy, peace and prosperity is taken as
evidence in support of several theories, where the causal order of these factors is altered to fit
each theory. The MENA region is interesting in this way as the region features a number of
prosperous and peaceful autocracies against a set of equally autocratic but much less affluent
conflict-torn regimes.
We first examine the expected duration of the three different regime types – autocracies,
semi-democracies and democracies – across the different regions. Table 5 presents the per-
centage difference between each region-specific regime type and the reference category, which
in this case is a semi-democracy regime in the MENA region. A semi-democracy in the East
Asia/Pacific region is thus expected to be only a 34% as durable as a similar regime in the
41
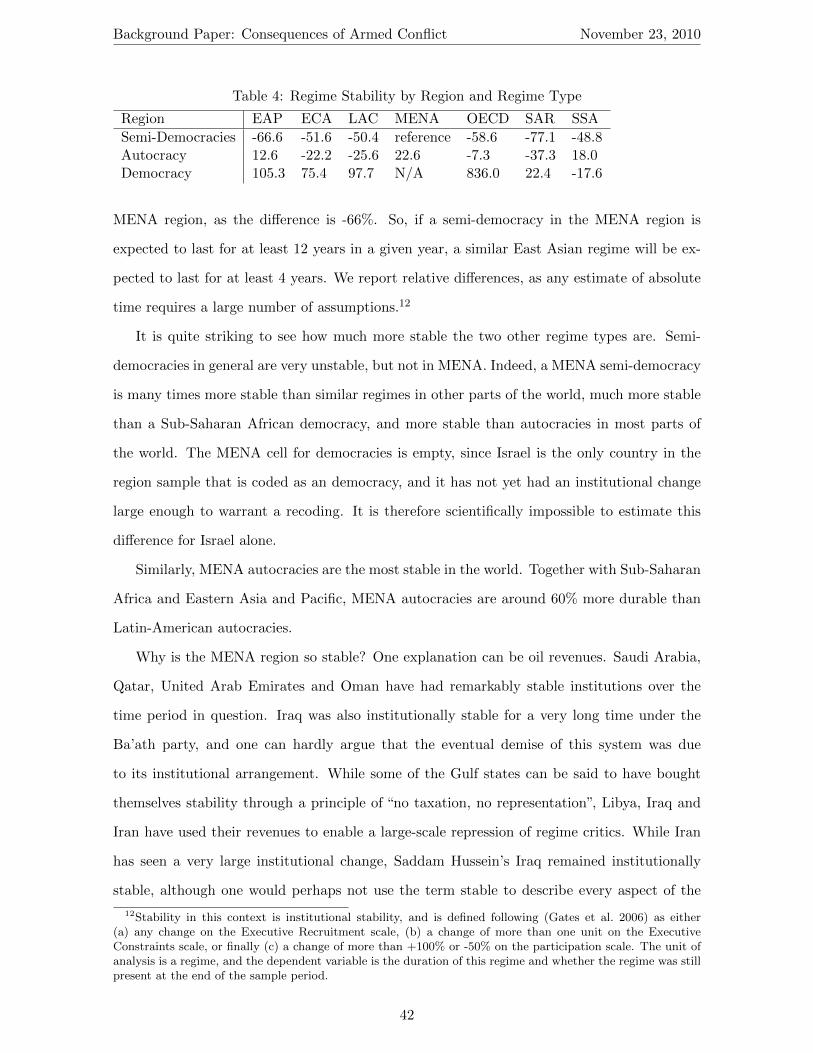
Background Paper: Consequences of Armed Conflict November 23, 2010
Table 4: Regime Stability by Region and Regime Type
Region EAP ECA LAC MENA OECD SAR SSA
Semi-Democracies -66.6 -51.6 -50.4 reference -58.6 -77.1 -48.8Autocracy 12.6 -22.2 -25.6 22.6 -7.3 -37.3 18.0Democracy 105.3 75.4 97.7 N/A 836.0 22.4 -17.6
MENA region, as the difference is -66%. So, if a semi-democracy in the MENA region is
expected to last for at least 12 years in a given year, a similar East Asian regime will be ex-
pected to last for at least 4 years. We report relative differences, as any estimate of absolute
time requires a large number of assumptions.12
It is quite striking to see how much more stable the two other regime types are. Semi-
democracies in general are very unstable, but not in MENA. Indeed, a MENA semi-democracy
is many times more stable than similar regimes in other parts of the world, much more stable
than a Sub-Saharan African democracy, and more stable than autocracies in most parts of
the world. The MENA cell for democracies is empty, since Israel is the only country in the
region sample that is coded as an democracy, and it has not yet had an institutional change
large enough to warrant a recoding. It is therefore scientifically impossible to estimate this
difference for Israel alone.
Similarly, MENA autocracies are the most stable in the world. Together with Sub-Saharan
Africa and Eastern Asia and Pacific, MENA autocracies are around 60% more durable than
Latin-American autocracies.
Why is the MENA region so stable? One explanation can be oil revenues. Saudi Arabia,
Qatar, United Arab Emirates and Oman have had remarkably stable institutions over the
time period in question. Iraq was also institutionally stable for a very long time under the
Ba’ath party, and one can hardly argue that the eventual demise of this system was due
to its institutional arrangement. While some of the Gulf states can be said to have bought
themselves stability through a principle of “no taxation, no representation”, Libya, Iraq and
Iran have used their revenues to enable a large-scale repression of regime critics. While Iran
has seen a very large institutional change, Saddam Hussein’s Iraq remained institutionally
stable, although one would perhaps not use the term stable to describe every aspect of the
12Stability in this context is institutional stability, and is defined following (Gates et al. 2006) as either(a) any change on the Executive Recruitment scale, (b) a change of more than one unit on the ExecutiveConstraints scale, or finally (c) a change of more than +100% or -50% on the participation scale. The unit ofanalysis is a regime, and the dependent variable is the duration of this regime and whether the regime was stillpresent at the end of the sample period.
42
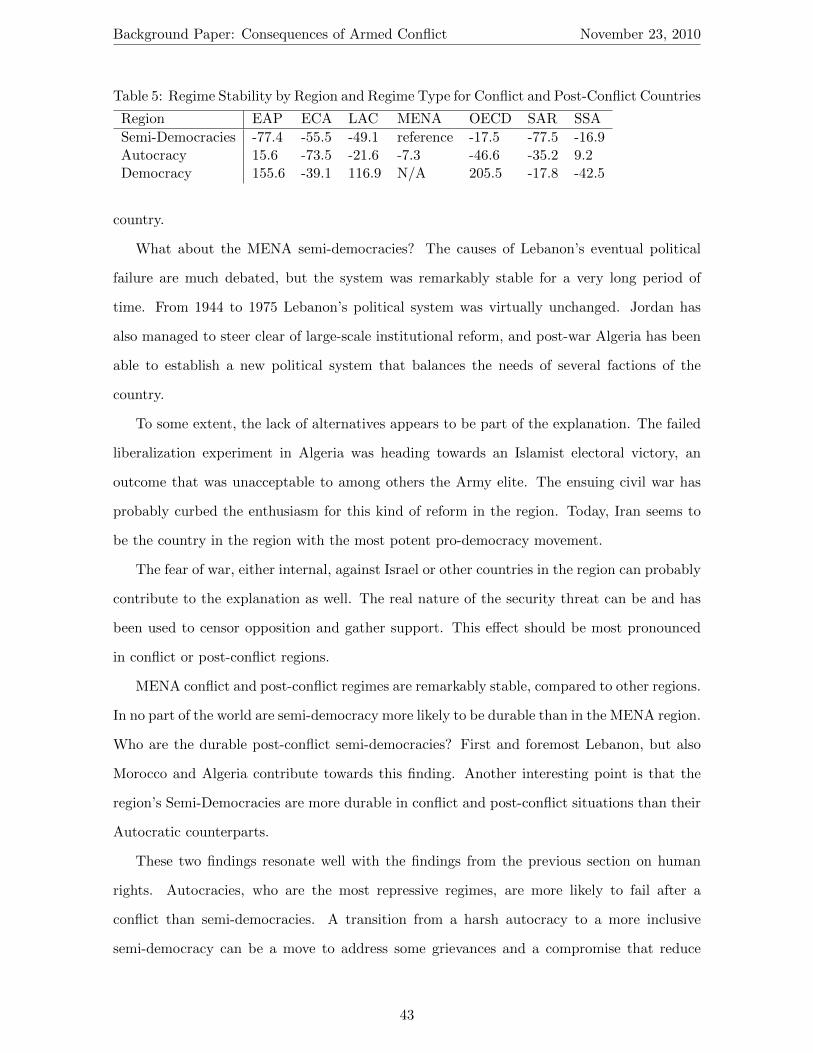
Background Paper: Consequences of Armed Conflict November 23, 2010
Table 5: Regime Stability by Region and Regime Type for Conflict and Post-Conflict Countries
Region EAP ECA LAC MENA OECD SAR SSA
Semi-Democracies -77.4 -55.5 -49.1 reference -17.5 -77.5 -16.9Autocracy 15.6 -73.5 -21.6 -7.3 -46.6 -35.2 9.2Democracy 155.6 -39.1 116.9 N/A 205.5 -17.8 -42.5
country.
What about the MENA semi-democracies? The causes of Lebanon’s eventual political
failure are much debated, but the system was remarkably stable for a very long period of
time. From 1944 to 1975 Lebanon’s political system was virtually unchanged. Jordan has
also managed to steer clear of large-scale institutional reform, and post-war Algeria has been
able to establish a new political system that balances the needs of several factions of the
country.
To some extent, the lack of alternatives appears to be part of the explanation. The failed
liberalization experiment in Algeria was heading towards an Islamist electoral victory, an
outcome that was unacceptable to among others the Army elite. The ensuing civil war has
probably curbed the enthusiasm for this kind of reform in the region. Today, Iran seems to
be the country in the region with the most potent pro-democracy movement.
The fear of war, either internal, against Israel or other countries in the region can probably
contribute to the explanation as well. The real nature of the security threat can be and has
been used to censor opposition and gather support. This effect should be most pronounced
in conflict or post-conflict regions.
MENA conflict and post-conflict regimes are remarkably stable, compared to other regions.
In no part of the world are semi-democracy more likely to be durable than in the MENA region.
Who are the durable post-conflict semi-democracies? First and foremost Lebanon, but also
Morocco and Algeria contribute towards this finding. Another interesting point is that the
region’s Semi-Democracies are more durable in conflict and post-conflict situations than their
Autocratic counterparts.
These two findings resonate well with the findings from the previous section on human
rights. Autocracies, who are the most repressive regimes, are more likely to fail after a
conflict than semi-democracies. A transition from a harsh autocracy to a more inclusive
semi-democracy can be a move to address some grievances and a compromise that reduce
43

Background Paper: Consequences of Armed Conflict November 23, 2010
the level of dissent and the need for repression. The apparent stability of the post-conflict
semi-democracies can indicate that this form of political change is working.
Algeria is a case where some level of political reform seemingly has been a successful
strategy to address grievances. As opposed to many other conflicts in the 1990s, the Algerian
war was first and foremost a political conflict, over the control of the executive powers and
the ideological basis of the state. This case does therefore not fit very well with the economic
conflict trap theory. Algeria is trying to work its way out of a political problem, where a
harsh autocracy has proven itself useless through a long war and where the uncertainty of
democracy is not acceptable to the establishment with the most to lose. Semi-democracy
becomes stable through the lack of viable alternatives.
A key distinction that seems common to MENA semi-democracies is that the executive
is often constrained by undemocratic institutions, and seldom constrained by democratic
institutions, if it is constrained at all. The next section will look into this dimension and
explain why it is critical to understand the stability of MENA semi-democracies and the
MENA execptionalism we observed in the tables above.
6.4.1 Executive Power
The most important axis that separates semi-democracies is the extent to which the executive
is constrained by any formal political institutions. The MENA regimes are generally not very
constrained. Israel is again the only country in our sample where the government is under
full review by a different branch of governance. There are few and brief examples of moderate
constraints in the sample, and the vast majority of the cases are either unconstrained or
weakly constrained.
Saudi Arabia is the quintessential case of unlimited executive authority. There is no codi-
fied constitution, and while the judiciary is functionally independent it can be overruled by the
executive branch. Tunisia is a good case to illustrate what the label ’Slight Limitations’ mean.
There is an elected assembly, but the president can rule by decree. Most legislation is initiated
by the executive branch and the assembly does not have any real influence on the outcome.
However, the assembly does include opposition groups, which is both an acknowledgement of
a political plurality and a platform for an independent voice.
Jordan is placed in the third category, ”Slight to moderate limitations”. There exists a
44

Background Paper: Consequences of Armed Conflict November 23, 2010
Figure 20: Executive Constraints
Table 6: Durability of Three Different Levels of Executive Constraints by Conflict Status.
Post-conflict Non-conflict
(1) No Constraints 240.169 Ref.(2) Slight Limitations -46.7554 85.4742(3) Slight to Moderate Limitations -47.4433 22.446
very real opposition in Jordan, but this opposition is in clear minority in the elected lower
house. In addition, the upper house is appointed directly by the king, and the legislative is
therefore not in a position to exercise effective review of the executive. Nevertheless, while
the king is a very powerful executive, the opposition is sufficiently well organized that it is
not unproblematic to suppress this group.
We disregard the smaller categories in the following analysis. All figures are relative to
the expected duration of an unconstrained regime with no conflict, such as the United Arab
Emirates. Post-conflict unconstrained regimes are estimated to last 240% longer than their
peaceful counterparts. This might seem counter-intuitive given the story above, but what it
tells us is that a regime which captures power through a coup becomes very durable indeed.
There are two cases that contribute to this figure – Syria and Iraq. We get more important
information when we compare the other figures in the table.
As long as somewhat limited executives avoid conflict, their political system remain quite
stable. In a post-conflict situation, they become a lot less stable. This might be indicative of
45
Background Paper: Consequences of Armed Conflict November 23, 2010
a pattern.
For the world as a whole it is a strong finding that autocracies are more stable than semi-
democracies. Among the MENA countries that have not experienced conflict, the systems
that acknowledges some form of opposition are more stable than those that do not, when
we keep economic strength constant 13. Note the difference among these two categories.
They are equally (un)stable in a post-conflict setting, but the systems that feature a real but
ineffective opposition are significantly less durable than the systems where the opposition is
easily suppressed if necessary.
6.4.2 Broad Dictatorship
Political institutions are the product of power relations and bargaining between powerful
groups. The unconstrained executives that survive a conflict do not represent a random
sample of dictators: they are the ones that are willing and able to repress an opposition using
if necessary violent means. However, if we imagine an absolutist dictatorship under stress,
what are the options? The dictator can take the conflict on, and if he survives, he will be under
less stress. But the results in the previous section indicate that some minor concessions to the
opposition also can alleviate stress. A regime that successfully make such small concessions
to civil society are called Broad Dictatorships.
Przeworski (1991) explains the events during the late 1980s that came to terminate com-
munism in Eastern Europe. The totalitarian system was in serious economic trouble, which
in turn was likely to materialize itself through political stress. The solution was Glasnost,
’publicity’, which was designed to make the system more transparent and thereby reduce cor-
ruption and waste. The plan was not to scrap communism, but to save it. As such, it was a
failure.
Przeworski argues that the plan failed, in the USSR and in the rest of the communist bloc,
because the newly organized civil society demanded more. If civil society had accepted the
plan, the outcome could have become something similar to Tunisia, with an opposition voice
acting as a check on bad behavior but where legislation and policy remained the domain of
the ruling party. When the opposition movements did not play along, the alternatives were
to either try to suppress them or give up.
13Richer countries are more stable than poorer countries, and many of the very rich countries in the regionare Autocracies
46
Background Paper: Consequences of Armed Conflict November 23, 2010
The failed coup was an attempt by hardliners in the communist party to suppress the
liberalization that had by then spun out of control. That failure marks the end of the USSR,
and Przeworski claimed that such broad dictatorships are unsustainable as opposition groups
always will demand more. However, the evidence from the MENA region suggests that Gor-
bachev’s strategy as such was feasible. Several regimes in the region have managed to balance
the venting of some criticism from the public while maintaining monopolistic control of real
political power. Egypt, Tunisia, and Jordan are good examples of this. These are three coun-
tries with large social and political problems, but they have so far avioded large-scale internal
war.
6.4.3 The Cost of Repression
A significant advantage that legitimate governments enjoy is that they do not have to spend
the same amount of resources on repressing their subjects as illegitimate systems (Gurr 1970).
It seems fair to assume that repression is costly, but the literature currently does not provide
any estimates of how costly repression is. The direct expenses will typically be spending on
the military and the secret police, but repression also leads to economic loss through lack of
economic freedom.
It is difficult to estimate the direct consequence of repression, as dissent, repression and
poor economic performance are intertwined (Carey 2007; Davenport 2007a; Moore 1998).
However, we can establish the correlation between repression and economic performance.
The simulation below is based on a regression analysis with a lag of repression for each of
the preceding five years. This simulated country, similar in many ways to Iran, is free from
repression until 1993, when harsh repression policies are introduced. The dots represent the
predicted levels of GDP per capita in the absence of repression.
What Figure 21 illustrates is that the switch from freedom to repression is correlated with
a strong drop in economic performance. After some years the drop is replaced with a stagnant
performance, in which growth is very low. The 1990s was a decade of fairly strong growth in
the MENA region, which is reflected in the dotted comparison group.
As we illustrated earlier in this section, very harsh repression is usually found in conjunc-
tion with armed conflict, and the figures reported here take this into account. We control
for the incidence of conflict, and the graph above is simulated in a peaceful environment.
47

Background Paper: Consequences of Armed Conflict November 23, 2010
Figure 21: Cost of Repression
However, when we see this evidence in conjunction with the stability of post-conflict regimes,
a pattern emerges.
Broad dictatorships are only feasible when their existence is based on some form of legiti-
macy or acceptance by civil society. A broad dictatorship faced with popular dissent, such as
in Eastern Europe, will have to either revert to a narrow dictatorship or yield to the dissenters.
Iran is very much in this situation right now. Iran’s theocratic institutions are com-
plemented with proto-democratic institutions that have the potential of giving voice to a
opposition within the system and some room for maneuvering for anti-system opposition.
Last year’s fraudulent elections left the regime in a very difficult situation, where it had to
suppress both the opposition within the system and the democracy movement outside of the
system. After the Khatami presidency, the Iranian institutional setup has been on a slope
towards full dictatorship. More and more power is centralized in the executive branch. The
parliament consist almost exclusively of pro-government candidates and the judicial system
has become subjugated. The latter is very evident in wake of the post-demonstration death
penalties.
This repression is very costly. First, resources have to be allocated to the police and
religious milita. Second, riots leads to destruction and disruption of trade and production.
48

Background Paper: Consequences of Armed Conflict November 23, 2010
Iran is already in a difficult economic situation after years of mismanagement, and their ability
to maintain a high level of repression is unknown, possibly also to themselves. The decision
to execute a man for throwing stones at the police is an act of desperation, trying to scare
off future demonstrations. The current situation is not feasible in the long term. For the
regime to survive it must regain some form of legitimacy. If the current regime fails, the likely
alternatives are (a) that the armed wing of the theocracy takes control, which can be labeled
’Narrow Dictatorship’ or (b) that the whole system is replaced by a new form of governance,
which hopefully will be a democratic transition.
6.5 Power-sharing Arrangements
Power-sharing arrangements consisting of institutions comprising broad political coalitions,
feature mutual veto provisions, and decentralization procedures such as federalism, are widely
recommended solutions in post-crisis situations. Yet, there are historical lessons that suggest
that such governance arrangements may have directly counter-productive consequences. The
Lebanese Civil War, 1975–1990 serves as the quintessential example.
History and geography have left their mark on Lebanon as a hodgepodge of seventeen
religious communities or confessions. The six major communities are the Maronite, Greek
Orthodox and Roman Catholic Christians and the Druze, Shi‘a, and Sunni Muslims. In an
attempt to deal with this diversity, it has repeatedly turned to power-sharing arrangements,
but with mixed success. Under the Ottomans, Lebanon was at peace for over a century. From
1943 to 1975 Lebanon was relatively stable (aside from a brief civil conflict in 1958, which
killed nearly 2000 people), but with collapse of the political system fifteen years of anarchy
ensued. The Lebanese Civil War, 1975-1990, a war of many fronts and factions, resulted in
the destruction of Beirut and at least 144,000 battle deaths14 (Lacina and Gleditsch 2005).
The 1943 power-sharing arrangement provided the framework to reconcile the interests of
the Maronites and Sunnis to achieve the goal of independence from the French. The unwritten
pact supplemented the formal Constitution with three principles:
• “Segmental proportionality (representation of the communities in government in pro-
portion to their demographic weight);
14In addition, 6,630 were killed in other conflicts involving Palestinians in Lebanon; plus another 2400 werekilled in fighting between the Israeli Army and Palestinian refugees. The United States and France also lost266 and 82 soldiers respectively (Lacina and Gleditsch 2005).
49
Background Paper: Consequences of Armed Conflict November 23, 2010
• Segmental autonomy (a guarantee of the communities’ rights to conduct religious, edu-
cational, and cultural affairs with no state intervention); and
• Foreign policy ‘neutrality’ (an agreement by the Sunnis not to seek union with Syria in
return for a pledge by the Maronites not to steer the country towards the West)” (Zahar
2005, 9).
Maintaining segmental proportional political representation across the seventeen communities
proved to be an exceptionally tricky balancing act. Ever changing demographics between
groups created pressure to alter the distribution of positions of authority and seats in the
parliament. Increasing socio-economic differentiation between groups further confounded the
problem. But the ratio of six to five was set in law on the basis of the 1932 census. No provision
was made for updating the census, whereby the apportionment rule would be revised. This
inflexibility and lack of a new census played a big role in the demise of the power-sharing
arrangement.
Nevertheless, it was foreign policy that was the precipitating cause of the un-doing of the
pact. Maintaining strict neutrality in Middle East was and still is nearly impossible.15. More
particularly, the politics of Pan-Arab nationalism and spill-over from the conflict in Israel
(above all, the arming of Palestinian refugee camps in southern Lebanon) proved to be too
much for the power-sharing arrangement. In direct violation of the principle of foreign policy
neutrality, communities sought the assistance of external allies to redress growing internal
inequalities or to counter perceived threats from another group (Zahar 2005; Rigby 2000;
Khalaf 1987). This upset the precarious balance of the power-sharing arrangement and led to
the bloody Lebanese Civil War.
Ultimately though, the seeds of destruction were sown with the inherent design of the
power-sharing arrangement. Despite the stated intentions of the pact, the Lebanese power-
sharing arrangement failed to fulfill its unifying role.16 The basis of power-sharing was to
allocate the number and religious composition of Parliamentary seats for each electoral dis-
trict according to the respective demographic weight of each confessional community as de-
15Paul Salem portrays the pact as “a double negation, No to close alliance and protection from France, andNo to merger with a larger Arab entity”, whereby the two key political actors relinquished their dominantforeign policy inclination to assure the deal, and thereby assuring each a veto over the other (Salem 1994, 70).
16Of course we will never know the extent to which these goals of national unity were sincere. What is clearis that the 1943 Pact achieved a nationalist goal of an independent Lebanon and that the Maronites and Sunniswould maintain dominance with mutual veto power.
50

Background Paper: Consequences of Armed Conflict November 23, 2010
termined by the 1932 census. Given that representation was allocated on the basis of religious
community, there was an acute danger that no politician would have an incentive to establish
cross-confessional ideological parties.
The framers of the 1943 Pact foresaw this problem and designed Parliament to serve as
an instrument of national integration. Members were elected on the basis of multi-member
districts or the “common roll”, such that electoral districts rather than specific communities
served as the basic constituency (Crow 1962, 494). A single district would then be allocated
several seats corresponding to the respective demographic weights of the religious communities
within the constituency. The electorate formed a common roll, with each voter voting for all
seats in the district including those religions other than his own.
Instead of breaking down communities and creating a common Lebanese constituency,
the power-sharing arrangement and the principle of proportionality in particular, reinforced
the political role of each religious community. Furthermore, political candidates only had an
incentive to appeal to their own community and to ignore the other communities.
Parliament made the problem worse by gerrymandering the districts. By 1960 eleven of the
26 districts represented only one religious community (Rigby 2000, 8). Even where districts
continued to be multi-confessional, given the structure of the system, a member of a specific
religious community, did not have to worry about building support across communities (Salibi
1988, 189). “The legislature turned into a private club as leaders promoted their proteges”
(Zahar 2005, 10). Together the undoing of the system was due to the elite capturing the
political system and the unwillingness of these political elite to engage in any reform that
would distribute political power and authority to the Shi‘a.
6.6 Gender Parity
In October of 2000 the United Nations Security Council passed the landmark resolution 1325
on“Women, Peace and Security”. This was, more or less, a high point in an interest in war and
gender that has grown for the past two decades. There is a burgeoning literature on gender
and conflict, see e.g. the seminal Goldstein (2001), but mainly with conflict as a dependent
variable. Caprioli (2000) and Caprioli and Boyer (2001) study various forms of interstate crisis
and find that having more gender equality at the domestic level leads to states behaving more
peacefully in international relations. Similarly Melander (2005a,b) finds gender equality to
51

Background Paper: Consequences of Armed Conflict November 23, 2010
be negatively correlated with human rights abuses as well as intrastate conflict. Our interest
here is rather on the effect of conflict on gender parity, measured by way of female primary
education and female to male life expectancy. Figure 22 shows the percent of girls getting
primary education across our conflict categories. As the figure shows, there seems to be a
marked and substantial difference between the educational possibilities for girls in conflict
and non-conflict countries. In non-conflict countries, in the year 2000, around 98 % of girls
on average received primary education, in conflict countries in contrast the figure stood at a
mere 91 %, with post-conflict countries in between. On the face of it conflict seems to have
a substantial effect for female primary education, but when we control for other factor the
effect disappears. In our standard set of regression models we find no significant relationship
between conflict and female education.
Figure 22: Distribution of Female Primary Education, Year 2000
This non-finding can have three different explanation. Firstly it might be that there
simply is no actual effect of conflict on female education. Secondly, it might be that there
is to much “noise” in our data, missing data, low quality data, or outliers, that disguises
what is in reality a significant effect of conflict on female education. Thirdly, it might be
that there are different mechanisms through which conflict affects female education, and that
these mechanisms in sum cancel each other out. It might be for example that conflict in some
countries decreases female primary education by creating a post-conflict environment not safe
enough for girls to attend school. Or it might be that conflict increases female education by
attracting humanitarian aid and NGOs that target girls especially and set up schools. Both
of these mechanisms, and potentially of course others, might be active and in the end the
former and the later may end up canceling each other out.
52

Background Paper: Consequences of Armed Conflict November 23, 2010
Figure 23: Distribution of Female to Male Life Expectancy, Year 2000
Figure 23 shows the ratio of female to male life expectancy. If this ratio equals one, men
and women live equally long on average, and if this ratio is above one, women live longer than
men. Women globally live longer than men. This is true as well for the MENA region. The
figure, however, shows that the ratio is slightly lower for conflict than non-conflict countries.
This may indicate that conflict impacts female life expectancy more than male. A decrease of
one year in female life expectancy and no change in male would lower the ratio. This is the
conclusion reached by Neumayer and Plumper (2006) in their global analyzes. We however
are unable to find such a relationship for the MENA conflicts. Again this non-finding may
have a number of different explanation, but at the very least it means we cannot say anything
certain about the effect of conflict on female as opposed to male life expectancy.
6.7 Social Fragility
Conflict is prone to disrupt the “fabric of society”, as members of society becomes more vary
of each other and the state. In some cases, conflict will lead to ethnic or religious polarization,
as people that share a common identity gather behind this identity and becomes hostile to
members of other identities (Luckham 2004; Good 1990). One consequence of this effect is
that higly polarized wars last longer than other conflicts (Montalvo and Reynal-Querol 2010).
Another consequence is that politicians in some cases will use conflict on purpose to intensify
such divides (Wilkinson 2004).
It is difficult to gauge individual levels of trust in post-conflict societies, (see Buhaug et al.
(2008) for a case-study of Bosnia) and it even more difficult to measure trends over time to
extract the effect of conflict. In many cases low levels of trust is a consequence of the causes
53

Background Paper: Consequences of Armed Conflict November 23, 2010
of conflict, and sometimes itself a cause of conflict.
One consequence of identity polarization is that horizontal inequalities, or differences be-
tween groups, can become more salient. This phenomenon has been thoroughly research in
some parts of the world (Østby 2008; Stewart 2002; Murshed and Gates 2005), but there are
as far as we know no comparative studies of the consequence of conflict on horizontal inequal-
ities in the MENA region. Horizontal inequalities are particularly important, since they can
become important regardless of the economic impact of the conflict. These differences can
exist for long periods of time, but even a short and relatively small armed conflict can make
these differences politically relevant, which will further securitize the post-conflict political
environment.
Youth bulges can become politically relevant in post-conflict societies through the same
causal logic. A conflict does not create a youth bulge in it self, but a large number of youth
relative to adults can become disruptive in a securitized setting (Urdal 2005). The palestinian
Intifada serves as a good example, where young people started a wave of riots that was not
controlled by the PLO or any other “adult” leadership. Young men in particular are more
likely to demonstrate against repressive governments.
A riot in this analyzes is defined as any “violent demonstration or clash of more than
100 citizens involving the use of physical force”. The data are from the The Cross-National
Time-Series Data Archive (CNTS) (Banks 1979). There does not seem to be an overall trend
in number of riots in the region. The sum fluctuates, but in general, save two years, every
year sees at least one riot. There is significant variation within region. The Gulf countries
have comparably few riots, and for the entire sub region only seven are reported in the data
set. A handful of countries represent large percentages of the total, with Israel accounting for
approximately 20 % of all MENA riots, closely followed by Iran, Egypt and Lebanon. The
underlying factor driving these within regional differences seems to be the strength of a given
country’s civil society. Compared to the Gulf region the countries with the most riots are
also the countries with the most vibrant civil society. Vibrant is nevertheless of course a very
relative term. Clearly organizing civil society associations in countries like Egypt and Iran
can be difficult and even dangerous17, but civil society associations nevertheless exist. See for
example Wickham (2002) for the Egyptian case and Khosrokhavar (2002) for the Iranian case.
17For a discussion on the restrictions faced by civil society in the MENA region see the Arab HumanDevelopment Report (United Nations Development Programme, Regional Bureau for Arab States 2009)
54
Background Paper: Consequences of Armed Conflict November 23, 2010
For the Israeli case many of these riots have their root cause in the Israel-Palestine conflict.
The question here though is whether or not conflict increases the risk of riots. To analyze
this we regress riots on last year’s conflict level together with the set of control variables
utilized throughout this paper. We also examined the effect of conflict on the risk of riots
in a given year, but find no significant results. After controlling for time trends, population,
gross domestic product and the production of primary commodities, we find that on average a
conflict increases the odds of a riot occurring the next year by more than 250 %. In any given
year the chance of a given country experiencing a riot is about one in seven. For a MENA
country of average GDP and GDP per capita this implies that a conflict increases the risk of of
a riot from virtually zero to around .2 for very low scale conflict to around .4 for medium and
high intensity conflicts. The effect is both statistically significant and substantively important.
Interestingly we do not find any significant spill-over effects. There are no significant effects
for conflict in neighboring countries on the propensity of riots, and riots do not spill over from
country to country. Riots in the MENA region then seem to be a product of domestic factors,
and not international or regional trends as e.g. democratic waves sweeping through the region
and propelling domestic upheaval. To a certain extent supporting that argument we do find a
significant negative effect of an increase in primary commodities exports on the risk of riots.
This finding might indicate that resource rich countries in the region, like the Gulf countries,
are able to avoid riots by providing generous social and welfare benefits and by not having to
extract taxes from the population. Other countries in the region are unable to do this.
Ayubi (1995) makes the case that Arab states are frequently fierce, but seldom very strong.
A fierce state, argues Ayubi (1995, 449), is “so opposed to to society that it can only deal
with it via coercion and raw force”. This may explain the one mechanism connecting conflict
and riots. In the wake of war, two trends may come together that increases the risk of
riots. On the one hand, the cost of having waged a war means that the state might have to
extract marginally more resources from the population. In a state with few opportunities for
communicating grievances within the system, riots may be one of the few available outlets for
voicing these. On the other hand, having waged a war might also have decreased the state’s
coercive ability. These two factors then produce both a motive and an opportunity to take
grievances to the state through riots.
55
Background Paper: Consequences of Armed Conflict November 23, 2010
Part III
The Political Conflict Trap
7 A Political Conflict Trap in the MENA Region
One of the main findings reported in the book, Breaking the Conflict Trap by Collier et al.
(2003) is that once a country has experienced armed conflict it is likely to experience conflict
again. War is shown to exhibit extremely high social and economic costs. Conflict significantly
reduces the economic opportunities available to young males. Civil conflict worsens the very
conditions associated with the onset of conflict in the first place. War sews the seeds for future
wars. Conflict creates economic problems that in turn foster new conflict Collier et al. (2003).
For most civil wars today, particularly those taking place in Sub-Saharan Africa and South
Asia, conflict is associated with worsening economic, political and social conditions (Gates
et al. 2010). War begets war by increasing the risk of war. This pattern is not as clear in the
MENA region. While we do see a fall in GDP per capita during conflict, and slow recovery
rates for some countries, we find little evidence of the other economic drivers of conflict being
a consequence of war. Indeed, among the MENA countries, the consequence of war is less
economic and more political.
For countries in the MENA region, conflict results in widespread political consequences.
Human rights are systematically degraded. Political institutions are structured so as to limit
the expression of popular will. In contrast to all other regions of the world, the MENA
region has never felt the exhilarating splash of the third wave of democratization. Israel and
Lebanon are the only democracies in the region today and both exhibit some fundamental
flaws. The fundamental problem for Israel are the Palestinian Authorities of the West Bank
and Gaza. All the other countries in the region are broad dictatorships (characterized by an
unconstrained executive and limited political freedom) or strong dictatorships (in which all
political authority is vested in the chief executive).
Conflict in the MENA region has resulted in a securitization of the state. As observed by
56
Background Paper: Consequences of Armed Conflict November 23, 2010
Ayubi (1995), most of the states in the region are “hard” states, and indeed many of them are
“fierce”states, few of them are really“strong”states. In a fierce state or a despotic state, power
is often wielded arbitrarily and sometimes with cruelty (449-450). “Although they have large
bureaucracies, mighty armies and harsh prisons, they are lamentably feeble when it comes
to collecting taxes, winning [interstate] wars or forging a really ‘hegemonic’ power block or
an ideology that can carry the state beyond the coercive and ‘corporate’ level and into the
normal and intellectual sphere” (xi). War, both interstate and intrastate, have been part of
the process that has shaped this pattern.
Having faced a genuine threat to their authority, MENA leaders have turned to repres-
sion, coercion, and limited the avenues for political expression available to any opposition.
Moreover, aside from Yemen (on two different occasions), the opposition has never achieved
military victory over the state.18 Such success in combating violent conflict has led to the
development of a militarized police state and has reinforced elite political cultures that favors
the use of coercion. This process is described by (Gurr 1988) as the establishment of the
garrison state.
Such a process in turn leads to further political exclusion, which serves to only exacerbate
pre-existing patterns of social and economic exclusion. Lacking any viable channel for political
expression, civil society reacts by taking to the street. Riots become a regularized aspect of
politics. These riots lead to further repression. Street protests are “usually more protest-
centered than demand-centered, and are often easy to quell after a few days. They may
reflect a yearning for participation, but they are often used by authoritarian regimes as an
excuse to clamp down on liberties and to slow down any existing democratization processes”
(Ayubi 1995).
The mix of social, economic and political exclusion also leads to the formation of violent
organizations bent on overturning the state or seceding from it. Aside from Yemen and
Djibouti, most of the states in the region are sufficiently developed that any group engaged in
intrastate conflict will have to engage in asymmetric combat against the government (Butler
and Gates 2009; Kalyvas and Balcelles 2010a). Terrorism and guerilla tactics do in fact
characterize the nature of conflict in the region. Such tactics rarely produce military victory,
18There have been cases of successful coup d’etat in the region (e.g. Syria and Iraq), but we regard acoup as the state against itself, which is quite distinct from the dynamics of the political opposition defeatinggovernment forces.
57

Background Paper: Consequences of Armed Conflict November 23, 2010
but are strongly associated with government repression (Davenport 2007b; Carey 2009).
This process of war leading to an even more repressive state, which in turn leads to
more conflict is what we refer to as the political conflict trap. The trap is most evident in
broad dictatorships and transitional regimes. These regimes that are neither democracies nor
autocracies are the most likely to experience new and renewed civil war, especially in wake of a
recent institutional change (Hegre 2001). Our discussion here suggests that MENA countries
under political stress have two institutional strategies to cope with this. One is to suppress
the opposition thoroughly; the other is to open up the institutional framework slightly in
order to accommodate some opposition, but still remain in political control. If either of these
fails, the country is in serious trouble.
Wars, especially interstate wars, have led to the development of military power among the
countries of the MENA region (Barnett 1992). Coups and intrastate wars have led to fur-
ther growing political role for the military. ‘But whereas in the earlier, less institutionalized
stages, this role had tended to take the form of coup d’etat and of military or semi-military
governments, there has since been a gradual shift away from direct and open ınterventions’
and the military is now increasingly inclined to operate through more subtle, and sometimes
structural, intertwinings between civil and military networks” (Ayubi 1995): 257. The mili-
tary’s influence over policy is more diffuse and more broadly based without officers having to
serve on cabinets or as President.
The political consequences of conflict do not operate independently of other factors associ-
ated with conflict. Political exclusion compounds problems of social and economic exclusion.
Moreover, several authors (Haggard and Simmons 1987; Acemoglu, Robinson and Verdier
2004) have argued that non-democratic systems are less capable of handling economic crises
than democracies. The repressive nature of many MENA regimes suggests that this finding
is applicable to the MENA region as well. The post-conflict economic burden can therefore
become a significant political problem, destabilizing political regimes and re-igniting armed
conflict. But note, the political consequences of conflict play a critical role in this process.
Given this conclusion, future institutional arrangements in countries such as Yemen, Algeria,
Lebanon, Iran and Iraq are quite uncertain.
58
Background Paper: Consequences of Armed Conflict November 23, 2010
7.1 MENA Exceptionalism
In terms of the consequences of conflict, the MENA stands in stark contrast to the rest of
the world. In terms of the Millennium Development Goals, undernourishment, poverty, life
expectancy, GDP per capita, primary school enrollment, secondary school enrollment, primary
school gender ratios, infant mortality, under five-year mortality, and access to water are all
significant consequences of conflict. In the MENA region, we only find a consistent detrimental
consequence of war for life expectancy, GDP per capita, primary school gender ratio, infant
mortality and water access. The pattern for most of the world is unambiguous, conflict has
devastating consequences for development. In the MENA region, the results are more nuanced.
There are economic and health effects, but they are more limited. What we find in contrast
to other regions of the world is profound and unambiguous political consequences.
Also in contrast to other regions of the world, political regimes possessing inconsistent
political institutions tend not to last very long. Democracies and autocracies last much
longer. Yet, in the MENA region, broad dictatorships and semi-democracies endure. Year
after year passes without institutional change. The system survives.
We propose that oil wealth explains this exceptionalism. Not only does the region contain
a disproportionate share of the world’s oil fields, countries such as Jordan without oil deposits
receive monetary transfers from countries such as Saudi Arabia. Much has been written about
the fragility of rentier states and the resource curse. This would lead one to suspect that the
region should be facing considerable political instability, but it is not.
We offer two explanations. First, oil is not lootable. So it cannot be directly exploited by
a rebel group to finance the rebelion in the way diamonds or illegal narcotics can. Second,
the oil resources are used to sustain and support the coercive state. Weak rebels lack the
relative capability to defeat the government in military combat. Asymmetric warfare tactics
of guerrilla warfare and terrorism are used instead.
7.2 Primary Commodities and Conflict
MENA countries alone possess more than a third of known oil reserves in the world. “De-
pendence on oil revenues develops a ‘rentier state’ with weakened extractive, regulatory and
distributive powers which appears superficially strong and autonomous but which is not really
able effectively to mediate and arbitrate among the various ‘raw’ interests developing in the
59

Background Paper: Consequences of Armed Conflict November 23, 2010
society” Ayubi (1995, 400):. “Oil revenues accrue to the State: they therefore increase the
power of the State bureaucracy and, because they reduce or eliminate the need for taxation,
they also reduce the need for the government to solicit the acquiescence of it subjects to taxa-
tion. The lower the level of taxation, the less reason for publics to demand representation. ‘No
taxation without representation’ was a political demand‘; ‘no representation without taxation’
is a political reality” (Huntington 1991, 65). Oil has served to limit democratization in this
region. It also may serve to explain the stability of the regions non-democratic institutions.
In this way, Oil also relates to the political conflict trap.
The effect of primary commodities on development and the risk of armed conflict has
attracted significant attention in recent years19. As a preliminary glimpse of the issue, tables
7 and 8 tabulate conflict and oil for the MENA countries.20 We define an oil producing country
to mean that more than 30 % of merchandize exports in a given year come from petroleum
resources21. Table 7 presents single country-years grouped according to each of these variables.
Table 8 provides the same information for countries, such that for each country that has
experienced conflict at any point in time is put in the conflict row. Furthermore, a country
is counted as an oil producer if it met the 30 % cut-off for at least half the years between
1970 and 2008. Table 8 indicates that oil producers are more prone to conflict than non-oil
producer.
Table 7: Tabulation of Country Years by Conflict and Oil-producing Status for MENA Coun-tries
Non-oil-producing Oil-producing
No Conflict 490 263Conflict 143 43
19The literature is vast, for a recent review see Ross (2004) and Ross (2006).20We rely on fixed effects estimations for most of our multivariate analyses. In the MENA region, Oil is a
largely constant factor, and is as such covered by the fixed effect model. This is not necessarily the case forall Oil-producting countries. Since we are interested in the MENA region, we have omitted the Oil variable inmost models.
21Data from the World Banks World Development Indicator.
60

Background Paper: Consequences of Armed Conflict November 23, 2010
Table 8: Tabulation of Countries by Conflict andOil-producing Status
Non-oil-producing Oil-producing
No Conflict Jordan+ UAE*
Malta Bahrain*
Kuwait*
LibyaQatar
Conflict Djibouti Algeria
Israel Egypt*
Lebanon IranMorocco Iraq
Oman*
Saudi ArabiaSyria
Tunisia*
Yemen
+ UCDP Does not define the Palestinian refugeeuprising as an armed conflict.* Indicates that country was not an oil-producerthrough the entire period of analysis.
The MENA region has experienced a disproportionate amount of conflict compared to
other regions of the world. It has also experienced more conflict than expected given its level
of economic development – other middle-income regions in the world have significantly lower
incidences of conflict. This is the case even for the last decade. South and Central America,
for instance, had an incidence of conflict at about the same level as the MENA region around
the end of the Cold War, but currently less than 10% of the countries in that region are in
conflict now. It is possible that the conflicts in the MENA region are intrinsically different
than in other regions, such that they are harder to end.
8 Policy Implications
We have concluded from our analysis that the MENA region is not as much affected by a
Collieresque Conflict Trap driven by economic factors, but rather is afflicted by a political
conflict trap. The two different theories underlie the two types of traps. Behind Collier’s
conflict trap is a theory of opportunity in which the main drivers of conflict are the lack of
economic opportunities for young men and the presence of exploitable resources. Grievances
are everywhere, armed conflict manifests only when the right opportunities present themselves.
61

Background Paper: Consequences of Armed Conflict November 23, 2010
In contrast the political conflict trap focuses on patterns of economic, social and political
exclusion. Conflict results from the strategic interaction of the government and the opposition.
Repression, coercion, and exclusion all play a role in shaping the dynamics of civil conflict.
In situations where the economic conflict trap is evident, development policy should be
directed to addressing the economic drivers of conflict. Education, economic growth and
poverty reduction should be the chief policy goals. The timing of aid delivery, education,
and the promotion of international regimes such as the Kimberley Process should be priori-
tized. For much of the world, particularly Sub-Saharan Africa and South Asia, these policy
recommendations are well warranted.
Such policies, however, ignore important drivers of the political conflict trap, which is
particularly relevant for the MENA region. By addressing the institutions that sustain social,
economic, and political exclusion, a new policy focus is clear. Human rights issues, police
reform, military budgets, the development of civil society and the strengthening of political
institutions become important areas of policy reform. With regard to political institutions,
special attention should be given to the judicial and legislative branches of government and
not focus narrowly on electoral institutions (Gates et al. 2006; Zakaria 1997).
To be fair and to be clear, Collier et al. (2003) offer a wide variety of policy prescriptions
that address the economic, political, and social dimensions of conflict. These include especially
the issues of diversification of the economy and decreasing military spending, which has the
potential of reducing the risk of conflict, and to address the issues of bloated armies that
stifle economic growth (Collier et al. 2003, 134–165). These policy recommendations address
the problems of the political conflict trap more than the economic conflict trap. Given our
analysis of the consequences of conflict in the MENA region, some attention to economic policy
is warranted. Addressing political problems alone would be problematic. To address economic
and social exclusion, education and the development of an effective water infrastructure (for
clean water and sanitation) should be prioritized.
8.1 What Can Aid Donors Do?
Aid donors can address the drivers of the political conflict trap. One option is for aid donors
to punish violators of international human rights norms with lower levels of foreign aid. In
fact, there is some statistical evidence that this is already happening. As described by Lebovic
62

Background Paper: Consequences of Armed Conflict November 23, 2010
and Voeten (2009) ’shaming’ in the United Nations Commission on Human Rights, through
resolutions that explicitly criticized governments for their human rights records, has pro-
vided substantive information about rights abuses and provided political cover for the World
Bank seeking to sanction human rights violators. “The adoption of a UNCHR resolution
condemning a country’s human rights record produced a sizeable reduction in multilateral,
and especially World Bank The analyses also support predictions that “objective’ measures of
human rights have no independent effect on multilateral aid allocations” (Lebovic and Voeten
2009). Punishment for violating international human rights norms ia a real and workable
option for donors.
In terms of bilateral assistance, the Nordic development assistance programs are actively
engaged in addressing the political conflict trap and have earned a reputation for commitment
to human rights and democracy. Gates and Hoeffler (2004) compare how much aid donors give
and to which recipient countries. Using a global panel data set, spanning the period 1980-99
and 91 recipient countries, they find that Norway, Denmark, Sweden and Finland provide
significantly more aid to democracies and unlike other bilateral donors the four Nordics do
not provide more aid to political allies. They also find some evidence that recipients with a
good human rights record receive more aid from Nordic donors, particularly from Sweden and
Norway. American aid in stark contrast is very much motivated politically. Israel and Egypt
dominate the US pattern of aid allocation (Burnside and Dollar 2000). France and the UK
tend to give to their former colonies (Burnside and Dollar 2000). Our findings for this report
suggest that it would be better if more countries emulated the Nordics and the World Bank.
If aid is mainly allocated to select countries with good policies, this implies that donors
should disengage from countries with bad governance and poor institutions. Yet, if donors
want to make progress in the MENA region and combat the adverse regional and global con-
sequences of the political conflict trap. Complete disengagement is not an option. Emphasis
should be on an indirect, but active role in constructing reforms. This may include supporting
civil society groups, independent think tanks and dissemination of information. Development
policy should aim to develop counter-weights to a ‘fierce’, oppressive state.
63
Background Paper: Consequences of Armed Conflict November 23, 2010
8.2 Conclusion
The consequences of violent conflict are profound and far reaching. Modern technologies of war
give armies the capacity to kill scores of people efficiently and brutally. But the consequences
of war extend far beyond direct battlefield casualties. The strongest effect of conflict in the
MENA region is political. Conflict increases human rights abuses, entrenches authoritarian
rule, and exacerbates social fragility. These are the very factors that lead to the onset of
armed conflict, fueling social, economic and political exclusion. War sows the seeds for more
conflict. This is the essence of the political conflict trap.
‘War is development in reverse’ (Collier et al. 2003). Conflict in the MENA region has a
significant detrimental effect on life expectancy, infant mortality rates, GDP per capita, and
access to water. Securitization diverts resources away from building and rebuilding health
infrastructure or adequate sewage and water systems, and this exacerbates mortality. The
cause of increased mortality is not combat, but rather the oppressive and inefficient regimes
caught in a political conflict trap.
64

Background Paper: Consequences of Armed Conflict November 23, 2010
A Appendix
A.1 Methodology
A.1.1 Data
We utlize several datasets for our analysis. Since most of the outcome indicators are measured
at five-year intervals, most analyses are based on a dataset containing one observation for each
country for each five-year period. For the growth indicators, however, we use a country-year
design with one observation for each country for each year. For the regime duration tables,
we use an independent data source.
The conflict data come from the Uppsala Conflict Data Program (UCDP), the most com-
prehensive, accurate and widely-used data source on global armed conflicts. The version of
these data we use were backdated and adapted for statistical use in collaboration with PRIO
and is referred to as the UCDP/PRIO Armed Conflict Data (Gleditsch et al. 2002). UCDP
defines an armed conflict as a contested incompatibility that concerns government and/or
territory where the use of armed force between two parties, of which at least one is the gov-
ernment of a state, results in at least 25 battle-related deaths. A civil (or intrastate) conflict
occurs between a government and a non-governmental party. An interstate armed conflict
involves at least two states. An internationalized intrastate conflict is an intrastate armed
conflict involving the intervention of an external state. These definition of armed conflict is
becoming a standard in how conflicts are systematically defined and studied.
Updates to these data have been published annually in the report series States in Armed
Conflict since 1987, in the SIPRI Yearbook since 1988, the Journal of Peace Research since
1993 and in the Human Security Report since 2005. The data were also used in the World
Bank PRR Breaking The Conflict Trap (Collier et al. 2003). The World Bank co-funded the
backdating of these data from 1946 to 1989. These data are also being used for the 2011
World Development Report.
For the fixed effects analyses, i.e tables A-10 to A-16, we use two different measures of
amount of conflict in the preceding five-year period. The first we call ‘Conflict’. It measures
the number of years within the preceding five-year period with conflict in the country as
recorded in the UCDP/PRIO dataset (Gleditsch et al. 2002). A country without conflict the
previous period receives a score of 0, a country with only a one-year minor conflict a score of
65

Background Paper: Consequences of Armed Conflict November 23, 2010
1, and a country with minor conflict in each of the five years is assigned a 5. If the conflict
was recorded as major conflict (more than 1,000 battle-related deaths within a year), each
year of conflict is counted twice. A country with five years of major conflict then receives the
maximum score of 10.
The second conflict measure we call ‘Battle Deaths’ It is the log of the count of battle-
related deaths due to fighting in the five years preceding the observation period. About 20%
of the country-periods in our dataset have conflicts. The median conflict period led to about
2,500 deaths. The most destructive conflict periods (in Afghanistan and Cambodia) caused
over 200,000 deaths each.
For the cross section analyses, i.e. tables A-1 to A-8, we count the total number of year
the country has been in either minor or major conflict over the time period analyzed.
We also estimate the effect of ‘State Fragility’ as coded in the ‘IDA Fragile States Dynamic
List’. Countries are coded as fragile if they host peacekeeping missions or if their policies
and/or institutions are weak in terms of economic management, structural policies, policies
for social inclusion and equity, and public sector management and institutions.22 The variable
has the value 1 if the country is regarded as ‘fragile’ in at least one of the preceding five years,
and the value 0 if it was not coded as fragile in any of these years. For the MENA region, the
number of fragile states is quite low. Djibouti is the only country defined as fragile throughout
the period of analysis.
Regime duration is based entierly on the analysis of Gates et al. (2006). This dataset
measures in days the duration of different political regimes, and we combine this information
with the World Bank region definitions and the definition of conflict and post-conflict decribed
22These are the general criteria for the World Bank Country Policy and Institutional Assessment rate (CPIA)which is the basis for the fragility index. The following states are coded as ‘fragile’:
1. All countries which have CPIA < 3.24 from 2004 to 2008
2. All countries which have CPIA<(Standardized CPIA Cutoff for year t = Avg CPIAt + (Z-score*Standard Devt)) where Z-score = (3.24-(Sample Averages2005-2009 /(Sample Standard Dev.2005 − 2009 )) for years t = 1978 − 2003
3. Countries with an international or regional peacekeeping or political (non-border) mission for a givenyear observation 1977-2008, including special SRSG friends of political missions.
4. Low-income countries without a CPIA score
5. A country is eligible to graduate out of fragility when CPIA>Cutoff and it has not qualified in any otherway for the previous three years. This rule works in reverse as well, a country only relapses into fragilityif it has a CPIA<cutoff for three years or meets other criteria above or below.
6. Countries which are non-IDA before they join IDA but are fragile once they join IDA (or receive a CPIAscore) are coded as fragile in the years preceding.
66
Background Paper: Consequences of Armed Conflict November 23, 2010
below.
A.2 Conflict Country Categories
In a number of figures, we present information classified by conflict country category. We
group countries into three categories: Countries that have had no conflict between 1980 and
2008 (‘non-conflict’), countries that had at least one year of conflict in the 1981–1990 period
but no conflicts thereafter (‘post-conflict’), and countries that had conflicts during the 1991–
2008 period (‘conflict’).
A.3 MDG indicators Used in the Analysis
Many of the indicators have a natural maximum. Primary education attainment cannot
exceed 100%, infant mortality rates can hardly go below 5 per 1,000, and measures such as
our democracy index has a fixed maximum. Many industrialized countries have reached the
maximum values for many indicators. These countries also have almost no armed conflicts
(or at least relatively limited conflicts such as the one in Northern Ireland). To avoid that the
lack of improvement in our indicators for these countries affect our analysis we remove all but
one of the countries that were classified as industrialized in the first World Bank Development
Report (World Bank 1978, p.77). The exception is South Africa which we retain in our
sample.23
A.4 Model Specification
A.4.1 Country Fixed effects models
Most earlier studies of the effects of conflict on development outcomes compare indicators
such as the percentage of the population that suffer from undernourishment for countries
with conflict with the same indicators for countries without conflict. Figure A-1 exemplifies
this analysis by showing the distribution of undernourishment for conflict, post-conflict, and
non-conflict countries (left panel) and the corresponding distribution for fragile vs. non-fragile
states (right panel).24
23The industrialized countries we exclude are were Austria, Australia, Belgium, Canada, Denmark, Finland,France, Germany, Ireland, Italy, Japan, the Netherlands, New Zealand, Norway, Sweden, Switzerland, UnitedKingdom, United States.
24The median value in each group is given by the vertical line inside the box in the center of each box-whisker combination. The outer values of this box are the 25th and 75th percentiles. The whiskers represent
67
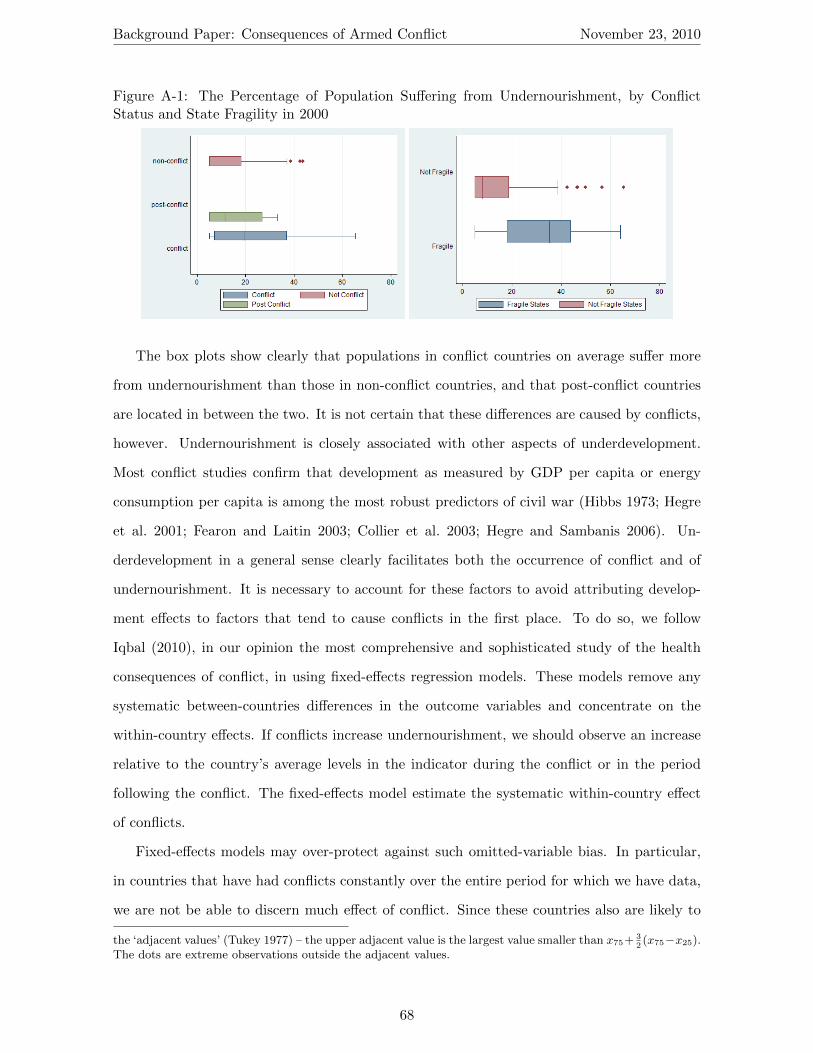
Background Paper: Consequences of Armed Conflict November 23, 2010
Figure A-1: The Percentage of Population Suffering from Undernourishment, by ConflictStatus and State Fragility in 2000
The box plots show clearly that populations in conflict countries on average suffer more
from undernourishment than those in non-conflict countries, and that post-conflict countries
are located in between the two. It is not certain that these differences are caused by conflicts,
however. Undernourishment is closely associated with other aspects of underdevelopment.
Most conflict studies confirm that development as measured by GDP per capita or energy
consumption per capita is among the most robust predictors of civil war (Hibbs 1973; Hegre
et al. 2001; Fearon and Laitin 2003; Collier et al. 2003; Hegre and Sambanis 2006). Un-
derdevelopment in a general sense clearly facilitates both the occurrence of conflict and of
undernourishment. It is necessary to account for these factors to avoid attributing develop-
ment effects to factors that tend to cause conflicts in the first place. To do so, we follow
Iqbal (2010), in our opinion the most comprehensive and sophisticated study of the health
consequences of conflict, in using fixed-effects regression models. These models remove any
systematic between-countries differences in the outcome variables and concentrate on the
within-country effects. If conflicts increase undernourishment, we should observe an increase
relative to the country’s average levels in the indicator during the conflict or in the period
following the conflict. The fixed-effects model estimate the systematic within-country effect
of conflicts.
Fixed-effects models may over-protect against such omitted-variable bias. In particular,
in countries that have had conflicts constantly over the entire period for which we have data,
we are not be able to discern much effect of conflict. Since these countries also are likely to
the ‘adjacent values’ (Tukey 1977) – the upper adjacent value is the largest value smaller than x75+ 32(x75−x25).
The dots are extreme observations outside the adjacent values.
68

Background Paper: Consequences of Armed Conflict November 23, 2010
be the most severely affected by conflict, the fixed-effects model may yield overly conservative
estimates. This is accentuated by the fact that conflict also hinders development. Some
countries may be poor when our data series start (typically at some year between 1970 and
1990) because of the conflicts they have had up to then. Our models will also ignore this
effect.
Nevertheless, we choose to present a set of conservative estimates. For some indicators,
this probably prevents us from identifying an effect of conflict. Still, for other indicators we
find very substantial detrimental effects of conflict despite these limitations.
A.4.2 Autocorrelation
Another big issue with our data is that an observations for the same country may be de-
pendent on previous observations. In other words, the assumption that our observations are
independent is violated. To account for this, we also estimate an AR1 model.
Our empirical models estimate level of infant mortality, undernourishment, per capita
income, etc. as a function of conflict. These results explain cross-sectional variation within
a sample. In order to visualize the effect over time these results are less useful. While they
represent a valid identification of the consequence of conflict, predictions based on these results
omit the case-specific history. Thus, after a given period, the post-conflict lag variables will no
longer ‘remember’ the case-specific conflict, and the predicted levels of economic development
will be exactly equal to a similar case with no pre-occurring conflict.
We therefore illustrate our results using a period on period change model, and run a
number of simulations on these results to visualize the consequences of conflict. The dependent
variable in these models are X − X[t − 1], with X[t − 1] included as a control variable. By
setting the initial level of for instance GDP/Capita to $700 in 1969, we can use the estimated
conflict dependent growth level to calculate the level of GDP/Capita in 1970. The estimated
level for 1970 can in turn be used to estimate 1971, and this routine can be iterated all the
way up until today. By holding all other covariates fixed, we can then compare the estimated
levels for different conflict scenarios.
Yet, our estimations are uncertain, and a crude comparison of two trends are likely to
over-emphasize differences that in reality might be products of the estimation rather than
real effects of conflict. Following King, Tomz and Wittenberg (2000) we draw 1000 sets of co-
69

Background Paper: Consequences of Armed Conflict November 23, 2010
efficients from a multi-normal distribution based on the variance/covariance matrix produced
by the regression model. Each of these draws are used to simulate the change from period to
period for a scenario with conflict and a scenario without conflict. The result is 1000 different
estimation of the corresponding level of interest at each period, and it is this set that is the
basis for our figures.
A.4.3 Time trend dummies
Most indicators have trends that show improvement in the MDG indicators. Given this strong
trend, conflict countries may also improve the general situation in the country. We include
dummy variables for each five-year period to account for this trend.
A.5 Regression Results
Table A-1: Cross Section Analysis, Secondary Education Attainment
(1) (2) (3) (4) (5)improvement improvement improvement improvement improvement
exposure 0.00472** 0.00460** 0.00468** 0.00442** 0.00407**(0.00187) (0.00186) (0.00190) (0.00186) (0.00190)
(firstnm) edu -0.317*** -0.328*** -0.320*** -0.361*** -0.284***(0.0584) (0.0582) (0.0615) (0.0608) (0.0585)
logged total population 0.00450 0.00530 0.00436 0.000265 -0.00153(0.00688) (0.00634) (0.00707) (0.00618) (0.00639)
(sum) minor 0.00125(0.00166)
(sum) war -0.00592**(0.00234)
bd1k -0.000396***(0.000149)
lnbd -0.00240(0.00276)
(sum) fsida -0.00340***(0.00120)
(sum) cpia 0.000636**(0.000286)
Constant 0.239** 0.254*** 0.257*** 0.308*** 0.270***(0.0935) (0.0924) (0.0944) (0.0938) (0.0933)
N 153 153 153 153 153Start 1973.6 1973.6 1973.6 1973.6 1973.6End 2008.9 2008.9 2008.9 2008.9 2008.9r2 0.488 0.490 0.467 0.493 0.483
Standard errors in parentheses
* p < 0.10, ** p < 0.05, *** p < 0.01
The time series for education level starts in 1970, yielding four decades of data to be
70

Background Paper: Consequences of Armed Conflict November 23, 2010
analyzed. The dependent variable in this table is the improvement made by each nation
between the first and the last non-missing observation. The first two coefficients make sense.
The longer the time period the improvement is measured over, the larger is the improvement,
and a high initial education level leads to a tinyer improvement. Conflict is measured in three
different ways. The first column includes the variables “War” and “Minor”, which counts the
number of years that the country in question has seen either war (1000+ persons killed in battle
related situations) or minor armed conflict (more than 25 persons killed but less than 1000).
Minor conflict has no impact on the education level in a country, whereas each year of war
reduces the improvement, and thereby the final level of education with 0.6 percentage points.
The second column measures the impact of battle-related fatalities directly. Contrasting these
results with those in the first column indicates that it is the most intense conflicts that are
the most influential. A single year of conflict with 1000 fatalities is estimated to reduce the
education level by 0.04 percentage points. The average war must have at least 15 000 fatalities
per year if the substantive effect from this regression are to match the interpretation in the
first column. Further indication of the importance of the largest conflicts is given in the third
column, where conflict is operationalized as the log of battle deaths. This operationalization
is based on an assumption that the effect of the marginal victim is decreasing, but the results
does not support this assumption for education levels. Columns 4,5, and 6 include interaction
effects with region (not shown). MENA is the reference category, and the interpretation of the
conflict variables are therefore MENA-specific. As we can see, there are no effect of conflict
on the improvement of secondary education in the MENA region.
The female to male ratio is based on WDI variable“se enr prim fm zs”, and covers broadly
the time period 1975-2007. The variable measures the number of female students per 100 male
students. The results in this section are very similar to those discussed in the previous section.
The time between first and last observation is still positive, and the initial level is still negative,
which also here is as expected. The effect of conflict is somewhat different, though. Three
years of war is roughly corresponding to the loss of one female student per 100 male students.
This result is not as dependent on the most lethal conflicts, as the log-transformed battle death
measure is significant, albeit not at the 5% level. When we compare the global results with
the MENA-specific coefficients in columns 4-6, we see that the coefficients are very similar for
the linear battle-death indicator, but not for the two others. Conflict is strongly affecting this
71

Background Paper: Consequences of Armed Conflict November 23, 2010
Table A-2: Cross Section Analysis, Female Primary Education
(1) (2) (3) (4) (5)improvement improvement improvement improvement improvement
exposure 0.246*** 0.257*** 0.260*** 0.235*** 0.192**(0.0838) (0.0801) (0.0841) (0.0804) (0.0921)
(firstnm) femedu -0.826*** -0.846*** -0.834*** -0.873*** -0.825***(0.0338) (0.0329) (0.0347) (0.0349) (0.0341)
logged total population -0.0180 0.122 0.146 -0.320 -0.357(0.403) (0.356) (0.410) (0.350) (0.382)
(sum) minor 0.0768(0.109)
(sum) war -0.369**(0.156)
bd1k -0.0384***(0.00935)
lnbd -0.293*(0.164)
(sum) fsida -0.336***(0.0838)
(sum) cpia 0.0271(0.0184)
Constant 76.72*** 77.55*** 77.06*** 83.08*** 80.03***(5.166) (4.895) (5.135) (5.088) (5.384)
N 151 151 151 151 151Start 1975.7 1975.7 1975.7 1975.7 1975.7End 2006.3 2006.3 2006.3 2006.3 2006.3r2 0.889 0.897 0.887 0.896 0.886
Standard errors in parentheses
* p < 0.10, ** p < 0.05, *** p < 0.01
72

Background Paper: Consequences of Armed Conflict November 23, 2010
MDG in Sub-Saharan Africa and South Asia, but not in the region between these two.
Table A-3: Cross Section Analysis, Growth in GDP Capita
(1) (2) (3) (4) (5)improvement improvement improvement improvement improvement
exposure 0.0138** 0.0127** 0.0171*** 0.0123** 0.0107(0.00640) (0.00619) (0.00623) (0.00553) (0.00663)
(firstnm) gdp capita -0.429*** -0.430*** -0.446*** -0.501*** -0.412***(0.0653) (0.0652) (0.0634) (0.0594) (0.0696)
logged total population -0.0943* -0.0986** -0.0512 -0.133*** -0.110**(0.0498) (0.0494) (0.0481) (0.0407) (0.0455)
(sum) minor -0.00727(0.00996)
(sum) war 0.000855(0.0188)
bd1k -0.000713(0.00201)
lnbd -0.0505***(0.0181)
(sum) fsida -0.0481***(0.00830)
(sum) cpia 0.00177(0.00232)
Constant 4.311*** 4.353*** 4.200*** 5.253*** 4.299***(0.799) (0.796) (0.753) (0.705) (0.786)
N 148 148 148 148 148Start 1972.1 1972.1 1972.1 1972.1 1972.1End 2007.7 2007.7 2007.7 2007.7 2007.7r2 0.363 0.361 0.394 0.486 0.363
Standard errors in parentheses
* p < 0.10, ** p < 0.05, *** p < 0.01
Earlier in this paper we find the effect of conflict on GDP per Capita growth to be negative
for the duration of the conflict, but that there are very tiny, if any, long-term effects of conflict
on growth. This result is evident in the cross-sectional regression results. We find no effect
of War years and no linear effect of battle deaths. There is a long-term effect from a log-
transformed battle-death variable, which indicates that conflict is detrimental above a certain
level, but that there is little additional damage done once this level has been reached.
The MENA-specific effect is similar to the log-transformed battle-death coefficient, but it
is tinyer and not statistically significant. There is again evidence suggesting that this effect
is most severely felt in Sub-Saharan Africa. On the other hand, there are no effects for any
region what so ever for the linear battle-death variable and the year-count model.
Infant mortality rates are very strongly affected by conflict. The improvement made over
the time period in question is reduced by approximately one child per 1000, per year of conflict.
73

Background Paper: Consequences of Armed Conflict November 23, 2010
Table A-4: Cross Section Analysis, Infant Mortality Rates
(1) (2) (3) (4) (5)improvement improvement improvement improvement improvement
exposure -0.652*** -0.641*** -0.659*** -0.533*** -0.554***(0.186) (0.174) (0.187) (0.171) (0.182)
(firstnm) imr -0.591*** -0.604*** -0.607*** -0.666*** -0.556***(0.0395) (0.0369) (0.0404) (0.0384) (0.0382)
logged total population -1.450 -1.366 -1.642 0.501 0.581(1.080) (0.944) (1.087) (0.908) (0.973)
(sum) minor 0.214(0.206)
(sum) war 0.888***(0.300)
bd1k 0.110***(0.0192)
lnbd 1.260***(0.396)
(sum) fsida 1.051***(0.164)
(sum) cpia -0.181***(0.0403)
Constant 16.40 16.39* 16.03 6.165 3.992(10.24) (9.424) (10.28) (9.120) (9.730)
N 153 153 153 153 153Start 1966.8 1966.8 1966.8 1966.8 1966.8End 2008.9 2008.9 2008.9 2008.9 2008.9r2 0.812 0.834 0.809 0.841 0.821
Standard errors in parentheses
* p < 0.10, ** p < 0.05, *** p < 0.01
74
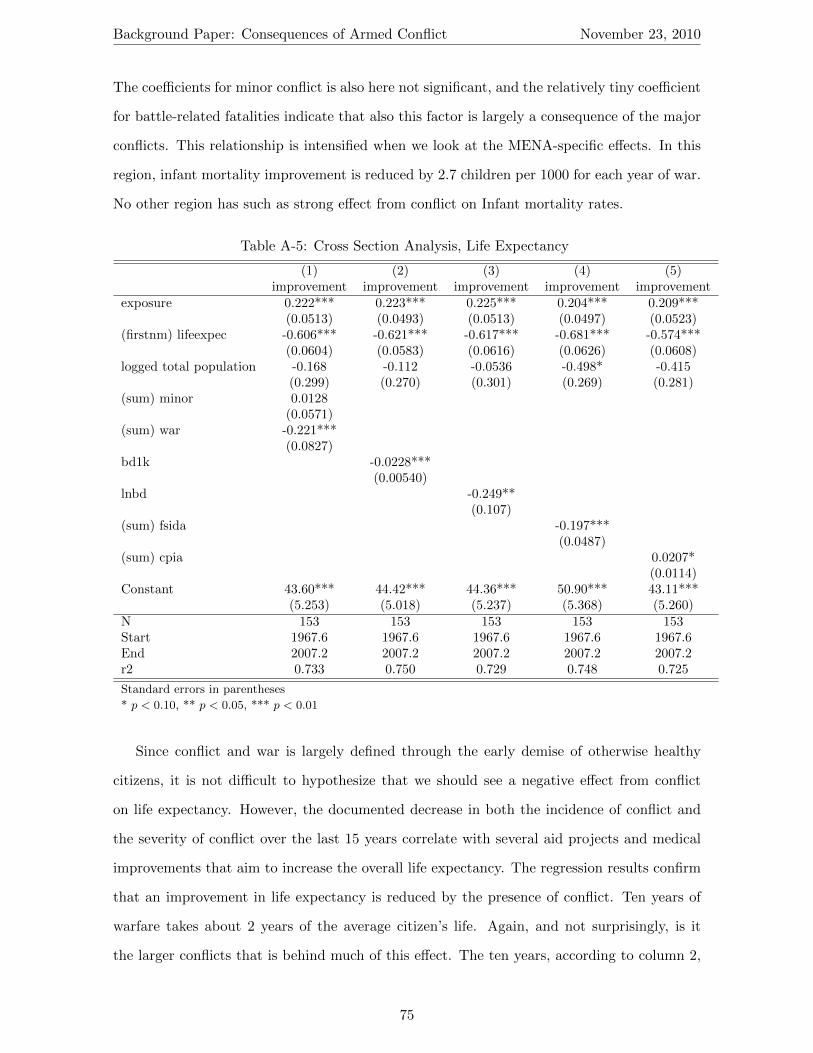
Background Paper: Consequences of Armed Conflict November 23, 2010
The coefficients for minor conflict is also here not significant, and the relatively tiny coefficient
for battle-related fatalities indicate that also this factor is largely a consequence of the major
conflicts. This relationship is intensified when we look at the MENA-specific effects. In this
region, infant mortality improvement is reduced by 2.7 children per 1000 for each year of war.
No other region has such as strong effect from conflict on Infant mortality rates.
Table A-5: Cross Section Analysis, Life Expectancy
(1) (2) (3) (4) (5)improvement improvement improvement improvement improvement
exposure 0.222*** 0.223*** 0.225*** 0.204*** 0.209***(0.0513) (0.0493) (0.0513) (0.0497) (0.0523)
(firstnm) lifeexpec -0.606*** -0.621*** -0.617*** -0.681*** -0.574***(0.0604) (0.0583) (0.0616) (0.0626) (0.0608)
logged total population -0.168 -0.112 -0.0536 -0.498* -0.415(0.299) (0.270) (0.301) (0.269) (0.281)
(sum) minor 0.0128(0.0571)
(sum) war -0.221***(0.0827)
bd1k -0.0228***(0.00540)
lnbd -0.249**(0.107)
(sum) fsida -0.197***(0.0487)
(sum) cpia 0.0207*(0.0114)
Constant 43.60*** 44.42*** 44.36*** 50.90*** 43.11***(5.253) (5.018) (5.237) (5.368) (5.260)
N 153 153 153 153 153Start 1967.6 1967.6 1967.6 1967.6 1967.6End 2007.2 2007.2 2007.2 2007.2 2007.2r2 0.733 0.750 0.729 0.748 0.725
Standard errors in parentheses
* p < 0.10, ** p < 0.05, *** p < 0.01
Since conflict and war is largely defined through the early demise of otherwise healthy
citizens, it is not difficult to hypothesize that we should see a negative effect from conflict
on life expectancy. However, the documented decrease in both the incidence of conflict and
the severity of conflict over the last 15 years correlate with several aid projects and medical
improvements that aim to increase the overall life expectancy. The regression results confirm
that an improvement in life expectancy is reduced by the presence of conflict. Ten years of
warfare takes about 2 years of the average citizen’s life. Again, and not surprisingly, is it
the larger conflicts that is behind much of this effect. The ten years, according to column 2,
75

Background Paper: Consequences of Armed Conflict November 23, 2010
should have 10000 fatalities, not 1000 before the previous conclusion holds.
Table A-6: Cross Section Analysis, Logged Infant Mortality
(1) (2) (3) (4) (5)improvement improvement improvement improvement improvement
exposure -0.0343*** -0.0345*** -0.0345*** -0.0307*** -0.0322***(0.00431) (0.00417) (0.00428) (0.00416) (0.00443)
(firstnm) limr -0.0510 -0.0525 -0.0733 -0.154** -0.0179(0.0709) (0.0686) (0.0713) (0.0722) (0.0731)
logged total population 0.0321 0.0272 0.0165 0.0597** 0.0543**(0.0275) (0.0251) (0.0277) (0.0242) (0.0257)
(sum) minor 0.000496(0.00534)
(sum) war 0.0195**(0.00768)
bd1k 0.00208***(0.000528)
lnbd 0.0277***(0.00993)
(sum) fsida 0.0202***(0.00454)
(sum) cpia -0.00164(0.00107)
Constant -0.238 -0.219 -0.136 -0.137 -0.536*(0.315) (0.302) (0.321) (0.300) (0.321)
N 153 153 153 153 153Start 1969.9 1969.9 1969.9 1969.9 1969.9End 2006.9 2006.9 2006.9 2006.9 2006.9r2 0.652 0.671 0.654 0.680 0.641
Standard errors in parentheses
* p < 0.10, ** p < 0.05, *** p < 0.01
It is interesting that the MENA-specific coefficients are partially stronger than the global
effect, but they are not statistically significant. The South Asia region inhibits a strong effect
from conflict on life expectancy, but not other region seems to significantly affected in this
way.
Casualties in conflicts are quite difficult to observe, but it is not obvious whether there is a
gender effect. Since most combatants are men, it should be plausible that most battle-deaths
involve men. If this is the case, one might suggest that an entrenched conflict should increase
female life expectancy relative to male.
The graphs in Section 6.1 are based on this ordinal logit regression model. We use Clarify
(King, Tomz and Wittenberg 2000) to compute the expected probabilities for each of the five
outcomes in the model under the various settings that are presented in the figures. All control
variables are held to their MENA sample median.
76

Background Paper: Consequences of Armed Conflict November 23, 2010
Table A-7: Cross Section Analysis, Female to Male Ratio
(1) (2) (3) (4) (5)improvement improvement improvement improvement improvement
exposure -0.0146 -0.0115 -0.00935 -0.00772 -0.0134(0.0287) (0.0288) (0.0289) (0.0286) (0.0292)
(firstnm) ratio -0.749*** -0.746*** -0.742*** -0.731*** -0.745***(0.0686) (0.0688) (0.0690) (0.0688) (0.0688)
logged total population 0.191 0.293* 0.342** 0.288* 0.286*(0.164) (0.155) (0.169) (0.149) (0.153)
(sum) minor 0.0319(0.0322)
(sum) war 0.0454(0.0465)
bd1k 0.000533(0.00315)
lnbd -0.0338(0.0596)
(sum) fsida -0.0420(0.0265)
(sum) cpia 0.00281(0.00641)
Constant 78.22*** 77.26*** 76.59*** 75.68*** 77.16***(7.636) (7.652) (7.702) (7.631) (7.634)
N 153 153 153 153 153Start 1967.6 1967.6 1967.6 1967.6 1967.6End 2007.2 2007.2 2007.2 2007.2 2007.2r2 0.600 0.593 0.593 0.600 0.593
Standard errors in parentheses
* p < 0.10, ** p < 0.05, *** p < 0.01
77

Background Paper: Consequences of Armed Conflict November 23, 2010
Table A-8: Cross Section Analysis, Access to Water
(1) (2) (3) (4) (5)improvement improvement improvement improvement improvement
exposure 0.430** 0.441** 0.431** 0.434** 0.221(0.194) (0.192) (0.192) (0.187) (0.216)
(firstnm) water -0.299*** -0.302*** -0.312*** -0.339*** -0.301***(0.0392) (0.0386) (0.0394) (0.0396) (0.0391)
logged total population 0.889** 1.026** 1.037** 0.551 0.535(0.432) (0.417) (0.425) (0.395) (0.418)
(sum) minor 0.125(0.208)
(sum) war -0.618**(0.298)
bd1k -0.0830**(0.0322)
lnbd -0.398**(0.176)
(sum) fsida -0.459***(0.127)
(sum) cpia 0.0633*(0.0333)
Constant 13.96** 13.61** 14.92** 20.62*** 18.71***(6.216) (6.125) (6.129) (6.153) (6.440)
N 147 147 147 147 147Start 1991.7 1991.7 1991.7 1991.7 1991.7End 2005.5 2005.5 2005.5 2005.5 2005.5r2 0.468 0.477 0.471 0.499 0.466
Standard errors in parentheses
* p < 0.10, ** p < 0.05, *** p < 0.01
78

Background Paper: Consequences of Armed Conflict November 23, 2010
Table A-9: Effect of Conflict on Annual Growth in GDP per Capita (PPP, logged), 1960–2005,OLS with Panel-Corrected Standard Errors
(1) (2) (3) (4) (5) (6)C C with lags C, lags, FE BD BD with lags est6
conflict -0.0184∗∗∗ -0.0220∗∗∗ -0.0220∗∗∗
(0.00327) (0.00325) (0.00325)Dummy coded 1 if country is a MENA country -0.0142∗ -0.0208∗∗∗ -0.0173∗∗ -0.0208∗∗∗ -0.0112 -0.0185∗∗
(0.00626) (0.00621) (0.00624) (0.00621) (0.00599) (0.00625)southamerica -0.0128 -0.0228∗∗∗ -0.0222∗∗∗ -0.0228∗∗∗ -0.0128 -0.0230∗∗∗
(0.0104) (0.00328) (0.00339) (0.00328) (0.0104) (0.00335)easterneurope -0.0115 -0.00842 -0.00809 -0.00842 -0.0113 -0.00457
(0.00872) (0.00844) (0.00852) (0.00844) (0.00865) (0.00881)eastcentralsouthafrica -0.0284∗∗∗ -0.0314∗∗∗ -0.0305∗∗∗ -0.0314∗∗∗ -0.0284∗∗∗ -0.0317∗∗∗
(0.00479) (0.00613) (0.00613) (0.00613) (0.00486) (0.00645)centralsouthasia -0.0203∗∗∗ -0.0272∗∗∗ -0.0272∗∗∗ -0.0272∗∗∗ -0.0206∗∗∗ -0.0277∗∗∗
(0.00337) (0.00419) (0.00417) (0.00419) (0.00336) (0.00443)eastasia -0.00584 0.00313 0.00193 0.00313 -0.00616 0.00593
(0.00618) (0.00436) (0.00440) (0.00436) (0.00612) (0.00469)Interaction between mena marker and conflict var 0.0122 0.00940 -0.00423 0.00940
(0.00726) (0.00630) (0.00607) (0.00630)td65 0.0425∗∗ 0 0 0 0.0427∗∗
(0.0144) (0) (0) (0) (0.0145)td70 0.0236 -0.00274 0 -0.00274 0.0236
(0.0149) (0.00702) (0) (0.00702) (0.0150)td75 0.00876 -0.0143∗ -0.0124 -0.0143∗ 0.00851
(0.0148) (0.00686) (0.00662) (0.00686) (0.0148)td80 -0.00734 -0.0293∗∗∗ -0.0273∗∗∗ -0.0293∗∗∗ -0.00766
(0.0143) (0.00658) (0.00675) (0.00658) (0.0144)td85 -0.00313 -0.0265∗∗∗ -0.0246∗∗∗ -0.0265∗∗∗ -0.00379
(0.0141) (0.00633) (0.00659) (0.00633) (0.0141)td90 -0.0181 -0.0317∗∗∗ -0.0296∗∗∗ -0.0317∗∗∗ -0.0190
(0.0138) (0.00621) (0.00654) (0.00621) (0.0138)td95 0.0125 -0.0126∗ -0.0103 -0.0126∗ 0.0116
(0.0136) (0.00596) (0.00633) (0.00596) (0.0137)td00 0.0194 -0.00662 -0.00376 -0.00662 0.0185
(0.0137) (0.00592) (0.00661) (0.00592) (0.0138)td05 0.0262 0 0.00317 0 0.0256
(0.0141) (0) (0.00692) (0) (0.0141)conflict 1 -0.00510 -0.0117∗∗∗ -0.00510
(0.00316) (0.00327) (0.00316)conflict 2 0.00346 -0.000248 0.00346
(0.00328) (0.00337) (0.00328)conflict 3 -0.000454 -0.00335 -0.000454
(0.00341) (0.00356) (0.00341)conflict 4 0.00574 0.00499 0.00574
(0.00339) (0.00356) (0.00339)conflict 5 0.00291 0.00186 0.00291
(0.00340) (0.00354) (0.00340)conflict 6 0.00305 0.00257 0.00305
(0.00334) (0.00347) (0.00334)conflict 7 -0.000522 -0.000935 -0.000522
(0.00346) (0.00355) (0.00346)conflict 8 0.00560 0.00449 0.00560
(0.00344) (0.00354) (0.00344)conflict 9 -0.000435 0.0000334 -0.000435
(0.00327) (0.00340) (0.00327)conflict 10 0.00115 0.000978 0.00115
(0.00317) (0.00327) (0.00317)bd -0.00331∗∗∗ -0.00489∗∗∗
(0.000606) (0.000693)bd 1 -0.000707
(0.000683)bd 2 0.00154∗
(0.000696)bd 3 -0.000859
(0.000716)bd 4 0.000212
(0.000708)bd 5 0.00134
(0.000701)bd 6 0.000445
(0.000682)bd 7 -0.000554
(0.000707)bd 8 0.00192∗∗
(0.000701)bd 9 0.000677
(0.000661)bd 10 -0.000461
(0.000641)Constant 0.0265∗ 0.0530∗∗∗ 0.0491∗∗∗ 0.0530∗∗∗ 0.0268∗ 0.0375∗∗∗
(0.0119) (0.00553) (0.00568) (0.00553) (0.0119) (0.00332)Observations 5273 4267 4267 4267 5273 4267Log likelihood
χ2 151.6 253.2 196.5 253.2 149.1 174.3
Standard errors in parentheses∗ p < 0.05, ∗∗ p < 0.01, ∗∗∗ p < 0.001C: measure. BD: Battle Deaths measure
79

Background Paper: Consequences of Armed Conflict November 23, 2010
Table A-10: Fixed-Effects Analysis, Infant Mortality Rates, 1970–2005
(1) (2) (3) (4) (5)Conflict Battle Deaths BD*Pop. Fragility PCSE, AR(1)
1975-79 -0.121 -0.123 -0.143 -0.253∗∗ -0.152(0.0940) (0.136) (0.0948) (0.0928) .
1980-84 -0.419∗∗∗ -0.498∗∗∗ -0.416∗∗∗ -0.509∗∗∗ -0.372∗∗∗
(0.0954) (0.138) (0.0962) (0.0955) (0.0296)1985-89 -0.581∗∗∗ -0.826∗∗∗ -0.588∗∗∗ -0.625∗∗∗ -0.611∗∗∗
(0.100) (0.144) (0.101) (0.0999) (0.0598)1990-94 -0.878∗∗∗ -1.070∗∗∗ -0.866∗∗∗ -0.903∗∗∗ -0.824∗∗∗
(0.0962) (0.139) (0.0970) (0.0959) (0.0837)1995-99 -1.015∗∗∗ -1.081∗∗∗ -1.004∗∗∗ -1.013∗∗∗ -1.009∗∗∗
(0.0939) (0.136) (0.0949) (0.0908) (0.0752)2000-04 -1.089∗∗∗ -1.291∗∗∗ -1.087∗∗∗ -1.150∗∗∗ -1.202∗∗∗
(0.0866) (0.124) (0.0874) (0.0858) (0.0617)2005-08 -1.243∗∗∗ -1.433∗∗∗ -1.228∗∗∗ -1.349∗∗∗ -1.399∗∗∗
(0.0873) (0.125) (0.0882) (0.0865) (0.0634)Log of Population 0.118∗∗∗ 0.0811∗∗∗ 0.124∗∗∗ 0.164∗∗∗ 0.108∗∗∗
(0.0155) (0.0221) (0.0176) (0.0139) (0.0198)Conflict t-1 0.0594∗∗∗ 0.0141∗
(0.0108) (0.00561)Dummy coded 1 if country is a MENA country 0.502∗∗∗ -0.238∗ 0.486∗∗∗ 0.425∗∗∗
(0.0837) (0.107) (0.0865) (0.0769)southamerica 0.657∗∗∗ 0.645∗∗∗ 0.607∗∗∗
(0.0655) (0.0667) (0.0648)easterneurope -0.195∗ -0.203∗ -0.244∗∗
(0.0963) (0.0972) (0.0900)eastcentralsouthafrica 1.693∗∗∗ 1.690∗∗∗ 1.471∗∗∗
(0.0878) (0.0886) (0.0886)centralsouthasia 1.451∗∗∗ 1.445∗∗∗ 1.356∗∗∗
(0.0772) (0.0781) (0.0769)eastasia 0.782∗∗∗ 0.801∗∗∗ 0.847∗∗∗
(0.0995) (0.103) (0.0965)Interaction between mena marker and battle deaths var -0.101∗∗∗
(0.0283)Conflict in Neighbourhood 0.0344∗∗∗ 0.0463∗∗∗ 0.0341∗∗∗ 0.00789
(0.00733) (0.0102) (0.00744) (0.00541)Fuel Exports 0.00102 0.00128 0.00129 0.00149∗ 0.000549
(0.000729) (0.00105) (0.000732) (0.000719) (0.000662)Log of Battle Deaths t-1 0.0221∗ 0.0412∗∗∗
(0.0110) (0.00932)MenaBdeaths1 5 -0.0249 -0.0548∗∗
(0.0263) (0.0187)Log of Battle Deaths t-1 X Log of Population -0.00401
(0.00458)Fragility 0.551∗∗∗
(0.0748)Interaction between fragility var and mena marker 0.203
(0.330)Constant 2.434∗∗∗ 3.536∗∗∗ 2.374∗∗∗ 2.295∗∗∗ 3.546∗∗∗
(0.158) (0.207) (0.171) (0.152) (0.196)Observations 630 630 630 646 630Log likelihood -504.6 -742.1 -508.9 -518.2
χ2 4888.3
Standard errors in parentheses∗ p < 0.05, ∗∗ p < 0.01, ∗∗∗ p < 0.001
80

Background Paper: Consequences of Armed Conflict November 23, 2010
Table A-11: Fixed-Effects Analysis, Life Expectancy, 1970–2005
(1) (2) (3) (4) (5)Conflict Battle Deaths BD*Pop. Fragility PCSE, AR(1)
1975-79 2.365∗∗ 2.419 2.572∗∗ 3.723∗∗∗ 2.150(0.901) (1.456) (0.913) (0.889) .
1980-84 5.597∗∗∗ 6.621∗∗∗ 5.603∗∗∗ 6.422∗∗∗ 4.662(0.919) (1.486) (0.932) (0.919) .
1985-89 7.571∗∗∗ 11.10∗∗∗ 7.603∗∗∗ 8.203∗∗∗ 7.198(0.961) (1.541) (0.975) (0.955) .
1990-94 10.24∗∗∗ 12.82∗∗∗ 10.06∗∗∗ 10.50∗∗∗ 9.347(0.935) (1.501) (0.947) (0.932) .
1995-99 11.13∗∗∗ 12.20∗∗∗ 10.96∗∗∗ 11.21∗∗∗ 10.72(0.911) (1.468) (0.926) (0.880) .
2000-04 11.39∗∗∗ 13.30∗∗∗ 11.35∗∗∗ 12.13∗∗∗ 12.00(0.838) (1.341) (0.851) (0.830) .
2005-08 12.25∗∗∗ 13.58∗∗∗ 12.07∗∗∗ 13.29∗∗∗ 13.15(0.846) (1.349) (0.859) (0.836) .
Log of Population -0.624∗∗∗ -0.134 -0.733∗∗∗ -1.070∗∗∗ -0.673(0.150) (0.237) (0.171) (0.134) (0)
Conflict t-1 -0.712∗∗∗ -0.196(0.106) (0)
Dummy coded 1 if country is a MENA country -1.766∗ 4.831∗∗∗ -1.534 -0.755(0.822) (1.168) (0.854) (0.751)
southamerica -1.367∗ -1.213 -0.901(0.640) (0.654) (0.632)
easterneurope -0.410 -0.264 0.0958(0.949) (0.962) (0.889)
eastcentralsouthafrica -17.85∗∗∗ -17.72∗∗∗ -15.55∗∗∗
(0.858) (0.871) (0.870)centralsouthasia -17.55∗∗∗ -17.43∗∗∗ -16.41∗∗∗
(0.746) (0.759) (0.744)eastasia -5.411∗∗∗ -5.710∗∗∗ -5.818∗∗∗
(0.979) (1.016) (0.954)Interaction between mena marker and battle deaths var 1.171∗∗∗
(0.279)Conflict in Neighbourhood -0.265∗∗∗ -0.577∗∗∗ -0.259∗∗∗ -0.0802
(0.0713) (0.111) (0.0729) (0)Fuel Exports -0.00737 -0.00450 -0.0108 -0.0124 0.00381
(0.00712) (0.0114) (0.00719) (0.00702) .Log of Battle Deaths t-1 -0.235∗ -0.472∗∗∗
(0.120) (0.0896)MenaBdeaths1 5 0.292 0.624∗∗∗
(0.288) (0.185)Log of Battle Deaths t-1 X Log of Population 0.0586
(0.0441)Fragility -5.536∗∗∗
(0.734)Interaction between fragility var and mena marker -1.189
(3.274)Constant 68.32∗∗∗ 57.78∗∗∗ 69.31∗∗∗ 69.77∗∗∗ 59.65
(1.522) (2.204) (1.662) (1.446) .Observations 644 644 644 663 644Log likelihood -1990.4 -2302.5 -1998.1 -2053.3
χ2 .
Standard errors in parentheses∗ p < 0.05, ∗∗ p < 0.01, ∗∗∗ p < 0.001
81

Background Paper: Consequences of Armed Conflict November 23, 2010
Table A-12: Fixed-Effects Analysis, Access to Water, 1990–2005
(1) (2) (3) (4) (5)Conflict Battle Deaths BD*Pop. Fragility PCSE, AR(1)
1975-79 0 0 0 0 0(0) (0) (0) (0) (0)
1980-84 0 0 0 0 0(0) (0) (0) (0) (0)
1985-89 0 0 0 0 0(0) (0) (0) (0) (0)
1990-94 0 0 0 -2.979 89.37∗∗∗
(0) (0) (0) (2.095) (4.368)1995-99 2.794 0.682 2.446 0 91.43∗∗∗
(2.200) (2.921) (2.174) (0) (5.266)2000-04 5.164∗ 4.258 4.857∗ 2.632 94.35∗∗∗
(2.046) (2.697) (2.017) (1.804) (5.596)2005-08 6.932∗∗ 5.722∗ 6.691∗∗ 4.679∗ 96.76∗∗∗
(2.094) (2.752) (2.070) (1.834) (5.709)Log of Population -1.340∗∗ -0.648 -1.799∗∗∗ -1.950∗∗∗ -1.320∗
(0.470) (0.622) (0.513) (0.403) (0.668)Conflict t-1 -0.895∗∗ -0.565∗
(0.322) (0.229)Dummy coded 1 if country is a MENA country 2.881 9.616∗∗ 2.398 3.317
(2.733) (3.272) (2.739) (2.500)southamerica -2.193 -1.408 -2.380
(2.041) (2.038) (1.974)easterneurope 5.327∗ 5.647∗ 6.410∗∗
(2.649) (2.612) (2.425)eastcentralsouthafrica -28.14∗∗∗ -26.93∗∗∗ -24.44∗∗∗
(2.817) (2.802) (2.826)centralsouthasia -24.72∗∗∗ -24.04∗∗∗ -23.60∗∗∗
(2.236) (2.226) (2.188)eastasia -2.117 -3.647 -3.090
(3.149) (3.159) (2.901)Interaction between mena marker and battle deaths var 1.192
(0.815)Conflict in Neighbourhood -0.226 -0.550 -0.122 -0.0756
(0.227) (0.288) (0.227) (0.113)Fuel Exports -0.0174 -0.00513 -0.0190 -0.00987 0.0337
(0.0291) (0.0386) (0.0288) (0.0283) (0.0277)Log of Battle Deaths t-1 -0.663∗ -1.351∗∗∗
(0.325) (0.321)MenaBdeaths1 5 0.909 1.331∗
(0.813) (0.610)Log of Battle Deaths t-1 X Log of Population 0.384∗∗
(0.147)Fragility -9.916∗∗∗
(2.272)Interaction between fragility var and mena marker -0.832
(9.031)Constant 99.41∗∗∗ 88.46∗∗∗ 103.3∗∗∗ 106.1∗∗∗ 0
(4.571) (5.566) (4.791) (4.302) (0)Observations 334 334 334 342 334Log likelihood -1305.1 -1403.4 -1299.9 -1328.1
χ2 29030.3
Standard errors in parentheses∗ p < 0.05, ∗∗ p < 0.01, ∗∗∗ p < 0.001
82

Background Paper: Consequences of Armed Conflict November 23, 2010
Table A-13: Fixed-Effects Analysis, Parity in Primary School Enrollment, 1970–2005
(1) (2) (3) (4) (5)Conflict Battle Deaths BD*Pop. Fragility PCSE, AR(1)
1975-79 -2.471 -6.780∗ -2.385 -2.630 -1.182(2.720) (3.298) (2.712) (2.502) (0)
1980-84 3.230 0.0214 3.267 3.220 2.758(2.755) (3.352) (2.748) (2.542) .
1985-89 5.393 4.809 5.443 5.187∗ 6.487(2.793) (3.403) (2.787) (2.574) .
1990-94 8.663∗∗ 7.578∗ 8.474∗∗ 8.426∗∗∗ 9.578(2.758) (3.359) (2.751) (2.544) .
1995-99 7.886∗∗ 5.430 7.772∗∗ 7.943∗∗ 10.73(2.738) (3.331) (2.736) (2.490) .
2000-04 11.23∗∗∗ 8.339∗∗ 11.07∗∗∗ 10.78∗∗∗ 13.37(2.654) (3.211) (2.653) (2.435) .
2005-08 12.32∗∗∗ 9.368∗∗ 12.08∗∗∗ 12.03∗∗∗ 14.98(2.656) (3.209) (2.655) (2.443) .
Log of Population -0.763∗ -0.884∗ -0.650 -1.080∗∗∗ -0.873(0.312) (0.373) (0.347) (0.261) (0)
Conflict t-1 -0.182 -0.178(0.227) (0)
Dummy coded 1 if country is a MENA country -6.712∗∗∗ -2.943 -5.656∗∗ -7.081∗∗∗
(1.764) (1.902) (1.809) (1.547)southamerica 3.217∗ 3.253∗ 3.080∗
(1.334) (1.346) (1.252)easterneurope 0.210 0.241 0.996
(1.958) (1.955) (1.753)eastcentralsouthafrica -23.72∗∗∗ -23.73∗∗∗ -20.60∗∗∗
(1.851) (1.852) (1.798)centralsouthasia -7.124∗∗∗ -7.100∗∗∗ -5.059∗∗∗
(1.575) (1.580) (1.496)eastasia -13.12∗∗∗ -12.91∗∗∗ -11.79∗∗∗
(2.054) (2.088) (1.904)Interaction between mena marker and battle deaths var -0.0213
(0.575)Conflict in Neighbourhood -0.109 -0.308 -0.118 -0.0669
(0.150) (0.177) (0.151) (0)Fuel Exports 0.00234 0.0146 0.000906 0.0129 0.00346
(0.0167) (0.0202) (0.0166) (0.0157) .Log of Battle Deaths t-1 -0.135 -0.194
(0.190) (0.186)MenaBdeaths1 5 -0.611 -0.501
(0.453) (0.376)Log of Battle Deaths t-1 X Log of Population -0.00150
(0.0905)Fragility -8.629∗∗∗
(1.417)Interaction between fragility var and mena marker -15.53∗
(6.198)Constant 95.66∗∗∗ 96.77∗∗∗ 94.96∗∗∗ 98.35∗∗∗ 88.54
(3.766) (4.224) (3.947) (3.362) .Observations 583 583 583 600 583Log likelihood -2198.6 -2319.0 -2196.1 -2238.1
χ2 .
Standard errors in parentheses∗ p < 0.05, ∗∗ p < 0.01, ∗∗∗ p < 0.001
83
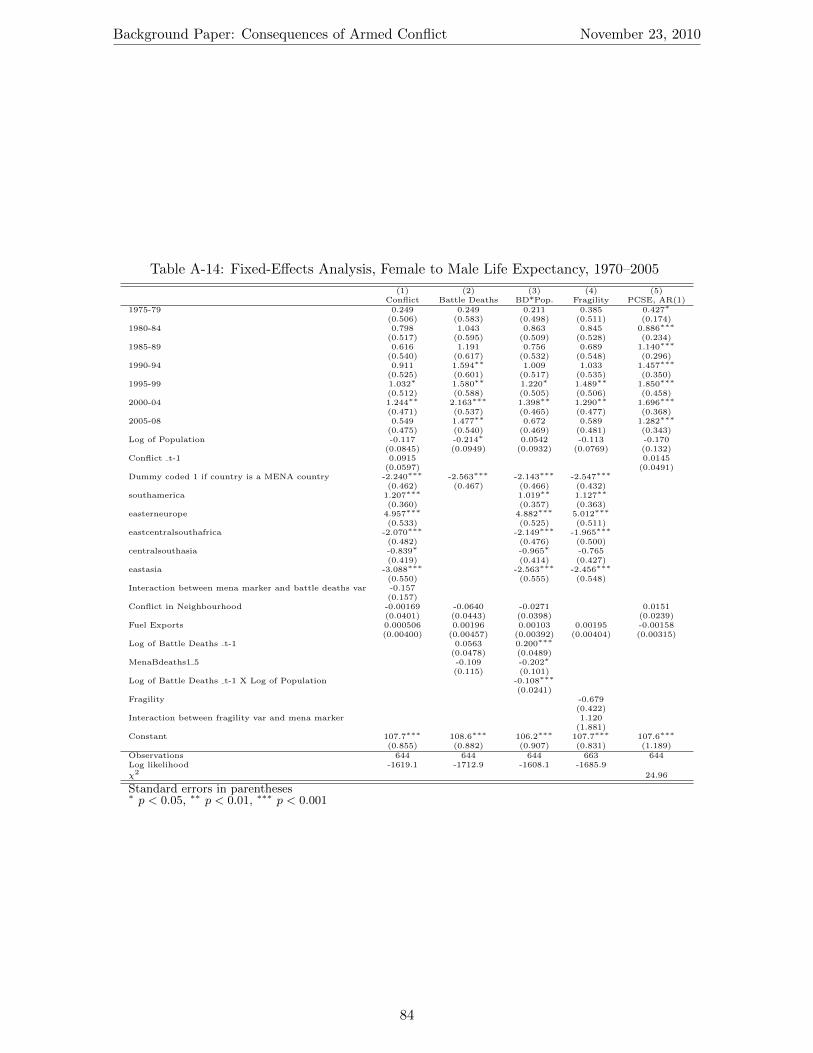
Background Paper: Consequences of Armed Conflict November 23, 2010
Table A-14: Fixed-Effects Analysis, Female to Male Life Expectancy, 1970–2005
(1) (2) (3) (4) (5)Conflict Battle Deaths BD*Pop. Fragility PCSE, AR(1)
1975-79 0.249 0.249 0.211 0.385 0.427∗
(0.506) (0.583) (0.498) (0.511) (0.174)1980-84 0.798 1.043 0.863 0.845 0.886∗∗∗
(0.517) (0.595) (0.509) (0.528) (0.234)1985-89 0.616 1.191 0.756 0.689 1.140∗∗∗
(0.540) (0.617) (0.532) (0.548) (0.296)1990-94 0.911 1.594∗∗ 1.009 1.033 1.457∗∗∗
(0.525) (0.601) (0.517) (0.535) (0.350)1995-99 1.032∗ 1.580∗∗ 1.220∗ 1.489∗∗ 1.850∗∗∗
(0.512) (0.588) (0.505) (0.506) (0.458)2000-04 1.244∗∗ 2.163∗∗∗ 1.398∗∗ 1.290∗∗ 1.696∗∗∗
(0.471) (0.537) (0.465) (0.477) (0.368)2005-08 0.549 1.477∗∗ 0.672 0.589 1.282∗∗∗
(0.475) (0.540) (0.469) (0.481) (0.343)Log of Population -0.117 -0.214∗ 0.0542 -0.113 -0.170
(0.0845) (0.0949) (0.0932) (0.0769) (0.132)Conflict t-1 0.0915 0.0145
(0.0597) (0.0491)Dummy coded 1 if country is a MENA country -2.240∗∗∗ -2.563∗∗∗ -2.143∗∗∗ -2.547∗∗∗
(0.462) (0.467) (0.466) (0.432)southamerica 1.207∗∗∗ 1.019∗∗ 1.127∗∗
(0.360) (0.357) (0.363)easterneurope 4.957∗∗∗ 4.882∗∗∗ 5.012∗∗∗
(0.533) (0.525) (0.511)eastcentralsouthafrica -2.070∗∗∗ -2.149∗∗∗ -1.965∗∗∗
(0.482) (0.476) (0.500)centralsouthasia -0.839∗ -0.965∗ -0.765
(0.419) (0.414) (0.427)eastasia -3.088∗∗∗ -2.563∗∗∗ -2.456∗∗∗
(0.550) (0.555) (0.548)Interaction between mena marker and battle deaths var -0.157
(0.157)Conflict in Neighbourhood -0.00169 -0.0640 -0.0271 0.0151
(0.0401) (0.0443) (0.0398) (0.0239)Fuel Exports 0.000506 0.00196 0.00103 0.00195 -0.00158
(0.00400) (0.00457) (0.00392) (0.00404) (0.00315)Log of Battle Deaths t-1 0.0563 0.200∗∗∗
(0.0478) (0.0489)MenaBdeaths1 5 -0.109 -0.202∗
(0.115) (0.101)Log of Battle Deaths t-1 X Log of Population -0.108∗∗∗
(0.0241)Fragility -0.679
(0.422)Interaction between fragility var and mena marker 1.120
(1.881)Constant 107.7∗∗∗ 108.6∗∗∗ 106.2∗∗∗ 107.7∗∗∗ 107.6∗∗∗
(0.855) (0.882) (0.907) (0.831) (1.189)Observations 644 644 644 663 644Log likelihood -1619.1 -1712.9 -1608.1 -1685.9
χ2 24.96
Standard errors in parentheses∗ p < 0.05, ∗∗ p < 0.01, ∗∗∗ p < 0.001
84

Background Paper: Consequences of Armed Conflict November 23, 2010
Table A-15: Effect of Conflict on Riots, 1960–2006
(1) (2) (3) (4)riots riots riots riots
td85 0.175 0.216 0.230 -0.0427(0.426) (0.412) (0.431) (0.137)
td90 -0.361 -0.240 -0.275 -0.0106(0.455) (0.441) (0.457) (0.141)
td95 -1.351∗ -1.206∗ -1.194∗ -0.108(0.546) (0.534) (0.538) (0.142)
td00 -1.525∗ -1.479∗ -1.355∗ -0.222(0.673) (0.578) (0.674) (0.142)
logged total population 0.220 0.367∗∗ 0.214(0.143) (0.115) (0.144)
conflict 1 0.933∗∗ 1.078∗∗∗ 0.144(0.309) (0.252) (0.103)
neiconf 5 1 0.105 0.105 0.123(0.0618) (0.0543) (0.0642)
gross nat. product per capita 0.314 0.269(0.194) (0.196)
Fuel Exports -0.0116∗∗ -0.0104∗∗ -0.0102∗
(0.00442) (0.00381) (0.00450)td05 -0.0112 -0.112
(0.512) (0.167)bd 1 0.200∗∗
(0.0612)Constant -11.45∗∗ -5.477∗∗∗ -10.57∗∗ 0.273∗∗∗
(4.007) (1.002) (4.030) (0.0703)
Observations 395 522 395 857
Standard errors in parentheses∗ p < 0.05, ∗∗ p < 0.01, ∗∗∗ p < 0.001
85

Background Paper: Consequences of Armed Conflict November 23, 2010
Table A-16: Effect of Conflict on Political Terror Scale, 1970–2005
(1)Conflict with lags
logged total population 0.389∗∗∗
(0.104)lgdpcp -0.788∗∗∗
(0.123)conflict 1 0.0164
(0.531)conflict 2 0.157
(0.502)conflict 3 0.305
(0.470)conflict 4 0.816
(0.460)conflict 5 0.792
(0.417)regime type from MIRPS dataset -2.945∗∗∗
(0.825)cut1 -5.497∗∗∗
(1.651)cut2 -2.739
(1.618)cut3 0.358
(1.646)cut4 2.251
(1.708)
Observations 302
Standard errors in parentheses∗ p < 0.05, ∗∗ p < 0.01, ∗∗∗ p < 0.001
86

Background Paper: Consequences of Armed Conflict November 23, 2010
A.6 Economic Growth
In Figure A-2, the Y-axis is percentage growth from one year to the next, and the three lines
represent the average for each category. These categories remain fixed, so that no country can
go from one category to the next. What the figure tells us is in fact consistent with Section 4.
The post-conflict countries do grow much faster than other regimes in the early 1990s, but not
later. Beside that, there are no other differences. In Section 4 we posit that countries in a state
of conflict grow on average slower than peaceful countries, and that post-conflict countries
outgrow all other categories. The post-conflict categories are only recently post-conflict in the
earliest part of the period, while the conflict category is a mix of pre-conflict, conflict, and
post-conflict regimes, since all we know about these countries is that they experience conflict
at some stage during the 1990–2008 period.
Figure A-2: GDP Growth, MENA Countries Only, 1990–2008
87
Background Paper: Consequences of Armed Conflict November 23, 2010
References
Acemoglu, Daren, James A. Robinson and Thierry Verdier. 2004. “Kleptocracy and Divideand Rule: a Model of Personal Rule.” Journal of European Economic Association 2(2-3).
Arendt, Hannah. 1970. On Violence. New York: Harvest Books.
Ayubi, Nazih N. 1995. Over-stating the Arab State. New York: I. B. Tauris.
Banks, Arthur S. 1979. Cross-National Time-Series Data Archive. User’s Manual, RevisedEdition. Binghamton, NY: State University of New York.
Barnett, Michael N. 1992. Confronting the Cost of War’. Princeton: Princeton UniverstiyPress.
Barro, Robert J. 1997. Determinants of Economic Growth. A Cross-Country Empirical Study.Cambridge, MA.: Boston, MA: The MIT Press.
Buhaug, Halvard, Kristen Ringdal, Albert Simkus and Ola Listhaug. 2008. Ethnic Polarizationand Post-Conflict Animosity: The Case of Macedonia. In presented at American PoliticalScience Association, Boston, MA, 28–31 August.
Burnside, Craig and David Dollar. 2000. “Aid, policies, and growth.” American EconomicReview 90(4):847–868.
Butler, Christopher and Scott Gates. 2009. “Asymmentry, Parity, and (Civil) War: CanInternational Theories of Power Help Us Understand Civil War?” International Interactions35:330–340.
Caprioli, Mary. 2000. “Gendered Conflict.” Journal of Peace Research 37:51–68.
Caprioli, Mary and Mark A Boyer. 2001. “Gender, Violence, and International Crisis.”Journalof Conflict Resolution 45:503 —-518.
Carey, John. 2009. Legislative Voting and Accountability. Cambridge: Cambridge UniversityPress.
Carey, Sabine C. 2007. “Rebellion in Africa: Disaggregating the Effect of Political Regimes.”Journal of Peace Research 44(1):47 – 64.
Collier, Paul and Anke Hoeffler. 1998. “On the Economic Causes of Civil War.” OxfordEconomic Papers 50(4):563–573.
Collier, Paul, Lani Elliot, Havard Hegre, Anke Hoeffler, Marta Reynal-Querol and NicholasSambanis. 2003. Breaking the Conflict Trap. Civil War and Development Policy. Oxford:Oxford University Press.
Crow, Ralph E. 1962. “Religious Secterianism in the Lebanese Political System.” Journal ofPolitics 24:489–520.
Davenport, Christian. 2007a. “State Repression and Political Order.” Annual Review of Po-litical Science 10:1–23.
Davenport, Christian. 2007b. State Repression and the Domestic Democratic Peace. Cam-bridge: Cambridge University Press.
88
Background Paper: Consequences of Armed Conflict November 23, 2010
Degomme, Olivier and Debarati Guha-Sapir. 2010. “Patterns of Mortality rates in DarfurConflict.” The Lancet 375:294–300.
Eckstein, Harry. 1973. “Authority Patterns: A Structural Pattern for Inquiry.” AmericanPolitical Science Review 67(4):1142–1161.
Fearon, James D. and David D. Laitin. 2003. “Ethnicity, Insurgency, and Civil War.”AmericanPolitical Science Review 97(1):75–90.
Gates, Scott and Anke Hoeffler. 2004. Global aid allocation: Are Nordic donors different?Centre for the Study of African Economies: Working Paper Series.
Gates, Scott, Havard Hegre, Havard Mokleiv Nygard and Havard Strand. 2010. “Consequencesof Armed Conflict.” Background Paper for the 2011 World Development Report.
Gates, Scott, Havard Hegre, Mark P. Jones and Havard Strand. 2006. “Institutional Inconsis-tency and Political Instability: Polity Duration, 1800–2000.” American Journal of PoliticalScience 50(4):893–908.
Ghobarah, Hazam Adam, Paul K. Huth and Paul Russett. 2004. “The Post-War Public HealthEffects of Civil Conflict.” Social Science and Medicine 59:869–884.
Ghobarah, Hazem Adam, Paul K. Huth and Bruce M. Russett. 2003. “Civil Wars Kill andMaim People–Long after the Shooting Stops.”American Political Science Review 97(2):189–202.
Gibney, Mark, Linda Cornett and Reed Wood. 2008. Political Terror Scale 1976-2006.
Gleditsch, Kristian S. and Michael D. Ward. 1999. “A Revised List of Independent Statessince the Congress of Vienna.” International Interactions 25(4):393–413.
Gleditsch, Nils Petter, Peter Wallensteen, Mikael Eriksson, Margareta Sollenberg and HavardStrand. 2002. “Armed Conflict 1946–2001: A New Dataset.” Journal of Peace Research39(5):615–637.
Goldstein, Joshua S. 2001. War and Gender. Cambridge: Cambridge University Press.
Good, David. 1990. Individuals, Interpersonal Relations, and Trust. In Trust: Making andBreaking Cooperative Relations, ed. Diego Gambetta. Lodon: Blackwell pp. 31–48.
Gurr, Ted Robert. 1970. Why Men Rebel. Princeton, NJ: Princeton University Press.
Gurr, Ted Robert. 1974. “Persistence and Change in Political Systems, 1800–1971.” AmericanPolitical Science Review 68(4):1482–1504.
Gurr, Ted Robert. 1988. “War, Revolution, and the Growth of the Coercive State.” Compar-ative Political Studies 21:45–65.
Haggard, Stephan and Beth A. Simmons. 1987. “Theories of International Regimes.” Inter-national Organization 41(3):491–517. file://R:ries
Hegre, Havard. 2001. Trade as a War Deterrent. In National Conference in Political Science.
Hegre, Havard and Nicholas Sambanis. 2006. “Sensitivity Analysis of Empirical Results onCivil War Onset.” Journal of Conflict Resolution 50(4):508–535.
89

Background Paper: Consequences of Armed Conflict November 23, 2010
Hegre, Havard, Tanja Ellingsen, Scott Gates and Nils Petter Gleditsch. 2001. “Toward aDemocratic Civil Peace? Democracy, Political Change, and Civil War, 1816–1992.” Amer-ican Political Science Review 95(1):33–48.
Hibbs, Douglas A. 1973. Mass Political Violence. A Cross-National Causal Analysis. NewYork: Wiley.
Huntington, Samuel P. 1991. The Third Wave: Democratization in the Late Twentieth Cen-tury. Norman, OK and London: University of Oklahoma Press.
Iqbal, Zaryab. 2006. “Health and Human Security: The Public Health Impact of ViolentConflict.” International Studies Quarterly 50:631–649.
Iqbal, Zaryab. 2010. War and the Health of Nations. Stanford, CA: Stanford University Press.
Iqbal, Zaryab and Christopher Zorn. 2010. “Violent Conflict and the Spread of HIV/AIDS.”Journal of Politics 72:149–162.
Isham, Jonathan, Daniel Kaufmann and Lant Pritchett. 1997. “Civil Liberties, Democracy,and the Performance of Government Projects.” World Bank Economic Review 11:219–242.
Kalyvas, Stathis and Laia Balcelles. 2010a. “International System and Technologies of Re-bellion: How the Cold War Shaped Internal Conflict.” Paper Presented to the ”The GlobalCosts of Conflict” Conference, Berlin, February 1–2.
Kalyvas, Stathis N and Laia Balcelles. 2010b. “International System and Technologies ofRebellion: How the End of the Cold War Shaped Internal Conflict.” American PoliticalScience Review 104:415–429.
Khalaf, Samir. 1987. Lebanon’s Predicament. New York: Columbia University Press.
Khosrokhavar, Farhad. 2002. 20 Years of Islamic Revolution. Syracuse University Presschapter Postrevolutionary Iran and the New Social Movements, pp. 3–18.
King, Gary and Christopher Murray. 2001. “Rethinking Human Security.” Political ScienceQuarterly 116:585–610.
King, Gary, Michael Tomz and Jason Wittenberg. 2000. “Making the Most of StatisticalAnalyses: Improving Interpretation and Presentation.” American Journal of Political Sci-ence 44(2):347–361.
Lacina, Bethany and Nils Petter Gleditsch. 2005. “Monitoring Trends in Global Combat: ANew Dataset of Battle Deaths.” European Journal of Population 21(2):145–166.
Lebovic, James H. and Eric Voeten. 2009. “The Cost of Shame: International Organizationsand Foreign Aid in the Punishing of Human Rights Violators.” Journal of Peace Research46:79–97.
Londregan, John B. and Keith T. Poole. 1996. “Does High Income Promote Democracy?”World Politics 49(3):1–30. file://R:s
Luckham, Robin. 2004. “The international community and state reconstruction in war-tornsocieties.” Conflict, Security & Development 4:481–507.
Melander, Erik. 2005a. “Gender Equality and Intrastate Armed Conflict.” International Stud-ies Quarterly 49(4):593–743.
90

Background Paper: Consequences of Armed Conflict November 23, 2010
Melander, Erik. 2005b. “Political Gender Equality and State Human Rights Abuse.” Journalof Peace Research 42(2):149–166.
Montalvo, Jose G. and Marta Reynal-Querol. 2010. “Ethnic polarization and the duration ofcivil wars.” Economics of Governance 11:123–143.
Moore, Will H. 1998. “Dissent and Repression: Substitution Effects in Violent PoliticalConflict Behavior.”. Draft.
Murshed, S. Mansoob and Scott Gates. 2005. “Spatial-Horizontal Inequality and the MaoistInsurgency in Nepal.” Review of Development Economics 9(1):121–134.
Neumayer, Eric and Thomas Plumper. 2006. “The Unequal Burden of War: The Effectof Armed Conflict on the Gender Gap in Life Expectancy.” International Organization60(00):723–754.
North, Douglass C. 1990. Institutions, Institutional Change and Economic Performance.Cambridge: Cambridge University Press.
Organski, A.F.K. and Jacek Kugler. 1980. The War Ledger. Chicago: University of ChicagoPress.
Østby, Gudrun. 2008. “Polarization, Horizontal Inequalities and Violent Civil Conflict.” Jour-nal of Peace Research 45(2):143–162.
Palacio, Ana. 2006. The Way Forward. Human Rights and the World Bank. Technical reportThe World Bank.URL: http://siteresources.worldbank.org/EXTSITETOOLS/Resources/PalacioDevtOutreach.pdf
Przeworski, Adam. 1991. Democracy and the Market: Political and Economic Reforms inEastern Europe and Latin America. Cambridge: Cambridge University Press.
Przeworski, Adam, Michael E. Alvarez, Jose Antonio Cheibub and Fernando Limongi. 2000.Democracy and Development. Political Institutions and Well-Being in the World, 1950–1990. Cambridge: Cambridge University Press.
Rigby, Andrew. 2000. “Lebanon: Prospects for post civil war reconsiliation.” Coventry Uni-versity.
Ross, Michael. 2004. “What Do We Know About Natural Resources and Civil War.” Journalof Peace Research 41(3).
Ross, Michael. 2006. “A Closer Look at Oil, Diamonds and Civil War.” Annual Review ofPolitical Science (9):265–300.
Salem, Paul. 1994. Reflections on Lebanon’s foreign policy. In Peace for Lebanon? From Warto Reconstruction, ed. Deirdre Collings. Lynne Rienner pp. 69–82.
Salibi, Kamal. 1988. A House of Many Mansions: The History of Lebanon Reconsidered.Berkeley, CA: University of California Press.
Sørli, Mirjam E., Nils Petter Gleditsch and Havard Strand. 2005. “Why Is There So MuchConflict in the Middle East.” Journal of Conflict Resolution 49(1):141–165.
Stewart, Frances. 2002. Horizontal Inequalities: A Neglected Dimension of Development.QEH Working Paper 81 Queen Elisabeth House, University of Oxford.
91
Background Paper: Consequences of Armed Conflict November 23, 2010
Strøm, Kaare. 1992. “Democracy as Political Competition.” American Behavioral Scientist35:375–396.
Tukey, J. W. 1977. Exploratory Data Analysis. Reading, MA: Addison-Wesley.
United Nations Development Programme, Regional Bureau for Arab States. 2009. Arab Hu-man Development Report 2009. Challenges to Human Security in the Arab Countries. NewYork: United Nations Development Programme.
Urdal, Henrik. 2005. Defusing the Population Bomb: Is Security a Rationale for Reduc-ing Global Population Growth? Environmental Change and Security Program Report 11Woodrow Wilson International Center for Scholars.
Wickham, Carrie Rosefsky. 2002. Mobilizing Islam. Columbia University Press.
Wilkinson, Steven I. 2004. Votes and Violence: Electoral Competition and Ethnic Riots inIndia. Cambridge University Press.
World Bank. 1978. World Development Report. Washington, DC: The International Bank forReconstruction and Development.
Zahar, Marie-Joelle. 2005. Power Sharing in Lebanon: Foreign Protectors, Domestic Peace,and Democratic Failure. In Sustainable Peace: Power and Democracy after Civil Wars, ed.Donald Rothchild and Philip G. Roeder. Ithaca, NY: Cornell University Press pp. 219–240.
Zakaria, Fareed. 1997. “The Rise of Iliberal Democracy.” Foreign Affairs 76:22–43.
92