Conference panel – Session 98, Defining Data Professionals...
8
Conference panel – Session 98, Defining Data Professionals A Geospatial Industry Perspective on Becoming a Data Professional Dawn J. Wright, Environmental Systems Research Institute (aka Esri), Redlands, CA, [email protected] Summary This panel contribution briefly reviews a perspective on data science from the perspective of both the system and science of geographic information, which are manifested in the GIS, remote sensing, and cartographic industries (aka the geospatial industry). This domain is concerned with the multidimensional structuring and scaling of geospatial data, as well as integrative and innovative approaches to analyzing, modeling, and disseminating geospatial data (both big and small) from selected places on land and at sea. Geographic information science has welcomed strong collaborations among computer scientists, information scientists, and other Earth scientists to solve complex scientific questions, and thus parallels the emergence and acceptance of "data science." As such, there are interesting developments to share in terms of how students are educated, trained and recruited as data professionals within the geospatial industry, including certification and ascribing to codes of ethics. Acknowledgements The author would like to thank the Esri Careers and Esri Experience Teams for their inspiration and contribution. Competing Interests The author declares that she has no competing interest.
Transcript of Conference panel – Session 98, Defining Data Professionals...

Conference panel – Session 98, Defining Data Professionals
A Geospatial Industry Perspective on Becoming a Data Professional Dawn J. Wright, Environmental Systems Research Institute (aka Esri), Redlands, CA, [email protected]
Summary This panel contribution briefly reviews a perspective on data science from the perspective of both the system and science of geographic information, which are manifested in the GIS, remote sensing, and cartographic industries (aka the geospatial industry). This domain is concerned with the multidimensional structuring and scaling of geospatial data, as well as integrative and innovative approaches to analyzing, modeling, and disseminating geospatial data (both big and small) from selected places on land and at sea. Geographic information science has welcomed strong collaborations among computer scientists, information scientists, and other Earth scientists to solve complex scientific questions, and thus parallels the emergence and acceptance of "data science." As such, there are interesting developments to share in terms of how students are educated, trained and recruited as data professionals within the geospatial industry, including certification and ascribing to codes of ethics.
Acknowledgements The author would like to thank the Esri Careers and Esri Experience Teams for their inspiration and contribution.
Competing Interests The author declares that she has no competing interest.

Conference poster – Session 44, Building a disciplinary, world wide data infrastructure
Towards an Organizational Landscape of Worldwide Data Infrastructures Dawn J. Wright, Environmental Systems Research Institute (aka Esri), Redlands, CA,
[email protected] Rowena Davis, The Arizona Geological Survey, Tucson, AZ, [email protected] Lindsay A. Powers, The HDF Group, Boulder, CO, [email protected] Joshua Young, Unidata, UCAR, Boulder, CO, [email protected] EarthCube Liaison Team, [email protected]
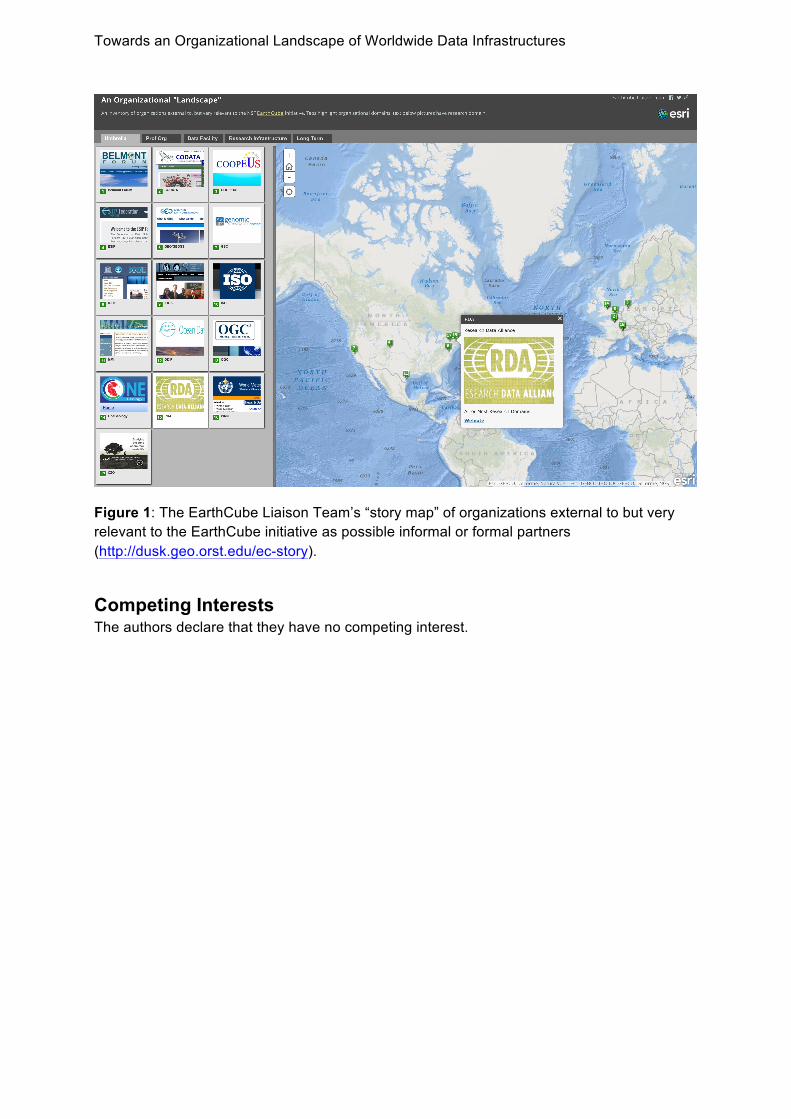
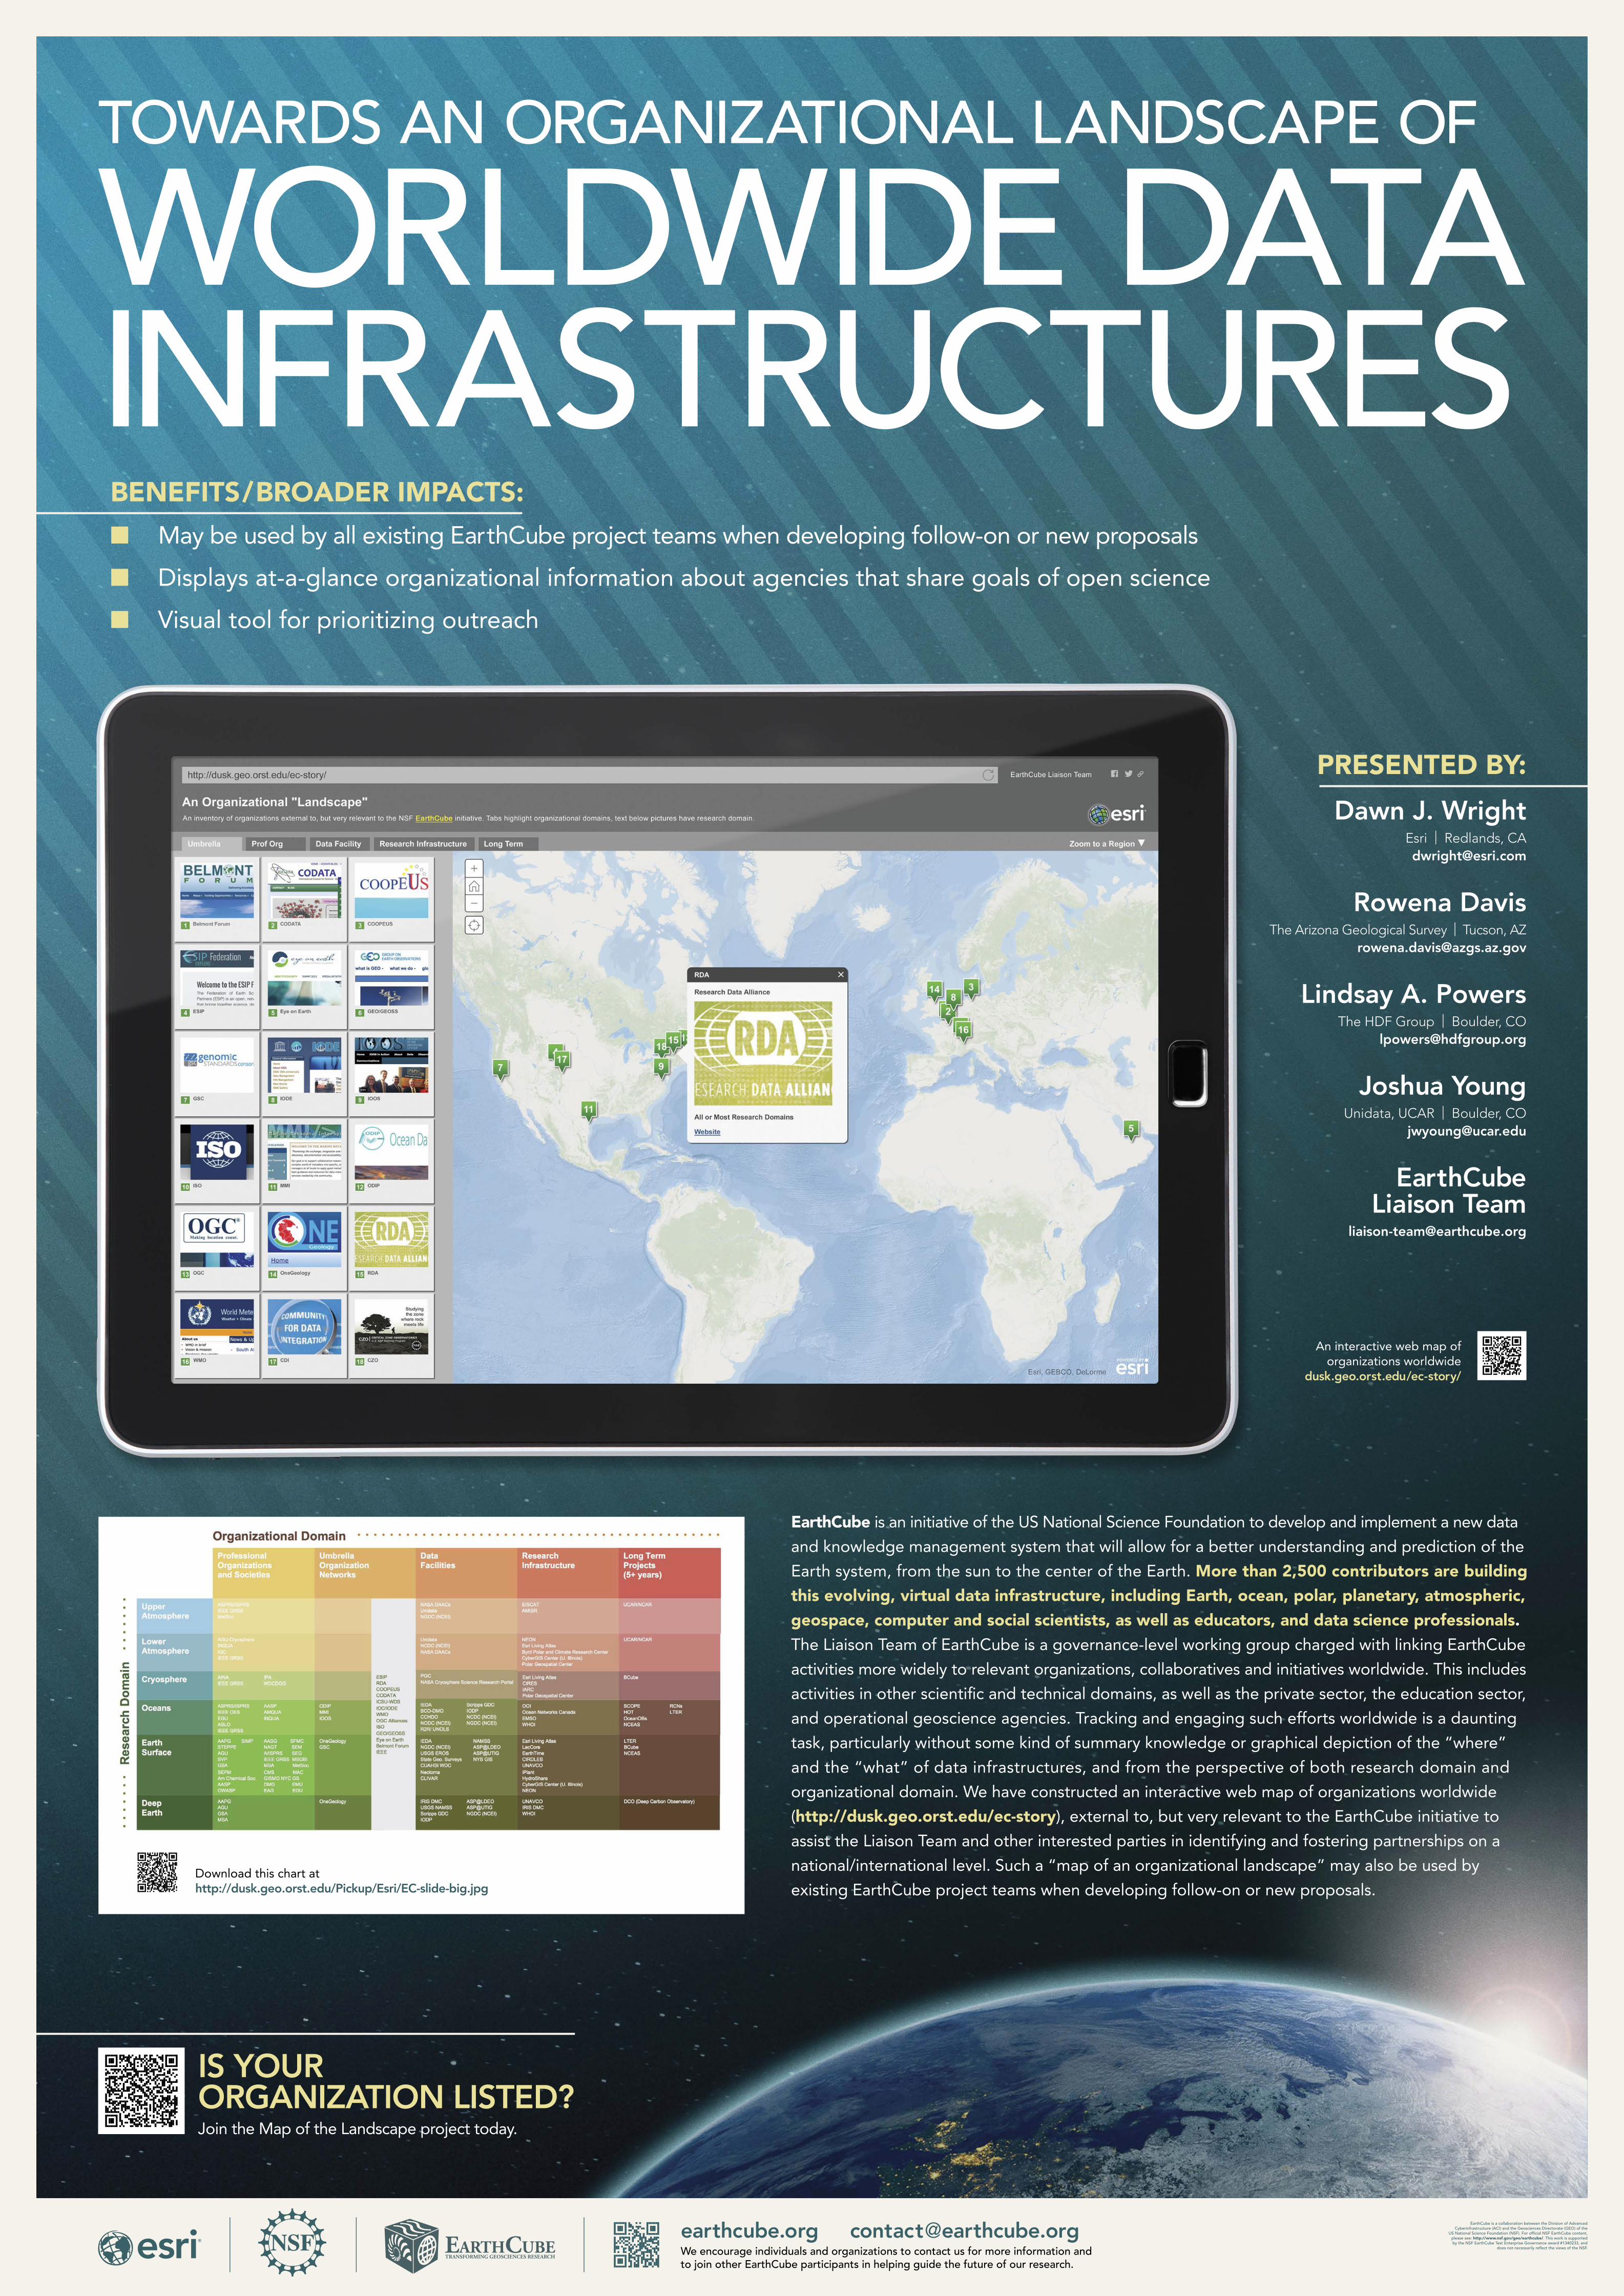
Summary EarthCube is an initiative of the US National Science Foundation to develop and implement a new data and knowledge management system that will allow for a better understanding and prediction of the Earth system, from the sun to the center of the Earth. More than 2,500 contributors are building this evolving, virtual data infrastructure, including Earth, ocean, polar, planetary, atmospheric, geospace, computer and social scientists, as well as educators, and data science professionals. The Liaison Team of EarthCube is a governance-level working group charged with linking EarthCube activities more widely to relevant organizations, collaboratives and initiatives worldwide. This includes activities in other scientific and technical domains, as well as the private sector, the education sector, and operational geoscience agencies. Tracking and engaging such efforts worldwide is a daunting task, particularly without some kind of summary knowledge or graphical depiction of the “where” and the “what” of data infrastructures, and from the perspective of both research domain (i.e., what part of the Earth, ocean, or atmosphere is the focus) and organizational domain (i.e., scholarly society, data facility, long-term funded research project with accompanying infrastructures, etc.). We have constructed an interactive web map of organizations worldwide (http://dusk.geo.orst.edu/ec-story; Figure 1), external to, but very relevant to the EarthCube initiative to assist the Liaison Team and other interested parties in identifying and fostering partnerships on a national/international level. Such a “map of an organizational landscape” may also be used by existing EarthCube project teams when developing follow-on or new proposals.
Towards an Organizational Landscape of Worldwide Data Infrastructures
Figure 1: The EarthCube Liaison Team’s “story map” of organizations external to but very relevant to the EarthCube initiative as possible informal or formal partners (http://dusk.geo.orst.edu/ec-story).
Competing Interests The authors declare that they have no competing interest.
TOWARDS AN ORGANIZATIONAL LANDSCAPE OF
WORLDWIDE DATAINFRASTRUCTURES
PRESENTED BY:
Dawn J. WrightEsri | Redlands, [email protected]
Rowena DavisThe Arizona Geological Survey | Tucson, AZ
Lindsay A. PowersThe HDF Group | Boulder, CO
Joshua YoungUnidata, UCAR | Boulder, CO
EarthCubeLiaison Team
EarthCube is an initiative of the US National Science Foundation to develop and implement a new data
and knowledge management system that will allow for a better understanding and prediction of the
Earth system, from the sun to the center of the Earth. More than 2,500 contributors are building this evolving, virtual data infrastructure, including Earth, ocean, polar, planetary, atmospheric, geospace, computer and social scientists, as well as educators, and data science professionals. The Liaison Team of EarthCube is a governance-level working group charged with linking EarthCube
activities more widely to relevant organizations, collaboratives and initiatives worldwide. This includes
activities in other scientifi c and technical domains, as well as the private sector, the education sector,
and operational geoscience agencies. Tracking and engaging such efforts worldwide is a daunting
task, particularly without some kind of summary knowledge or graphical depiction of the “where”
and the “what” of data infrastructures, and from the perspective of both research domain and
organizational domain. We have constructed an interactive web map of organizations worldwide
(http://dusk.geo.orst.edu/ec-story), external to, but very relevant to the EarthCube initiative to
assist the Liaison Team and other interested parties in identifying and fostering partnerships on a
national/international level. Such a “map of an organizational landscape” may also be used by
existing EarthCube project teams when developing follow-on or new proposals.
BENEFITS/BROADER IMPACTS:
■ May be used by all existing EarthCube project teams when developing follow-on or new proposals
■ Displays at-a-glance organizational information about agencies that share goals of open science
■ Visual tool for prioritizing outreach
earthcube.org [email protected] encourage individuals and organizations to contact us for more information andto join other EarthCube participants in helping guide the future of our research.
EarthCube is a collaboration between the Division of Advanced Cyberinfrastructure (ACI) and the Geosciences Directorate (GEO) of the
US National Science Foundation (NSF). For offi cial NSF EarthCube content, please see: http://www.nsf.gov/geo/earthcube/. This work is supported by the NSF EarthCube Test Enterprise Governance award #1340233, and
does not necessarily refl ect the views of the NSF.
IS YOURORGANIZATION LISTED?Join the Map of the Landscape project today.
An interactive web map oforganizations worldwide
dusk.geo.orst.edu/ec-story/
Download this chart athttp://dusk.geo.orst.edu/Pickup/Esri/EC-slide-big.jpg

Conference poster – Session 32, Enhancing data infrastructure services to sustain Earth Sciences researchers’ needs for a robust science
An EarthCube Perspective on Data Infrastructure Services Dawn J. Wright, Environmental Systems Research Institute (aka Esri), Redlands, CA,
[email protected] Joshua Young, Unidata, UCAR, Boulder, CO, [email protected] Lindsay A. Powers, The HDF Group, Boulder, CO, [email protected] Rowena Davis, The Arizona Geological Survey, Tucson, AZ, [email protected]
Summary EarthCube is an initiative of the US National Science Foundation to develop and implement a new data and knowledge management system that will allow for a better understanding and prediction of the Earth system, from the sun to the center of the Earth. With more than 2,500 EarthCube contributors involved, the strategy of the initiative is to deploy distributed and loosely federated technologies using standard services that will enable remote access, visualization and interoperability of complex distributed resources (Arctur et al 2016; EarthCube Leadership Council 2016). As such, there exist the requisite challenges and barriers in using all available data for proper analysis and interpretation. But as an inherently transdisciplinary, community-led initiative, EarthCube has valuable real-world lessons and questions to contribute to the session including: (1) how best to develop strategies for sustained and adaptive determination of requirements to ensure that architectures, tools and services are responsive to evolving science needs (e.g., the catalog of use cases of Stocks et al. 2015 in climatology, aeolian processes, four-dimensional visualization, chemical properties of surface and groundwater, land use monitoring, deformation of active volcanoes and more); (2) how best to provide guidance to stakeholders on potential support modes for sustainment of EarthCube products and services (e.g., EarthCube Leadership Council 2016); and (3) examples frameworks and communication strategies to manage and maintain formal and informal relationships with collaborators, both internal and external to the EarthCube ecosystem (e.g., the use case of EarthCube's Community Inventory of EarthCube Resources for Geosciences Interoperability or CINERGI with its cross-disciplinary catalog of existing databases, services and data portals; Zaslavsky and CINERGI 2016).
Competing Interests The authors declare that they have no competing interests.
Reference Arctur D, Barrett J, Pearlman J, Powers L, Richard S, Tricomi M and Zaslavsky I. EarthCube Architecture Workshop 2016: Final Report and Recommendations. Tucson, AZ: EarthCube Project Office. Available at http://bit.ly/29qifw1 [Last accessed 10 July 2016].

An EarthCube Perspective on Data Infrastructure Services
EarthCube Leadership Council 2016 EarthCube Strategic Vision: Data-Enabled Transformation of Geosciences. Tucson, AZ: EarthCube Project Office. Available at http://earthcube.org/documents [Last accessed 27 May 2016].
Stocks K, Kempler L, Kinkade, D, and Virapongse A 2015 Use Case Library for EarthCube. Available at http://bit.ly/29BrHeT [Last accessed 10 July 2016].
Zaslavsky I and EarthCube CINERGI Team 2016 CINERGI: Community Inventory of EarthCube Resources for Geoscience Interoperability. http://earthcube.org/group/cinergi [Last accessed 10 July 2016].
Conference paper – Session 74, Mapping Population Distribution and Human Settlements: Pushing Boundaries and Expanding Applications
Mapping Population Distributions for GIS Users Charlie Frye*, Environmental Systems Research Institute (aka Esri), Redlands, CA, [email protected] Earl Nordstrand, Environmental Systems Research Institute (aka Esri), Redlands, CA,
[email protected] Dawn J. Wright, Environmental Systems Research Institute (aka Esri), Redlands, CA,
[email protected] Jeanne Foust, Environmental Systems Research Institute (aka Esri), Redlands, CA, [email protected] Carmelle Terborgh, Environmental Systems Research Institute (aka Esri), Redlands, CA,
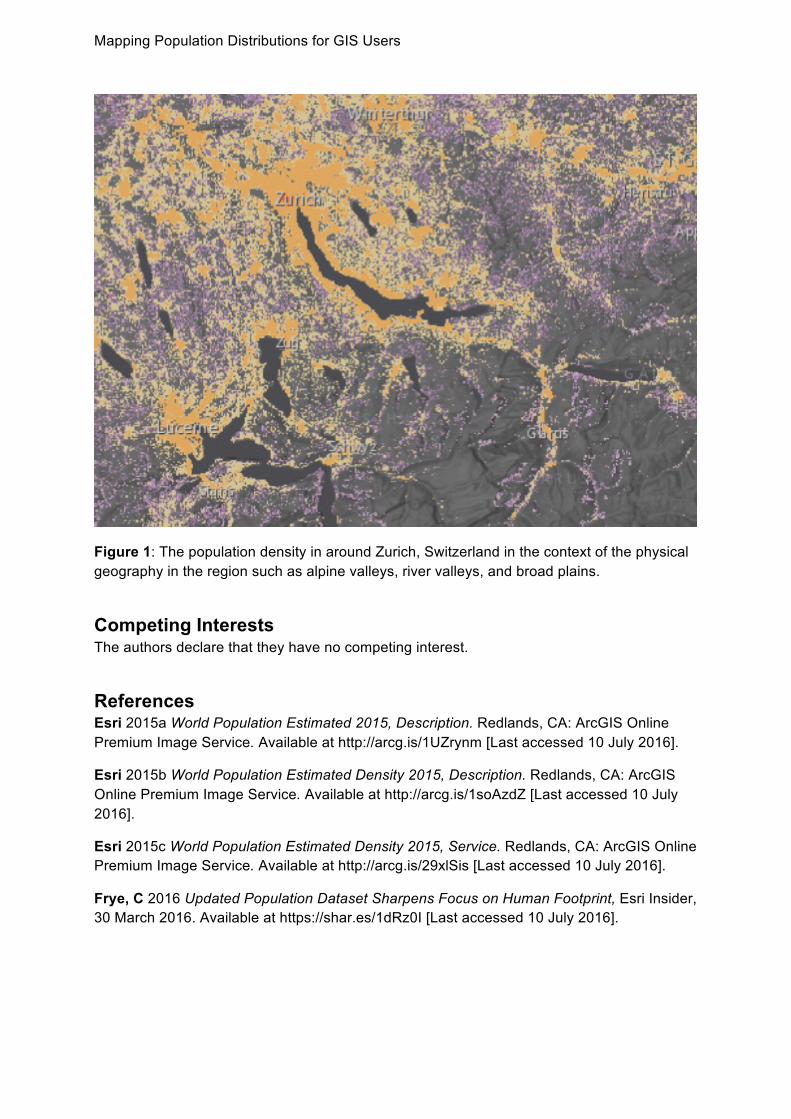
Summary Accurate, up-to-date maps and geo-referenced data of human population distribution are essential for meeting United Nations’ Sustainable Development Goals progress measures, and for real-time crisis mapping and response. To aid in these efforts, Esri has produced the World Population Estimate (WPE), an annually modelled dasymetric raster surface with an estimated count of people living within the area represented by each raster cell. An estimate of the footprint of where people live, in the form of a dasymetric probability surface, is the basis for the WPE. Overlaying polygons representing data from census areas or surveyed political units onto the footprint produces the distribution of the population. Esri uses the WPE to geo-reference estimates of demographic and economic information from micro to macro scale for determinations of societal characteristics and behaviours anywhere in the world. The latest edition of the WPE (Esri 2015a, 2015b; Frye 2016) derives statistical texture from 15-m-resolution Landsat 8 imagery to indicate the probability of human settlement. Other data such as road intersections, classified land cover data indicating built up areas or agriculture, and extreme climates increase the certainty of some locations while eliminating others, and census data are used, where available, to further calibrate the estimate. In some cases, census data also indicate where people do not live, including locations of airports, industrial complexes, and the like. The WPE includes a confidence surface, and a derived population density surface using units of persons per sq km to give demographers and statisticians a familiar benchmark. GIS users also can transform the density layer into other projected coordinate systems with minimal loss of data because the units are independent of the varying area of raster cells. A major result of this research is depicted in Figure 1 and can be further explored interactivealy via Esri (2015c).
Mapping Population Distributions for GIS Users
Figure 1: The population density in around Zurich, Switzerland in the context of the physical geography in the region such as alpine valleys, river valleys, and broad plains.
Competing Interests The authors declare that they have no competing interest.
References Esri 2015a World Population Estimated 2015, Description. Redlands, CA: ArcGIS Online Premium Image Service. Available at http://arcg.is/1UZrynm [Last accessed 10 July 2016].
Esri 2015b World Population Estimated Density 2015, Description. Redlands, CA: ArcGIS Online Premium Image Service. Available at http://arcg.is/1soAzdZ [Last accessed 10 July 2016].
Esri 2015c World Population Estimated Density 2015, Service. Redlands, CA: ArcGIS Online Premium Image Service. Available at http://arcg.is/29xlSis [Last accessed 10 July 2016].
Frye, C 2016 Updated Population Dataset Sharpens Focus on Human Footprint, Esri Insider, 30 March 2016. Available at https://shar.es/1dRz0I [Last accessed 10 July 2016].


![[XLS] · Web view118 118 45 45 88 118 118 128 128 128 128 98 98 12 12 12 98 98 98 88 98 58 128 128 98 98 98 98 98 98 98 98 12 12 98 98 98 98 12 98 98 98 58 12 98 98 98 98 98 98 98](https://static.fdocuments.us/doc/165x107/5b1aab787f8b9a1e258df5af/xls-web-view118-118-45-45-88-118-118-128-128-128-128-98-98-12-12-12-98-98.jpg)