COMPUTER PERIPHERALS - Kean
36
CHAPTER 10 COMPUTER PERIPHERALS Thomas Sperling. Adapted, courtesy of David Ahl, Creative Computing.
Transcript of COMPUTER PERIPHERALS - Kean
CHAPTER 10
COMPUTER PERIPHERALS
Thomas Sperling. Adapted, courtesy of David Ahl, Creative Computing.
10.0 INTRODUCTIONThe typical personal computer system described in an advertisement consists of aCPU, memory, a DVD or CD read-write drive, a hard disk drive, a keyboard, amouse, wireless and wired network interfaces, USB ports, sound and video systemcomponents, usually a modem, perhaps parallel, FireWire, and serial ports, and amonitor. Additional available components include scanners of various types, printers,plotters, TV tuners, floppy disk drives, and tape drives. Internal to the computer thereis also a power supply that converts wall plug power into voltages suitable for poweringa computer. All the items mentioned, except for the CPU, memory, and power supply,are considered peripheral (that is, external) to the main processing function of thecomputer itself and are known, therefore, as peripherals. Some of the peripherals usethe USB, parallel, and serial ports as their interconnection point to the computer.Others have their own interface to internal system buses that interconnect variousparts of the computer.
The peripherals in a large server or mainframe computer are similar, exceptlarger, with more capacity. Large numbers of hard disk drives may be grouped intoarrays to provide capacities of tens or hundreds of terabytes (TB). One or morehigh-speed network interfaces will be a major component. The capability for handlinglarge amounts of I/O will likely be a requirement. Means of implementing large-scale,reliable backup will be necessary. Conversely, fancy displays, high-end graphics andaudio cards, and other multimedia facilities may be totally unneeded.
Despite different packaging and differences in details, the basic operations ofthese devices are similar, regardless of the type of computer. In previous chapters wehave already looked at the I/O operations that control devices that are external to theCPU. Now we direct our attention to the operation of the devices themselves. In thischapter we study the most important computer peripheral devices. We look at theusage, important characteristics, basic physical layouts, and internal operations of eachdevice. We will also briefly consider the interface characteristics for these devices.
Peripheral devices are classified as input devices, output devices, or storage devices.As you would expect, input data is data from the outside world into the CPU, andoutput data is data moving from the CPU out to the outside world. Storage devices are,of course, both input and output devices, though not at the same time. If you recallthe concept of input process-output from Chapter 1, programs require input, processit, and then produce output. Using a storage device, data output is stored, to be usedas input at a future time. In a transaction processing system, for example, the databasefiles are stored on line. When a transaction occurs, the transaction processing programwill use input from the new transaction together with data from the database to updatethe appropriate database records as output. The updated database remains in storagefor the next transaction.
Because of the importance of storage, we will begin with a discussion of storagedevices. Following that, we will consider various input and output devices.
307

308 PART THREE COMPUTER ARCHITECTURE AND HARDWARE OPERATION
It should be noted that the technologies used for many peripheral components are verysophisticated; some would even say that these devices operate by magic! You may agreewhen you see the descriptions of some components. It is not uncommon to have moresophisticated control and technology in a peripheral component than in the computer itself.Perhaps you have wondered how these devices work. Here’s your opportunity to find out!
We have not attempted to provide a detailed explanation of every possible peripheraldevice in a computer system. Instead, we have selected several interesting devices that arerepresentative of a number of technologies.
At the completion of this chapter, you will have been exposed to every importanthardware component of the computer system, with the exception of the pieces that tiethe components of the computer systems together, and furthermore extend the systemsthemselves together into networks. You will have seen the role and the inner workings of eachcomponent that we have discussed, and you will have seen how the different componentsfit together to form a complete computer system. You will have a better understanding ofhow to select particular components to satisfy specific system requirements and of how todetermine device capacities and capabilities.
10.1 THE HIERARCHY OF STORAGEComputer storage is often conceptualized hierarchically, based upon the speed with whichdata can be accessed. The table in Figure 10.1 shows this hierarchy, together with sometypical access times.
At the top of the hierarchy are the CPU registers used to hold data for the short termwhile processing is taking place. Access to registers is essentially instantaneous, since theregisters are actually a part of the CPU. Cache memory, if present, is the fastest memoryoutside the CPU. You recall from Chapter 8 that cache memory is a small fast memorythat is used to hold current data and instructions. The CPU will always attempt to accesscurrent instructions and data in cache memory before it looks at conventional memory.There may be as many as three different levels of cache. The CPU accesses the data orinstruction in conventional memory if cache memory is not present. Next in the hierarchyis conventional memory. Both conventional and cache memory are referred to as primary
FIGURE 10.1
The Storage Hierarchy
CPU registers
Device Typical access times
Cache memory (SRAM)
Conventional memory (DRAM)
Flash memory
Increasingstoragecapacity
Magnetic disk drive
Optical disk drive
Magnetic tape
0.25 nsec
1-10 nsec
10-50 nsec
120 �sec
10-50 msec
100-500 msec
0.5 and up sec
Increasingaccesstimes
CHAPTER 10 COMPUTER PERIPHERALS 309
memory. Both provide immediate access to program instructions and data by the CPUand can be used for the execution of programs. The data throughput rate of memory isdetermined primarily by the capability of the bus and interfaces that connect memory tothe CPU. Rates well in excess of 1 GB/sec are common in modern computers.
Below the level of conventional memory, storage in the hierarchy is not immediatelyavailable to the CPU, is referred to as secondary storage, and is treated as I/O. Data andprograms in secondary storage must be copied to primary memory for CPU access.1 Exceptfor flash memory, access to secondary storage is significantly slower than primary storage.Disks and other secondary storage devices are mechanical in nature, and mechanical devicesare of necessity slower than devices that are purely electronic. The location of the desireddata is usually not immediately accessible, and the medium must be physically moved toprovide access to the correct location. This requires a seek time, the time needed to find thedesired location. Once the correct data is located, it must be moved into primary memoryfor use. The throughput rate in Figure 10.1 indicates the speed with which the transfer ofdata between memory and the I/O device can take place. Most of the access time specified forsecondary storage devices consists of seek time. As a result of this access time, even the fastestdisks are only about one-millionth as fast as the slowest memory. It should be apparent thata lot of CPU instructions can be performed while waiting for a disk transfer to take place.
One important advantage of secondary storage, of course, is its permanence, or lack ofvolatility. As noted in Chapter 7, RAM data is lost when the power is shut off. Flash memoryuses a special type of transistor that can hold data indefinitely without power. The magneticmedia used for disk and tape and the optical media used for DVD and CD disks also retaindata indefinitely. Secondary storage has the additional advantage that it may be used to storemassive amounts of data. Even though RAM is relatively inexpensive, disk and tape storageis much cheaper yet. Large amounts of online secondary storage may be provided at lowcost. Current hard disks store data at a density of nearly 40 Gbits per square centimeter!
Tape, most flash memory devices, optical disks, and many magnetic disks are designedfor easy removal from the computer system, which makes them well suited for backup andfor off-line storage of data that can be loaded when the data is needed. This provides theadditional advantage that secondary storage may be used for offline archiving, for movingdata easily from machine to machine, and for offline backup storage. For example, a flashmemory card may be used to store digital camera photographs until they are moved to acomputer for long term storage; similarly, a removable hard disk can be used to move largeamounts of data between computers.
As an increasingly common alternative, data and programs may be stored on asecondary storage device connected to a different computer and accessed through anetwork connection between the computers. In this context, the computer with secondarystorage is sometimes known as a server or a file server. In fact, the primary purpose ofthe server may be to act as a storage provider for all the computers on the network. Webservices are a common application of this type. Optical disks require little space and can
1In the earliest days of computing, secondary storage devices, particularly rotating drums (forerunner of thedisk), were actually used as memory with direct access to the CPU. To run efficiently, programs had to be designedto minimize the number of rotations of the drum, which meant that the programmer would always attempt tohave the next required location be just ahead of where the drum head was at that instant. Those were interestingdays for programmers!
310 PART THREE COMPUTER ARCHITECTURE AND HARDWARE OPERATION
store large amounts of data for archiving and installation purposes, with rapid mountingfor retrieval when required. A few high-capacity optical disks could store all the medicalrecords and history for a large insurance company, for example. Most modern programsare supplied on DVD or CD-ROM.
Of the various secondary storage components, flash memory and disk devices are thefastest, since data can be accessed randomly. In fact, IBM refers to disks as direct accessstorage devices (DASDs). With tape, it may be necessary to search sequentially through aportion of the tape to find the desired data. Also, the disk rotates continuously, while thetape will have to start and stop, and possibly even reverse direction and rewind to findthe desired data. These factors mean that tape is inherently slower unless the data is to beread sequentially. This makes tape suitable only for large-scale offsite backup storage wherethe entire contents of a disk are transferred to tape to protect the data from a potentialcatastrophe or to meet legal long term data retention requirements. Although magnetictape storage had large inherent cost and storage capacity advantages in the past, that is nolonger the case, and the use of tape is decreasing as businesses replace their equipment withnewer technology.
10.2 SOLID STATE MEMORYFlash memory is nonvolatile electronic integrated circuit memory, similar conceptually tothe read-only memory discussed in Chapter 7, but different in technology. The differencemakes flash memory suitable for use in situations where traditional ROM would beimpractical. Whereas traditional ROM must be read, erased, and written in large blocksof addresses, it is possible to read individual bytes or small blocks of flash memory whennecessary. This makes flash memory useful for applications that require random access,particularly those applications where most accesses are reads.
Although read accesses and certain simple overwrite accesses are relatively fast, flashmemory must be erased in blocks, so that most write accesses require an additional stepthat rewrites the unchanged data back to the block. Furthermore, the erase-and-rewriteoperation is very slow compared to the read access. Although there is research into othertypes of nonvolatile memory that might solve this problem, flash memory is generallyconsidered to be impractical as a replacement for conventional RAM, at least for now.
Because of its small size, flash memory is frequently the secondary storage of choicefor the memory cards that plug into portable devices such as cell phones, portable musicplayers, and digital cameras. It is also well suited for small, portable ‘‘thumb drives’’ thatplug directly into a USB port. These drives are useful for moving files and data from onemachine to another and also serve as an inexpensive and convenient backup medium.
Flash memory is more expensive than disk storage at this writing. However, its capacityis rapidly increasing and its price falling. As a result, large capacity flash memory unitscalled ‘‘solid-state drives’’ have appeared on the market and are starting to supplant diskdrives as the long-term storage device of choice in computers where less weight, lowpower consumption, and small size are important. ‘‘Solid-state drives’’ have the additionaladvantages of being relatively immune to failure due to physical shock and vibration (sincethey have no moving parts), and generate little heat and no noise. Solid-state drives have notyet reached the huge storage capacities of large disk drives, but their capacity is continuallyexpanding, and is already adequate for many applications.
CHAPTER 10 COMPUTER PERIPHERALS 311
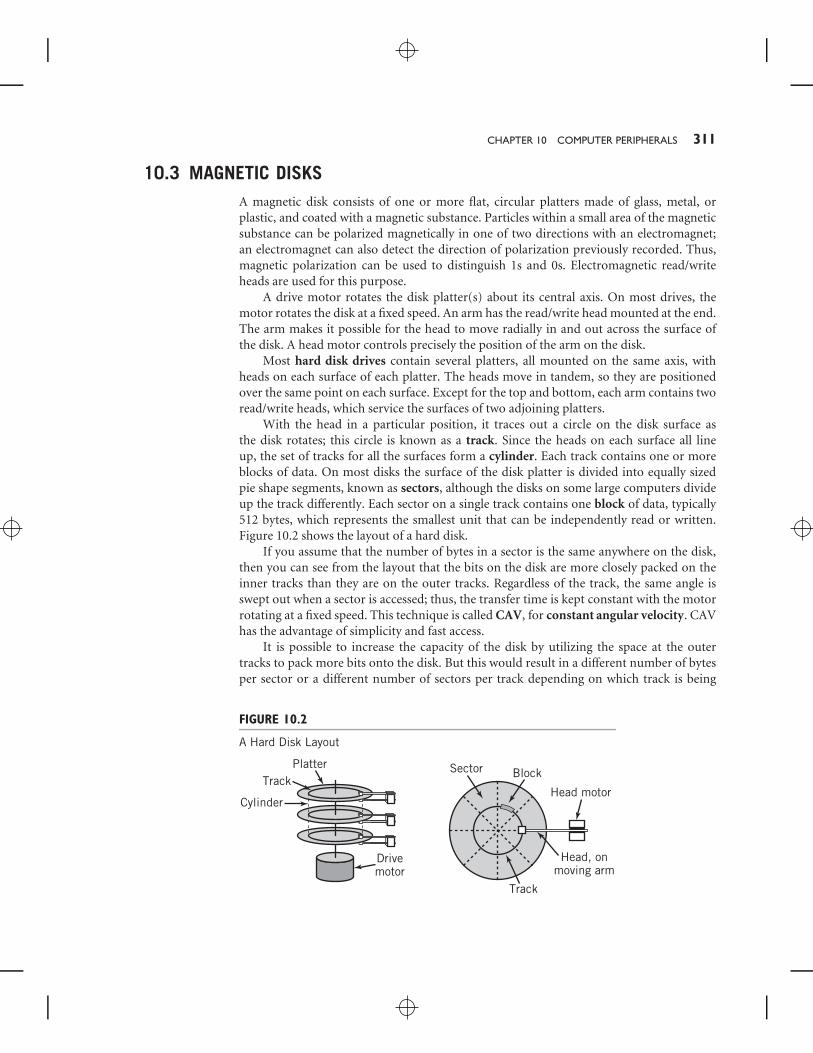
10.3 MAGNETIC DISKSA magnetic disk consists of one or more flat, circular platters made of glass, metal, orplastic, and coated with a magnetic substance. Particles within a small area of the magneticsubstance can be polarized magnetically in one of two directions with an electromagnet;an electromagnet can also detect the direction of polarization previously recorded. Thus,magnetic polarization can be used to distinguish 1s and 0s. Electromagnetic read/writeheads are used for this purpose.
A drive motor rotates the disk platter(s) about its central axis. On most drives, themotor rotates the disk at a fixed speed. An arm has the read/write head mounted at the end.The arm makes it possible for the head to move radially in and out across the surface ofthe disk. A head motor controls precisely the position of the arm on the disk.
Most hard disk drives contain several platters, all mounted on the same axis, withheads on each surface of each platter. The heads move in tandem, so they are positionedover the same point on each surface. Except for the top and bottom, each arm contains tworead/write heads, which service the surfaces of two adjoining platters.
With the head in a particular position, it traces out a circle on the disk surface asthe disk rotates; this circle is known as a track. Since the heads on each surface all lineup, the set of tracks for all the surfaces form a cylinder. Each track contains one or moreblocks of data. On most disks the surface of the disk platter is divided into equally sizedpie shape segments, known as sectors, although the disks on some large computers divideup the track differently. Each sector on a single track contains one block of data, typically512 bytes, which represents the smallest unit that can be independently read or written.Figure 10.2 shows the layout of a hard disk.
If you assume that the number of bytes in a sector is the same anywhere on the disk,then you can see from the layout that the bits on the disk are more closely packed on theinner tracks than they are on the outer tracks. Regardless of the track, the same angle isswept out when a sector is accessed; thus, the transfer time is kept constant with the motorrotating at a fixed speed. This technique is called CAV, for constant angular velocity. CAVhas the advantage of simplicity and fast access.
It is possible to increase the capacity of the disk by utilizing the space at the outertracks to pack more bits onto the disk. But this would result in a different number of bytesper sector or a different number of sectors per track depending on which track is being
FIGURE 10.2
A Hard Disk Layout
PlatterTrack
BlockSector
Head motor
Head, onmoving arm
Track
Cylinder
Drivemotor

312 PART THREE COMPUTER ARCHITECTURE AND HARDWARE OPERATION
accessed. This would make it more difficult to locate the required sector. Notice, too, thatwith a constant speed motor, the time to move the head over a pie-shaped sector at theedge is the same as that near the center. If there were more bits packed into the outertracks, the data would be transferred faster at the edge than at the center. Since the diskcontroller is designed to expect data at a constant speed, it would seem to be necessaryto design the motor so that it would slow down when the head was accessing the outertracks to keep the data transfer speed constant. In this case, the motor speed would beadjusted such that the speed along the track would be constant regardless of the position ofthe head. This approach is called CLV, for constant linear velocity. The capacity of a CLVdisk with the same diameter and bit density is approximately double that of an equivalentCAV disk. Although CLV technology is commonly used with CDs and DVDs, the designmakes it more difficult to access individual blocks of data rapidly, so it is rarely usedfor hard disks.
As a compromise, modern disk drives divide the disk into a number of zones, typicallysixteen. This approach is shown in Figure 10.3. The cylinders in different zones have adifferent number of sectors but the number of sectors within a particular zone is constant.
FIGURE 10.3
Multiple-Zone Disk Configuration
Zone 1
Zone 2
Zone 3
Zone 4
Sectors
CHAPTER 10 COMPUTER PERIPHERALS 313
Obviously, the largest number of sectors will be in the zone containing the outermostcylinders, Instead of adjusting the motor speed, the disk controller buffers the data rate sothat the data rate to the I/O interface is constant, despite the variable data rate betweenthe controller and the disk. Different vendors call this technique multiple zone recording,zone bit recording (ZBR), or zone-CAV recording (Z-CAV).
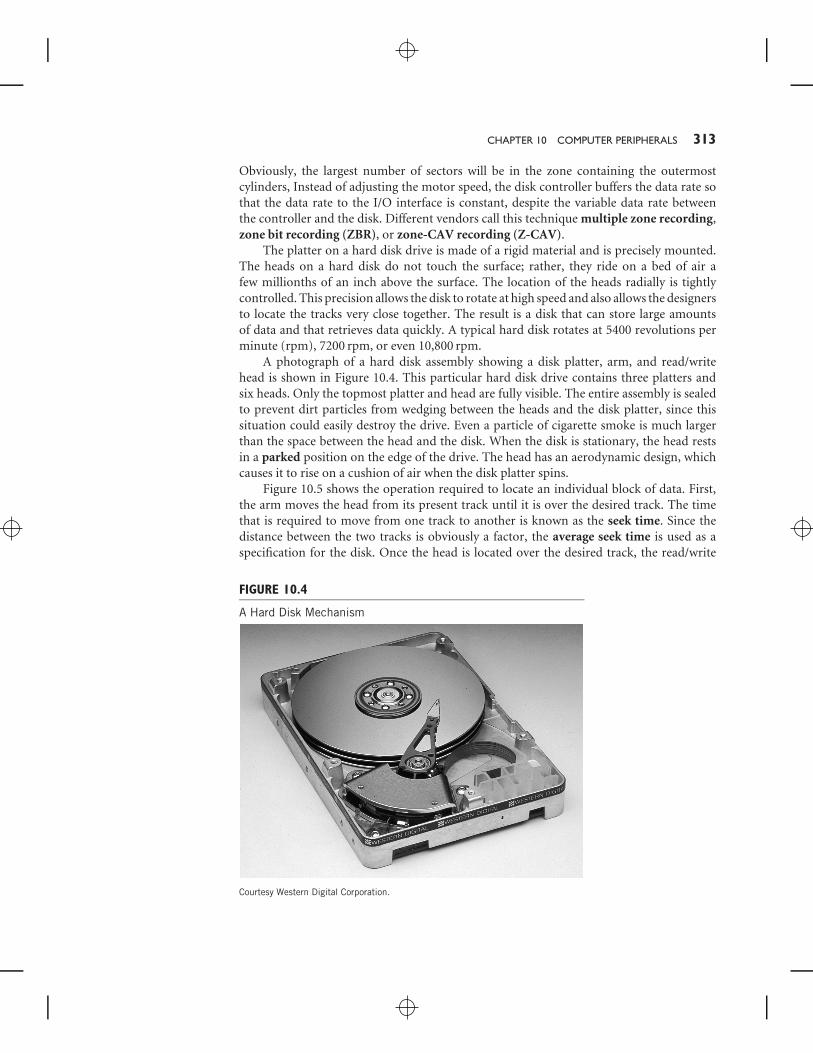
The platter on a hard disk drive is made of a rigid material and is precisely mounted.The heads on a hard disk do not touch the surface; rather, they ride on a bed of air afew millionths of an inch above the surface. The location of the heads radially is tightlycontrolled. This precision allows the disk to rotate at high speed and also allows the designersto locate the tracks very close together. The result is a disk that can store large amountsof data and that retrieves data quickly. A typical hard disk rotates at 5400 revolutions perminute (rpm), 7200 rpm, or even 10,800 rpm.
A photograph of a hard disk assembly showing a disk platter, arm, and read/writehead is shown in Figure 10.4. This particular hard disk drive contains three platters andsix heads. Only the topmost platter and head are fully visible. The entire assembly is sealedto prevent dirt particles from wedging between the heads and the disk platter, since thissituation could easily destroy the drive. Even a particle of cigarette smoke is much largerthan the space between the head and the disk. When the disk is stationary, the head restsin a parked position on the edge of the drive. The head has an aerodynamic design, whichcauses it to rise on a cushion of air when the disk platter spins.
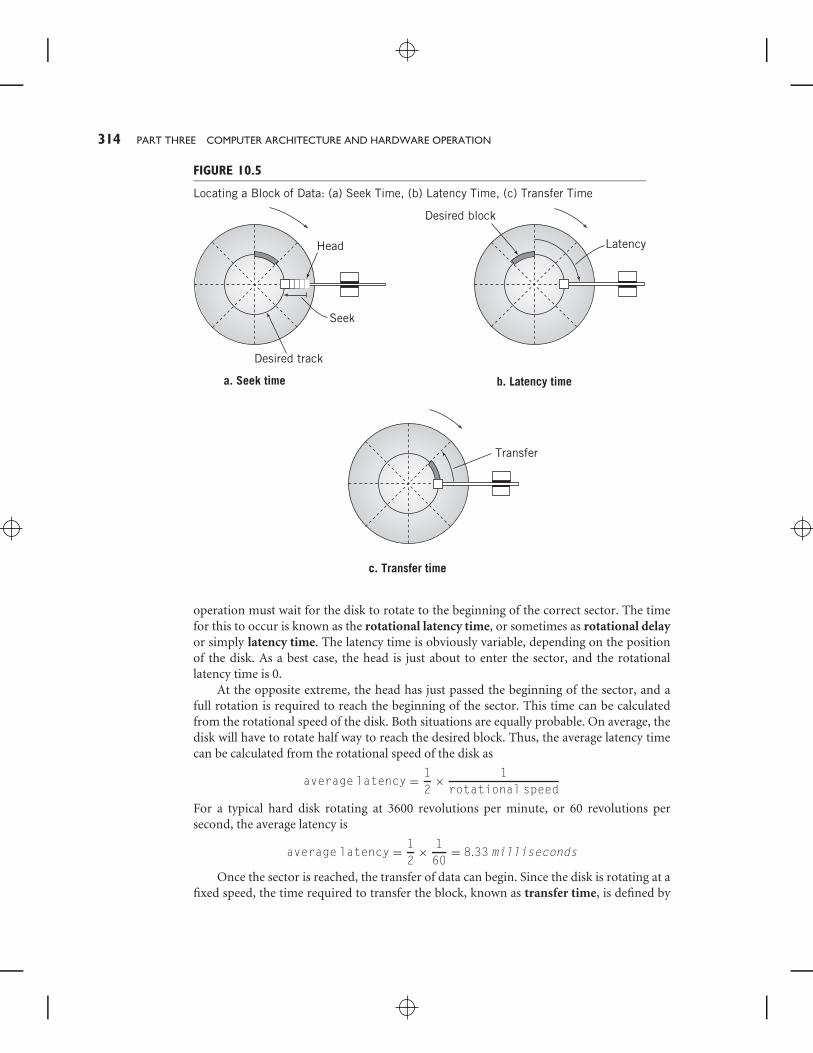
Figure 10.5 shows the operation required to locate an individual block of data. First,the arm moves the head from its present track until it is over the desired track. The timethat is required to move from one track to another is known as the seek time. Since thedistance between the two tracks is obviously a factor, the average seek time is used as aspecification for the disk. Once the head is located over the desired track, the read/write
FIGURE 10.4
A Hard Disk Mechanism
Courtesy Western Digital Corporation.
314 PART THREE COMPUTER ARCHITECTURE AND HARDWARE OPERATION
FIGURE 10.5
Locating a Block of Data: (a) Seek Time, (b) Latency Time, (c) Transfer Time
Head
Seek
a. Seek time
Desired track
Latency
b. Latency time
Desired block
Transfer
c. Transfer time
operation must wait for the disk to rotate to the beginning of the correct sector. The timefor this to occur is known as the rotational latency time, or sometimes as rotational delayor simply latency time. The latency time is obviously variable, depending on the positionof the disk. As a best case, the head is just about to enter the sector, and the rotationallatency time is 0.
At the opposite extreme, the head has just passed the beginning of the sector, and afull rotation is required to reach the beginning of the sector. This time can be calculatedfrom the rotational speed of the disk. Both situations are equally probable. On average, thedisk will have to rotate half way to reach the desired block. Thus, the average latency timecan be calculated from the rotational speed of the disk as
average latency = 12
× 1rotational speed
For a typical hard disk rotating at 3600 revolutions per minute, or 60 revolutions persecond, the average latency is
average latency = 12
× 160
= 8.33 milliseconds
Once the sector is reached, the transfer of data can begin. Since the disk is rotating at afixed speed, the time required to transfer the block, known as transfer time, is defined by
CHAPTER 10 COMPUTER PERIPHERALS 315
the number of sectors on a track, since this establishes the percentage of the track that isused by a single data block. The transfer time is defined by
transfer time = 1number of sectors × rotational speed
If the hard drive in the example contains 30 sectors per track, the transfer time for a singleblock would be
transfer time = 130× 60
= 0.55 milliseconds
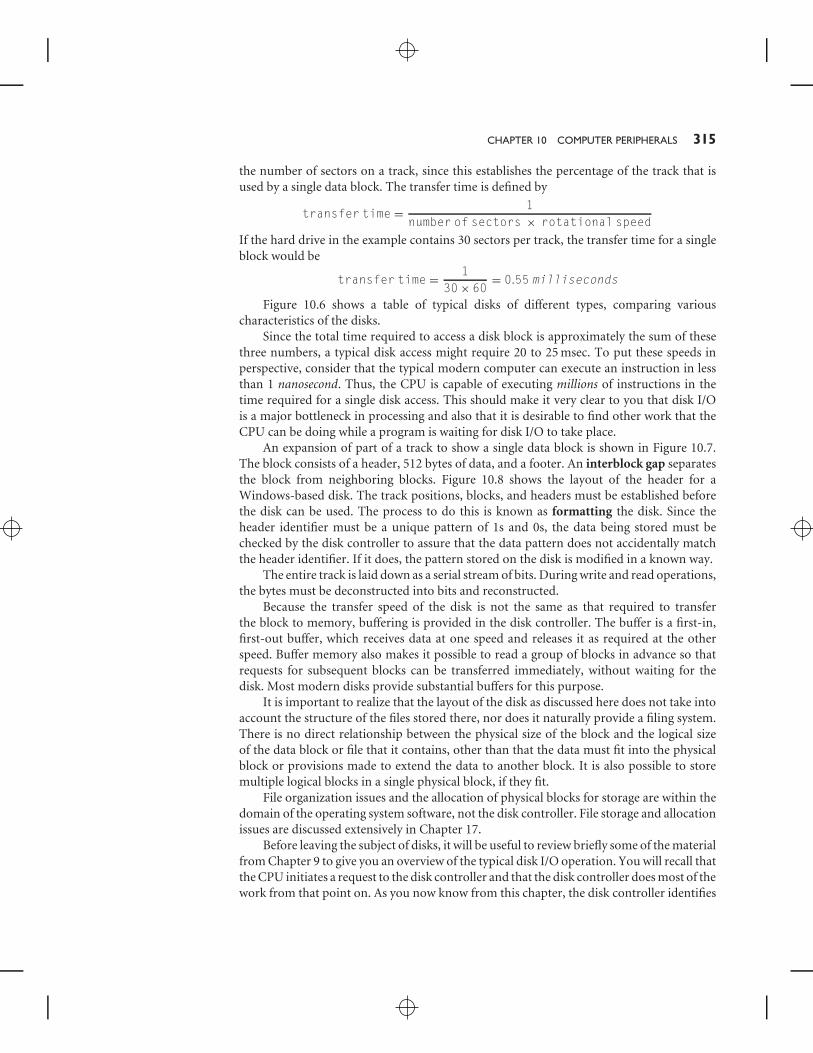
Figure 10.6 shows a table of typical disks of different types, comparing variouscharacteristics of the disks.
Since the total time required to access a disk block is approximately the sum of thesethree numbers, a typical disk access might require 20 to 25 msec. To put these speeds inperspective, consider that the typical modern computer can execute an instruction in lessthan 1 nanosecond. Thus, the CPU is capable of executing millions of instructions in thetime required for a single disk access. This should make it very clear to you that disk I/Ois a major bottleneck in processing and also that it is desirable to find other work that theCPU can be doing while a program is waiting for disk I/O to take place.
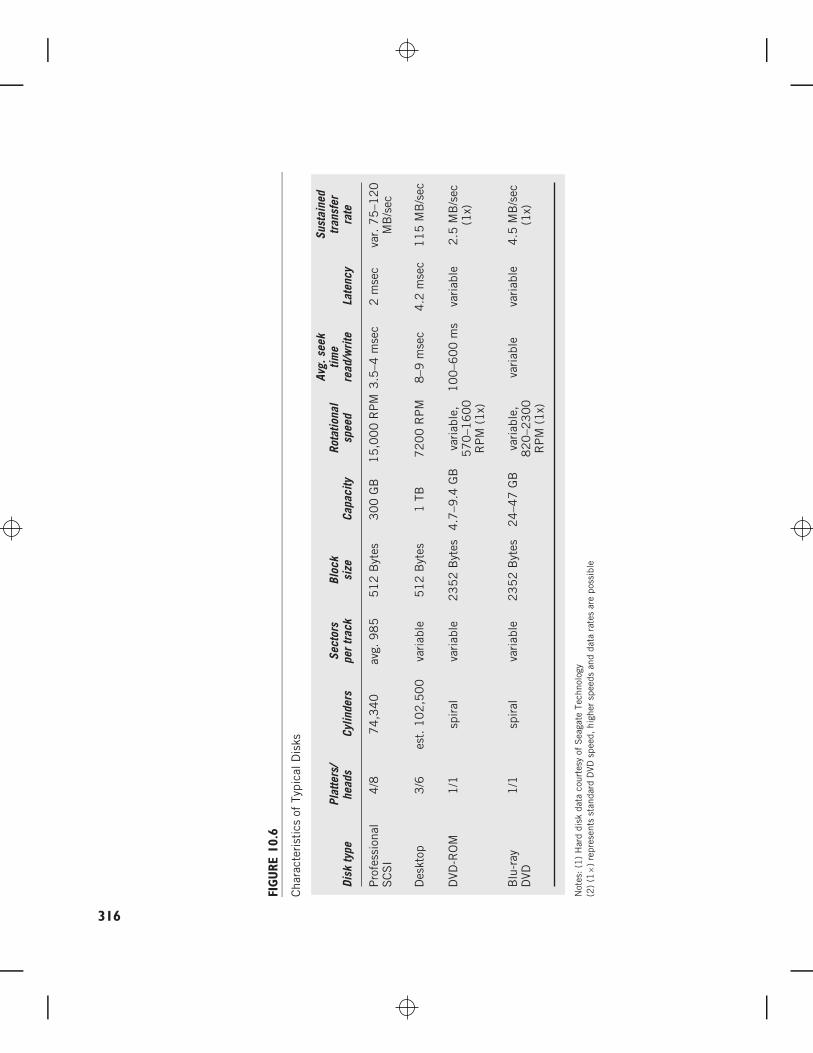
An expansion of part of a track to show a single data block is shown in Figure 10.7.The block consists of a header, 512 bytes of data, and a footer. An interblock gap separatesthe block from neighboring blocks. Figure 10.8 shows the layout of the header for aWindows-based disk. The track positions, blocks, and headers must be established beforethe disk can be used. The process to do this is known as formatting the disk. Since theheader identifier must be a unique pattern of 1s and 0s, the data being stored must bechecked by the disk controller to assure that the data pattern does not accidentally matchthe header identifier. If it does, the pattern stored on the disk is modified in a known way.
The entire track is laid down as a serial stream of bits. During write and read operations,the bytes must be deconstructed into bits and reconstructed.
Because the transfer speed of the disk is not the same as that required to transferthe block to memory, buffering is provided in the disk controller. The buffer is a first-in,first-out buffer, which receives data at one speed and releases it as required at the otherspeed. Buffer memory also makes it possible to read a group of blocks in advance so thatrequests for subsequent blocks can be transferred immediately, without waiting for thedisk. Most modern disks provide substantial buffers for this purpose.
It is important to realize that the layout of the disk as discussed here does not take intoaccount the structure of the files stored there, nor does it naturally provide a filing system.There is no direct relationship between the physical size of the block and the logical sizeof the data block or file that it contains, other than that the data must fit into the physicalblock or provisions made to extend the data to another block. It is also possible to storemultiple logical blocks in a single physical block, if they fit.
File organization issues and the allocation of physical blocks for storage are within thedomain of the operating system software, not the disk controller. File storage and allocationissues are discussed extensively in Chapter 17.
Before leaving the subject of disks, it will be useful to review briefly some of the materialfrom Chapter 9 to give you an overview of the typical disk I/O operation. You will recall thatthe CPU initiates a request to the disk controller and that the disk controller does most of thework from that point on. As you now know from this chapter, the disk controller identifies
FIGURE
10.6
Cha
ract
eris
tics
ofTy
pica
lDis
ks
Disk
type
Plat
ters
/he
ads
Cylin
ders
Sect
ors
per
trac
kBl
ock
size
Pro
fess
iona
lS
CS
I1
5,0
00
RP
M4
/87
4,3
40
avg.
98
55
12
Byt
es3
.5–4
mse
c2
mse
cva
r. 7
5–1
20
M
B/s
ec3
00
GB
Des
ktop
72
00
RP
M3
/6es
t. 1
02
,50
0va
riab
le5
12
Byt
es8
–9 m
sec
4.2
mse
c1
15
MB
/sec
1 T
B
DVD
-RO
Mva
riab
le,
57
0–1
60
0R
PM
(1
x)
1/1
spir
alva
riab
le2
35
2 B
ytes
10
0–6
00
ms
vari
able
2.5
MB
/sec
(1x)
4.7
–9.4
GB
Blu
-ray
DVD
1/1
spir
alva
riab
le2
35
2 B
ytes
vari
able
,8
20
–23
00
RP
M (
1x)
vari
able
vari
able
4.5
MB
/sec
(1x)
24
–47
GB
Capa
city
Rota
tiona
lsp
eed
Late
ncy
Avg.
see
ktim
ere
ad/w
rite
Sust
aine
dtr
ansf
erra
te
Not
es:
(1)
Har
ddi
skda
taco
urte
syof
Sea
gate
Tech
nolo
gy(2
)(1
×)re
pres
ents
stan
dard
DVD
spee
d,hi
gher
spee
dsan
dda
tara
tes
are
poss
ible
316
CHAPTER 10 COMPUTER PERIPHERALS 317
FIGURE 10.7
A Single Data Block
Gap GapByte Byte
HeaderData . . . 1 0 1 0 1 1 1 1 0 0 1 0 1 1 1 0 . . .
FIGURE 10.8
Header for Windows Disk
Header
Sync
Mark
ID data
Error
dete
ction Gap
Sync
Mark
Data
the disk block to be located, moves the head tothe correct track, then reads the track data untilit encounters the header for the correct block.Assuming that it is performing a read, it thentransfers the data from the disk to a buffer. Fromthe buffer, the data is transferred to conventionalmemory using DMA. Once the DMA transfer iscomplete, the disk controller notifies the CPUwith a completion interrupt.
Disk Arrays
In larger computer environments, with mainframe computers or large PCs that provideprogram and data storage facilities for a network, it is common to group multiple diskstogether. Such a grouping of two or more disk drives is called a disk array or a drive array.A disk array can be used to reduce overall data access time by sharing the data amongmultiple disks and also to increase system reliability by providing storage redundancy.The assumption made is that the number of blocks to be manipulated at a given time islarge enough and important enough to justify the additional effort and additional spacerequirements. One useful type of disk array is known as RAID, which stands for Redun-dant Array of Inexpensive Disks. (Some people say ‘‘Redundant Array of IndependentDisks’’).
There are two standard methods of implementing a disk array. One is known as amirrored array, and the other as a striped array.
A mirrored array consists of two or more disk drives. In a mirrored array, each diskstores exactly the same data. During reads, alternate blocks of the data are read fromdifferent drives, then combined to reassemble the original data. Thus, the access time fora multiblock read is reduced approximately by a factor equal to the number of disk drivesin the array. If a read failure occurs in one of the drives, the data can be read from anotherdrive and the bad block marked to prevent future use of that block, increasing systemreliability. In critical applications, the data can be read from two, or even three, drivesand compared to increase reliability still further. When three drives are used, errors thatare not detected by normal read failures can be found using a method known as majoritylogic. This technique is particularly suitable for highly reliable computer systems knownas fault-tolerant computers. If the data from all three disks is identical, then it is safe toassume that the integrity of the data is acceptable. If the data from one disk differs from theother two, then the majority data is used, and the third disk is flagged as an error.
318 PART THREE COMPUTER ARCHITECTURE AND HARDWARE OPERATION
The striped array uses a slightly different approach. In a striped array, a file segmentto be stored is divided into blocks. Different blocks are then written simultaneously todifferent disks. This effectively multiplies the throughput rate by the number of data disksin the array. A striped array requires a minimum of three disk drives; in the simplestconfiguration, one disk drive is reserved for error checking. As the write operation is takingplace, the system creates a block of parity words from each group of data blocks and storesthat on the reserved disk. During read operations, the parity data is used to check theoriginal data.
There are five well-defined RAID standards, labeled RAID 1 through RAID 5, and anumber of additional proprietary and nonstandard varieties, including one labeled RAID 0.The most common of these are RAID 0, RAID 1, and RAID 5.
RAID 1 is a mirrored array as described above. RAID 1 provides protection by storingeverything at least twice, but offers a substantial performance gain, particularly under heavydata read usage. RAIDs 2, 3, and 4 are arrays that are striped in different ways. Each uses aseparate disk for error checking. Since data on every disk must be checked, this can createa roadblock on the single disk that is used for error checking. RAID 5 eases the roadblockby spreading the error-checking blocks over all of the disks.
RAID 0 is not a true RAID, because it provides no redundancy and no inherent errorchecking. Data is striped across all of the disks, primarily for fast access. However, the lackof redundancy means that a failure of any single disk block in the array corrupts all ofthe data in the system. However, this shortcoming can be overcome with proper backupand with certain types of journaling file systems, which we will discuss in Chapter 17. Itis also possible to ‘‘nest’’ RAIDs. For example, we can use a pair of RAID 0 groups insideRAID 1 to achieve mirrored redundancy. The combination is known as RAID 0+1. Withor without the additional protection, RAID 0 is sometimes attractive as a low-cost methodof achieving high data transfer rates when they are required.
A number of vendors provide RAID controller hardware. particularly for large RAID 5systems. With RAID controller hardware, RAID processing takes place within the arraycontroller. The array appears as a single large disk drive to the computer. It is also possibleto create a RAID using conventional, off-the-shelf disk controllers and operating systemsoftware. Although this uses CPU processing time, modern computers have enough sparepower to make this a practical solution in many instances. It also reduces the possibilitythat a single RAID controller can cause the entire array to fail.
10.4 OPTICAL DISK STORAGEAn alternative to magnetic disk storage is optical storage. Optical storage technologiesinclude various types of CDs and DVDs, in read-only, write-once, and read/write forms.Optical disks are portable and are capable of packing a relatively large amount of data intoa convenient package. For example, an inexpensive CD-ROM, 12 centimeters in diameter,stores approximately 650 MB, while a Blu-Ray DVD of the same physical size can holdmore than 50 GB of data. (There is also a standard for a new optical disk, called HVD,for Holographic Disk, that, when fully developed, is expected to hold more than 1.6 TB,but presently the cost is too high for most uses.) Optical storage serves a different purposefrom magnetic disk storage. While magnetic disk storage serves primarily to store, read,and write data for current use, optical storage is intended more for offsite archiving, as well

CHAPTER 10 COMPUTER PERIPHERALS 319
FIGURE 10.9
Layout of a CD-ROM versus aStandard Disk
Block
Block
Block
Min 58sec 20
sector 09 block
Min 02sec 38
sector 66 block
Sector
Standarddisk
Track
as program and file distribution, although the latter use has declinedsomewhat due to the growth of the World Wide Web.
CDs and DVDs used for data storage use the same basic disk formatas their audio and video equivalents. Within certain file structurelimitations, personal computer CD and DVD drives can read andwrite audio and video CDs and DVDs that will play on home mediaequipment and vice versa.
Conceptually, CD-ROM data storage is similar to magnetic disk:data is stored in blocks on the disk. The blocks can be arranged infiles, with a directory structure similar to that of magnetic disks. Thetechnical details are very different, however. Figure 10.9 compares thelayout of a CD-ROM to that of a sectored magnetic disk. Rather thanconcentric tracks, data on a CD-ROM is stored on a single track,approximately three miles long, which spirals from the inside of thedisk to the outside. Instead of sectors, the data is stored in linear blocksalong the track. It should be remembered that the CD design wasoriginally intended primarily for audio applications, where most dataaccess is sequential, from the start of a musical selection to its finish;thus, a single spiral track was a reasonable decision.
Since the CD format was designed for maximum capacity, thedecision was made to pack the bits on the disk as tightly as possible bymaking each block the same length along the spiral track, regardlessof location on the disk. Thus, the disk is read at a constant linearvelocity (i.e., CLV), using a variable speed motor to keep the transfer
rate constant. Since the angle of a block is smaller on the outer tracks, the disk moves moreslowly when outside tracks are being read. This is easily observable if you have access to aportable CD player that allows you to observe the disk as it rotates.
A CD-ROM typically stores 270,000 blocks of data. Each block is 2352 bytes long andholds 2048 bytes of data. In addition, there is a 16-byte header, which provides 12 bytesto locate the start of a block and 4 bytes for block identification. Due to the difficulty ofthe manufacturing process, errors can occur, so the CD-ROM provides extensive meansfor correcting the errors. Therefore, each block also provides 288 bytes of an advancedform of parity known as cross-interleaved Reed-Solomon error correcting code. This coderepairs not only isolated errors but also groups of errors that might result from a scratchor imperfection on the disk. The resulting total data capacity of a single CD-ROM isapproximately 550 MB. The error correction is occasionally omitted for applications whereerrors can be tolerated, such as audio, which increases the capacity of a CD-ROM toabout 630 MB.
Blocks on a CD-ROM are identified by a 4-byte identification code that was inheritedfrom the audio origins of the medium. Three bytes, stored in binary-coded decimal (BCD)format, identify the block by minute, second, and sector. There are 75 sectors per secondand 60 seconds per minute. Normally, there are 60 minutes, although this number canbe increased to 70 minutes if necessary. This increases the disk capacity to about 315,000blocks. The fourth byte identifies a mode of operation. Mode 1, the normal data mode,provides the data as we’ve described, with error correction. Mode 2 increases the capacityby eliminating the error correction. Other modes are provided for special audio and video
320 PART THREE COMPUTER ARCHITECTURE AND HARDWARE OPERATION
features. It is possible to mix data, audio, and video on the same disk. Data blocks onCD-ROMs are sometimes called large frames.
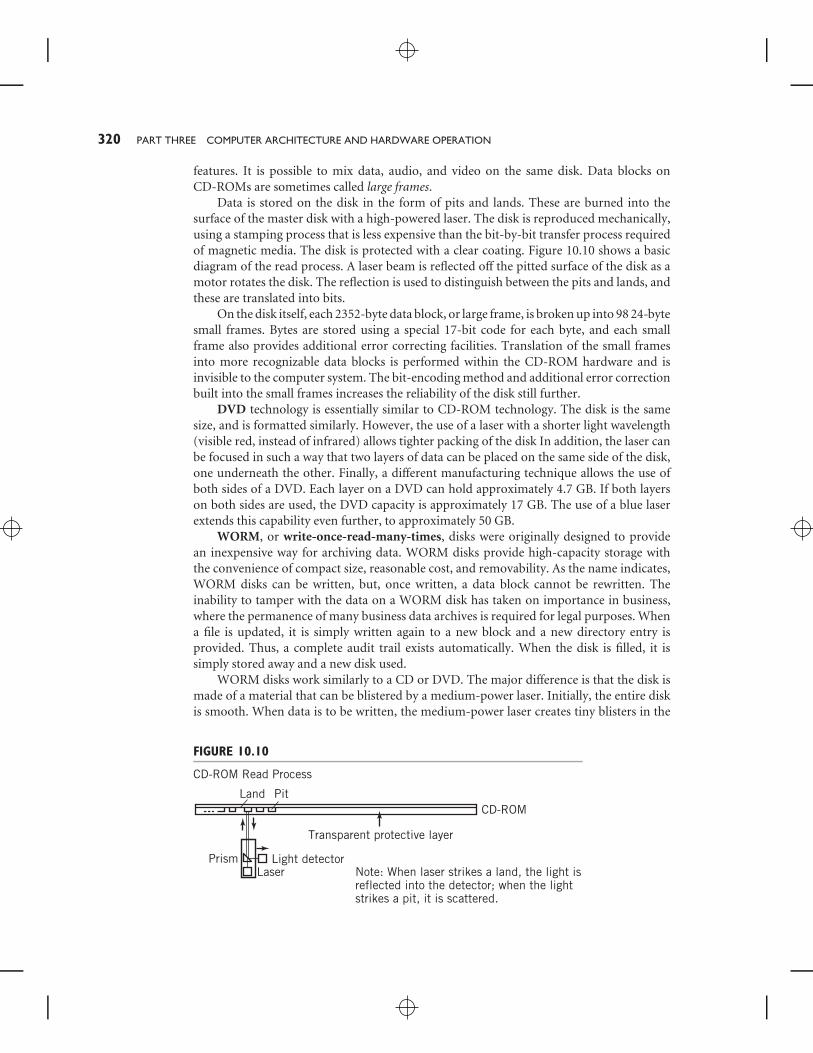
Data is stored on the disk in the form of pits and lands. These are burned into thesurface of the master disk with a high-powered laser. The disk is reproduced mechanically,using a stamping process that is less expensive than the bit-by-bit transfer process requiredof magnetic media. The disk is protected with a clear coating. Figure 10.10 shows a basicdiagram of the read process. A laser beam is reflected off the pitted surface of the disk as amotor rotates the disk. The reflection is used to distinguish between the pits and lands, andthese are translated into bits.
On the disk itself, each 2352-byte data block, or large frame, is broken up into 98 24-bytesmall frames. Bytes are stored using a special 17-bit code for each byte, and each smallframe also provides additional error correcting facilities. Translation of the small framesinto more recognizable data blocks is performed within the CD-ROM hardware and isinvisible to the computer system. The bit-encoding method and additional error correctionbuilt into the small frames increases the reliability of the disk still further.
DVD technology is essentially similar to CD-ROM technology. The disk is the samesize, and is formatted similarly. However, the use of a laser with a shorter light wavelength(visible red, instead of infrared) allows tighter packing of the disk In addition, the laser canbe focused in such a way that two layers of data can be placed on the same side of the disk,one underneath the other. Finally, a different manufacturing technique allows the use ofboth sides of a DVD. Each layer on a DVD can hold approximately 4.7 GB. If both layerson both sides are used, the DVD capacity is approximately 17 GB. The use of a blue laserextends this capability even further, to approximately 50 GB.
WORM, or write-once-read-many-times, disks were originally designed to providean inexpensive way for archiving data. WORM disks provide high-capacity storage withthe convenience of compact size, reasonable cost, and removability. As the name indicates,WORM disks can be written, but, once written, a data block cannot be rewritten. Theinability to tamper with the data on a WORM disk has taken on importance in business,where the permanence of many business data archives is required for legal purposes. Whena file is updated, it is simply written again to a new block and a new directory entry isprovided. Thus, a complete audit trail exists automatically. When the disk is filled, it issimply stored away and a new disk used.
WORM disks work similarly to a CD or DVD. The major difference is that the disk ismade of a material that can be blistered by a medium-power laser. Initially, the entire diskis smooth. When data is to be written, the medium-power laser creates tiny blisters in the
FIGURE 10.10
CD-ROM Read Process
Light detectorLaser
Prism
Transparent protective layer
Land Pit
Note: When laser strikes a land, the light isreflected into the detector; when the lightstrikes a pit, it is scattered.
CD-ROM
CHAPTER 10 COMPUTER PERIPHERALS 321
appropriate locations. These correspond to the pits in a normal CD-ROM. The WORMdisk is read with a separate low-power laser in the same way as a CD-ROM.
This blister technology is used in various CD and DVD formats, called CD-R, DVD-R,and DVD+R. Additionally, there are rewriteable versions of this technology. These areknown as CD-RW, DVD-RW, DVD+RW, DVD-RAM, and DVD+RAMBD-RE. Thereare file compatibility issues between the different WORM and rewriteable CD and DVDformats. Some drives will read every format; others will only read some of the formats.
10.5 MAGNETIC TAPEMagnetic tape is used by many companies for backups and archives in large computersystems. Like other magnetic media, tape is nonvolatile, and the data can be storedindefinitely. Note that tape is a sequential medium, which makes it impractical for randomaccess tasks. Generally, full system backups are made to tape and moved to offsite locationsfor long term storage.
There are several basic tape layouts, but all current formats are cartridge-basedmechanisms. Regardless of type, the tape cartridge is removable from the tape drive foroffline storage. When the tape is in the tape drive, ready for operation, it is said to bemounted. Tape cartridges have the major advantage of convenience. They are easy tomount and dismount, and small and easy to store. Current tape cartridges can store asmuch as 1.6 TB of compressed data or 800 GB of uncompressed data. Cartridges withuncompressed capacities as large as 4 TB are currently in development.
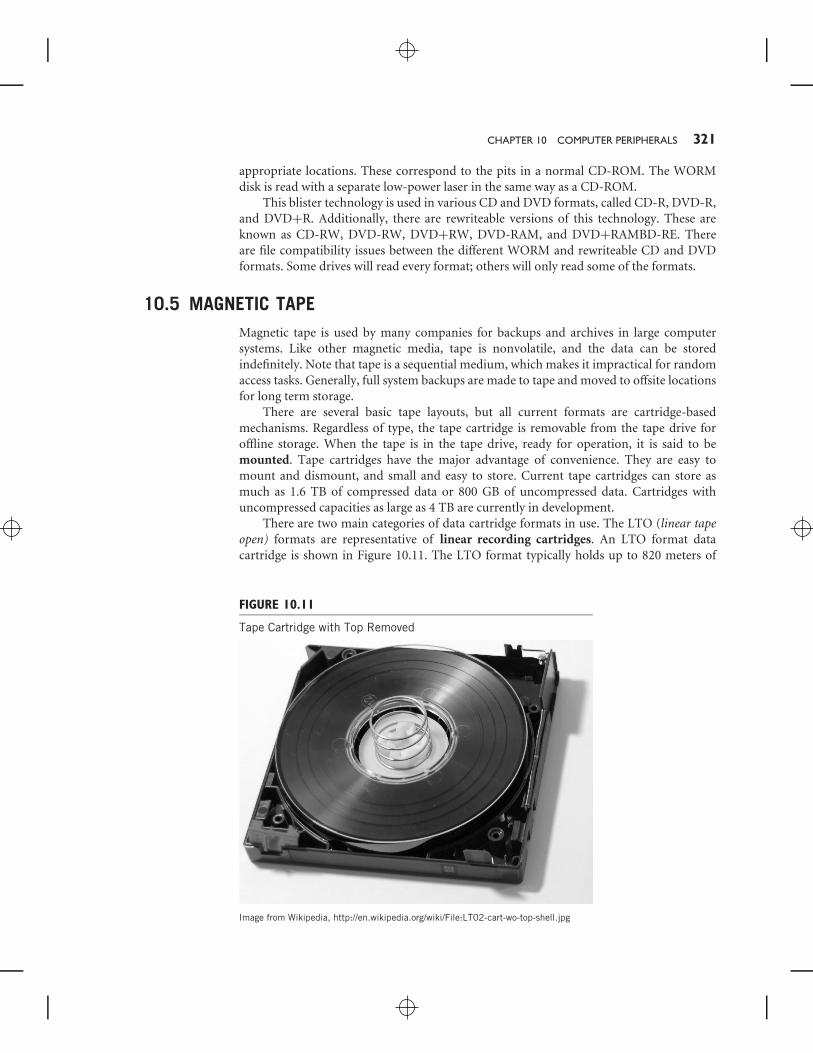
There are two main categories of data cartridge formats in use. The LTO (linear tapeopen) formats are representative of linear recording cartridges. An LTO format datacartridge is shown in Figure 10.11. The LTO format typically holds up to 820 meters of
FIGURE 10.11
Tape Cartridge with Top Removed
Image from Wikipedia, http://en.wikipedia.org/wiki/File:LT02-cart-wo-top-shell.jpg
322 PART THREE COMPUTER ARCHITECTURE AND HARDWARE OPERATION
FIGURE 10.12
Data Cartridge Formats
Linear tapeformat
Helical scan tape format
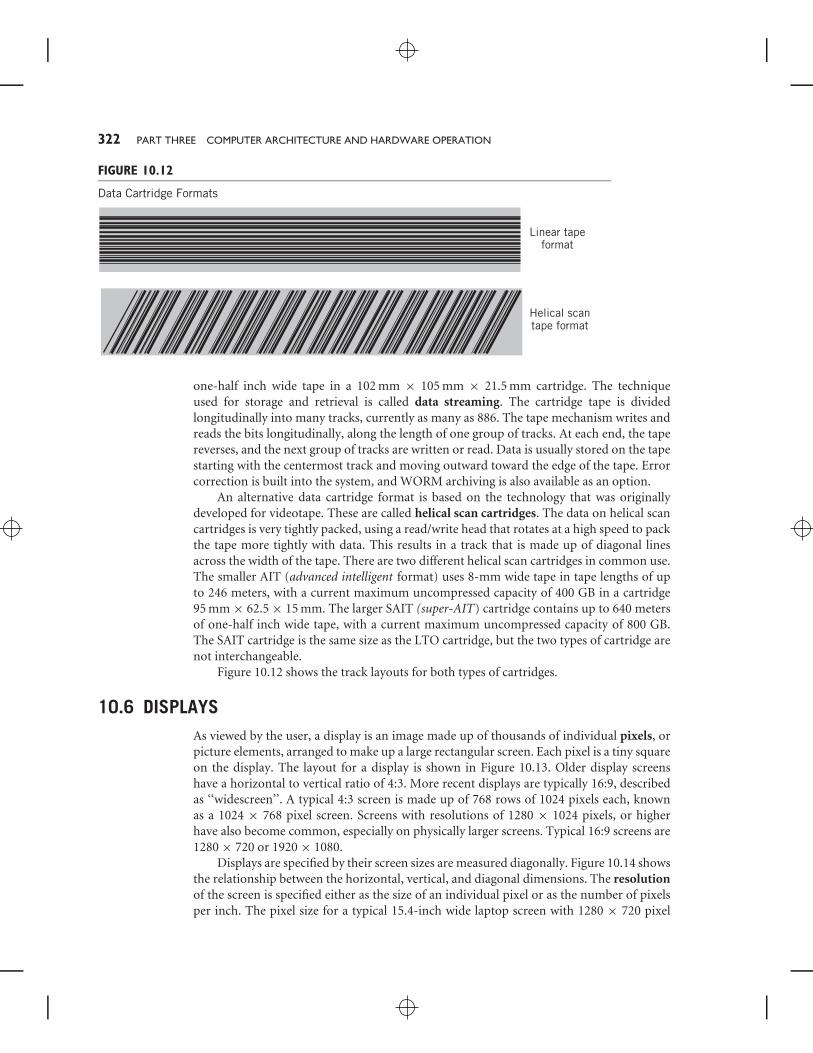
one-half inch wide tape in a 102 mm × 105 mm × 21.5 mm cartridge. The techniqueused for storage and retrieval is called data streaming. The cartridge tape is dividedlongitudinally into many tracks, currently as many as 886. The tape mechanism writes andreads the bits longitudinally, along the length of one group of tracks. At each end, the tapereverses, and the next group of tracks are written or read. Data is usually stored on the tapestarting with the centermost track and moving outward toward the edge of the tape. Errorcorrection is built into the system, and WORM archiving is also available as an option.
An alternative data cartridge format is based on the technology that was originallydeveloped for videotape. These are called helical scan cartridges. The data on helical scancartridges is very tightly packed, using a read/write head that rotates at a high speed to packthe tape more tightly with data. This results in a track that is made up of diagonal linesacross the width of the tape. There are two different helical scan cartridges in common use.The smaller AIT (advanced intelligent format) uses 8-mm wide tape in tape lengths of upto 246 meters, with a current maximum uncompressed capacity of 400 GB in a cartridge95 mm × 62.5 × 15 mm. The larger SAIT (super-AIT) cartridge contains up to 640 metersof one-half inch wide tape, with a current maximum uncompressed capacity of 800 GB.The SAIT cartridge is the same size as the LTO cartridge, but the two types of cartridge arenot interchangeable.
Figure 10.12 shows the track layouts for both types of cartridges.
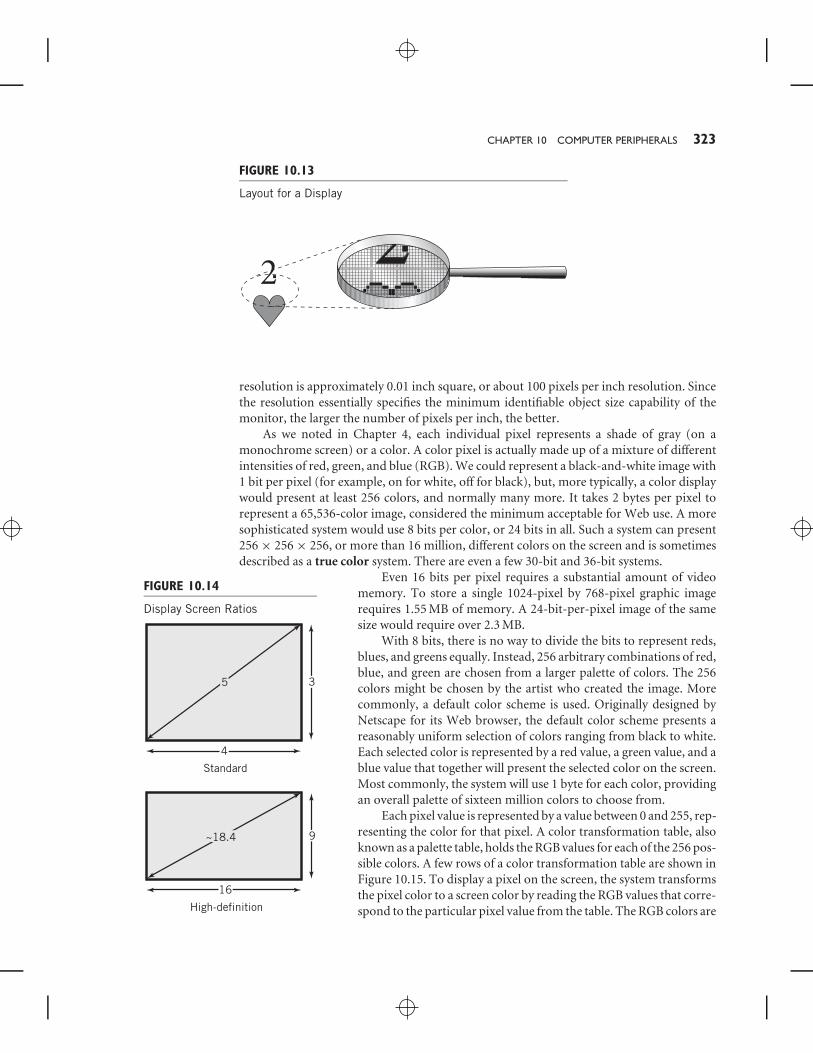
10.6 DISPLAYSAs viewed by the user, a display is an image made up of thousands of individual pixels, orpicture elements, arranged to make up a large rectangular screen. Each pixel is a tiny squareon the display. The layout for a display is shown in Figure 10.13. Older display screenshave a horizontal to vertical ratio of 4:3. More recent displays are typically 16:9, describedas ‘‘widescreen’’. A typical 4:3 screen is made up of 768 rows of 1024 pixels each, knownas a 1024 × 768 pixel screen. Screens with resolutions of 1280 × 1024 pixels, or higherhave also become common, especially on physically larger screens. Typical 16:9 screens are1280 × 720 or 1920 × 1080.
Displays are specified by their screen sizes are measured diagonally. Figure 10.14 showsthe relationship between the horizontal, vertical, and diagonal dimensions. The resolutionof the screen is specified either as the size of an individual pixel or as the number of pixelsper inch. The pixel size for a typical 15.4-inch wide laptop screen with 1280 × 720 pixel
CHAPTER 10 COMPUTER PERIPHERALS 323
FIGURE 10.13
Layout for a Display
2
resolution is approximately 0.01 inch square, or about 100 pixels per inch resolution. Sincethe resolution essentially specifies the minimum identifiable object size capability of themonitor, the larger the number of pixels per inch, the better.
As we noted in Chapter 4, each individual pixel represents a shade of gray (on amonochrome screen) or a color. A color pixel is actually made up of a mixture of differentintensities of red, green, and blue (RGB). We could represent a black-and-white image with1 bit per pixel (for example, on for white, off for black), but, more typically, a color displaywould present at least 256 colors, and normally many more. It takes 2 bytes per pixel torepresent a 65,536-color image, considered the minimum acceptable for Web use. A moresophisticated system would use 8 bits per color, or 24 bits in all. Such a system can present256 × 256 × 256, or more than 16 million, different colors on the screen and is sometimesdescribed as a true color system. There are even a few 30-bit and 36-bit systems.
FIGURE 10.14
Display Screen Ratios
~18.4 9
5 3
4
High-definition
Standard
16
Even 16 bits per pixel requires a substantial amount of videomemory. To store a single 1024-pixel by 768-pixel graphic imagerequires 1.55 MB of memory. A 24-bit-per-pixel image of the samesize would require over 2.3 MB.
With 8 bits, there is no way to divide the bits to represent reds,blues, and greens equally. Instead, 256 arbitrary combinations of red,blue, and green are chosen from a larger palette of colors. The 256colors might be chosen by the artist who created the image. Morecommonly, a default color scheme is used. Originally designed byNetscape for its Web browser, the default color scheme presents areasonably uniform selection of colors ranging from black to white.Each selected color is represented by a red value, a green value, and ablue value that together will present the selected color on the screen.Most commonly, the system will use 1 byte for each color, providingan overall palette of sixteen million colors to choose from.
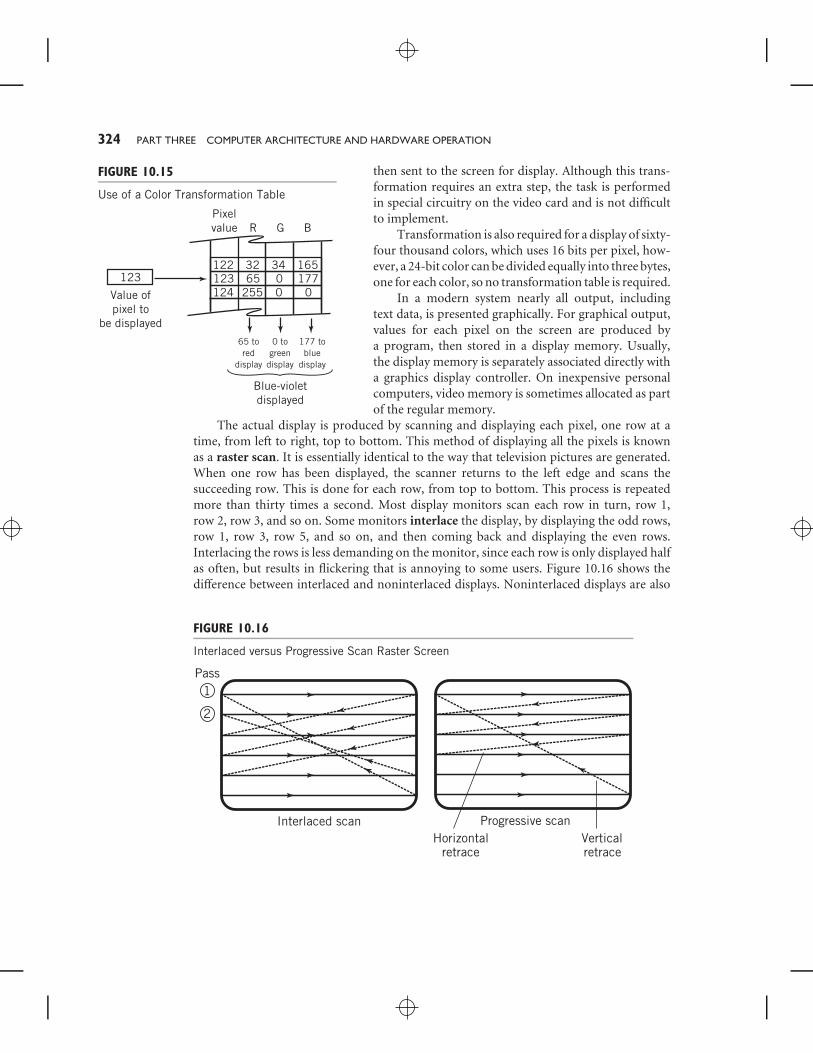
Each pixel value is represented by a value between 0 and 255, rep-resenting the color for that pixel. A color transformation table, alsoknown as a palette table, holds the RGB values for each of the 256 pos-sible colors. A few rows of a color transformation table are shown inFigure 10.15. To display a pixel on the screen, the system transformsthe pixel color to a screen color by reading the RGB values that corre-spond to the particular pixel value from the table. The RGB colors are
324 PART THREE COMPUTER ARCHITECTURE AND HARDWARE OPERATION
FIGURE 10.15
Use of a Color Transformation Table
R G B
123123 17765 0Value ofpixel to
be displayed
Pixelvalue
124 0255 0
122 16532 34
65 tored
display
0 to green
display
177 to blue
display
Blue-violetdisplayed
then sent to the screen for display. Although this trans-formation requires an extra step, the task is performedin special circuitry on the video card and is not difficultto implement.
Transformation is also required for a display of sixty-four thousand colors, which uses 16 bits per pixel, how-ever, a 24-bit color can be divided equally into three bytes,one for each color, so no transformation table is required.
In a modern system nearly all output, includingtext data, is presented graphically. For graphical output,values for each pixel on the screen are produced bya program, then stored in a display memory. Usually,the display memory is separately associated directly witha graphics display controller. On inexpensive personalcomputers, video memory is sometimes allocated as partof the regular memory.
The actual display is produced by scanning and displaying each pixel, one row at atime, from left to right, top to bottom. This method of displaying all the pixels is knownas a raster scan. It is essentially identical to the way that television pictures are generated.When one row has been displayed, the scanner returns to the left edge and scans thesucceeding row. This is done for each row, from top to bottom. This process is repeatedmore than thirty times a second. Most display monitors scan each row in turn, row 1,row 2, row 3, and so on. Some monitors interlace the display, by displaying the odd rows,row 1, row 3, row 5, and so on, and then coming back and displaying the even rows.Interlacing the rows is less demanding on the monitor, since each row is only displayed halfas often, but results in flickering that is annoying to some users. Figure 10.16 shows thedifference between interlaced and noninterlaced displays. Noninterlaced displays are also
FIGURE 10.16
Interlaced versus Progressive Scan Raster Screen
Pass
Interlaced scan Progressive scan
1
2
Horizontalretrace
Verticalretrace
CHAPTER 10 COMPUTER PERIPHERALS 325
sometimes called progressive scan displays. Although some TV displays are interlaced,most computer display monitors are noninterlaced,
An alternative to raster scan is vector scan, in which pixels are displayed in whateverorder is necessary to trace out a particular image. Vector scan could trace a character, forexample, by following the outline of the character. Vector scan is obviously not suitablefor bit map graphics, but can be used with object graphics images, such as those used forCAD/CAM applications. Generating vector scan images on a display screen is electronicallymuch more difficult and expensive than producing raster scans, consequently, raster scansare used almost universally today for display. Vector scans are sometimes used whenprinting object graphics-based drawings to a plotter.
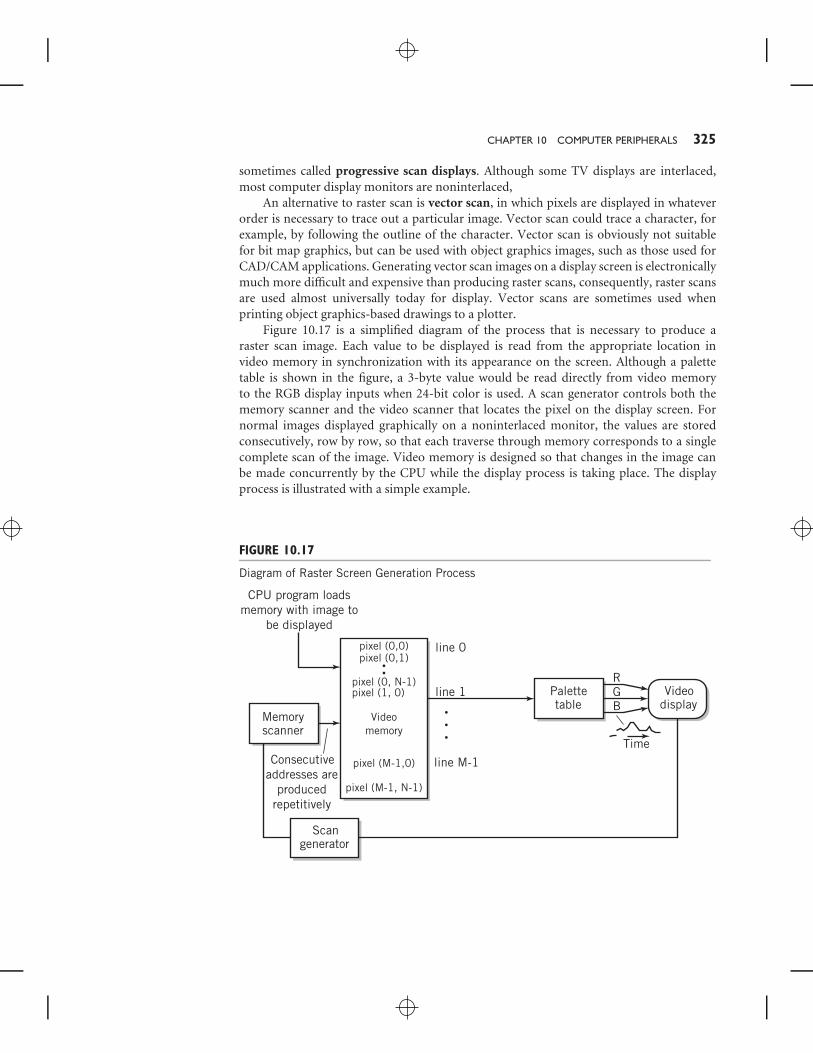
Figure 10.17 is a simplified diagram of the process that is necessary to produce araster scan image. Each value to be displayed is read from the appropriate location invideo memory in synchronization with its appearance on the screen. Although a palettetable is shown in the figure, a 3-byte value would be read directly from video memoryto the RGB display inputs when 24-bit color is used. A scan generator controls both thememory scanner and the video scanner that locates the pixel on the display screen. Fornormal images displayed graphically on a noninterlaced monitor, the values are storedconsecutively, row by row, so that each traverse through memory corresponds to a singlecomplete scan of the image. Video memory is designed so that changes in the image canbe made concurrently by the CPU while the display process is taking place. The displayprocess is illustrated with a simple example.
FIGURE 10.17
Diagram of Raster Screen Generation Process
Palettetable
Memoryscanner
Scangenerator
Videomemory
pixel (0,0)pixel (0,1)
pixel (0, N-1)pixel (1, 0)
pixel (M-1,0)
pixel (M-1, N-1)
Videodisplay
RGB
CPU program loadsmemory with image to
be displayed
Consecutiveaddresses are
producedrepetitively
line M-1
line 0
line 1
Time
326 PART THREE COMPUTER ARCHITECTURE AND HARDWARE OPERATION
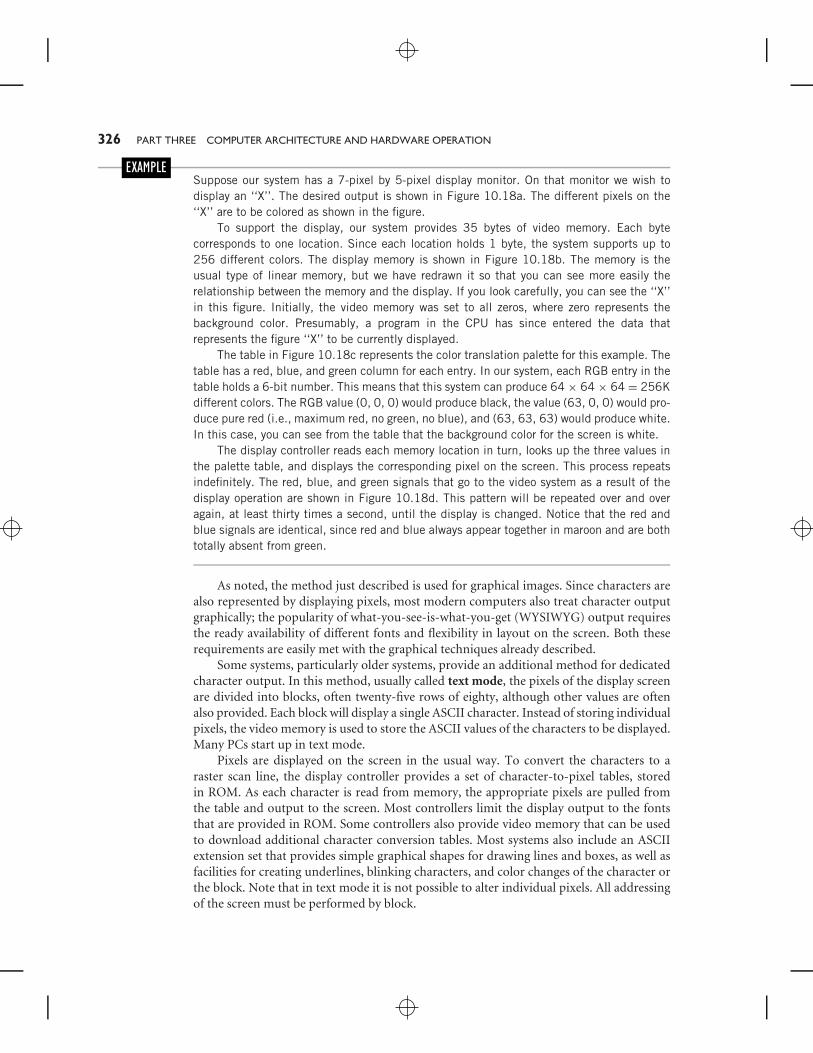
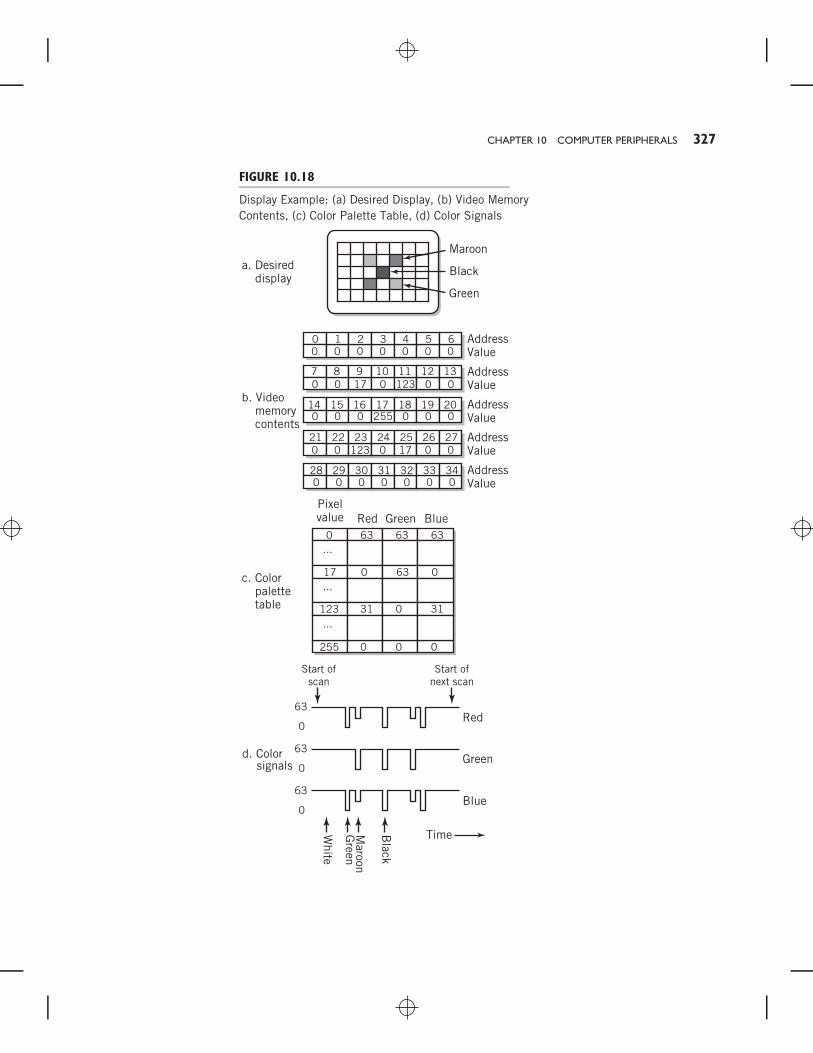
EXAMPLESuppose our system has a 7-pixel by 5-pixel display monitor. On that monitor we wish todisplay an ‘‘X’’. The desired output is shown in Figure 10.18a. The different pixels on the‘‘X’’ are to be colored as shown in the figure.
To support the display, our system provides 35 bytes of video memory. Each bytecorresponds to one location. Since each location holds 1 byte, the system supports up to256 different colors. The display memory is shown in Figure 10.18b. The memory is theusual type of linear memory, but we have redrawn it so that you can see more easily therelationship between the memory and the display. If you look carefully, you can see the ‘‘X’’in this figure. Initially, the video memory was set to all zeros, where zero represents thebackground color. Presumably, a program in the CPU has since entered the data thatrepresents the figure ‘‘X’’ to be currently displayed.
The table in Figure 10.18c represents the color translation palette for this example. Thetable has a red, blue, and green column for each entry. In our system, each RGB entry in thetable holds a 6-bit number. This means that this system can produce 64 × 64 × 64 = 256Kdifferent colors. The RGB value (0, 0, 0) would produce black, the value (63, 0, 0) would pro-duce pure red (i.e., maximum red, no green, no blue), and (63, 63, 63) would produce white.In this case, you can see from the table that the background color for the screen is white.
The display controller reads each memory location in turn, looks up the three values inthe palette table, and displays the corresponding pixel on the screen. This process repeatsindefinitely. The red, blue, and green signals that go to the video system as a result of thedisplay operation are shown in Figure 10.18d. This pattern will be repeated over and overagain, at least thirty times a second, until the display is changed. Notice that the red andblue signals are identical, since red and blue always appear together in maroon and are bothtotally absent from green.
As noted, the method just described is used for graphical images. Since characters arealso represented by displaying pixels, most modern computers also treat character outputgraphically; the popularity of what-you-see-is-what-you-get (WYSIWYG) output requiresthe ready availability of different fonts and flexibility in layout on the screen. Both theserequirements are easily met with the graphical techniques already described.
Some systems, particularly older systems, provide an additional method for dedicatedcharacter output. In this method, usually called text mode, the pixels of the display screenare divided into blocks, often twenty-five rows of eighty, although other values are oftenalso provided. Each block will display a single ASCII character. Instead of storing individualpixels, the video memory is used to store the ASCII values of the characters to be displayed.Many PCs start up in text mode.
Pixels are displayed on the screen in the usual way. To convert the characters to araster scan line, the display controller provides a set of character-to-pixel tables, storedin ROM. As each character is read from memory, the appropriate pixels are pulled fromthe table and output to the screen. Most controllers limit the display output to the fontsthat are provided in ROM. Some controllers also provide video memory that can be usedto download additional character conversion tables. Most systems also include an ASCIIextension set that provides simple graphical shapes for drawing lines and boxes, as well asfacilities for creating underlines, blinking characters, and color changes of the character orthe block. Note that in text mode it is not possible to alter individual pixels. All addressingof the screen must be performed by block.
CHAPTER 10 COMPUTER PERIPHERALS 327
FIGURE 10.18
Display Example: (a) Desired Display, (b) Video MemoryContents, (c) Color Palette Table, (d) Color Signals
Black
Green
AddressValue
AddressValue
...
AddressValue
AddressValue
AddressValue
Pixelvalue Red Blue
0 63 63 63
...
...
Green
Maroona. Desired display
b. Video memory contents
c. Color palette table
0
63
0
63
0
63
Red
Blue
Green
TimeGreen
White
Maroon
Black
d. Color signals
0 1 2 3 4 5 60 0 0 0 0 0 0
7 8 9 10 11 12 130 0 17 0 123 0 0
14 15 16 17 18 19 200 0 0 255 0 0 0
21 22 23 24 25 26 270 0 123 0 17 0 0
28 29 30 31 32 33 340 0 0 0 0 0 0
17 0 63 0
123 31 0 31
255 0 0 0
Start ofscan
Start ofnext scan
328 PART THREE COMPUTER ARCHITECTURE AND HARDWARE OPERATION
Every pixel in a graphics display must be stored and manipulated individually;therefore, the requirements for a graphic display are much more stringent than those fora character display. Also, text mode display has the advantage that it requires significantlyless memory than does graphics mode. As the price of memory has declined rapidly, thishas become less of an issue. Text mode has one important additional advantage, however.Text data can be transmitted to a terminal located remotely from the computer muchmore compactly and efficiently in text mode than in graphics mode. It is obviously easierto transmit a single character than the dozens of pixels that make up the image of thatcharacter. Because of this, some terminals are still character based, particularly in businessenvironments where most of the data is alphanumeric.
A compromise between the simplicity of text mode and the elegance of graphics modeis to transmit the data using an object-based description language such as PostScript. Fontsdescribed in this way are known as outline fonts. By contrast, those fonts that are describedby laying out the detailed pixel diagram for the characters are known as bitmapped fonts.Outline fonts and graphics described by page description languages have the additionaladvantage that they may be scaled easily to different sizes and rotated to different angles.The graphic image is then reconstructed at the terminal by translation software that isbuilt into the display controller. This method is particularly amenable to printers and toPostscript displays used for precision graphical and layout work. The methods of managinggraphical images are explored more fully in Chapter 16.
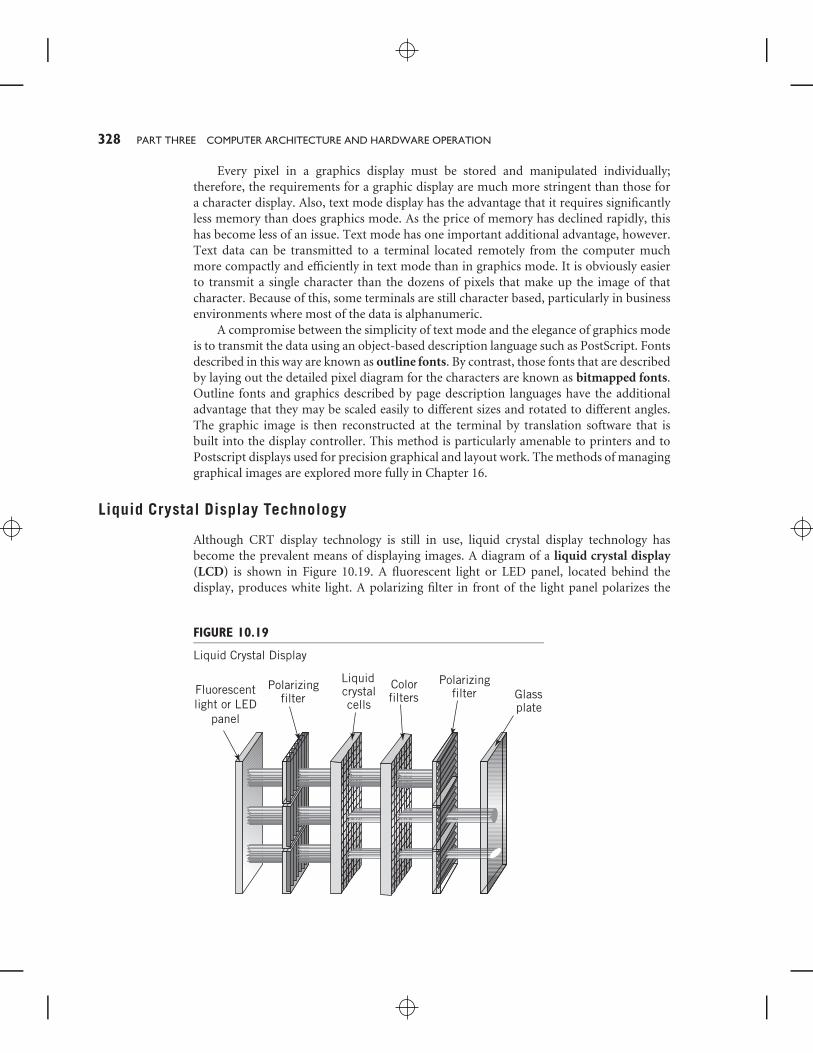
Liquid Crystal Display Technology
Although CRT display technology is still in use, liquid crystal display technology hasbecome the prevalent means of displaying images. A diagram of a liquid crystal display(LCD) is shown in Figure 10.19. A fluorescent light or LED panel, located behind thedisplay, produces white light. A polarizing filter in front of the light panel polarizes the
FIGURE 10.19
Liquid Crystal Display
Fluorescent light or LED
panel
Polarizingfilter
Liquidcrystalcells
Colorfilters
Polarizingfilter Glass
plate
CHAPTER 10 COMPUTER PERIPHERALS 329
light so that most of it is polarized in one direction. The polarized light then passes througha matrix of liquid crystal cells. In a color display, there are three cells positioned properlyfor each pixel. When an electrical current is applied to one of these cells, the molecules inthe cell spiral. The strongest charge will cause the molecules to spiral 90 degrees. Since thelight is passed through the crystal, its polarization will change, the amount depending onthe strength of the electrical current applied.
Therefore, the light coming out of the crystal is now polarized in different directions,depending on the strength of the current that was applied to the crystal. The light isnow passed through a red, blue, or green color filter and through a second polarizingfilter. Because a polarizing filter blocks all light that is polarized perpendicular to itspreferred direction, the second filter will only pass through the light that is polarized in thecorrect direction. Therefore, the brightness of the light is proportional to the amount ofpolarization twist that was applied by the liquid crystal’s spiral.
There are several different ways of applying the electric current to the crystal. In anactive matrix display, the display panel contains one transistor for each cell in the matrix.This guarantees that each cell will receive a strong charge, but is also expensive and difficultto manufacture. (Remember that even one imperfect cell will be apparent to the viewer!)A less expensive way provides a single transistor for each row and column of the matrixand activates each cell, one at a time, repetitively, using a scan pattern. This type of panelis known as a passive matrix display. The charge is applied for less time and is thereforelower. The result is a dimmer picture. Most modern LCD displays use the active matrixapproach.
LCD panels have the advantage of bright images, no flicker, low power consumption,and thinness, so they are ideal for laptop computers. They are also used in most desktopdisplays. Because they are essentially flat, they can be placed anywhere. The same technologyis also used for large-screen computer projectors.
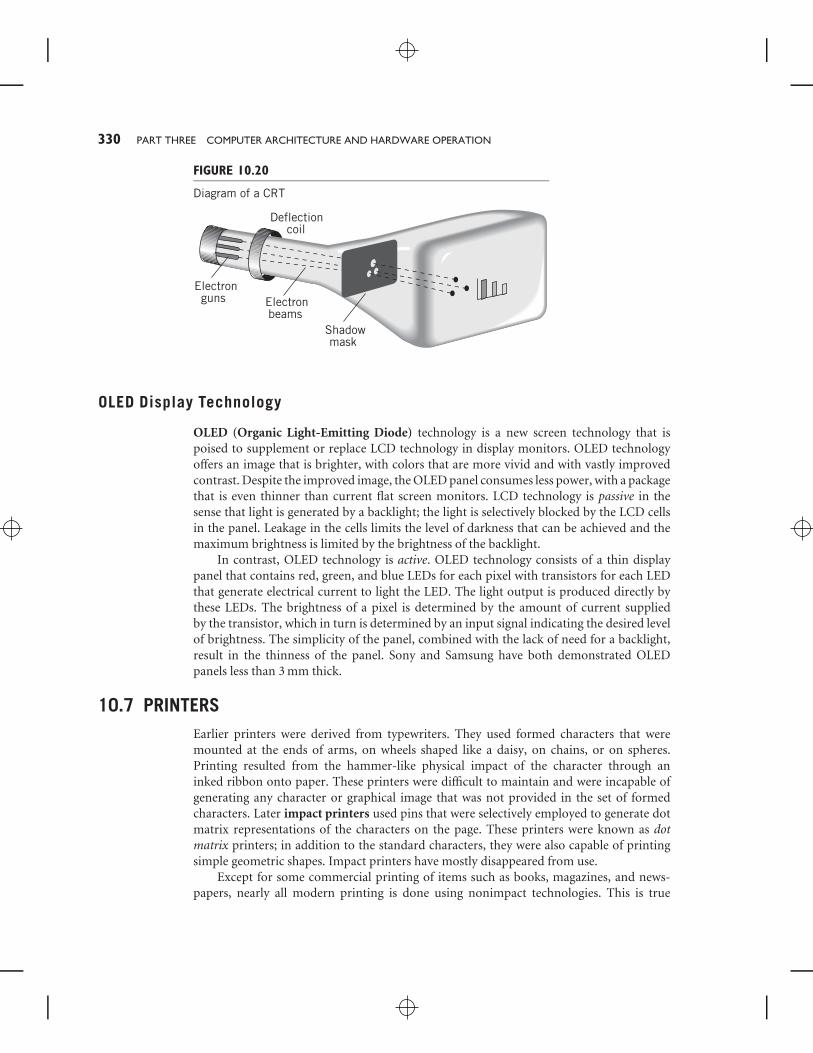
CRT Display Technology
With CRT technology, the image is produced on the face of a cathode ray tube (CRT),using a methodology similar to that used for older television receivers. A diagram of acolor cathode ray tube is shown in Figure 10.20. Three electron guns within the tube shootbeams of electrons from the back of the tube. There is a gun for each of the primary colors,red, blue, and green. A high voltage applied to the inside of the face of the tube attracts thebeams to the face. The face of the tube is painted with tiny dots or thin stripes of phosphors,which glow when struck by electrons. There are phosphors that glow red, blue, and green.A shadow mask in the tube is designed such that electrons from each gun can strike onlyphosphors of the matching color. The strength of the beams varies depending on the colorand brightness of the point being displayed. The stronger the beam for a particular color,the brighter that color appears on the screen.
The three beams of electrons are deflected both horizontally and vertically by a pairof electromagnetic coils, so that the beam scans across the screen and top to bottom, toform the scan pattern that you already saw in Figure 10.16. Monochrome video monitorswork identically, except that only a single gun is required, the phosphor is white, yellow, orgreen, and no shadow mask is required.
330 PART THREE COMPUTER ARCHITECTURE AND HARDWARE OPERATION
FIGURE 10.20
Diagram of a CRT
Electronguns Electron
beamsShadowmask
Deflectioncoil
OLED Display Technology
OLED (Organic Light-Emitting Diode) technology is a new screen technology that ispoised to supplement or replace LCD technology in display monitors. OLED technologyoffers an image that is brighter, with colors that are more vivid and with vastly improvedcontrast. Despite the improved image, the OLED panel consumes less power, with a packagethat is even thinner than current flat screen monitors. LCD technology is passive in thesense that light is generated by a backlight; the light is selectively blocked by the LCD cellsin the panel. Leakage in the cells limits the level of darkness that can be achieved and themaximum brightness is limited by the brightness of the backlight.
In contrast, OLED technology is active. OLED technology consists of a thin displaypanel that contains red, green, and blue LEDs for each pixel with transistors for each LEDthat generate electrical current to light the LED. The light output is produced directly bythese LEDs. The brightness of a pixel is determined by the amount of current suppliedby the transistor, which in turn is determined by an input signal indicating the desired levelof brightness. The simplicity of the panel, combined with the lack of need for a backlight,result in the thinness of the panel. Sony and Samsung have both demonstrated OLEDpanels less than 3 mm thick.
10.7 PRINTERSEarlier printers were derived from typewriters. They used formed characters that weremounted at the ends of arms, on wheels shaped like a daisy, on chains, or on spheres.Printing resulted from the hammer-like physical impact of the character through aninked ribbon onto paper. These printers were difficult to maintain and were incapable ofgenerating any character or graphical image that was not provided in the set of formedcharacters. Later impact printers used pins that were selectively employed to generate dotmatrix representations of the characters on the page. These printers were known as dotmatrix printers; in addition to the standard characters, they were also capable of printingsimple geometric shapes. Impact printers have mostly disappeared from use.
Except for some commercial printing of items such as books, magazines, and news-papers, nearly all modern printing is done using nonimpact technologies. This is true
CHAPTER 10 COMPUTER PERIPHERALS 331
FIGURE 10.21
Creating a Gray Scale
Black Dark gray Light gray
White
regardless of the size of the system, thequantity of printing, or the capacity ofthe printer.2 Single-color (usually blackand white) printers normally use laser, orinkjet printing technology. Low-cost colorprinting also uses inkjet technology. Moreexpensive color printing uses thermal waxtransfer or dye sublimation, inkjet, or lasertechnology.
The impression on the paper is sprayedat the paper or laid down on the paper.Like displays, printer output can be charac-ter based or graphics based. Most printershave built-in character printing capabilityand can also download fonts. Nonetheless,much of the output from modern comput-
ers is graphics based, even when text is being printed, since graphics output produces moreflexibility. The output to many printers takes the form of graphical bitmaps that representthe required pixels directly. Some printers have built-in computing capability and canaccept data in the form of a page description language, predominantly Adobe PostScriptor PCL, an industry standard print command language originally developed by HP. Thecontroller in the printer can then convert from the page description language to the bitmapwithin the printer itself. Memory is provided within the printer to hold the bitmappedimage while it is being printed.
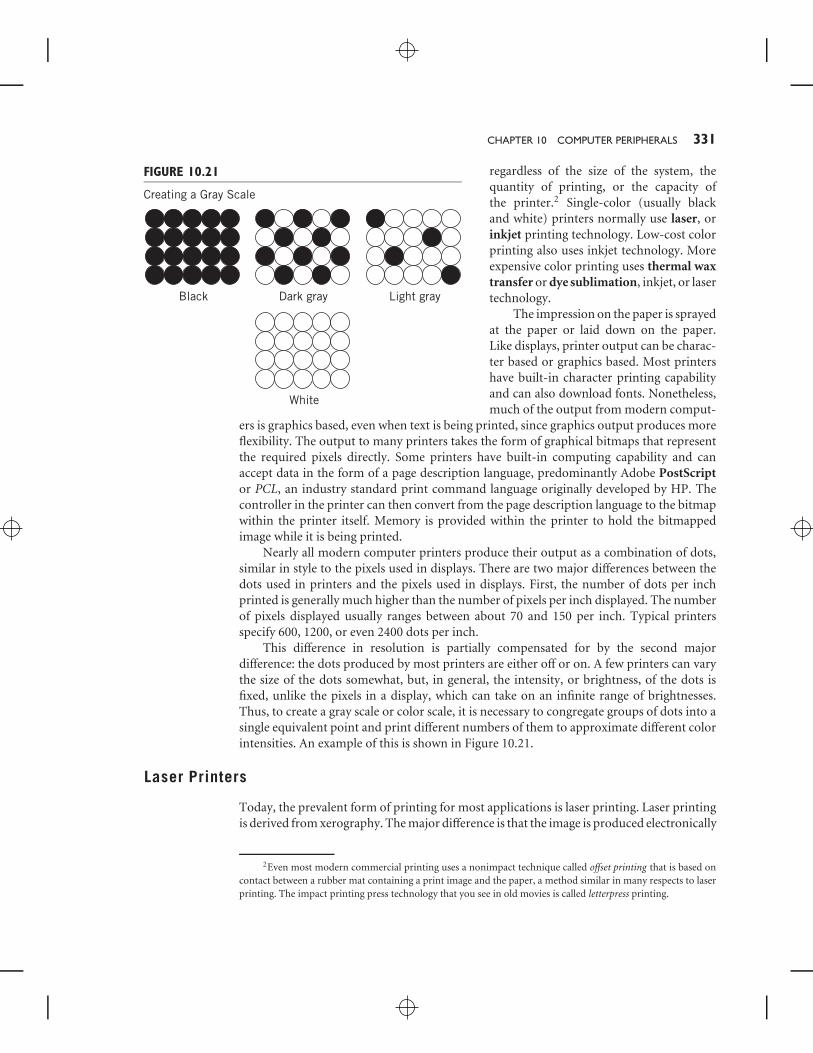
Nearly all modern computer printers produce their output as a combination of dots,similar in style to the pixels used in displays. There are two major differences between thedots used in printers and the pixels used in displays. First, the number of dots per inchprinted is generally much higher than the number of pixels per inch displayed. The numberof pixels displayed usually ranges between about 70 and 150 per inch. Typical printersspecify 600, 1200, or even 2400 dots per inch.
This difference in resolution is partially compensated for by the second majordifference: the dots produced by most printers are either off or on. A few printers can varythe size of the dots somewhat, but, in general, the intensity, or brightness, of the dots isfixed, unlike the pixels in a display, which can take on an infinite range of brightnesses.Thus, to create a gray scale or color scale, it is necessary to congregate groups of dots into asingle equivalent point and print different numbers of them to approximate different colorintensities. An example of this is shown in Figure 10.21.
Laser Printers
Today, the prevalent form of printing for most applications is laser printing. Laser printingis derived from xerography. The major difference is that the image is produced electronically
2Even most modern commercial printing uses a nonimpact technique called offset printing that is based oncontact between a rubber mat containing a print image and the paper, a method similar in many respects to laserprinting. The impact printing press technology that you see in old movies is called letterpress printing.
332 PART THREE COMPUTER ARCHITECTURE AND HARDWARE OPERATION
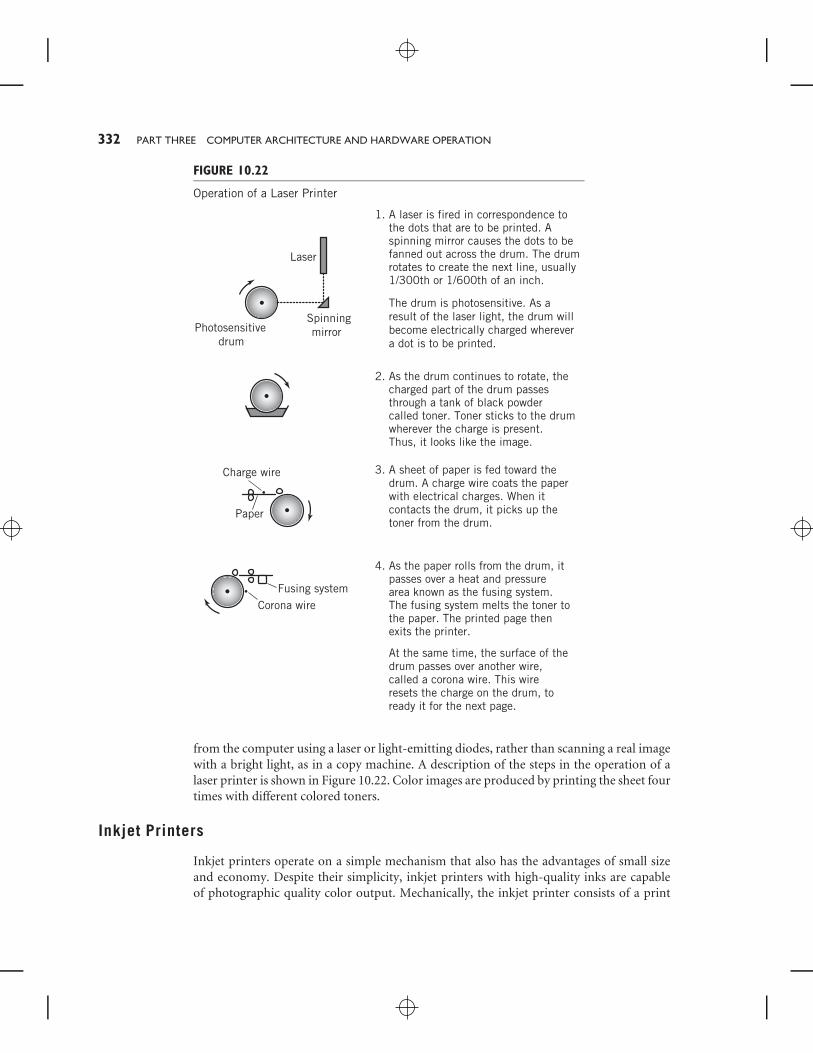
FIGURE 10.22
Operation of a Laser Printer
Photosensitivedrum
Spinningmirror
1. A laser is fired in correspondence to the dots that are to be printed. A spinning mirror causes the dots to be fanned out across the drum. The drum rotates to create the next line, usually 1/300th or 1/600th of an inch.
The drum is photosensitive. As a result of the laser light, the drum will become electrically charged wherever a dot is to be printed.
2. As the drum continues to rotate, the charged part of the drum passes through a tank of black powder called toner. Toner sticks to the drum wherever the charge is present. Thus, it looks like the image.
3. A sheet of paper is fed toward the drum. A charge wire coats the paper with electrical charges. When it contacts the drum, it picks up the toner from the drum.
4. As the paper rolls from the drum, it passes over a heat and pressure area known as the fusing system. The fusing system melts the toner to the paper. The printed page then exits the printer.
At the same time, the surface of the drum passes over another wire, called a corona wire. This wire resets the charge on the drum, to ready it for the next page.
Laser
Charge wire
Paper
Fusing systemCorona wire
from the computer using a laser or light-emitting diodes, rather than scanning a real imagewith a bright light, as in a copy machine. A description of the steps in the operation of alaser printer is shown in Figure 10.22. Color images are produced by printing the sheet fourtimes with different colored toners.
Inkjet Printers
Inkjet printers operate on a simple mechanism that also has the advantages of small sizeand economy. Despite their simplicity, inkjet printers with high-quality inks are capableof photographic quality color output. Mechanically, the inkjet printer consists of a print
CHAPTER 10 COMPUTER PERIPHERALS 333
cartridge that moves across the page to print a number of rows of dots, and mechanicalrollers that move the page downward to print successive rows.
The inkjet print cartridge contains a reservoir of ink and a column of tiny nozzles,so that several rows can be printed at once. Each nozzle is smaller than the width of ahuman hair. A dot is produced by heating the ink behind a nozzle. When the ink is boiledit sprays a tiny droplet of ink toward the paper. The volume of each droplet is aboutone-millionth the volume of the drop from an eyedropper of water! Some printers use avibrating piezo-crystal instead of heat to produce the ink droplets. Multiple reservoirs ofink make it possible to print multiple colors.
Thermal Wax Transfer and Dye Sublimation Printers
For the highest quality color images, more specialized methods are required. The preferredmethods are thermal wax transfer and dye sublimation. The mechanisms for both types aresimilar. The paper is fed into the printer and clamped against a drum. A print head providesa row of dot-sized heating elements. Between the paper and the print head, the printerfeeds a roll of film that is impregnated with either colored wax or dye. The film is made upof page-sized sections of magenta, cyan, and yellow colors; sometimes an additional sectionof black is also included. Each rotation of the drum exposes the paper to a different color.The heat from the print head melts the wax or dye onto the paper.
Thermal wax can be applied to ordinary paper. To improve quality, some printersprecoat the paper with clear wax. This compensates for slight imperfections in the paperso that the wax may be applied more uniformly. Different colors are produced in the sameway that black-and-white printers produce gray scales.
The dye sublimation technique differs slightly, in that transparent dyes diffuse in thepaper, so that the dots of color actually blend. Furthermore, it is possible to control theamount of dye by adjusting the temperature of individual print head elements. Thus,dye sublimation can print continuous color tones. Unfortunately, the dye sublimationtechnique also requires higher temperatures, therefore, special paper must be used.
10.8 USER INPUT DEVICES
Keyboards and Pointing Devices
Users use a variety of devices to interact with the computer, but most commonly, themodern user interface is based upon a keyboard and a pointing device. Keyboards consistof a number of switches and a keyboard controller. The keyboard controller is built intothe keyboard itself. There are several different types of switches in use, including capacitive,magnetic, and mechanical. In most environments, the type of switch used is not important.Different types of switches feel differently when used. Some switches are more suitable thanothers for environments where dust or electrical sparks or the need for ultra-high reliabilityare a problem. When a key is pushed, a signal called a scan code is sent to the controller.A different scan code is sent when the key is released. This is true for every key on thekeyboard, including special keys such as Control, Alt, and Shift keys. The use of two scancodes allows keys to be used in combination, since the controller is able to tell whether akey is being held down while another key is struck. The controller can also determine whena key is to cause a repeated action.
334 PART THREE COMPUTER ARCHITECTURE AND HARDWARE OPERATION
If the keyboard is part of a terminal, the scan codes are converted to ASCII, Unicode,or EBCDIC (see Chapter 4 if you need a reminder) and sent to the computer, usually viaa serial port. Keyboards local to a computer such as a PC interrupt the computer directly.The scan codes are converted to ASCII or Unicode by software in the computer. Thislatter method allows more flexibility in remapping the keyboard for different languagesand keyboard layouts.
Modern graphical user interfaces also require the use of a pointer device as input tolocate and move a cursor on the display screen. The best known pointer device is a mouse,but there are other pointer devices in use, including light pens, touch screens, and graphicstablets, as well as the special pointer devices used for interfacing with computer games.
The simplest device is the mechanical mouse. As the mouse is moved across a surface,the roller ball protruding from bottom of the mouse also moves. Two wheels, mounted ata 90-degree angle from each other, touch the roller ball, and move with it. These wheelsare called encoders. As the encoders move, they generate a series of pulses. The numberof pulses corresponds to the distance that the mouse was moved. One encoder recordsmovement forward and backward; the other records sideway motion. The pulses are sentto a program in the computer to interpret the current location of a cursor. Some encodersuse a tiny light and sensor to create the pulses, others use a tiny mechanical switch, but themethod used is not important. Desktop game pointing devices and trackballs work similarly.Space-based game controllers, such as the Nintendo Wii remote, use accelerometers todetect movement in all three dimensions; software in the game console then uses thatinformation to perform the appropriate action upon the object of interest.
Light pens are used differently and work differently. A light pen is pointed at thescreen to identify a position on the screen. By moving the pen around the screen, a cursorcan be made to follow the pen. The light pen can be used to point to a target, such as acontrol button on the screen, and can also be used as a drawing tool. The light pen is notactually capable of telling the system its position. Instead, the software program that is usedwith the light pen rapidly generates pixels of light on the display screen at known locationsin the area where the light pen is believed to be pointing. The light pen has a photodetectorthat can respond to the point of light on the screen, so when the point on the screen thatcorresponds to the light pen is lit, the light pen is activated, which notifies the program thatthe current location is correct.
Graphics tablets use a variety of techniques, including pressure-sensitive sensors,optical sensors, magnetic sensors, and capacitive sensors to determine the location of apen on the pad. Some techniques require the use of a special pen, which is attached tothe tablet, while others allow the use of any pointed object, such as a wooden pencil, withor without lead, or even a finger. The resolution and accuracy of graphics tablets dependson the technique employed. Graphics tablets can be used as mouse replacements, but areparticularly suited for drawing. A similar mechanism is used for the touch pads commonlyfound on laptop computers.
Touch screens provide a capability similar to that of graphics tablets, but with thesensing mechanism attached directly to the display screen, allowing the user to pointdirectly to an object on the screen. Touch screens are particularly popular on devices suchas PDAs, cell phones, portable game consoles, and portable music and video players. Theyare also available on many commercial devices that require user interaction with the public,such as store self-checkout machines and information kiosks, as well as some personalcomputers. A number of different technologies can be used to detect the point of touch.
CHAPTER 10 COMPUTER PERIPHERALS 335
These technologies differ in cost, accuracy, and durability. Common technologies includeresistive, capacitive, and surface acoustic wave. Some touch screens are capable of detectingmultiple touch points.
Scanners
Scanners are the primary means used to input paper images. Although video framegrabbers and television cameras can also be used for this purpose, scanners are generallyless expensive and more convenient.
There are three primary types of scanners, flatbed scanners, sheet-fed scanners, andhandheld scanners, but all three work similarly and differ only in the way the scan elementis moved with respect to the paper. In a flatbed scanner, the paper is placed on a glasswindow, while the scan element moves down the page, much like a copy machine. In asheet-fed scanner, a single page of paper is propelled through the mechanism with rollers;the scan element is stationary. Handheld scanners are propelled by the user over the page.
Regardless of which means is used, the basic operation is the same. The scanningmechanism consists of a light source and a row of light sensors. As the light is reflectedfrom individual points on the page, it is received by the light sensors and translated todigital signals that correspond to the brightness of each point. Color filters can be used toproduce color images, either by providing multiple sensors or by scanning the image threetimes with a separate color filter for each pass. The resolution of scanners is similar to thatof printers, approximately 600–2400 points per inch.
Multimedia Devices
Despite its importance in modern systems, not much needs to be said about this topic.Most modern personal and workstation computers provide input ports with an audioanalog-to-digital converter for microphones and other audio input equipment, as well asan output converter and speakers and headphone jacks for audio output. USB ports can alsobe used for this equipment and for computer-compatible video cameras, TV tuners, andother multimedia devices.
10.9 NETWORK COMMUNICATION DEVICESIt is impossible to overemphasize the fact that, from the perspective of a computer, anetwork is simply another I/O device, a device that, like a disk, offers input to applicationson the computer and receives output from applications on the computer. Like other I/Odevices, there is a controller, in this case a network interface unit (NIU) controller ornetwork interface card (NIC) that handles the physical characteristics of the connectionand one or more I/O drivers that manage and steer input data, output data, and interrupts.
There are a number of different types of network interfaces, with different networkinterface controllers for each. On large mainframe systems, there may be network interfacecontrollers for a variety of different network connections, including various flavorsof Ethernet, FDDI fiber, token-ring, and other types. On most systems, the standardconnection is to an Ethernet network. Nearly every current computer system is suppliedwith one or more Ethernet network interface cards as a basic part of the system. WirelessEthernet and Bluetooth network interface cards are also commonplace.
336 PART THREE COMPUTER ARCHITECTURE AND HARDWARE OPERATION
The interface between a computer and a network is more complicated than that for mostother I/O peripherals. Data must be formatted in specific ways to communicate successfullywith a wide range of application and system software located on other computers. Thecomputer also must be able to address a large number of devices individually, specifically,every other computer connected to the network, whether connected directly to the localnetwork, or indirectly connected through the Internet. Unlike many device controllers,NICs must be capable of accepting requests and data from the network, independent ofthe computer, and must be able to provide interrupt notification to the computer. Securityof communication is an important concern, whereas local devices normally require onlyminimal security considerations. Many of these concerns are handled with protocol softwarein the operating system. The NIC is responsible only for the electrical signals that connectthe computer to the network, either directly or through a communication channel, and forthe protocols, implemented in hardware, that define the specific rules of communicationfor the network. These protocols are called medium access control protocols, or MACs.We note in passing that every NIC and network device throughout the world has a uniqueaddress called a MAC address that can be used to identify the specific device and itscharacteristics. The MAC address is sometimes used by cable and DSL vendors to restrictnetwork access to a specific device.
The hardware aspects of the network interface are considered more fully in Chapter 14.A deeper look at the fundamentals of networking infrastructure, including types ofnetworks, the nature of communication channels, media, the movement of data across anetwork, protocols, and the operation of the Internet, is described in Chapters 12 and 13.
SUMMARY AND REVIEW
This chapter provides an overview of the workings of the most common computerperipheral devices. Peripheral devices are classified as input devices, output devices, andstorage devices. We began by demonstrating that storage can be thought of hierarchically,with registers the most immediately available form of storage, followed by memory, andthen the various peripheral devices. We discussed the trade-offs that make each formdesirable for some purposes.
Following this general introduction, we introduced flash memory, and discussed itsapplications, strengths, and weaknesses.
Next, we showed the layout and explained the operation of various forms of disk,including hard magnetic and optical. We showed how the performance factors, capacity andvarious speed measures, are obtained. For each device we showed how a block is identifiedand located. We noted the difference between the concentric tracks used on magnetic disksand the spiral tracks used on many optical disks. We explained the difference betweenCAV and CLV operation. The discussion of disks is followed by a similar discussion formagnetic tape.
The display is the most important output device. We explained the process used toproduce a display, from the bytes in memory that represent individual pixels or charactersto the actual output on a screen. We showed that there are two different forms of output,character and graphic. We showed how colors are determined for the display. We alsoshowed the basic technology for the two methods that are used to produce an image, videoon a CRT, and liquid crystal display.
CHAPTER 10 COMPUTER PERIPHERALS 337
There are a number of different technologies used in printers. We introduced laserprinters, inkjet printers, and thermal transfer printers as representative of the mostimportant current technologies.
The chapter continues with a brief discussion of keyboards, various pointer devices,scanners, and multimedia devices that are used for input. We conclude with a briefconsideration of the network as an input/output device, a discussion to be expanded greatlyin later chapters.
FOR FURTHER READINGMuch of the discussion in this chapter reviews material that you have seen before, probablyin an introduction to computers course. Any good introductory textbook will also serve asa further reference for this chapter. In addition, there are several good books that describeI/O devices. White [WHIT05] provides straight-forward explanations of many I/O devices.Mueller [MUEL08] contains comprehensive treatments of memory, disk storage, opticaldisks, video hardware, and more.
KEY CONCEPTS AND TERMSactive matrix (LCD)average seek timebitmapped fontsblock (of data)cathode ray tube (CRT)CD-ROMconstant angular velocity
(CAV)constant linear velocity
(CLV)cylinderdata streamingdirect access storage devices
(DASDs)disk arrayDVDdrive arraydye sublimationelectron gunsencodersfault-tolerant computersfile serverflash memoryformattinggraphics tablethard disk drive
helical scan cartridgeimpact printerinkjet printerinterblock gapinterlacelaser printerlatency timelight penlinear recording cartridgeliquid crystal display
(LCD)majority logicmedium access control
(MAC)mirrored arraymountedmultiple zone recordingnetwork interface card
(NIC)network interface unit
(NIU) controlleroff-line storageOLED (organic
light-emitting diode)display
online secondary storage
outline fontsparked (position)passive matrix (LCD)peripheralsphosphorspixelsPostScriptprimary memoryprogressive scan displayraster scanredundant array of
inexpensive disks(RAID)
resolutionrotational delayrotational latency timesecondary storagesectorsseek timeservershadow maskstriped arraytext modethermal wax transfertouch screentrack
338 PART THREE COMPUTER ARCHITECTURE AND HARDWARE OPERATION
transfer timetrue colorvector scan
WORM (write-once-read-many-times)disks
zone bit recording (ZBR)zone-CAV recording
(Z-CAV)
READING REVIEW QUESTIONS10.1 Peripheral devices can be categorized into three classes. What are the three
classes? Give an example of each.
10.2 State at least three reasons why storage in a computer is organized hierarchically.
10.3 What is the advantage of flash memory over RAM? What is the advantage ofRAM over flash memory? What is the advantage of flash memory over magnetichard disk?
10.4 Draw a circle representing one platter surface of a hard disk. On your drawingshow an example of a track, of a sector, and of a block.
10.5 Draw a sector representing one platter surface of a hard disk with sixteen sectors.On your drawing show a track, the sectors, and a single block. Place a magnetichead somewhere on your drawing. Show on your drawing the seek time, latencytime, and read time for the block that you drew on the disk.
10.6 Suppose a disk is rotating at 7200 rpm. What is the minimum latency time forthis disk? What is the maximum latency time for this disk?
10.7 What is a disk array? What advantages does a disk array offer over those of asingle disk?
10.8 How does the layout of a typical optical disk differ from that of a magnetic disk?How many tracks does a standard single-layer CD-ROM contain?
10.9 What does WORM stand for when it is used to describe an optical disk?
10.10 What are the advantages and disadvantages of magnetic tape as compared toother peripheral storage devices?
10.11 What do the numbers 1920 × 1080 represent when describing a display?
10.12 How many pixels are there in a 1024 × 768 display? What is the picture ratio ofthis display?
10.13 What is true of the red, blue, and green pixel values if the color of the pixel iswhite? What if it’s black?
10.14 What is the difference between interlaced scan and progressive (or noninterlaced)scan?
10.15 Explain how a raster scan works.
10.16 What are the advantages of LCD technology over CRT technology?
10.17 What does OLED stand for? How does OLED technology differ from LCDtechnology?
10.18 What are the two types of printers in primary use today?
10.19 What is the measure used to indicate the resolution of a printer?
10.20 Name at least three user input devices in common use.
10.21 What does NIC stand for?
CHAPTER 10 COMPUTER PERIPHERALS 339
EXERCISES10.1 Explain why it is easy to perform read and write in place on a disk but not on a
tape.
10.2 What are the advantages of flash memory over hard disk storage? What are theadvantages of hard disk over flash memory storage? What are the advantagesof both hard disk and flash memory storage over RAM? What is the majoradvantage of RAM over other types of storage?
10.3 A multiplattered hard disk is divided into 1100 sectors and 40,000 cylinders.There are six platter surfaces. Each block holds 512 bytes.
The disk is rotating at a rate of 4800 rpm. The disk has an average seek time of12 msec.
a. What is the total capacity of this disk?
b. What is the disk transfer rate in bytes per second?
c. What are the minimum and maximum latency times for this disk? What isthe average latency time for this disk?
10.4 The average latency on a disk with 2200 sectors is found experimentally to be110 msec.
a. What is the rotating speed of the disk?
b. What is the transfer time for one sector?
10.5 Old fashioned twelve-inch laser video disks were produced in two differentformats, known as CAV and CLV. The playing time of a CLV disk is approximatelytwice that of a CAV disk, although the number of tracks, track width of the trackson the disk, and amount of data per video frame is the same. Explain why this isso.
10.6 An optical disk consists of two thousand concentric tracks. The disk is 5.2 inchesin diameter. The innermost track is located at a radius of 1/2 inch from thecenter. The outermost track is located 2 1/2 inches from the center. The densityof the disk is specified as 1630 bytes per inch along the track. The transfer rate isspecified as 256,000 bytes per second. The disk is CLV. All blocks are of equalsize.
a. The innermost track consists of ten blocks. How many bytes are containedin a block?
b. How many blocks would the outermost track contain?
c. The capacity of the disk is approximately equal to the capacity in bytesof the middle track times the number of tracks. What is the approximatecapacity of the disk?
d. What is the motor rotation speed when reading the innermost track? theoutermost track?
10.7 Why is the average seek time for a hard disk much shorter than for a CD-ROMor DVD-ROM?
10.8 There is a current proposal to cut the size of an individual bit in a DVD-ROMin half so as to increase the capacity of the disk. This would cut both the width
340 PART THREE COMPUTER ARCHITECTURE AND HARDWARE OPERATION
of the track and the track length required per bit in half. If the current capacityof a DVD-ROM is approximately 4.7 GB, what would be the capacity of the new‘‘high-density’’ DVD-ROM?
10.9 A typical published page consists of approximately forty lines at seventy-fivecharacters per line. How many published pages of 16-bit Unicode text would fiton a typical 600 MB CD-ROM? How many published pages of text would fit ona netbook computer with an 80 GB flash memory?
10.10 A high-quality photographic image requires 3 bytes per pixel to produce sixteenmillion shades of color.a. How large a video memory is required to store a 640 × 480 image during
display? A 1600 × 900 image? A 1440 × 1080 image?
b. How many 1024 × 768 non-compressed color images will fit on 4.7 GBDVD-ROM?
10.11 A 1024 × 768 image is displayed, noninterlaced, at a rate of thirty frames persecond.a. If the image is stored with 64K-color resolution, which uses 2 bytes per
pixel, how much memory is required to store the picture?
b. How much video memory is required to store the picture as a ‘‘true color’’image, at 3 bytes per pixel?
c. What is the transfer rate, in bytes per second, required to move the pixelsfrom video memory to the screen for the ‘‘true color’’ image?
10.12 For a motion picture image it may be necessary to change every pixel in theimage as many as thirty times per second, although usually the amount of changeis somewhat smaller. This means that without data compression or other tricksthat a large number of pixel values must be moved from main memory to videomemory each second to produce moving video images. Assume a video imageon the screen of 1 1/2′′ × 2′′, with a pixel resolution of seventy-two dots perinch and a frame rate of thirty per second. Calculate the required data transferrate necessary to produce the movie on the screen. Do the same for an image of3′′ × 4′′.
10.13 The cost of a monitor increases rapidly with increasing bandwidth. The band-width of a monitor is measured roughly as the number of pixels displayed on thescreen per second.
a. Calculate the bandwidth of a 640-pixel by 480-pixel display operating in aninterlace mode. One-half of the image is generated every 1/60th of a second.
b. Do the same for a 1920-pixel by 1080-pixel display operating in noninterlacemode. One entire image is generated every 1/60th of a second.
10.14 A 1600-pixel by 900-pixel display is generated on a 14-inch (diagonal) monitor.
a. How many dots per inch are displayed on this monitor?
b. What is the size of an individual pixel? Would a .26 mm pixel resolutionmonitor be sufficient for this display?
c. Repeat (a) and (b) for a 1280 × 720 display.
CHAPTER 10 COMPUTER PERIPHERALS 341
10.15 A text display displays 24 rows of 80 characters on a 640-pixel by 480-pixel15-inch monitor. Assuming four spaces for horizontal space between each rowof characters, how big are the characters in inches? In pixels? How big would acharacter of the same pixel size be if the display is increased to 800 × 600? Howmany rows of characters could be displayed in this case?
10.16 What is the actual resolution of a gray scale picture printed on a 600-dot-per-inchlaser printer if the gray scale is created with a 3 × 3 matrix?
10.17 In printer jargon, ‘‘replaceables’’ are the items that are used up as part of theprinting process. What are the replaceables in a laser printer? In an inkjet printer?In a dot-matrix impact printer?
10.18 Explain the difference in the method used to generate characters between graphicsmode and character mode display.
10.19 Explain the difference between pixel graphics and object graphics, and discussthe advantages and disadvantages of each.
10.20 What are the limitations of typewriter-type (formed character) printers thatcaused them to fade from popularity?