Comprehensive Annual Financial Report · We are pleased to provide you with the Comprehensive...
62
Comprehensive Annual Financial Report Fiscal Year Ended June 30, 2005 PimaCountyCommunityCollege
Transcript of Comprehensive Annual Financial Report · We are pleased to provide you with the Comprehensive...
ComprehensiveAnnual
FinancialReport
Fiscal Year Ended June 30, 2005
PimaCountyCommunityCollege

Back of Front Cover

Tucson, Arizona 85709-1220
Comprehensive Annual Financial Report
Fiscal Year Ended June 30, 2005
District Finance OfficeBudget and Reporting Department
PimaCountyCommunityCollegeDistrict4905D East Broadway Boulevard
Prepared by
Table of Contents
Table of Contents
Introductory Section
Letter of Transmittal 1 G
FOA Certificate of Achievement 7
Organization Chart 8 List of Principal Officers 9 Financial Section I ndependent Auditors’ Report 11
M
anagement’s Discussion and Analysis 12
Basic Financia
l Statements
Statement of Net Assets 20 Statement of Revenues, Expenses, and Changes in Net Assets 21
Statement of Cash Flows 22
Notes to Financial Statements 24
S
tatistical Section
P
reface 35
Revenues by Source 36 O
perating and Nonoperating Expenses 38
Property Tax Levies and Collections - Last Ten Fiscal Years 40 Assessed Va and Full Cash Value of All Taxable P
lue roperty - Last Ten Fiscal Years 41
P
roperty Tax Rates, Direct and Overlapping Governments - Last Ten Fiscal Years 42
Principal Taxpayers 43 T
op 25 Employers in Southern Arizona 44
Computation of Legal Debt Margin 45 C
omputation of Direct and Overlapping Debt 45
R
evenue Bond Coverage - Last Ten Fiscal Years 46
Student Enrollment/Demographic Statistics - Last Ten Fiscal Years 47 H
istoric Enrollment FTSE - Last Ten Fiscal Years 48
Historic Enrollment Headcount - Last Ten Fiscal Years 49 H
istoric Tuition and Fees - Last Ten Fiscal Years 50
Miscellaneous Statistics 51 Equal Education/Employment Opportunity Statement 52

PimaCountyCommunityCollege
Introductory Section

Back of Divider

1
District Office_____________________ Office of the Vice Chancellor for Finance and
Administrative Services 4905D East Broadway Boulevard
Tucson, Arizona 85709-1200 Telephone (520) 206-4519
Fax (520) 206-4882
PimaCountyCommunityCollegeDistrict November 8, 2005 The Governing Board of Pima County Community College District We are pleased to provide you with the Comprehensive Annual Financial Report (CAFR) of the Pima County Community College District (the “College”), Tucson, Arizona for the fiscal year ended June 30, 2005. To the best of our knowledge and belief, the enclosed data are accurate in all material respects, and are reported in a manner designed to present fairly the financial position, results of operations, and cash flows of the College. All disclosures necessary to enable the reader to gain an understanding of the College’s financial activities have been included. Responsibility for both the accuracy of the data, and the completeness and fairness of the presentation, including all disclosures, rests with the College. The CAFR is presented in three sections: Introductory, Financial, and Statistical. The introductory section includes this transmittal letter, the College’s organization chart, and a list of principal officers. The financial section includes the independent auditors’ report, management’s discussion and analysis of the College’s financial position (MD&A), the basic financial statements, and supplemental financial information. The statistical section includes selected unaudited financial and demographic information, generally presented on a multi-year basis. Reporting Entity The College is an independent reporting entity within the criteria established by generally accepted accounting principles (GAAP) and the Governmental Accounting Standards Board (GASB). Although the College shares the same geographic boundaries with Pima County, the College solely exercises financial accountability over all activities related to public community college education in Pima County. In accordance with GASB Statement No. 14, the financial reporting entity consists of a primary reporting entity and a component unit. The College is a primary government because it is a special purpose political subdivision that has a separately elected governing body, is legally separate, is fiscally independent of other state and local governments, and is not included in any other governmental financial reporting entity. The Pima Community College Foundation, Incorporated (the Foundation) is considered a component unit of the College and is discretely presented in the College’s financial statements in accordance with GASB Statement 39. History The voters of Pima County established Pima County Junior College District in 1966 under the provisions of legislation enacted by the Arizona State Legislature in 1960. The first governing board was elected in 1967 concurrent with the approval of a $5.9 million general obligation bond issue for the first College facilities. The name of the College was changed to Pima County Community College District in 1972. Classes were first offered in the fall of 1970 utilizing temporary quarters until the original West Campus facility on Anklam Road west of I-10 was available in January 1971. The West Campus is the largest comprehensive campus of the College and offers a variety of degree and certificate programs.

2
The Downtown Campus was opened in 1974 at Stone and Speedway to serve the central city area. The Downtown Campus offers a balance of developmental, university transfer, and occupational courses and has developed innovative instruction methods including supervised, individualized instruction with video lessons. Classes were first offered at the East Education Center in 1976 in rented facilities. The current East Campus facility, just east of Davis-Monthan Air Force Base, was opened in 1981 and substantially expanded in 1989. The East Campus offers general education, university transfer, and developmental coursework, as well as selected occupational programming. The Education Center-South was opened in 1986 to serve the south and southwest area residents in leased space, and became the comprehensive Desert Vista Campus located in a facility near Interstate 19 and Valencia Road in June of 1993. The Desert Vista Campus offers a wide range of programs and diverse courses, including university transfer, occupational, developmental, and general education. The Community Campus was opened near St. Mary’s Road and Interstate 10 in January of 1997. Community Campus classes also meet at more than 145 facilities throughout southern Arizona, including Davis-Monthan Air Force Base, and various public facilities in greater Tucson, Green Valley, Sells, Globe, Payson, and San Carlos. The Community Campus provides a wide range of courses developed to meet the diverse needs of the greater Tucson community, as defined by its residents and local businesses. Community Campus is at the center of the College’s distance education programs, offered via cable TV, interactive video, and the internet. In July 2003, the College opened the Northwest Campus located on Shannon Road between Ina and Magee. The Northwest Campus offers comprehensive educational programs including university transfer, professional, technical and developmental programs, and general interest courses. The Foundation was incorporated in the State of Arizona in 1977 as a nonprofit organization to raise funds for the purpose of providing scholarships, grants, and awards to deserving students and outstanding faculty, staff, and administration at the College. Organization and Administration The Governing Board of the College (the “Governing Board”) is comprised of five members. Each member is elected for a six-year term from one of the five precincts of the College District. The administrative staff of the College, led by the Chancellor, is responsible for the operation and administration of all College functions. Service Area Pima County (the “County”) is located in the southern portion of Arizona and encompasses an area of approximately 9,240 square miles, with a section of its boundary bordering Mexico. Approximately 60 percent of the County’s population resides in Tucson, the County seat of government, and southern Arizona’s largest city. Organized in 1864 by the Arizona Territorial Legislature as one of the State’s four original counties, the County is today the second most populous in Arizona, with a total population in excess of 800,000. The City of Tucson is the economic and transportation center of the County, as well as southern Arizona. Tucson is situated on Interstate 10 connecting Tucson with Phoenix to the north, Los Angeles to the west, and New Mexico and Texas to the east. Interstate 19 provides access to Nogales and Mexico to the south, while State Highway 86 connects with a direct route to the Gulf of California vacation areas. The main line of Union Pacific Railroad extends across Tucson to the eastern portion of the County. Tucson International Airport, located approximately 20 minutes from Tucson’s downtown business area, provides local, regional, national, and international air service through several airlines.
3
Pima County’s economy is based on a variety of service industries, as well as government employment (including public education), wholesale and retail trade, manufacturing, construction, and tourism. Figures from the Arizona Department of Economic Security as of July 2005 indicate that 418,400 persons were employed in the County, up from 415,000 in July of 2004. Economic Condition and Outlook Pima County’s economic condition continued to improve during fiscal year 2005. Employment trends were mixed with the number of jobs increasing slowly during the year, and the unemployment rate also increasing from 3.7 percent at June 30, 2004 to 4.1 percent at June 30, 2005. Retail sales increased by 8.5 percent, and total housing sales increased by 35.0 percent. Airline passenger traffic at Tucson International Airport increased by 9.2 percent from July 2004 to July 2005. During the balance of the fiscal year, the County’s economy is anticipated to be stable. Gains for 2006 are expected to be similar to those for 2005, with a 3.5 percent increase in employment, 8.0 percent for personal income, and 5.2 percent for retail sales. Based on recent economic information, prepared by the University of Arizona’s Economic and Business Research Program, Arizona’s current housing boom is expected to slow as the market assumes a pace more in line with historic growth trends. Major Program Initiatives Significant progress has been made on implementing the initiatives contained in the 2004-2006 College Plan. All seven major initiatives are on track to be completed by June 30, 2006. These initiatives are 1) to improve transfer and workforce instructional curricula and support programs, 2) to establish a developmental education program, 3) to improve college processes and operations, 4) to enhance enrollment management, 5) to develop the College’s human capital, 6) to expand institutional technological capabilities, and 7) to enhance government and external relations. Future Program Initiatives As previously mentioned, the 2004-2006 College Plan will be completed during FY 2006. Also during the next fiscal year, College administrators, led by the Chancellor, will create a College Plan for 2007-2009, with new initiatives carrying the College into the future. Fiscal Integrity and Oversight Internal Controls The College’s District Finance Office is responsible for establishing and maintaining a system of internal controls designed to ensure that the assets of the College are protected from loss, theft or misuse, and to ensure that adequate accounting data are compiled to allow for the preparation of financial statements that conform to generally accepted accounting principles. The College’s internal controls adequately safeguard assets and provide reasonable assurance of proper recording of financial transactions. The College’s Internal Auditor periodically reviews, and recommends improvements for internal controls in all operational and financial areas of the College. This position reports directly to the Chancellor. Budgetary Controls The College maintains budgetary controls and budget transfer restrictions by program (function) and account. The objective of these budgetary controls is to ensure compliance with the annual budget adopted by the
4
Governing Board. The legal level of budgetary control is at the program category level. The College also maintains an encumbrance system to set aside funds for established commitments. Open encumbrances are eliminated for fiscal year-end reporting. The College demonstrates compliance by issuance of an annual budgeted expenditure limitation report that is audited by the Auditor General. College Functions As a political subdivision of the State of Arizona, the College exercises direct tax levy authority for the generation of revenues for operating, capital equipment, and debt retirement purposes. The Governing Board sets tuition and fee levels, as well as the levy limit for the College. Cash Management and Investments The College complies with the Arizona Revised Statutes relating to the investment of idle funds. The responsibility for such investments is entrusted to the Governing Board and facilitated through the District Finance Office. College funds are deposited with local financial institutions. Amounts that are not needed for current operations are invested in the Local Government Investment Pool (LGIP) and in federal and federally-sponsored agency securities. Risk Management College operations include a risk management function that endeavors to minimize the probability of loss through risk identification and analysis. Risk is reduced through the implementation of activities such as safety and loss control programs, the utilization of risk financing, and transfer techniques including contract terms and the purchase of insurance. Independent Audit The Office of the Auditor General for the State of Arizona conducts the annual financial audit for the College. Testing procedures determine whether the financial statements are free of material misstatement, and ensure compliance with Arizona Revised Statutes that require an annual audit of the College’s financial statements. The Auditor General’s Independent Auditors’ Report is included in this document. For the fiscal year ending June 30, 2005, the College received an unqualified opinion. A local independent accounting firm conducts the annual financial audit for the Foundation. The Foundation also received an unqualified opinion for the fiscal year ending June 30, 2005. GFOA Certificate of Achievement The Government Finance Officers Association of the United States and Canada (GFOA) awarded a Certificate of Achievement for Excellence in Financial Reporting to the Pima County Community College District for its comprehensive annual financial report (CAFR) for the fiscal year ended June 30, 2004. This was the thirteenth consecutive year that the College has received this prestigious award. In order to be awarded a Certificate of Achievement, a government must publish an easily readable and efficiently organized CAFR. This report must satisfy both generally accepted accounting principles and applicable legal requirements. A Certificate of Achievement is valid for a period of one year. The current CAFR continues to meet the

5
Certificate of Achievement Program’s requirements and will be submitted to the GFOA to determine its eligibility for another certificate. Acknowledgements We would like to express our appreciation for our Board members, who volunteer their time and expertise on a regular basis to guide the vision of the College. The mission of the College could not be achieved without the Chancellor’s leadership through the College Plan. We would also like to express our appreciation to the Office of the Auditor General and our independent auditors for the timely completion of the audit. The preparation of this report could not be accomplished without the efficient and dedicated efforts of the District Finance Office, and all those who contributed to the preparation of this report. Respectfully submitted,
Janice M. Stroh, MBA David W. Bea, Ph.D. Vice Chancellor, Finance and Assistant Vice Chancellor Administrative Services for Finance

This page intentionally left blank

GFOA Certificate of Achievement
7

Board of Govenors
Chancellor
Vice Chancellor for Government
and External Relations
Provost and Executive Vice Chancellor for
Academic Services
Campus Presidents
Executive Vice Chancellor for
Human Resources and Institutional
Effectiveness
Vice Chancellor for Finance and Administrative
Services
Vice Chancellor for
Information Technology
Community Campus
Desert Vista Campus
Downtown Campus
East Campus
Northwest Campus
West Campus
Assistant Vice Chancellor Academic Services
Assistant Vice
Chancellor Student Services
Assistant Vice Chancellor Marketing
Assistant Vice Chancellor
Human Resources
Assistant Vice Chancellor Financial
Operations
Assistant Vice Chancellor Facilities
Organization Chart
8
List of Principal Officers
9
Pima County Community College District
Governing Board Members
Sherryn S. Marshall, Chair, District 3 Marty Cortez, Secretary, District 5 Brenda B. Even, Member, District 1
Richard G. Fimbres, Member, District 2 Scott A. Stewart, Member, District 4
List of Principal Officers
College Administration
Roy Flores, Chancellor
John Gabusi, Vice Chancellor for Government and External Relations Suzanne L. Miles, Provost and Executive Vice Chancellor for Academic Services
Charlotte A. Fugett, Executive Vice Chancellor for Human Resources and Institutional Effectiveness
Janice M. Stroh, Vice Chancellor for Finance and Administrative Services Kirk Kelly, Acting Vice Chancellor for Information Technology
David Padgett, Acting Assistant Vice Chancellor, Academic Services
Shelley J. Fortin, Assistant Vice Chancellor, Student Services Lynne Wakefield, Assistant Vice Chancellor, Marketing
Jack Redavid, Assistant Vice Chancellor, Human Resources David Bea, Assistant Vice Chancellor, Financial Operations
Paul Smith, Assistant Vice Chancellor, Facilities
Campus Administration
Jana B. Kooi, President, Community Campus Richard Durán, President, Desert Vista Campus
Johnson Bia, President, Downtown Campus Raul Ramirez, President, East Campus
Anne-Marie McCartan, President, Northwest Campus Louis S. Albert, President, West Campus

This page intentionally left blank

PimaCountyCommunityCollege
Financial Section

Back of Divider
Independent Auditors’ Report
Members of the Arizona State Legislature
The Governing Board ofPima County Community College District
We have audited the accompanying financial statements of the business-type activities and discretely presented component unit of PimaCounty Community College District as of and for the year ended June 30, 2005, which collectively comprise the District’s basic financial state-ments as listed in the table of contents. These financial statements are the responsibility of the District's management. Our responsibility isto express opinions on these financial statements based on our audit. We did not audit the financial statements of the discretely presentedcomponent unit. Those financial statements were audited by other auditors whose report thereon has been furnished to us, and our opinion,insofar as it relates to the amounts for the discretely presented component unit, is based solely on the report of the other auditors.
We conducted our audit in accordance with U.S. generally accepted auditing standards and the standards applicable to financial audits con-tained in Government Auditing Standards, issued by the Comptroller General of the United States. Those standards require that we plan andperform the audit to obtain reasonable assurance about whether the financial statements are free of material misstatement. The financialstatements of the discretely presented component unit were not audited by the other auditors in accordance with Government AuditingStandards. An audit includes examining, on a test basis, evidence supporting the amounts and disclosures in the financial statements. An auditalso includes assessing the accounting principles used and significant estimates made by management, as well as evaluating the overall finan-cial statement presentation. We believe that our audit and the report of the other auditors provide a reasonable basis for our opinions.
In our opinion, based on our audit and the report of the other auditors, the financial statements referred to above present fairly, in all mate-rial respects, the respective financial position of the business-type activities and discretely presented component unit of Pima CountyCommunity College District as of June 30, 2005, and the respective changes in financial position and cash flows, where applicable, thereof forthe year then ended in conformity with U.S. generally accepted accounting principles.
As described in Note 1, the District implemented the provisions of Governmental Accounting Standards Board (GASB) Statement No. 40,Deposit and Investment Risk Disclosures, for the year ended June 30, 2005, which represents a change in accounting principle.
The Management’s Discussion and Analysis on pages 12 through 17 is not a required part of the basic financial statements but is supplemen-tary information required by the Governmental Accounting Standards Board. We have applied certain limited procedures, which consistedprincipally of inquiries of management regarding the methods of measurement and presentation of the required supplementary informa-tion. However, we did not audit the information and express no opinion on it.
Our audit was conducted for the purpose of forming opinions on the financial statements that collectively comprise the District’s basic finan-cial statements. The introductory and statistical sections listed in the table of contents are presented for purposes of additional analysis andare not a required part of the basic financial statements. That information has not been subjected to the auditing procedures applied in ouraudit of the basic financial statements and, accordingly, we express no opinion on them.
In accordance with Government Auditing Standards, we have also issued our report dated November 8, 2005, on our consideration of theDistrict's internal control over financial reporting and on our tests of its compliance with certain provisions of laws, regulations, contracts,and grant agreements and other matters. The purpose of that report is to describe the scope of our testing of internal control over financialreporting and compliance and the results of that testing, and not to provide an opinion on internal control over financial reporting or oncompliance. That report is an integral part of an audit performed in accordance with Government Auditing Standards and should be consid-ered in assessing the results of our audit.
Debbie DavenportAuditor General
November 8, 2005
12
Management’s Discussion and Analysis
This section of the College’s Comprehensive Annual Financial Report presents management’s discussion and analysis of the College’s financial activity for the fiscal year ended June 30, 2005. Please read it in conjunction with the transmittal letter on page 1 and the financial statements and accompanying notes, which begin on page 20. Basic Financial Statements The College’s annual financial statements are presented in accordance with the Governmental Accounting Standards Board (GASB) Statement No. 34, “Basic Financial Statements—and Management’s Discussion and Analysis—for State and Local Governments,” and Statement No. 35, “Basic Financial Statements—and Management’s Discussion and Analysis— for Public Colleges and Universities.” These statements allow for the presentation of financial activity and balances in a consolidated, single-column, entity-wide format. The Foundation’s activity is presented in a separate column for each statement, except for the Statement of Cash Flows, in which the Foundation’s activity was not presented as per the GASB rules stated above. The Statement of Net Assets presents the financial position of the College as of June 30, 2005. It reflects the various assets owned or controlled by the College and the Foundation, the related liabilities and other obligations, and the various categories of net assets. “Net assets” is an accounting concept defined as total assets less total liabilities, and represents the organization’s equity or ownership in the total assets of the District. The Statement of Revenues, Expenses, and Changes in Net Assets presents the College’s and Foundation’s results of operations for the fiscal year. It reflects the various types of revenues and expenses, both operating and nonoperating, and links the year’s results of operations back to the Statement of Net Assets by reconciling the beginning of the year net assets amount to the end of the year net assets amount. The Statement of Cash Flows presents the inflows and outflows of cash and cash equivalents for the fiscal year. Cash flows are segregated by type and activity into the following categories: operating activities, noncapital financing activities, capital and related financing activities, and investing activities. Cash flows from operating activities are reconciled to operating income/loss on the Statement of Revenues, Expenses, and Changes in Net Assets described above. The primary focus of this report is on the primary government’s overall financial position, financial condition, and results of operations and cash flows for the fiscal year ended June 30, 2005. Comparative information from the previous fiscal year is shown in the condensed financial information so that readers may see where the College’s financial performance may have changed. The College’s beginning net assets and prior year capital asset amounts were restated to correct an overstatement of capital assets that occurred in a prior year. Please see Note 9 for more information.

13
Management’s Discussion and Analysis
Condensed Financial Information
Statement of Net AssetsAs of As of
June 30, 2005 June 30, 2004 % Change(as restated, see Note 9)
AssetsCurrent Assets $ 71,362,953 $ 65,591,257 8.8%Noncurrent Assets – Restricted 3,574,603 4,410,856 -19.0%Capital Assets, net 156,489,179 155,881,918 0.4%Other Noncurrent Assets 5,937,230 7,928,107 -25.1% Total Assets 237,363,965 233,812,138 1.5%
LiabilitiesCurrent Liabilities 17,321,908 16,633,734 4.1%Noncurrent Liabilities 84,438,235 91,405,548 -7.6% Total Liabilities 101,760,143 108,039,282 -5.8%
Net AssetsInvested in Capital Assets (net of related debt) 73,154,179 65,793,564 11.2%Restricted Net Assets 6,879,630 6,644,750 3.5%Unrestricted Net Assets 55,570,013 53,334,542 4.2% Total Net Assets $135,603,822 $125,772,856 7.8%
Statement of Revenues, Expenses, and Changes in Net Assets
For the year For the yearended ended
June 30, 2005 June 30, 2004 % ChangeOperating RevenuesTuition and Fees (net of allowances) $ 24,569,880 $ 23,923,443 2.7%Grants and Contracts 32,822,422 31,659,880 3.7%Other Operating Revenues 2,687,745 2,478,027 8.5% Total Operating Revenues 60,080,047 58,061,350 3.5%
Total Operating Expenses 144,992,424 138,826,881 4.4%
Operating Loss (84,912,377) (80,765,531) 5.1%
Nonoperating Revenues (Expenses)Property Taxes 71,646,214 76,808,328 -6.7%State Appropriations 19,593,500 18,125,700 8.1%Investment Income 1,974,152 954,530 106.8%Other Nonoperating Revenues 2,628,319 2,591,567 1.4%Interest on Capital Asset-Related Debt (4,346,303) (4,732,158) -8.2%Loss on Capital Asset Disposal (101,565) (138,012) -26.4%Other Nonoperating Expenses - (49,539) -100.0% Net Nonoperating Revenues 91,394,317 93,560,416 -2.3%
Excess Before Capital Appropriations, Gifts and Grants 6,481,940 12,794,885 -49.3%
Capital Appropriations, Gifts and Grants 3,349,026 3,984,026 -15.9%
Increase in Net Assets 9,830,966 16,778,911 -41.4%Net Assets, beginning of year (as restated, see Note 9) 125,772,856 108,993,945 15.4%Net Assets, end of year (as restated, see Note 9) $135,603,822 $125,772,856 7.8%
14
Management’s Discussion and Analysis
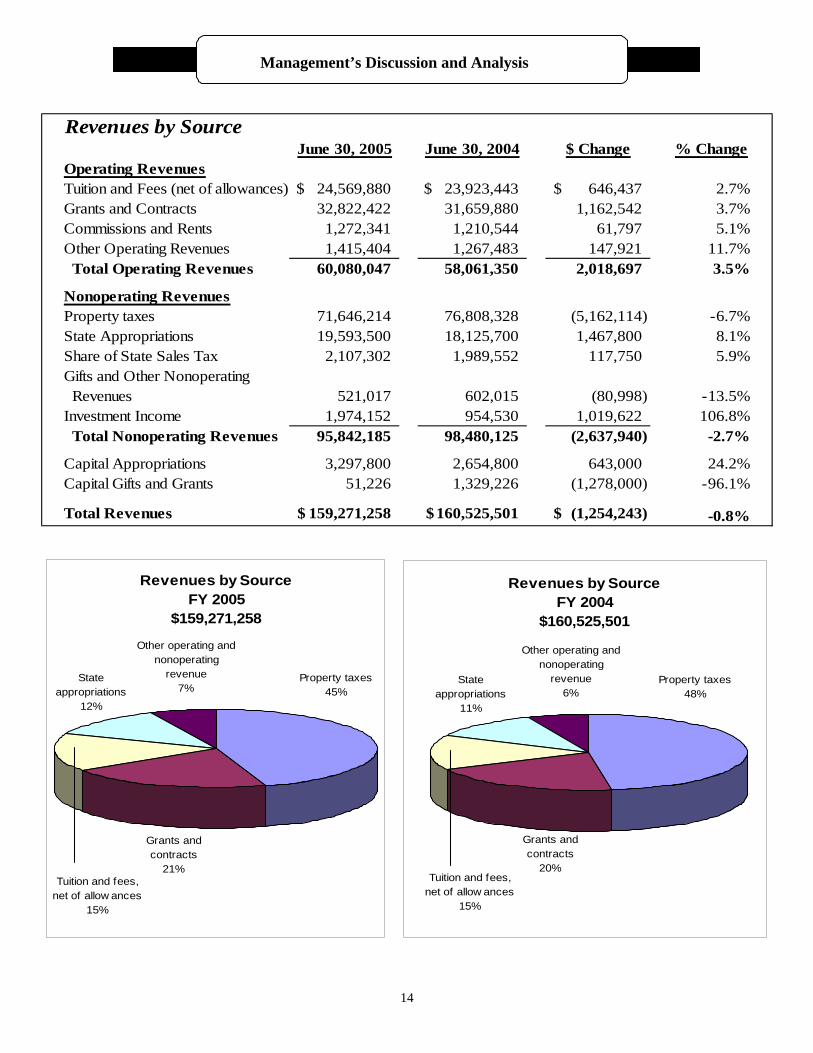
Revenues by SourceJune 30, 2005 June 30, 2004 $ Change % Change
Operating RevenuesTuition and Fees (net of allowances) $ 24,569,880 $ 23,923,443 646,437$ 2.7%Grants and Contracts 32,822,422 31,659,880 1,162,542 3.7%Commissions and Rents 1,272,341 1,210,544 61,797 5.1%Other Operating Revenues 1,415,404 1,267,483 147,921 11.7% Total Operating Revenues 60,080,047 58,061,350 2,018,697 3.5%
Nonoperating RevenuesProperty taxes 71,646,214 76,808,328 (5,162,114) -6.7%State Appropriations 19,593,500 18,125,700 1,467,800 8.1%Share of State Sales Tax 2,107,302 1,989,552 117,750 5.9%Gifts and Other Nonoperating Revenues 521,017 602,015 (80,998) -13.5%Investment Income 1,974,152 954,530 1,019,622 106.8% Total Nonoperating Revenues 95,842,185 98,480,125 (2,637,940) -2.7%
Capital Appropriations 3,297,800 2,654,800 643,000 24.2%Capital Gifts and Grants 51,226 1,329,226 (1,278,000) -96.1%
Total Revenues 159,271,258$ 160,525,501$ (1,254,243)$ -0.8%
Revenues by SourceFY 2005
$159,271,258
State appropriations
12%
Grants and contracts
21%Tuition and fees,
net of allow ances15%
Other operating and nonoperating
revenue7%
Property taxes45%
Revenues by Source FY 2004
$160,525,501
Other operating and nonoperating
revenue6%
State appropriations
11%
Grants and contracts
20%Tuition and fees,
net of allow ances15%
Property taxes48%

15
Management’s Discussion and Analysis
Expenses by CategoryJune 30, 2005 June 30, 2004 $ Change % Change
Operating ExpensesEducational and General Instruction $ 51,458,514 $ 49,763,342 $1,695,172 3.4% Academic Support 20,353,720 19,288,581 1,065,139 5.5% Student Services 15,850,844 14,993,217 857,627 5.7% Institutional Support 20,612,824 19,126,135 1,486,689 7.8% Operation and Maintenance of Plant 13,299,786 13,391,180 (91,394) -0.7% Student Financial Aid 13,827,818 13,874,635 (46,817) -0.3%Auxiliary Enterprises 405,840 400,314 5,526 1.4%Depreciation 9,183,078 7,989,477 1,193,601 14.9% Total Operating Expenses 144,992,424 138,826,881 6,165,543 4.4%
Nonoperating ExpensesInterest on Capital Asset-Related Debt 4,346,303 4,732,158 (385,855) -8.2%Loss on Capital Asset Disposal 101,565 138,012 (36,447) -26.4%Other Nonoperating Expenses - 49,539 (49,539) -100.0% Total Nonoperating Expenses 4,447,868 4,919,709 (471,841) -9.6%
Total Expenses 149,440,292$ 143,746,590$ 5,693,702$ 4.0%
Expenses by CategoryFY 2005
$149,440,292
Student f inancial aid
9%
Academic support
14%
Student services
11%
Institutional support
14%Operation and maintenance of
plant9%
Depreciation6%
Other operating and
nonoperating expenses
3%Instruction
34%
Expenses by CategoryFY 2004
$143,746,590
Instruction35%
Other operating and
nonoperating expenses
4%
Depreciation6%
Student f inancial aid
10%
Institutional support
13%
Academic support
13%
Student services
10%
Operation and maintenance of
plant9%

16
Management’s Discussion and Analysis
Financial Highlights and Analysis The College’s overall financial position improved in fiscal year 2005 with total net assets increasing by $ 9.8 million. The increase in net assets is primarily due to the completion of major facility renovations and operational results. The increase in net assets is lower than in the fiscal year 2004, in which net assets increased by $16.8 million. Compared to the prior year, revenues decreased by $1.3 million, while expenses increased by $5.7 million. The College continues to have sufficient reserves to meet all current obligations. Compared to the prior year, tuition and fees revenue increased due to the addition of a student services fee of $2.50 per credit hour. State appropriations increased by $1.5 million. Grants and contracts increased by $1.2 million due to increases in Pell grants. Investment income increased by $1.0 million primarily due to higher interest rates earned on investments during the year on a larger principal balance than the previous year. Two categories offset these revenue increases and produced the overall revenue decline versus the prior year: 1) property taxes decreased by $5.2 million due to a reduction in the secondary levy for the retirement of debt; and 2) capital gifts and grant revenue decreased by $1.3 million as fiscal year 2004 included a significant one-time gift. All operating expense categories, except student financial aid and operation and maintenance of plant, increased. These changes are primarily due to increased salaries and benefits for all employee groups, renovation projects completed during the year, and depreciation expenses due to the addition of new equipment. Capital Assets and Debt Administration During the 2005 fiscal year, construction was completed on two major projects: the East Campus Clemens Center renovation and the Desert Vista Campus recreational field improvements. These transactions, combined with purchases of computer enhancements and other equipment, brought the College’s total investment in capital assets to $156.5 million, which is less than a one percent increase over the prior year. Please see Note 3 to the basic financial statements on page 29 for additional information on capital asset activity and descriptions of asset categories. During fiscal year 2005, the College entered into a lease-purchase agreement for $5.1 million to acquire a building at the Northwest Campus to accommodate higher than expected enrollment. In addition, $11.6 million was paid to reduce outstanding principal on long-term debt. At June 30, 2005, the College had seven outstanding debt issues totaling $83.3 million. Note 4 to the basic financial statements shows additional detail on bond issues and long-term obligations. Economic Outlook For the year ended June 30, 2005, the economic conditions in Pima County continued to improve while the demand from the community for educational services remained fairly steady with full-time student equivalent enrollment (FTSE) decreasing very slightly. A

17
Management’s Discussion and Analysis
comprehensive planning process was completed during the year to focus efforts on the “one college, one vision” concept and improve services to students. Slight enrollment increases are projected for the coming year. In fiscal year 2006, the College will increase the tuition rate from $42 to $44, which will result in increased revenues. State appropriations are expected to remain at the fiscal year 2005 level, but a slight increase in capital appropriations is expected. Increased property values in Pima County will result in decreases in the tax rates both for operations and for debt retirement for fiscal year 2006, but tax revenues for operations will increase. The strength of the local economy and the revenue increases from property taxes and other sources, combined with the increase in net assets for the year ended June 30, 2005, will result in a strong financial base for the College going into the future. Requests for Information This discussion and analysis is designed to present a general overview of the Pima County Community College District’s finances for all those who have an interest in such matters. Questions concerning any of the information provided in this Comprehensive Annual Financial Report or requests for additional financial information should be addressed to the District Finance Office, Pima County Community College District, 4905D East Broadway Blvd., Tucson, AZ, 85709-1200.

This page intentionally left blank

Basic Financial Statements
Primary Government Component Unit
College Foundation
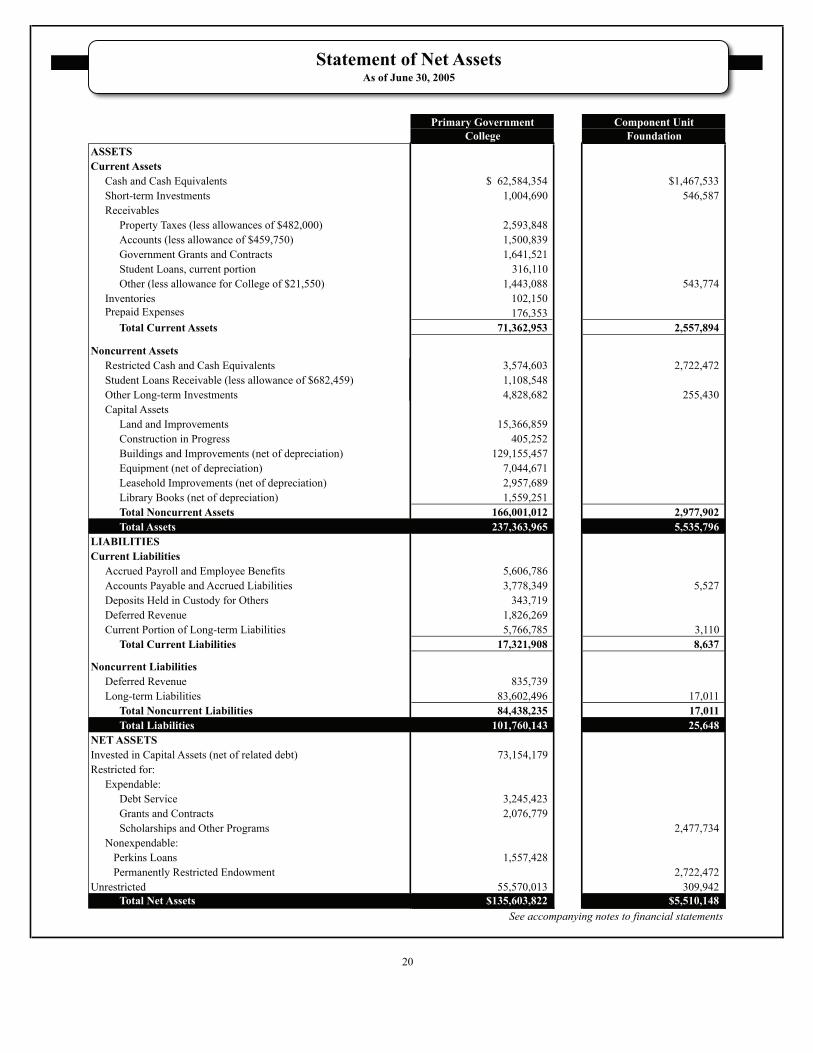
ASSETS
Current Assets
Cash and Cash Equivalents $ 62,584,354 $1,467,533
Short-term Investments 1,004,690 546,587
Receivables
Property Taxes (less allowances of $482,000) 2,593,848
Accounts (less allowance of $459,750) 1,500,839
Government Grants and Contracts 1,641,521
Student Loans, current portion 316,110
Other (less allowance for College of $21,550) 1,443,088 543,774
Inventories 102,150
Prepaid Expenses 176,353
Total Current Assets 71,362,953 2,557,894
Noncurrent Assets
Restricted Cash and Cash Equivalents 3,574,603 2,722,472
Student Loans Receivable (less allowance of $682,459) 1,108,548
Other Long-term Investments 4,828,682 255,430
Capital Assets
Land and Improvements 15,366,859
Construction in Progress 405,252
Buildings and Improvements (net of depreciation) 129,155,457
Equipment (net of depreciation) 7,044,671
Leasehold Improvements (net of depreciation) 2,957,689
Library Books (net of depreciation) 1,559,251
Total Noncurrent Assets 166,001,012 2,977,902
Total Assets 237,363,965 5,535,796
LIABILITIES
Current Liabilities
Accrued Payroll and Employee Benefits 5,606,786
Accounts Payable and Accrued Liabilities 3,778,349 5,527
Deposits Held in Custody for Others 343,719
Deferred Revenue 1,826,269
Current Portion of Long-term Liabilities 5,766,785 3,110
Total Current Liabilities 17,321,908 8,637
Noncurrent Liabilities
Deferred Revenue 835,739
Long-term Liabilities 83,602,496 17,011
Total Noncurrent Liabilities 84,438,235 17,011
Total Liabilities 101,760,143 25,648
NET ASSETS
Invested in Capital Assets (net of related debt) 73,154,179
Restricted for:
Expendable:
Debt Service 3,245,423
Grants and Contracts 2,076,779
Scholarships and Other Programs 2,477,734
Nonexpendable:
Perkins Loans 1,557,428
Permanently Restricted Endowment 2,722,472
Unrestricted 55,570,013 309,942
Total Net Assets $135,603,822 $5,510,148
See accompanying notes to financial statements
Statement of Net AssetsAs of June 30, 2005
20
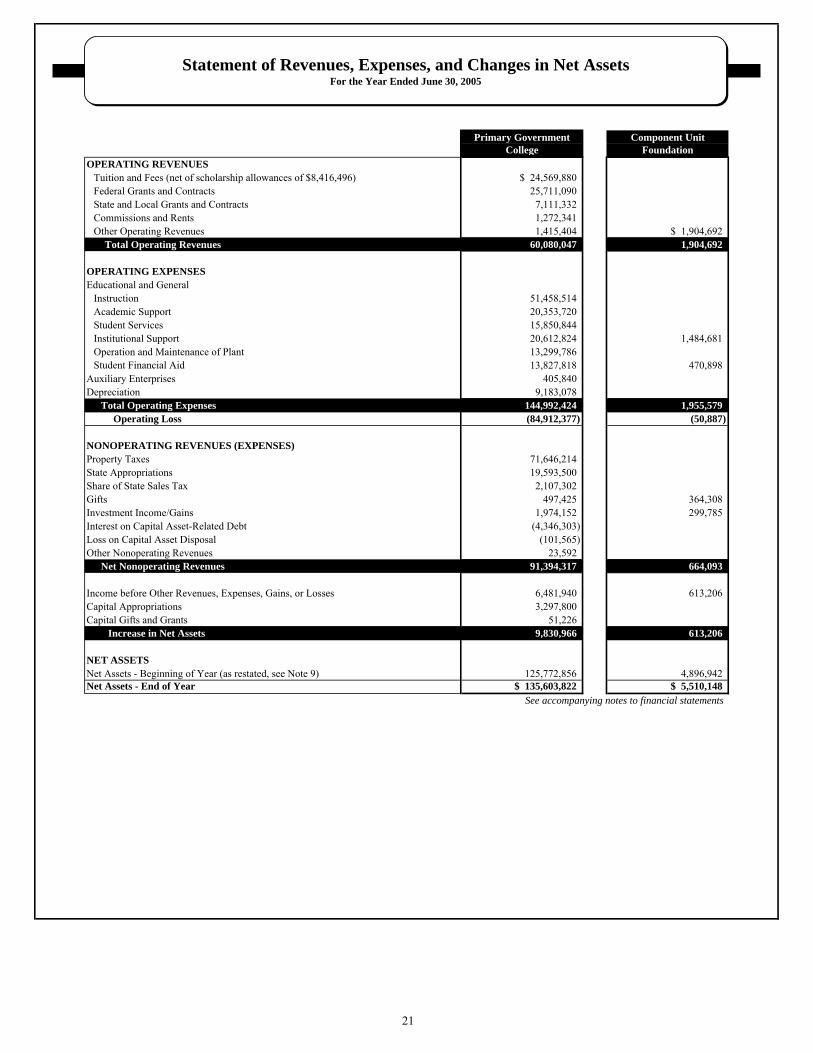
Primary Government Component UnitCollege Foundation
OPERATING REVENUESTuition and Fees (net of scholarship allowances of $8,416,496) $ 24,569,880Federal Grants and Contracts 25,711,090State and Local Grants and Contracts 7,111,332Commissions and Rents 1,272,341Other Operating Revenues 1,415,404 $ 1,904,692
Total Operating Revenues 60,080,047 1,904,692
OPERATING EXPENSESEducational and General
Instruction 51,458,514Academic Support 20,353,720Student Services 15,850,844Institutional Support 20,612,824 1,484,681Operation and Maintenance of Plant 13,299,786Student Financial Aid 13,827,818 470,898
Auxiliary Enterprises 405,840Depreciation 9,183,078
Total Operating Expenses 144,992,424 1,955,579 Operating Loss (84,912,377) (50,887)
NONOPERATING REVENUES (EXPENSES)Property Taxes 71,646,214State Appropriations 19,593,500Share of State Sales Tax 2,107,302Gifts 497,425 364,308Investment Income/Gains 1,974,152 299,785Interest on Capital Asset-Related Debt (4,346,303)Loss on Capital Asset Disposal (101,565)Other Nonoperating Revenues 23,592
Net Nonoperating Revenues 91,394,317 664,093
Income before Other Revenues, Expenses, Gains, or Losses 6,481,940 613,206Capital Appropriations 3,297,800Capital Gifts and Grants 51,226
Increase in Net Assets 9,830,966 613,206
NET ASSETSNet Assets - Beginning of Year (as restated, see Note 9) 125,772,856 4,896,942Net Assets - End of Year $ 135,603,822 $ 5,510,148
See accompanying notes to financial statements
Statement of Revenues, Expenses, and Changes in Net AssetsFor the Year Ended June 30, 2005
21
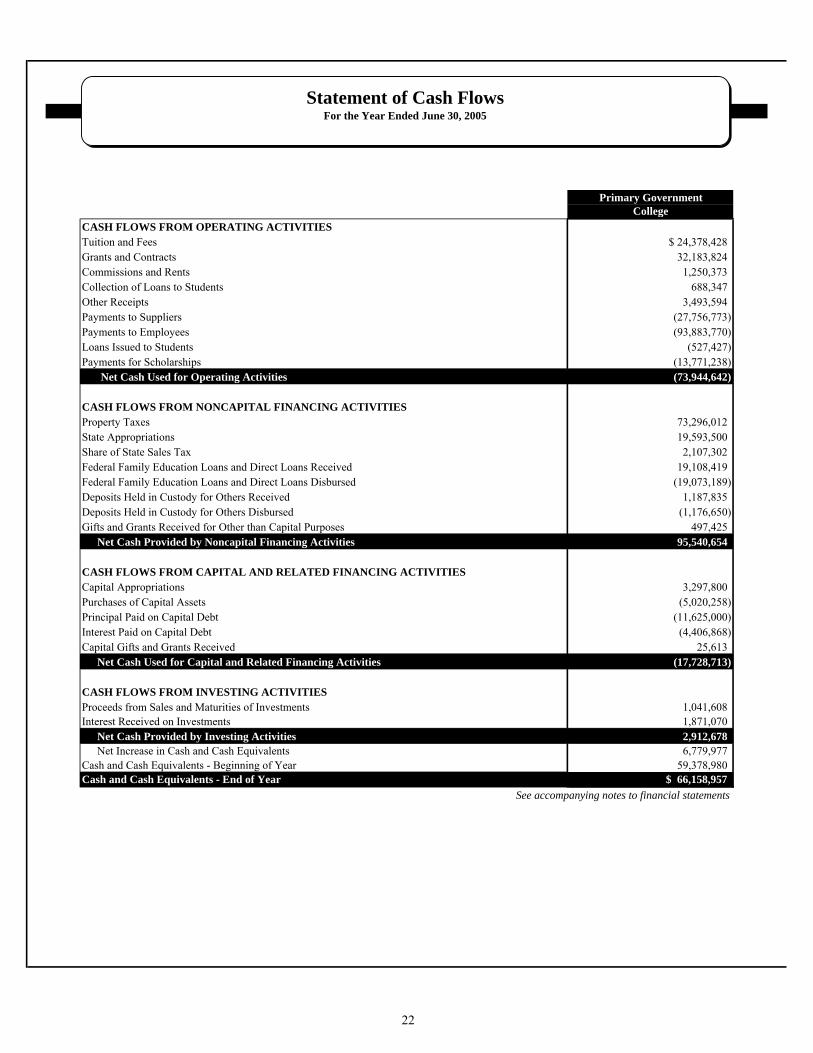
Primary GovernmentCollege
CASH FLOWS FROM OPERATING ACTIVITIESTuition and Fees $ 24,378,428Grants and Contracts 32,183,824 Commissions and Rents 1,250,373 Collection of Loans to Students 688,347 Other Receipts 3,493,594 Payments to Suppliers (27,756,773) Payments to Employees (93,883,770) Loans Issued to Students (527,427) Payments for Scholarships (13,771,238)
Net Cash Used for Operating Activities (73,944,642)
CASH FLOWS FROM NONCAPITAL FINANCING ACTIVITIESProperty Taxes 73,296,012 State Appropriations 19,593,500Share of State Sales Tax 2,107,302 Federal Family Education Loans and Direct Loans Received 19,108,419 Federal Family Education Loans and Direct Loans Disbursed (19,073,189) Deposits Held in Custody for Others Received 1,187,835 Deposits Held in Custody for Others Disbursed (1,176,650) Gifts and Grants Received for Other than Capital Purposes 497,425
Net Cash Provided by Noncapital Financing Activities 95,540,654
CASH FLOWS FROM CAPITAL AND RELATED FINANCING ACTIVITIESCapital Appropriations 3,297,800Purchases of Capital Assets (5,020,258) Principal Paid on Capital Debt (11,625,000) Interest Paid on Capital Debt (4,406,868) Capital Gifts and Grants Received 25,613
Net Cash Used for Capital and Related Financing Activities (17,728,713)
CASH FLOWS FROM INVESTING ACTIVITIESProceeds from Sales and Maturities of Investments 1,041,608Interest Received on Investments 1,871,070
Net Cash Provided by Investing Activities 2,912,678Net Increase in Cash and Cash Equivalents 6,779,977
Cash and Cash Equivalents - Beginning of Year 59,378,980 Cash and Cash Equivalents - End of Year $ 66,158,957
See accompanying notes to financial statements
Statement of Cash FlowsFor the Year Ended June 30, 2005
22

Primary GovernmentCollege
RECONCILIATION OF OPERATING LOSS TO NET CASH USED FOR OPERATING ACTIVITIES Operating Loss $ (84,912,377)
Adjustments to Reconcile Operating Loss to Net Cash Used for Operating Activities:Depreciation Expense 9,183,078 Changes in Assets and Liabilities:
Decrease in Receivables, Net 1,273,229 Decrease in Inventories 16,988 Increase in Prepaid Expenses (30,456) Increase in Accrued Payroll and Employee Benefits 248,784 Decrease in Accounts Payable and Accrued Liabilities (24,193) Increase in Deferred Revenue 26,318 Increase in Long-term Liabilities (Compensated Absences Portion) 273,987
Net Cash Used for Operating Activities $ (73,944,642)
Nonoperating Non-cash Transactions Not Included in Above Statement:Unrealized Change in Fair Value of Investments $ 21,768Disposals of Capital Assets $ (101,565)Construction Contract Retention Investments Returned $ (213,354)
See accompanying notes to financial statements
Statement of Cash Flows (continued)For the Year Ended June 30, 2005
23
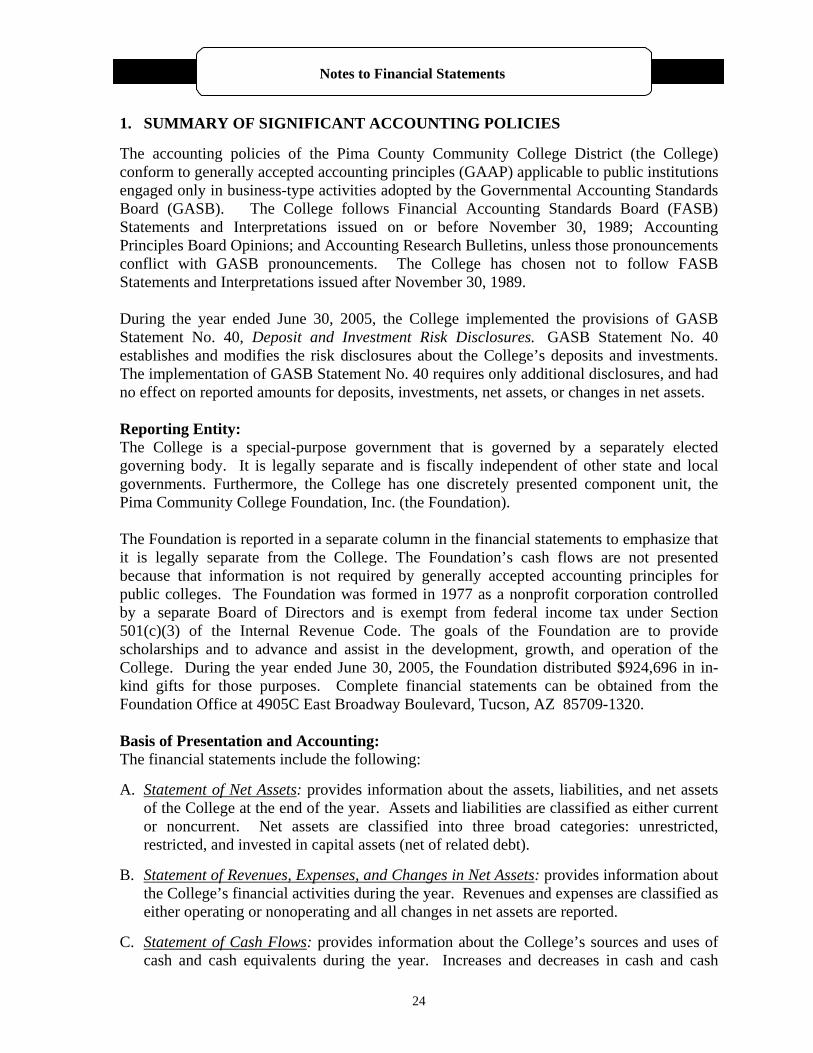
Notes to Financial Statements
1. SUMMARY OF SIGNIFICANT ACCOUNTING POLICIES The accounting policies of the Pima County Community College District (the College) conform to generally accepted accounting principles (GAAP) applicable to public institutions engaged only in business-type activities adopted by the Governmental Accounting Standards Board (GASB). The College follows Financial Accounting Standards Board (FASB) Statements and Interpretations issued on or before November 30, 1989; Accounting Principles Board Opinions; and Accounting Research Bulletins, unless those pronouncements conflict with GASB pronouncements. The College has chosen not to follow FASB Statements and Interpretations issued after November 30, 1989. During the year ended June 30, 2005, the College implemented the provisions of GASB Statement No. 40, Deposit and Investment Risk Disclosures. GASB Statement No. 40 establishes and modifies the risk disclosures about the College’s deposits and investments. The implementation of GASB Statement No. 40 requires only additional disclosures, and had no effect on reported amounts for deposits, investments, net assets, or changes in net assets. Reporting Entity: The College is a special-purpose government that is governed by a separately elected governing body. It is legally separate and is fiscally independent of other state and local governments. Furthermore, the College has one discretely presented component unit, the Pima Community College Foundation, Inc. (the Foundation). The Foundation is reported in a separate column in the financial statements to emphasize that it is legally separate from the College. The Foundation’s cash flows are not presented because that information is not required by generally accepted accounting principles for public colleges. The Foundation was formed in 1977 as a nonprofit corporation controlled by a separate Board of Directors and is exempt from federal income tax under Section 501(c)(3) of the Internal Revenue Code. The goals of the Foundation are to provide scholarships and to advance and assist in the development, growth, and operation of the College. During the year ended June 30, 2005, the Foundation distributed $924,696 in in-kind gifts for those purposes. Complete financial statements can be obtained from the Foundation Office at 4905C East Broadway Boulevard, Tucson, AZ 85709-1320. Basis of Presentation and Accounting: The financial statements include the following: A. Statement of Net Assets: provides information about the assets, liabilities, and net assets
of the College at the end of the year. Assets and liabilities are classified as either current or noncurrent. Net assets are classified into three broad categories: unrestricted, restricted, and invested in capital assets (net of related debt).
B. Statement of Revenues, Expenses, and Changes in Net Assets: provides information about
the College’s financial activities during the year. Revenues and expenses are classified as either operating or nonoperating and all changes in net assets are reported.
C. Statement of Cash Flows: provides information about the College’s sources and uses of
cash and cash equivalents during the year. Increases and decreases in cash and cash
24

Notes to Financial Statements
equivalents are classified as operating, noncapital financing, capital and related financing, or investing.
The financial statements are presented using the economic resources measurement focus and the accrual basis of accounting. Revenues are recorded when earned and expenses are recorded at the time liabilities are incurred, regardless of when the related cash flows take place. Operating revenues are generated from providing instructional services (i.e., tuition and grants). Other revenues, such as property taxes and State appropriations, are not generated from operations and are therefore classified as nonoperating revenues. Property taxes are recognized in the year they are levied. State appropriations are recognized as revenue in the year the appropriation is first made available for use. Grants and donations are recognized as revenue when all eligibility requirements imposed by the provider have been met. The College eliminates all internal activity. Operating expenses are costs incurred to provide instructional services including support costs, auxiliary services, and depreciation of capital assets. All expenses not meeting this definition are reported as nonoperating expenses. It is the College’s policy to first apply restricted resources when an expense is incurred for purposes for which both restricted and unrestricted assets are available. Cash and Investments: The College’s cash and cash equivalents consist of cash on hand, demand deposits, cash and investments held by the County Treasurer, investments in the State Treasurer’s Local Government Investment Pool (LGIP), and highly liquid investments. All investments are stated at fair value at fiscal year-end. Inventories: The physical plant inventories are valued at cost or estimated cost by specific identification. General stores inventory is valued at cost using the weighted-average method. Capital Assets: Capital assets are recorded at cost at the date of acquisition. Donated capital assets are reported at estimated fair value at the date of donation. All capital assets with a cost of $5,000 or more are capitalized. Interest expense incurred during the construction phase of the College’s facilities is capitalized as a cost of plant assets in accordance with generally accepted accounting principles. Assets (except land and improvements and construction in progress) are depreciated using the straight-line method, using one full year’s depreciation in the first year and no depreciation in the year of disposal. For purposes of calculating depreciation, buildings and improvements are assigned useful lives of 5 to 40 years, equipment is assigned useful lives of 5 to 7 years, and library books are assigned useful lives of 10 years. Leasehold improvements are depreciated over the lease period. Compensated Absences: Compensated absences consist of annual leave and a calculated amount of sick leave earned by employees based on services already rendered.
25

Notes to Financial Statements
Employees may accumulate up to 315 hours of annual leave depending on years of service and employee group classification. Annual leave is accumulated by each employee on a prorated basis, every two weeks. Annual leave balances are accrued as a liability on the financial statements due to the fact that they are paid to the employee upon separation from the College. Sick leave, providing for ordinary sick pay, is cumulative (up to 1,350 hours) and vests after 10 years of continuous service for regular employees who retire from the College under the provisions of the Arizona State Retirement System. Vested sick leave is payable to College employees upon retirement at a rate of 75 percent of the employee’s then current rate of pay to a maximum of $100 per day. Vested sick leave benefits and a portion of unvested sick leave benefits that are expected to vest in the future are accrued as a liability on the financial statements. The College also provides a death or disability benefit to employees hired on or after July 1, 1999 who separate from the College due to permanent disability or death. This benefit is paid at one hundred percent of the employee’s then current daily rate of pay for all accumulated sick leave limited to a total amount of $10,000. Scholarship Allowances: A scholarship allowance is the difference between the stated charge for goods and services provided by the College and the amount that is paid by the student or third parties making payments on behalf of the student. Accordingly, some types of student financial aid such as Pell grants and scholarships awarded by the College are considered to be scholarship allowances. These allowances are netted against tuition and fees revenues in the Statement of Revenues, Expenses, and Changes in Net Assets. Investment Income: Investment income is comprised of interest, dividends, and net changes in the fair value of applicable investments. 2 . DEPOSITS AND INVESTMENTS
Primary Government - College Arizona Revised Statutes (A.R.S.) require the College to deposit special tax levies for the College’s maintenance and operation and capital outlay with the County Treasurer. The statutes do not require the College to deposit other public monies in its custody with the County Treasurer; however, the College must act as if it was a prudent person dealing with the property of another when making investment decisions about those monies. The statutes do not include any requirements for credit risk, custodial credit risk, concentration of credit risk, interest rate risk, or foreign currency risk for the College’s investments. Deposits: At June 30, 2005 the College’s total petty cash on hand was $27,550. The carrying amount of the College’s deposits was $4,354,389, and the bank balance was $5,756,642.
26

Notes to Financial Statements
Investments: The State Board of Investment provides oversight for the State Treasurer’s pools, and the Local Government Investment Pool Advisory Committee provides consultation and advice to the Treasurer. The fair value of a participant’s position in the pool approximates the value of that participant’s pool shares and the participant’s shares are not identified with specific investments. No comparable oversight is provided for the County Treasurer’s investment pool, and that pool’s structure does not provide for shares. The College’s investments at June 30, 2005, consist of the following:
27
Investment Type State Treasurer’s investment pool $ 57,845,858 County Treasurer's investment pool 802,834 U.S. government-sponsored agency securities
Fair Value
implicitly guaranteed by the U.S. government) 1,004,690 ortgage-backed securities
(implicitly guaranteed by the U.S. government) 4,828,682 U.S. Treasury money market mutual funds 3,128,326 Total Investments $ 67,610,390
( M
Credit risk: Credit risk is the risk that an issuer or counterparty to an investment will not fulfill its obligations. The College does not have a formal policy regarding credit risk. Following is a summary of the College’s investments and credit ratings as determined by Moody’s rating agency as of June 30, 2005.
Investment Type RatingRating Agency Fair Value
State Treasurer’s investment pool Unrated N/A $ 57,845,858 County Treasurer's investment pool Unrated N/A 802,834 U.S. government-sponsored agency securities Aaa Moody's 1,004,690 Mortgage-backed securities FHLMC Aaa Moody's 1,992,746 Mortgage-backed securities FNMA Aaa Moody's 2,835,936 U.S. Treasury money market mutual funds Aaa Moody's 3,128,326 Total Investments Subject to Credit Risk $ 67,610,390
Custodial Credit Risk: For investments, custodial credit risk is the risk that, in the event of the counterparty’s failure, the College will not be able to recover the value of its investments or collateral securities that are in the possession of an outside party. The College does not have a formal policy regarding custodial credit risk for investments. The College’s U.S. Treasury money market mutual funds are investments held by trustees in the trustees’ Federal Reserve Bank accounts. These investments are recorded in the College’s name in the records of the trustees. The College is exposed to custodial credit risk due to the fact that the trustees act as both custodial and purchasing agents for investment transactions.

Notes to Financial Statements
Interest rate risk: Interest rate risk is the risk that changes in interest rates will adversely affect an investment’s value. The College does not have a formal policy regarding interest rate risk. At June 30, 2005, the College had the following investments:
MaturitiesLess than 1-5
Investment Type 1 Year Years Fair Value State Treasurer’s investment pool $ 57,845,858 - $ 57,845,858 County Treasurer's investment pool 802,834 - 802,834 U.S. government-sponsored agency securities 1,004,690 - 1,004,690 Mortgage-backed securities - $ 4,828,682 4,828,682 U.S. Treasury money market mutual funds 3,128,326 - 3,128,326 Total Investments Subject to Interest Rate Risk $ 62,781,708 $ 4,828,682 $ 67,610,390 Component Unit - Foundation The Pima Community College Foundation, Inc. – At June 30, 2005, the Foundation’s cash and cash equivalents were in the amount of $1,467,533. The Foundation’s investments at June 30, 2005, consisted of the following: Foundation
Fixed income securities $ 58,276 Bond Funds 1,520,308 Equity Funds 1,676,660 Funds on deposit with Community Foundation for Southern Arizona 13,815 Less restricted for long-term endowments (2,722,472)Total available for operations $ 546,587
28
Notes to Financial Statements
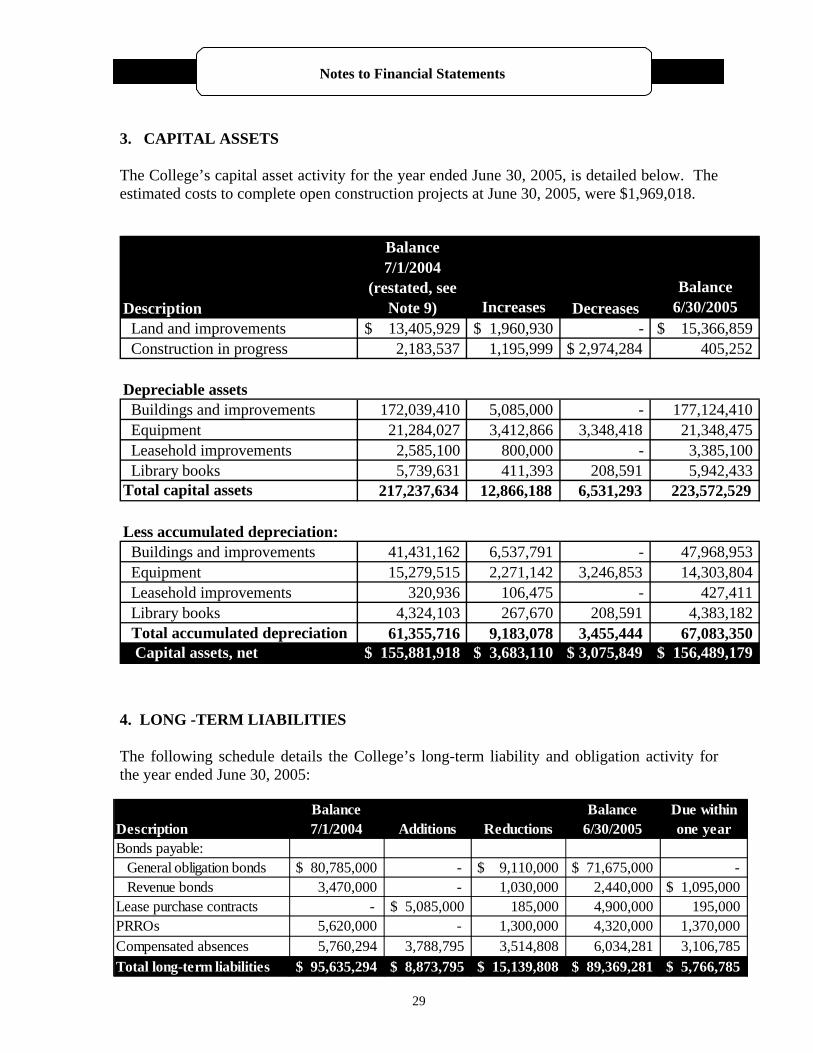
3. CAPITAL ASSETS The College’s capital asset activity for the year ended June 30, 2005, is detailed below. The estimated costs to complete open construction projects at June 30, 2005, were $1,969,018.
Balance7/1/2004
(restated, see Note 9) Increases
Balance 6/30/2005
Land and improvements $ 13,405,929 $ 1,960,930 - $ 15,366,859 Construction in progress 2,183,537 1,195,999 $ 2,974,284 405,252
Depreciable assets Buildings and improvements 172,039,410 5,085,000 - 177,124,410 Equipment 21,284,027 3,412,866 3,348,418 21,348,475 Leasehold improvements 2,585,100 800,000 - 3,385,100 Library books 5,739,631 411,393 208,591 5,942,433 Total capital assets 217,237,634 12,866,188 6,531,293 223,572,529
Less accumulated depreciation: Buildings and improvements 41,431,162 6,537,791 - 47,968,953 Equipment 15,279,515 2,271,142 3,246,853 14,303,804 Leasehold improvements 320,936 106,475 - 427,411 Library books 4,324,103 267,670 208,591 4,383,182
Total accumulated depreciation 61,355,716 9,183,078 3,455,444 67,083,350 Capital assets, net $ 155,881,918 $ 3,683,110 $ 3,075,849 $ 156,489,179
Description Decreases
4. LONG -TERM LIABILITIES The following schedule details the College’s long-term liability and obligation activity for the year ended June 30, 2005:
Balance Balance Due within7/1/2004 6/30/2005 one year
Bonds payable: General obligation bonds $ 80,785,000 - $ 9,110,000 $ 71,675,000 - Revenue bonds 3,470,000 - 1,030,000 2,440,000 $ 1,095,000 Lease purchase contracts - $ 5,085,000 185,000 4,900,000 195,000 PRROs 5,620,000 - 1,300,000 4,320,000 1,370,000 Compensated absences 5,760,294 3,788,795 3,514,808 6,034,281 3,106,785 Total long-term liabilities $ 95,635,294 $ 8,873,795 $ 15,139,808 $ 89,369,281 $ 5,766,785
Description Additions Reductions
29

Notes to Financial Statements
Bonds, Lease Purchase, and Pledged Revenue Refunding Obligations Payable: The College’s bonded debt consists of various issues of general obligation bonds, pledged revenue refunding obligations, and revenue bonds. Certain bonds may be redeemed by the owner (the College) prior to maturity, usually by paying a premium to the holder of the bond. This is referred to as being “callable,” since the holder of the bond has no control over the redemption of the bond. The Series A (1996) and Series B (1999) general obligation bonds maturing on or before July 1, 2006 are noncallable prior to maturity. The Series A and B bonds maturing on or after July 1, 2007, are callable prior to maturity on or after July 1, 2006. The Series C (2001) bonds are noncallable. The revenue bonds are generally callable. The Pledged Revenue Refunding Obligations (PRROs) are not subject to redemption prior to their respective maturity dates. On all bonds and obligations, interest is payable semiannually on January 1 and July 1 of each year. Lease interest is payable semiannually on May 1 and November 1 of each year. Outstanding Interest
Principal RatesGeneral obligation bonds: Buildings and improvements:
Project of 1995 - Series A (1996) $ 14,125,000 5.0 to 7.0%
Project of 1995 - Series B (1999) 20,635,000 4.5 to 4.7%
Project of 1995 - Series C (2001) 36,915,000 4.0 to 5.0%
Lease Purchase 4,900,000 5.0 to 5.3%PRROs 2001 4,320,000 4.0 to 5.0%Revenue bonds: Project of 1970 - Series A Advance refunding: Project of 1987 - Series A (1993) 1,865,000 5.4 to 5.5%Total 83,335,000$
Description
575,000 7.0 to 7.5%
Bond proceeds and the lease purchase agreement were used primarily to pay to acquire land or construct capital facilities. Certain general obligation and revenue bonds were issued to advance refund previously issued bonds. The College repays general obligation bonds from ad-valorem property taxes. Payment of interest and principal on revenue bonds and PRROs is secured by a pledge of tuition, fees, rents, and other operating revenues. At June 30, 2005, $5.1 million of general obligation bonds were considered defeased because the College placed refunding bond proceeds in a depository trust in a prior year to provide for all future debt service payments on the bonds. Accordingly, the trust account assets and the liability for these defeased bonds are not included in the College’s financial statements.
30

Notes to Financial Statements
The following schedule details debt service requirements to maturity for the College’s bonds, PRROs, and lease purchase payable at June 30, 2005:
31
Principal Interest Principal Interest Principal Interest Principal Interest2006 1,095,000$ 111,783$ 3,505,300$ 1,370,000$ 177,350$ 195,000$ 248,238$
07 865,000 56,863 9,945,000$ 3,048,863 1,440,000 109,300 200,000 240,438 08 180,000 26,700 10,575,000 2,579,344 1,510,000 37,750 210,000 232,188 09 100,000 17,500 11,250,000 2,090,030 - - 215,000 223,525 10 100,000 10,500 12,570,000 1,542,542 - - 225,000 213,125
2011-15 100,000 3,500 27,335,000 1,816,518 - - 1,315,000 883,775 2016-20 - - - - - - 1,720,000 486,850
2021-2022 - - - - - - 820,000 63,550 Total 2,440,000$ 226,846$ 71,675,000$ 14,582,597$ 4,320,000$ 324,400$ 4,900,000$ 2,591,689$
Lease PurchaseYear ending June 30:
Revenue Bonds General Obligation Bonds PRROs
20202020
Lease Purchase: On July 1, 2004, the College entered into a lease purchase agreement with the Arizona Board of Regents, on behalf of the University of Arizona, to acquire a building at the College’s Northwest Campus. Greater than expected enrollment necessitated expansion at the Northwest facility. At inception, total payments, including principal and interest, over the 18-year term of the agreement were $7.9 million. At June 30, 2005, total minimum lease payments were $7.5 million. Of that amount, $2.6 million represented interest and $4.9 million was the present value of the minimum lease payments. Lease payments are based on University of Arizona debt service payments related to the leased building. Future College lease payments may change if the University’s debt service payments change. Title to the building transfers to the College at the end of the lease. 5. OPERATING LEASE The College leases building space and land under the provisions of a long-term lease agreement classified as an operating lease for accounting purposes. Lease expenses under the terms of the operating lease were $288,845 for the year ended June 30, 2005. The lease has a remaining non-cancelable lease term of five years and provides renewal options. The future minimum lease payments required under operating leases at June 30, 2005, were as follows:
Year ending June 30:
2006 $ 294,581 2007 298,681 2008 302,926 2009 307,318 2010 206,876
Total Minimum Lease Payments
$ 1,410,382
Notes to Financial Statements
6. RETIREMENT PLAN Plan Description: The College contributes to a cost-sharing, multiple-employer defined benefit pension plan administered by the Arizona State Retirement System (the ASRS). Benefits are established by state statute and generally provide retirement, death, long-term disability, survivor, and health insurance premium benefits. The System is governed by the Arizona State Retirement System Board according to the provisions of A.R.S. Title 38, Chapter 5, Article 2. The System issues a comprehensive annual financial report that includes financial statements and required supplementary information. The most recent report may be obtained by writing the System at 3300 North Central Avenue, P.O. Box 33910, Phoenix, AZ, 85067-3910, or by looking at the System’s website at www.asrs.state.az.us. Funding Policy: The Arizona State Legislature establishes and may amend active plan members’ and the College’s contribution rates. For the year ended June 30, 2005, active plan members and the College were each required by statute to contribute at the actuarially determined rate of 5.7 percent (5.2 percent for retirement and 0.5 percent for long-term disability) of the members’ annual covered payroll. The College’s contributions to the System for the fiscal years ended June 30, 2005, 2004, and 2003 were $3,691,489, $3,341,747, and $1,457,175, respectively, which were equal to the required contributions for the year. 7. RISK MANAGEMENT The College is exposed to various risks of loss related to torts; theft of, damage to, and destruction of assets; natural disasters; errors and omissions; and injuries to employees. The College participates in a risk retention trust for liabilities arising from general liability and automobile risks. The trust operating agreement includes a provision for member assessment in the event that total claims paid by the trust exceed the contributions and reserves in any one year. The assessment is limited to the contribution amount paid by the College during the year in which the assessment is applied. The trust has never had such an assessment. The College carries commercial insurance for other risks of loss, including property, workers’ compensation, and accident insurance. Settled claims resulting from these risks have not exceeded insurance coverage in any of the past three fiscal years. In addition, the College finances uninsured risks of loss for prescription benefits to eligible employees and their dependents. The prescription plan provides coverage for eligible prescription drugs with an employee-paid co-payment determined by the drug’s availability within the plan’s formulary. The College utilizes a consultant to determine the required funding annually based upon anticipated utilization, cost trends, and benefit levels. The College does not purchase insurance for claims in excess of the projected funding level. An independent administrator provides claim and record-keeping services for the plan.
32

Notes to Financial Statements
Prescription Plan 2004 2005Claims liability at beginning of year 46,401$ 85,298$ Claims incurred during the year 1,284,877 1,135,065Payments on claims (1,245,980) (1,193,621)Claims liability at end of year 85,298$ 26,742$
Year Ending June 30 8. OPERATING EXPENSES BY NATURAL CLASSIFICATION The College’s operating expenses are presented by functional category in the Statement of Revenues, Expenses, and Changes in Net Assets. The following chart summarizes the primary government’s operating expenses by natural classification. Description Amount
Compensation and Benefits $ 94,428,679 Communications and Utilities 4,779,364 Travel 1,666,405 Contractual Services 12,033,556 Supplies and Materials 6,508,818 Scholarships 13,827,818 Other Expenses 2,564,706 Depreciation 9,183,078 Total operating expenses $ 144,992,424
9. BEGINNING BALANCES RESTATED The College’s beginning net assets amount was restated to correct an overstatement of capital assets that occurred in a prior year. Description Amount
Net Assets as of June 30, 2004, as previously reported 126,689,757$ Prior period adjustment to capital assets (916,901) Beginning Net Assets, as restated 125,772,856$
33

This page intentionally left blank

PimaCountyCommunityCollege
Statistical Section

Back of Divider

The following statistical schedules and other non-financial information are presented as supplemental trend data tohelp readers of the Comprehensive Annual Financial Report (CAFR) assess the financial condition of the PimaCounty Community College District. These schedules should be read in conjunction with the other sections of theCAFR. The source of information for each of the schedules is shown at the bottom of the schedule. In addition,other notes are provided to explain any noncomparable information contained on each individual schedule.
35
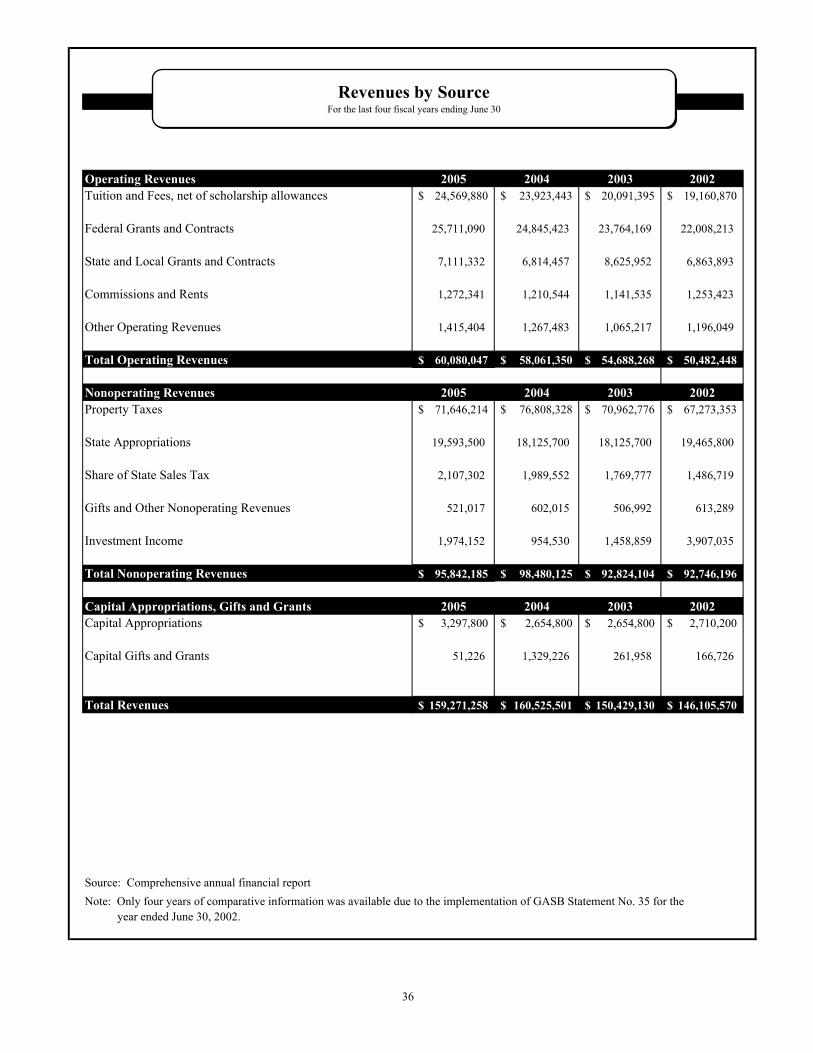
Operating Revenues 2005 2004 2003 2002Tuition and Fees, net of scholarship allowances 24,569,880$ 23,923,443$ 20,091,395$ 19,160,870$
Federal Grants and Contracts 25,711,090 24,845,423 23,764,169 22,008,213
State and Local Grants and Contracts 7,111,332 6,814,457 8,625,952 6,863,893
Commissions and Rents 1,272,341 1,210,544 1,141,535 1,253,423
Other Operating Revenues 1,415,404 1,267,483 1,065,217 1,196,049
Total Operating Revenues 60,080,047$ 58,061,350$ 54,688,268$ 50,482,448$
Nonoperating Revenues 2005 2004 2003 2002Property Taxes 71,646,214$ 76,808,328$ 70,962,776$ 67,273,353$
State Appropriations 19,593,500 18,125,700 18,125,700 19,465,800
Share of State Sales Tax 2,107,302 1,989,552 1,769,777 1,486,719
Gifts and Other Nonoperating Revenues 521,017 602,015 506,992 613,289
Investment Income 1,974,152 954,530 1,458,859 3,907,035
Total Nonoperating Revenues 95,842,185$ 98,480,125$ 92,824,104$ 92,746,196$
Capital Appropriations, Gifts and Grants 2005 2004 2003 2002Capital Appropriations 3,297,800$ 2,654,800$ 2,654,800$ 2,710,200$
Capital Gifts and Grants 51,226 1,329,226 261,958 166,726
Total Revenues 159,271,258$ 160,525,501$ 150,429,130$ 146,105,570$
Source: Comprehensive annual financial reportNote: Only four years of comparative information was available due to the implementation of GASB Statement No. 35 for the year ended June 30, 2002.
Revenues by SourceFor the last four fiscal years ending June 30
36

$0
$20,000,000
$40,000,000
$60,000,000
$80,000,000
$100,000,000
$120,000,000
$140,000,000
$160,000,000
$180,000,000
2002200320042005
Capital Gifts and Grants
Investment Income
Gifts and Other Nonoperating Revenues
Share of State Sales Tax
Other Operating Revenues
Commissions and Rents
Capital Appropriations
State and Local Grants and Contracts
State Appropriations
Tuition & Fees, net of scholarship allowances
Federal Grants and Contracts
Property Taxes
Revenues by SourceFor the last four fiscal years ending June 30
37

Operating Expenses 2005 2004 2003 2002Instruction 51,458,514$ 49,763,342$ 47,902,100$ 46,110,240$
Academic Support 20,353,720 19,288,581 17,429,871 16,194,068
Student Services 15,850,844 14,993,217 13,714,265 13,491,171
Institutional Support 20,612,824 19,126,135 17,603,225 17,451,004
Operation and Maintenance of Plant 13,299,786 13,391,180 10,950,863 11,776,256
Student Financial Aid 13,827,818 13,874,635 12,903,217 11,538,248
Auxiliary Services 405,840 400,314 404,040 749,955
Depreciation 9,183,078 7,989,477 7,346,308 5,497,027
Total Operating Expenses 144,992,424$ 138,826,881$ 128,253,889$ 122,807,969$
Nonoperating ExpensesInterest on Capital Asset-related Debt 4,346,303$ 4,732,158$ 5,780,427$ 6,443,178$
Loss on Capital Asset Disposal 101,565 138,012 2,923,462 773,247
Other Nonoperating Expenses - 49,539 84,520 43,035
Total Nonoperating Expenses 4,447,868$ 4,919,709$ 8,788,409$ 7,259,460$
Total Expenses 149,440,292$ 143,746,590$ 137,042,298$ 130,067,429$
Source: Comprehensive annual financial reportNote: Only four years of comparative information was available due to the implementation of GASB Statement No. 35 for the year ended June 30, 2002.
Operating and Nonoperating ExpensesFor the last four fiscal years ending June 30
38

Operating and Nonoperating ExpensesFor the last four fiscal years ending June 30
$0
$20,000,000
$40,000,000
$60,000,000
$80,000,000
$100,000,000
$120,000,000
$140,000,000
$160,000,000
2002200320042005
Other Nonoperating Expenses
Loss on Capital Asset Disposal
Interest on Capital Asset-related Debt
Depreciation
Auxiliary Services
Student Financial Aid
Operation and Maintenance of Plant
Institutional Support
Student Services
Academic Support
Instruction
39

Original Board (2) (2) (3)Real Ordered Collections/ Percent of Collections/ Percent of Taxes
Fiscal Property Changes Adjusted Payments Original Payments Adjusted ReceivableYear Tax Levy thru 6/30/05 Levy Initial Tax Year Levy thru 6/30/05 Levy as of 6/30/05
1995/96 35,332,218$ (141,966)$ 35,190,252$ 33,863,297$ 95.84% 35,237,823$ 100.14% (47,571)$
1996/97 35,299,538 (255,878) 35,043,660 33,829,663 95.84% 35,043,518 100.00% 142
1997/98 36,191,844 (159,711) 36,032,133 34,676,292 95.81% 36,068,866 100.10% (36,733)
1998/99 38,923,992 (212,381) 38,711,611 37,169,033 95.49% 38,696,610 99.96% 15,001
1999/00 42,382,688 (217,548) 42,165,140 40,411,129 95.35% 42,187,271 100.05% (22,131)
2000/01 45,463,598 (207,391) 45,256,207 43,432,345 95.53% 45,237,244 99.96% 18,963
2001/02 47,198,401 (237,501) 46,960,900 45,098,759 95.55% 46,925,715 99.93% 35,185
2002/03 50,866,027 (189,100) 50,676,927 48,822,905 95.98% 50,658,347 99.96% 18,580
2003/04 53,959,971 (164,225) 53,795,746 51,984,279 96.34% 53,774,286 99.96% 21,460
2004/05 57,155,078 (64,145) 57,090,933 55,279,797 96.72% 55,279,797 96.83% 1,811,136 Totals 442,773,355$ (1,849,846)$ 440,923,509$ 424,567,499$ 439,109,477$ 1,814,032$
Source: All figures are derived from Pima County Treasurer's Tax Ledgers and spreadsheets.
Notes:
(2) Amounts collected are on a cash basis.
(3) Represents the difference between the adjusted levy and collected to June 30, 2005.
(1) All amounts shown are for primary property taxes only. Unsecured personal property taxes are not included in this schedulebecause the dates of the monthly tax rolls vary each year. On the average, 93% of unsecured property taxes are collected within 90days after the due date.
Total unsecured personal property tax board ordered changes and collections for fiscal year 2004-05 were $130,554 and$3,103,079 respectively, for tax years 1976 through 2004, including rolls and cycles through June 30, 2005. The total outstandinglevy at June 30, 2005 for the period cited stands at $423,239.
Property Tax Levies and Collections (1)Last Ten Fiscal Years
40

Net Full Ratio of NetFiscal Year/Levy Type (1) Assessed Cash Assessed to
Value Values (2) Full Cash Value
1995/96 Primary $3,130,753 $28,973,933 10.81%1995/96 Secondary 3,218,884 29,751,166 10.82%
1996/97 Primary $3,208,291 $30,042,703 10.68%1996/97 Secondary 3,247,512 30,433,238 10.67%
1997/98 Primary $3,468,269 $31,002,247 11.19%1997/98 Secondary 3,700,218 34,304,545 10.79%
1998/99 Primary $3,682,397 $33,930,287 10.85%1998/99 Secondary 3,852,574 35,295,924 10.92%
1999/00 Primary $3,853,630 $32,800,358 11.75%1999/00 Secondary 4,000,624 33,892,170 11.80%
2000/01 Primary $4,111,664 $34,898,918 11.78%2000/01 Secondary 4,236,070 35,819,667 11.83%
2001/02 Primary $4,361,493 $37,257,921 11.71%2001/02 Secondary 4,491,395 38,196,337 11.76%
2002/03 Primary $4,669,336 $39,908,791 11.70%2002/03 Secondary 4,835,561 41,109,997 11.76%
2003/04 Primary $5,022,474 $42,927,737 11.70%2003/04 Secondary 5,221,271 44,423,165 11.75%
2004/05 Primary $5,412,550 $46,754,009 11.58%2004/05 Secondary 5,620,156 48,474,537 11.59%
Source: Pima County Department of Finance (June 30, 2004 CAFR) Pima County Assessor's Office
Notes: (1) Primary - Taxes levied to pay for current operation and maintenance expenses. Secondary - Taxes levied to pay principal and interest on bonded indebtedness and special district assessments. (2) Full Cash Value or Secondary Value approximates market value.
Assessed Value and Full Cash Value of All Taxable PropertyLast Ten Fiscal Years (dollars in thousands)
41
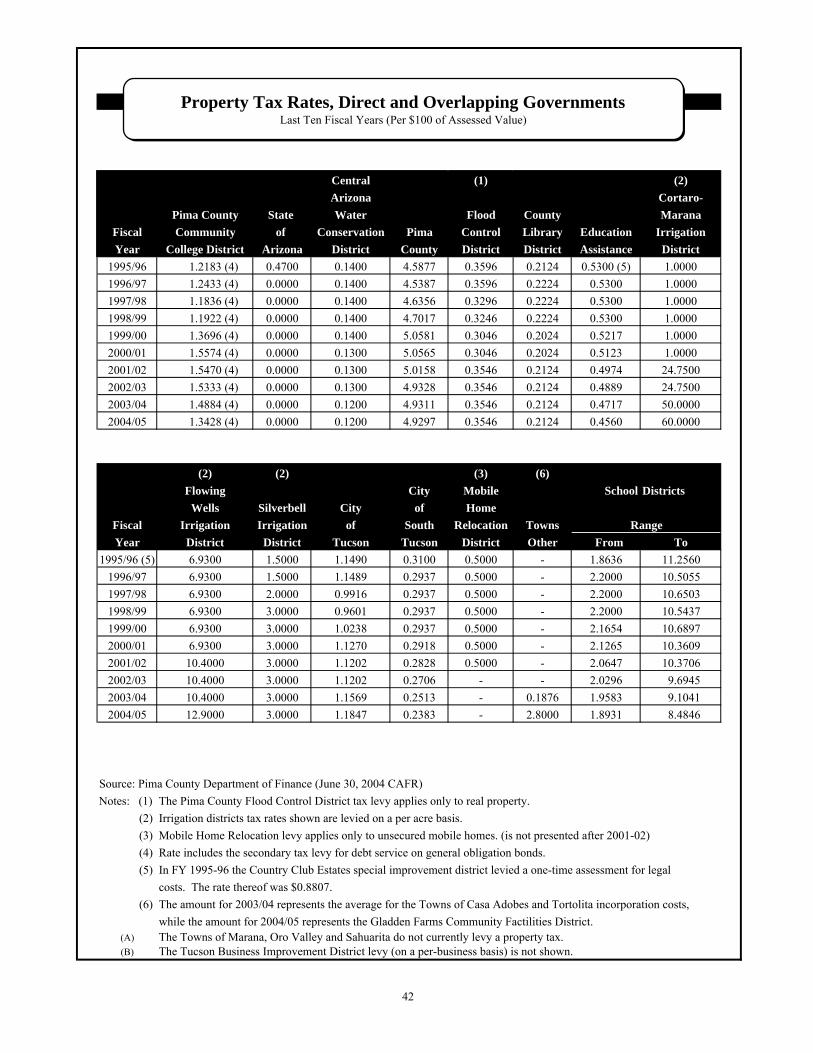
PROPERTY TAX RATES
(Per $100 of Assessed Value)LAST TEN FISCAL YEARS
Central (1) (2)Arizona Cortaro-
Pima County State Water Flood County MaranaFiscal Community of Conservation Pima Control Library Education IrrigationYear College District Arizona District County District District Assistance District
1995/96 1.2183 (4) 0.4700 0.1400 4.5877 0.3596 0.2124 0.5300 (5) 1.0000
1996/97 1.2433 (4) 0.0000 0.1400 4.5387 0.3596 0.2224 0.5300 1.0000
1997/98 1.1836 (4) 0.0000 0.1400 4.6356 0.3296 0.2224 0.5300 1.0000
1998/99 1.1922 (4) 0.0000 0.1400 4.7017 0.3246 0.2224 0.5300 1.0000
1999/00 1.3696 (4) 0.0000 0.1400 5.0581 0.3046 0.2024 0.5217 1.0000
2000/01 1.5574 (4) 0.0000 0.1300 5.0565 0.3046 0.2024 0.5123 1.0000
2001/02 1.5470 (4) 0.0000 0.1300 5.0158 0.3546 0.2124 0.4974 24.7500
2002/03 1.5333 (4) 0.0000 0.1300 4.9328 0.3546 0.2124 0.4889 24.7500
2003/04 1.4884 (4) 0.0000 0.1200 4.9311 0.3546 0.2124 0.4717 50.0000
2004/05 1.3428 (4) 0.0000 0.1200 4.9297 0.3546 0.2124 0.4560 60.0000
(2) (2) (3) (6)Flowing City Mobile School Districts
Wells Silverbell City of HomeFiscal Irrigation Irrigation of South Relocation Towns RangeYear District District Tucson Tucson District Other From To
1995/96 (5) 6.9300 1.5000 1.1490 0.3100 0.5000 - 1.8636 11.2560
1996/97 6.9300 1.5000 1.1489 0.2937 0.5000 - 2.2000 10.5055
1997/98 6.9300 2.0000 0.9916 0.2937 0.5000 - 2.2000 10.6503
1998/99 6.9300 3.0000 0.9601 0.2937 0.5000 - 2.2000 10.5437
1999/00 6.9300 3.0000 1.0238 0.2937 0.5000 - 2.1654 10.6897
2000/01 6.9300 3.0000 1.1270 0.2918 0.5000 - 2.1265 10.3609
2001/02 10.4000 3.0000 1.1202 0.2828 0.5000 - 2.0647 10.3706
2002/03 10.4000 3.0000 1.1202 0.2706 - - 2.0296 9.6945
2003/04 10.4000 3.0000 1.1569 0.2513 - 0.1876 1.9583 9.1041
2004/05 12.9000 3.0000 1.1847 0.2383 - 2.8000 1.8931 8.4846
Source: Pima County Department of Finance (June 30, 2004 CAFR)
Notes: (1) The Pima County Flood Control District tax levy applies only to real property.
(2) Irrigation districts tax rates shown are levied on a per acre basis.
(3) Mobile Home Relocation levy applies only to unsecured mobile homes. (is not presented after 2001-02)
(4) Rate includes the secondary tax levy for debt service on general obligation bonds.
(5) In FY 1995-96 the Country Club Estates special improvement district levied a one-time assessment for legal
costs. The rate thereof was $0.8807.
(6) The amount for 2003/04 represents the average for the Towns of Casa Adobes and Tortolita incorporation costs,
while the amount for 2004/05 represents the Gladden Farms Community Factilities District.(A) The Towns of Marana, Oro Valley and Sahuarita do not currently levy a property tax.(B) The Tucson Business Improvement District levy (on a per-business basis) is not shown.
Property Tax Rates, Direct and Overlapping GovernmentsLast Ten Fiscal Years (Per $100 of Assessed Value)
42
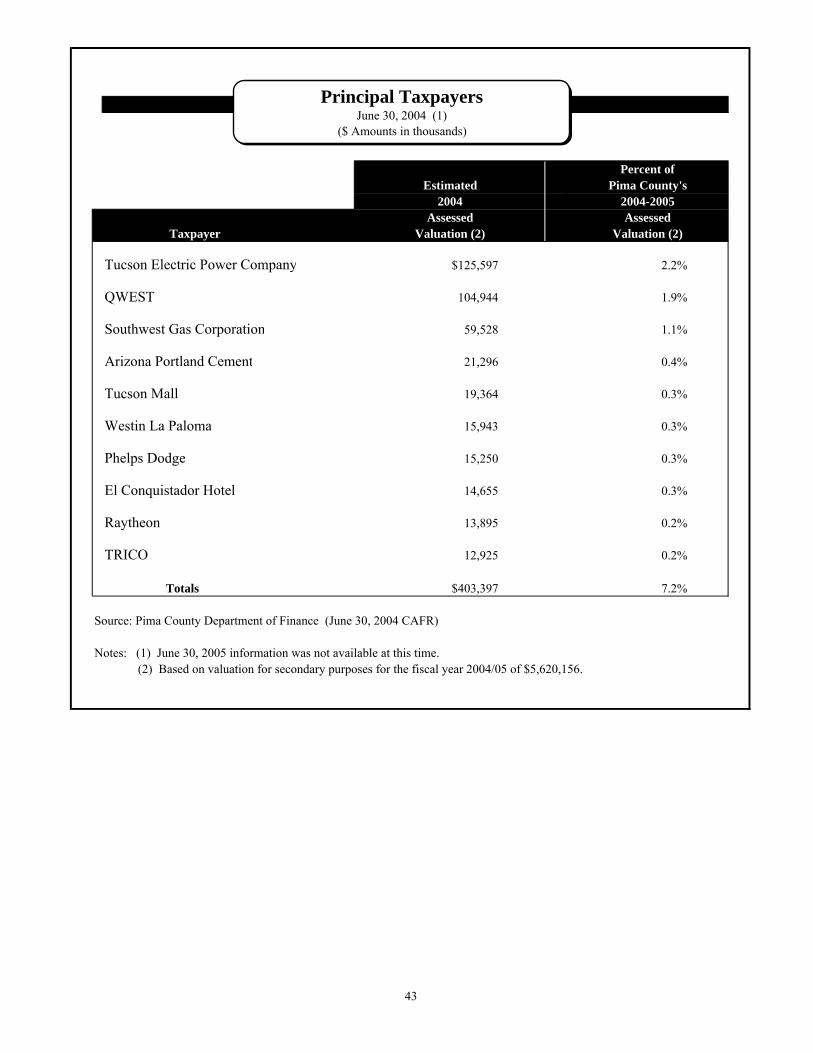
Percent ofEstimated Pima County's
2004 2004-2005Assessed Assessed
Taxpayer Valuation (2) Valuation (2)
Tucson Electric Power Company $125,597 2.2%
QWEST 104,944 1.9%
Southwest Gas Corporation 59,528 1.1%
Arizona Portland Cement 21,296 0.4%
Tucson Mall 19,364 0.3%
Westin La Paloma 15,943 0.3%
Phelps Dodge 15,250 0.3%
El Conquistador Hotel 14,655 0.3%
Raytheon 13,895 0.2%
TRICO 12,925 0.2%
Totals $403,397 7.2%
Source: Pima County Department of Finance (June 30, 2004 CAFR)
Notes: (1) June 30, 2005 information was not available at this time. (2) Based on valuation for secondary purposes for the fiscal year 2004/05 of $5,620,156.
Principal TaxpayersJune 30, 2004 (1)
($ Amounts in thousands)
43

Rank Employer Service/Product FTE* 2004 Payroll
1 U.S. Army Fort Huachuca Military 12,250 Not Available
2 University of Arizona Higher Education 10,348 $625,750,529
3 Raytheon Systems Co. Manufacturing/Aerospace 10,300 $793,651,293
4 State of Arizona Government 9,750 Not Available
5 Davis Monthan Air Force Base Military 8,727 $428,600,000
6 Tucson Unified School District Education 7,684 $292,515,211
7 Pima County Government 6,767 $282,347,690
8 City of Tucson Government 6,757 $346,353,159
9 Wal-Mart Stores Inc. Department Stores 4,595 Not Available
10 Phelps Dodge Mining Co. Mining 4,500 $175,000,000
11 Carondolet Health Network Health Care 3,746 $154,235,023
12 Tohono O'odham Nation Government/Casino 3,665 Not Available
13 TMC HealthCare Health Care 3,135 $130,347,000
14 University Medical Center Education 2,918 $135,412,000
15 Pascua Yaqui Tribe Government 2,500 Not Available
16 U.S. Border Patrol Government 2,300 Not Available
17 Pima Community College Higher Education 2,226 $79,166,775 18 Sunnyside School District Education 2,223 $63,649,000
19 Northwest Medical Center Health Care 2,038 Not Available
20 Fry's Food & Drug Stores Trade 2,034 $61,080,845
21 CheckMate Professional Employer Services 2,033 $40,443,814
22 Amphitheater Public Schools Education 2,014 $65,770,267
23 Basha's Inc Trade 1,963 Not Available
24 Safeway Stores Inc. Trade 1,841 Not Available
25 Pinal County Government 1,718 $59,712,000
Source: "The Star 200 Rankings" - The Arizona Daily Star March 13, 2005.
* FTE equals approximate full time equivalent employment.
Top 25 Employers in Southern Arizona
44

Computation of Legal Debt Margin
For Fiscal Year Ended June 30, 1997
Secondary assessed value of real and personal property 6,050,950,040$
Debt limit = 15% of secondary assessed value 907,642,506
Amount of debt applicable to debt limit:
General obligation bonded debt $71,675,000
Leases 6,310,382
Total debt applicable to debt limit 77,985,382
Legal debt margin 829,657,124$
Source: District records
Jurisdiction
Direct:
Pima County Community College District 80,785,000$
Overlapping: (1)
Pima County (2) 232,553,000
Flood Control District 3,805,000
School Districts 588,545,000
City of Tucson 266,989,000
Fire Districts -
Irrigation Districts -
Subtotal Overlapping Debt 1,091,892,000
Total Direct and Overlapping Debt 1,172,677,000$
Sources: District Records and Pima County Department of Finance (June 30, 2004 CAFR)
Notes: (1) June 30, 2005 amounts were unavailable at the time of publication
(2) Excludes improvement districts
Computation of Legal Debt MarginFor Fiscal Year Ended June 30, 2005
Computation of Direct and Overlapping DebtGeneral Obligation Bonds, June 30, 2004
(1)
45
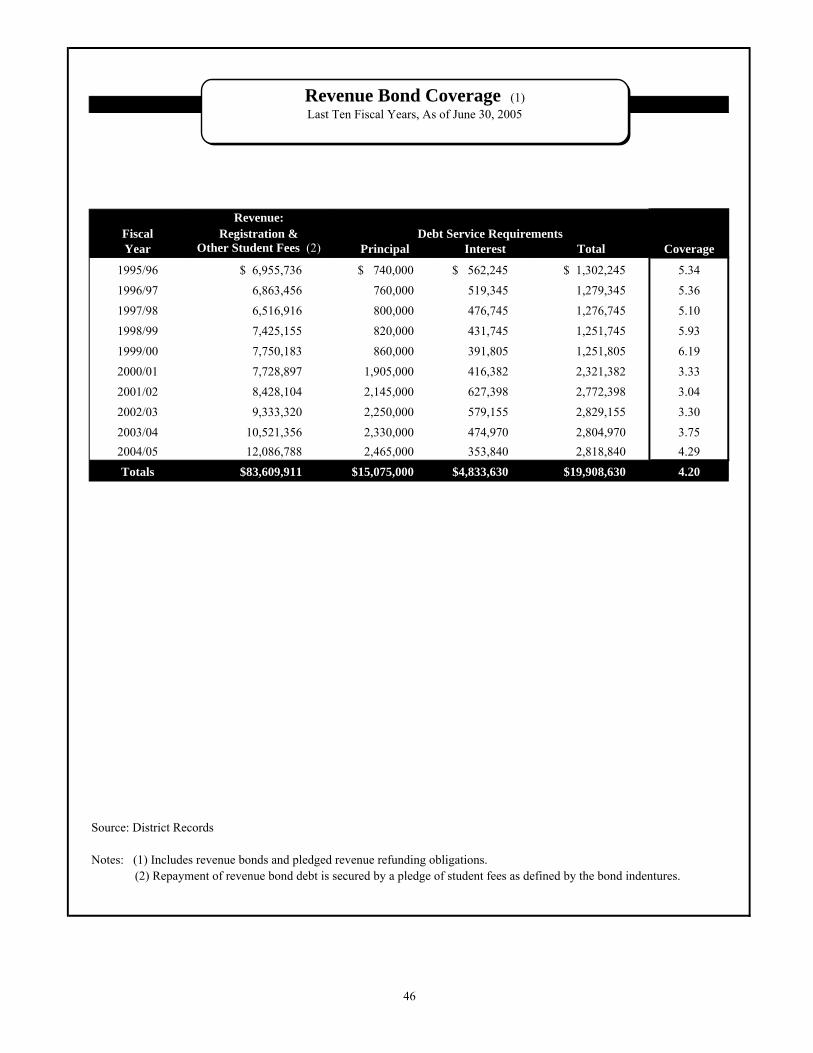
Revenue Bond Coverage Last Ten Fiscal Years As of June 30, 1997
Revenue:Fiscal Registration & Debt Service RequirementsYear Other Student Fees (2) Principal Interest Total Coverage
1995/96 $ 6,955,736 $ 740,000 $ 562,245 $ 1,302,245 5.34
1996/97 6,863,456 760,000 519,345 1,279,345 5.36
1997/98 6,516,916 800,000 476,745 1,276,745 5.10
1998/99 7,425,155 820,000 431,745 1,251,745 5.93
1999/00 7,750,183 860,000 391,805 1,251,805 6.19
2000/01 7,728,897 1,905,000 416,382 2,321,382 3.33
2001/02 8,428,104 2,145,000 627,398 2,772,398 3.04
2002/03 9,333,320 2,250,000 579,155 2,829,155 3.30
2003/04 10,521,356 2,330,000 474,970 2,804,970 3.75
2004/05 12,086,788 2,465,000 353,840 2,818,840 4.29
Totals $83,609,911 $15,075,000 $4,833,630 $19,908,630 4.20
Source: District Records
Notes: (1) Includes revenue bonds and pledged revenue refunding obligations. (2) Repayment of revenue bond debt is secured by a pledge of student fees as defined by the bond indentures.
Revenue Bond Coverage (1)Last Ten Fiscal Years, As of June 30, 2005
46
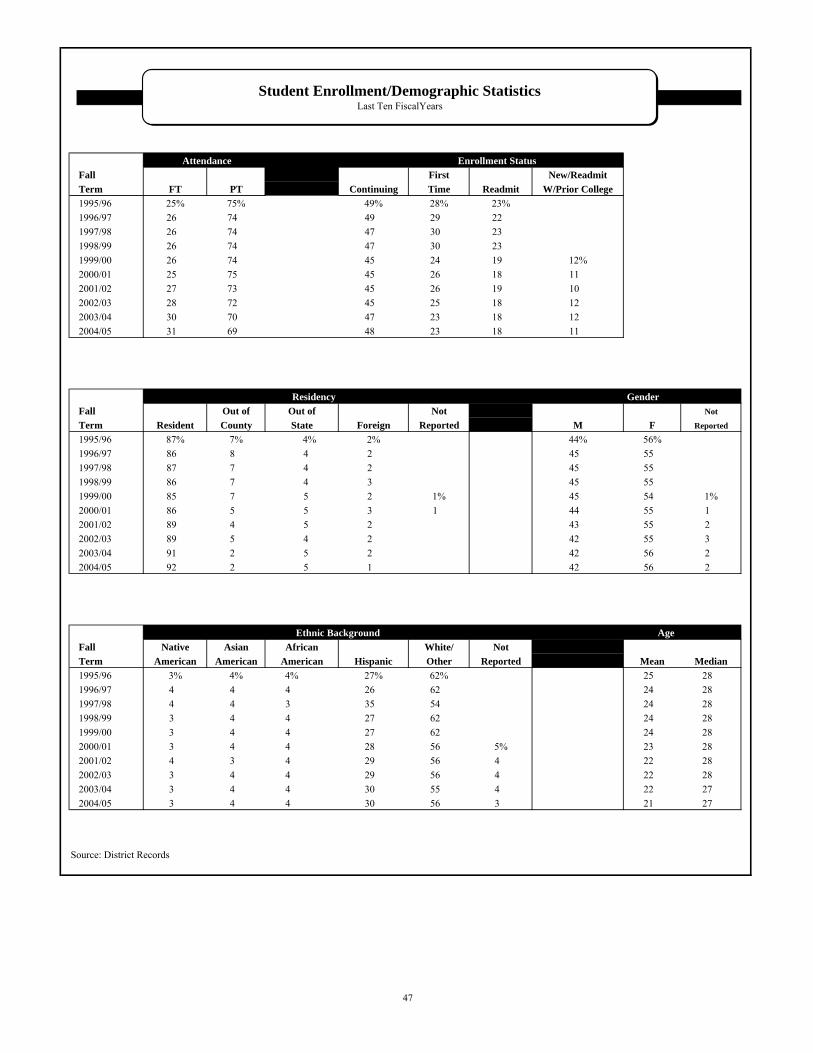
Fall First New/ReadmitTerm FT PT Continuing Time Readmit W/Prior College1995/96 25% 75% 49% 28% 23%
1996/97 26 74 49 29 22
1997/98 26 74 47 30 23
1998/99 26 74 47 30 23
1999/00 26 74 45 24 19 12%
2000/01 25 75 45 26 18 11
2001/02 27 73 45 26 19 10
2002/03 28 72 45 25 18 12
2003/04 30 70 47 23 18 12
2004/05 31 69 48 23 18 11
Fall Out of Not Not
Term Resident County Foreign Reported M F Reported
1995/96 87% 7% 4% 2% 44% 56%
1996/97 86 8 4 2 45 55
1997/98 87 7 4 2 45 55
1998/99 86 7 4 3 45 55
1999/00 85 7 5 2 1% 45 54 1%
2000/01 86 5 5 3 1 44 55 1
2001/02 89 4 5 2 43 55 2
2002/03 89 5 4 2 42 55 3
2003/04 91 2 5 2 42 56 2
2004/05 92 2 5 1 42 56 2
Fall Native Asian White/ NotTerm American American Hispanic Other Reported Mean Median1995/96 3% 4% 4% 27% 62% 25 28
1996/97 4 4 4 26 62 24 28
1997/98 4 4 3 35 54 24 28
1998/99 3 4 4 27 62 24 28
1999/00 3 4 4 27 62 24 28
2000/01 3 4 4 28 56 5% 23 28
2001/02 4 3 4 29 56 4 22 28
2002/03 3 4 4 29 56 4 22 28
2003/04 3 4 4 30 55 4 22 27
2004/05 3 4 4 30 56 3 21 27
Source: District Records
Attendance Enrollment Status
Out of Residency
Ethnic BackgroundAfrican
American
Gender
Age
State
Student Enrollment/Demographic StatisticsLast Ten FiscalYears
47

FTSECampus 95/96 96/97 97/98 98/99 99/00 00/01 01/02 02/03 03/04 04/05Community 2,155 1,999 3,181 3,222 3,267 3,586 4,030 4,532 3,491 3,166Desert Vista 833 897 1,069 1,240 1,301 1,436 1,557 1,699 1,650 1,707Downtown 3,851 3,916 4,036 3,946 3,952 3,778 3,892 4,295 4,155 3,974East 2,039 2,015 2,195 2,051 2,182 2,199 2,465 2,640 2,676 3,186Northwest 39 1,406 1,793West 5,759 5,780 5,842 5,994 5,793 5,650 5,788 6,102 5,754 5,463Center for Training & Dev. 413 390 329 391 412 402 532 565 443 314Public Safety Institute 560 912 976 762 739 850 790Total District 15,050 14,997 16,652 17,404 17,819 18,027 19,026 20,611 20,425 20,393
Source: District Records
0
2,000
4,000
6,000
8,000
10,000
12,000
14,000
16,000
95/96 96/97 97/98 98/99 99/00 00/01 01/02 02/03 03/04 04/05
PSI
CTD
Northwest
Desert Vista
East
Community
Downtown
West
Historic Enrollment FTSELast Ten Fiscal Years
Historic Enrollment FTSELast Ten Fiscal Years
48

HEADCOUNTDistrict 95/96 96/97 97/98 98/99 99/00 00/01 01/02 02/03 03/04 04/05
Total District 53,049 53,784 54,804 58,950 61,973 65,221 66,636 68,425 60,820 61,769
Source: District Records
Historic Enrollment HeadcountLast Ten Fiscal Years
0
10000
20000
30000
40000
50000
60000
70000
95/96 96/97 97/98 98/99 99/00 00/01 01/02 02/03 03/04 04/05
Historic Enrollment HeadcountLast Ten Fiscal Years
49
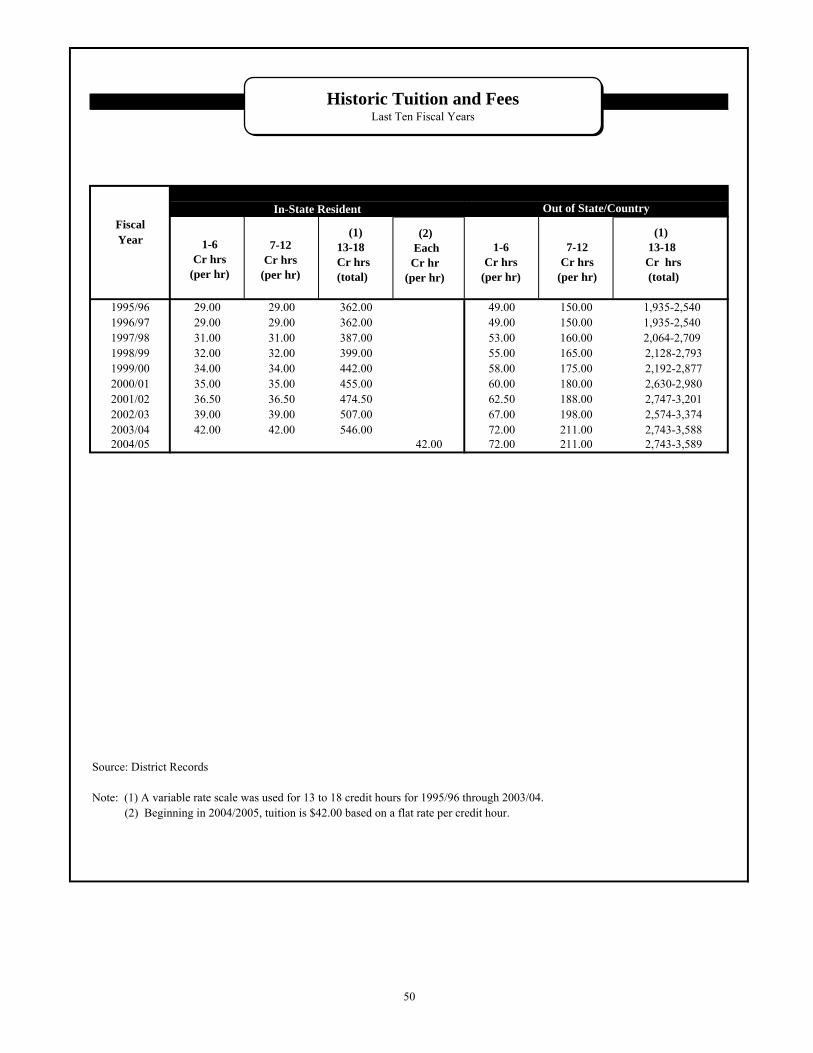
Out of State/CountryFiscalYear
1995/96 29.00 29.00 362.00 49.00 150.00 1,935-2,540 1996/97 29.00 29.00 362.00 49.00 150.00 1,935-2,540 1997/98 31.00 31.00 387.00 53.00 160.00 2,064-2,709 1998/99 32.00 32.00 399.00 55.00 165.00 2,128-2,7931999/00 34.00 34.00 442.00 58.00 175.00 2,192-2,8772000/01 35.00 35.00 455.00 60.00 180.00 2,630-2,9802001/02 36.50 36.50 474.50 62.50 188.00 2,747-3,2012002/03 39.00 39.00 507.00 67.00 198.00 2,574-3,3742003/04 42.00 42.00 546.00 72.00 211.00 2,743-3,5882004/05 42.00 72.00 211.00 2,743-3,589
Source: District Records
Note: (1) A variable rate scale was used for 13 to 18 credit hours for 1995/96 through 2003/04. (2) Beginning in 2004/2005, tuition is $42.00 based on a flat rate per credit hour.
In-State Resident
Historic Tuition and FeesLast Ten Fiscal Years
1-6Cr hrs
(per hr)
1-6Cr hrs
(per hr)
7-12Cr hrs
(per hr)
7-12Cr hrs
(per hr)
(1)13-18Cr hrs(total)
(1) 13-18Cr hrs (total)
(2) Each Cr hr (per hr)
50

Established: 1966Type: Multi-campus Community College DistrictNumber of campuses: 6Geographical location: Southern ArizonaPopulation of District: 931,600 (2004 estimate)
Personnel Statistics:
Faculty Regular faculty (full-time equivalent) 381Adjunct faculty (full-time equivalent) 639
Staff Regular staff (full-time equivalent) 1024Temporary staff (full-time equivalent) 241Student (full-time equivalent) 95
Administrative Full-time equivalent 51
Ethnicity/Gender of full time personnel (Fall 2004):
Ethnicity Hispanic 26%African American 4%Asian American 2%American Indian 2%White/other 66%
Gender Female 59%Male 41%
Student Statistics:
Average age of students: 27
Attendance: Full time 31%Part time 69%
Degrees and certificates awarded: (May 2005)Degrees: Associate of Arts 689
Associate of Applied Arts 12 Associate of Science 133 Associate of Applied Sciences 584 Associate of Business 160 Associate of General Studies 255
Certificates: Basic, Advanced and Technical 2,135
Accreditation: North Central Association of Colleges and SchoolsCommission on Institutions of Higher Education
Miscellaneous StatisticsFiscal Year 2004/05
51

The Board of Govenors of Pima County Community College District has affirmed that the College isan equal education/employment opportunity institution.
The College has policies relative to nondiscrimination on the basis of sex, sexual orientation, race,religion, color, national origin, age, Vietnam-era veterans' status and/or disability. Such policies applyto all educaitonal programs, services, activities, and facilities, and to all terms and conditions ofemployment.
For further information, you may contact the Affirmative Action/Equal Opportunity Office, DistrictOffice, 4905C East Broadway Boulevard, Tucson, Arizona, 85709-1310.
Reasonable accomodations, including materials in an alternative format, will be made for individualswith disabilities when a minimum of five workings days' advance notice is given. For the generalpublic, please contact the College information line at (520) 206-4500 or TTY (520) 206-4530; forCollege students, please contact the appropriate campus Disabled Student Resources Office.
52