FY 1718 Comprehensive Annual Financial Report (CAFR)
139
CITY OF AUBURN CALIFORNIA Comprehensive Annual Financial Report Fiscal Year Ended June 30, 2018
Transcript of FY 1718 Comprehensive Annual Financial Report (CAFR)

CITY OF AUBURN CALIFORNIA
Comprehensive Annual Financial Report
Fiscal Year Ended June 30, 2018

CITY OF AUBURN, CALIFORNIACOMPREHENSIVE ANNUAL FINANCIAL REPORT
AS OF JUNE 30, 2018
Prepared by:ADMINISTRATIVE SERVICES DEPARTMENT
Andy Heath, Finance Director

CITY OF AUBURNCOMPREHENSIVE ANNUAL FINANCIAL REPORT
FOR THE YEAR ENDED JUNE 30, 2018
TABLE OF CONTENTS
Page
INTRODUCTORY SECTION:
Letter of Transmittal i-vi
Credits for Comprehensive Annual Financial Reports vii
List of Officials viii
Organization Chart ix
FINANCIAL SECTION:
Independent Auditor's Report on Basic Financial Statements 1 - 2
Management's Discussion and Analysis 3 - 14
Basic Financial Statements:
Government-wide Financial Statements
Statement of Net Position 15
Statement of Activities 16
Fund Financial Statements
Governmental Funds
Balance Sheet 17
Reconciliation of the Governmental Funds Balance Sheet to the Statement of NetPosition 18
Statement of Revenues, Expenditures, and Changes in Fund Balances 19
Reconciliation of the Statement of Revenues, Expenditures, and Changes in FundBalances to the Statement of Activities 20
Proprietary Funds
Statement of Net Position 21
Statement of Revenues, Expenses and Changes in Net Position 22
Statement of Cash Flows 23 - 24
Fiduciary Funds
Statement of Fiduciary Net Position 25
Statement of Changes in Fiduciary Net Position 26
Notes to Basic Financial Statements 27 - 62

CITY OF AUBURNCOMPREHENSIVE ANNUAL FINANCIAL REPORT
FOR THE YEAR ENDED JUNE 30, 2018
TABLE OF CONTENTS
Page
FINANCIAL SECTION (Continued):
Required Supplementary Information:
City Pension Plan - Schedule of the City's Proportionate Share of the Net Pension Liability 63
City Pension Plan - Schedule of Contributions 64
City OPEB Plan - Schedule of Changes in the City's Net OPEB Liability and Related Ratios 65
Budgetary Comparison Schedule - General Fund 66 - 67
Budgetary Comparison Schedule - Transportation 68
Budgetary Comparison Schedule - HOME Housing Rehabilitation & First Time Homebuyer 69
Notes to Budgetary Comparison Schedules 70
Combining and Individual Fund Statements and Schedules:
Non-Major Governmental Funds:
Narrative Summary 72 - 73
Combining Balance Sheets 74 - 77
Combining Statements of Revenues, Expenditures, and Changes in Fund Balances 78 - 81
Budgetary Comparison Schedules:
State Gas Tax 82
Transit 83
Property Seizures 84
Small Business Loans 85
Solid Waste Management 86
Office of Traffic Safety 87
State Law Enforcement Grant 88
Facilities and Equipment 89
Miscellaneous Grants 90
Fiduciary Funds:
Private Purpose Trust Funds
Narrative Summary 91
Combining Statement of Net Position 92 - 93
Combining Statement of Changes in Net Position 94 - 95
CITY OF AUBURNCOMPREHENSIVE ANNUAL FINANCIAL REPORT
FOR THE YEAR ENDED JUNE 30, 2018
TABLE OF CONTENTS
Page
FINANCIAL SECTION (Continued):
Combining and Individual Fund Statements and Schedules (Continued):
Agency Funds
Narrative Summary 96
Combining Statement of Assets and Liabilities 97 - 98
Combining Statement of Changes in Assets and Liabilities 99 - 100
STATISTICAL SECTION:
Narrative Summary 101
Financial Trend Information
Net Position by Component - Last Ten Fiscal Years 102
Changes in Net Position - Last Ten Fiscal Years 103 - 104
Fund Balance - Governmental Funds - Last Ten Fiscal Years 105
Changes in Fund Balance - Governmental Funds 106
Revenue Capacity Information
Assessed Value and Estimated Actual Value of Taxable Property - Last Ten Fiscal Years 107
Property Tax Rates - All Overlapping Government - Last Ten Fiscal Years 108
Principal Property Taxpayers - Current Year and Nine Years Ago 109
Property Tax Levies and Collections - Last Ten Fiscal Years 110
Debt Capacity Information
Ratios of Outstanding Debt by Type - Last Ten Fiscal Years 111
Ratios of General Bonded Debt Outstanding - Last Ten Fiscal Years 112
Direct and Overlapping Bonded Debt - Last Ten Fiscal Years 113
Computation of Legal Bonded Debt Margin - Last Ten Fiscal Years 114
Demographic and Economic Information
Demographic and Economic Statistics - Last Ten Calendar Years 115
Principal Employers - Current Year and Nine Years Ago 116
Operating Information
Full-Time and Part-Time City Government Employees - Last Ten Fiscal Years 117
Operating Indicators - Last Ten Fiscal Years 118
Capital Asset Statistics - Last Ten Fiscal Years 119

INTRODUCTORY SECTION


2018 Project Team
Robert Richardson, City Manager
Andy Heath, Finance Director
Administrative Staff
Shari Harris, Human Resources Manager
Christina Shafer, Accountant
Special Assistance
Ryan Kinnan, Police Chief
Dave Spencer, Fire Chief
Bernie Schroeder, Planning & Public Works
Director
City of Auburn Comprehensive Annual Financial
Report

CITY OF AUBURN
ELECTED OFFICIALS ANDADMINISTRATIVE PERSONNEL
JUNE 30, 2018
ELECTED OFFICIALS
Mayor Matt Spokely
Vice Mayor Cheryl Maki
Council Member Daniel Berlant
Council Member Bridget Powers
Council Member William Kirby
ADMINISTRATIVE PERSONNEL
Project Team
City Manager Robert Richardson
Finance Director Andy Heath
Administrative Staff
Human Resources Manager Shari Harris
Accounting Technician Christina Shafer
Special Assistance
Public Safety Director John Ruffcorn
Planning & Public Works Director Bernie Schroeder
viii

Citizens of Auburn
Auburn City
Council
City ClerkAmy Lind
City ManagerRobert Robertson
Director of Finance
Andy Heath
Finance
Human Resource Personnel
Information Technology
Insurance Programs
Police ChiefRyan Kinnan
Fire Police
Planning & Public Works
Bernie Schroeder
Planning
Building Inspections
Administration
Corp Yard
Maintenance
Stormwater
Transit Sewer Airport
City TreasurerDonna Silva
Boards & Commissions
Economic DevelopmentMora Rowe
City of Auburn2018 Organizational Chart
Fire ChiefDave Spencer

FINANCIAL SECTION

This page is intentionally left blank.

CITY OF AUBURNMANAGEMENT'S DISCUSSION AND ANALYSIS
FOR THE YEAR ENDED JUNE 30, 2018
This section of the City of Auburn California’s Annual Financial Report presents a narrative overview and analysis ofthe City’s financial activities for the fiscal year ended June 30, 2018. We encourage readers to consider theinformation presented here in conjunction with additional information that we have furnished in the City's basicfinancial statements, which follow this section.
FINANCIAL HIGHLIGHTS FOR THE FISCAL YEAR 2017-18
The assets and deferred outflows of resources of the City exceeded liabilities and deferred inflows of resources by$44,618,352 (total net position). Of this amount, there is an unrestricted net position of $(535,275) to meet long-term and ongoing obligations to citizens, employees and creditors. There is $2,118,181 restricted for public safetyprograms, street maintenance and construction, solid waste management, fire protection services, communitydevelopment and capital projects.
As of June 30, 2018, the City governmental funds reported combined fund balances of $7,462,026. Approximately$5,065,108 of the combined fund balances, or 68%, is available to meet the City's current and future needs(committed and unassigned fund balance).
An annual deficit of $(227,664) was realized in the City's General fund during the fiscal year. Total General fundbalance as of June 30, 2018 was $5,650,340.
OVERVIEW OF THE COMPREHENSIVE ANNUAL FINANCIAL REPORT
The City’s basic financial statements consist of three components: 1) government-wide financial statements, 2) fundfinancial statements, and 3) notes to the financial statements. This report also contains other required supplementaryinformation (RSI) in addition to the basic financial statements themselves.
Government-Wide Financial Statements
The government-wide financial statements consist of a Statement of Net Position and a Statement of Activities. Thesestatements are designed to provide readers with a broad overview of the City’s finances, in a manner similar to aprivate-sector business. They provide information about the activities of the City as a whole and present a long-termview of the City’s finances.
The Statement of Net Position presents information on all of the City’s assets, deferred outflows of resources,liabilities and deferred inflows of resources, with the difference between the two reported as net position. Over time,increases or decreases in net position may serve as a useful indicator of whether the financial position of the City ofAuburn is strengthening or weakening.
The Statement of Activities presents information showing how the City’s net position changed during the fiscal year.All changes in net position are reported when the underlying event giving rise to the change occurs, regardless of thetiming of related cash receipts or disbursements. Thus, revenues and expenses are reported in this statement forsome items that will only result in cash receipts or disbursements in future fiscal periods, such as property taxesassessed for the current year but received after June 30, or vacation leave earned in the current year but not utilizeduntil a subsequent year.
The government-wide financial statements of the City are divided as follows:
Governmental activities
These are activities that are principally supported by taxes and intergovernmental revenues. For the City of Auburn,governmental activities include general government, public safety, transportation and community development.
Business-type activities
These are activities that are primarily funded through user fees and charges. The City of Auburn's business-typeactivities include the airport and wastewater treatment operating facility.
3

CITY OF AUBURNMANAGEMENT'S DISCUSSION AND ANALYSIS
FOR THE YEAR ENDED JUNE 30, 2018
Fund Financial Statements
A fund is a grouping of related accounts that is used to maintain control over resources that have been segregated forspecific activities or objectives. The City of Auburn, like other state and local governments, uses fund accounting toensure and demonstrate compliance with finance-related legal requirements. The funds used by the City are dividedinto three categories: governmental funds, proprietary funds, and fiduciary funds.
Governmental funds
Governmental funds are used to account for essentially the same functions reported as governmental activities in thegovernment-wide financial statements. However, unlike the government-wide financial statements, which focus on thelong-term, governmental fund financial statements focus on short-term inflows and outflows of spendable resourcesand the balances of those spendable resources available for spending. This information is useful in evaluating agovernment’s short-term financing requirements.
To assist the user of these financial statements in understanding the differences and the relationship between thegovernment-wide financial statements and the governmental funds financial statements, reconciliations between thetwo sets of statements have been included in this report.
The reconciliation of the Governmental Funds Balance Sheet to the Government-wide Statement of Net Positionhighlights the inclusion of capital assets and long-term liabilities in the government-wide financial statements.
The reconciliation of the Governmental Funds Statement of Revenues, Expenditures, and Changes in Fund Balancesto the Government-wide Statement of Activities highlights the exclusion of capital expenditures, depreciation, andcash flows related to long-term liabilities from the governmental fund statements.
The City of Auburn maintains numerous individual funds, which for financial reporting, are grouped according to theirtype (general fund, special revenue, and capital projects). Funds whose expenditures exceed 10% of the totalexpenditures for all governmental funds, or meet other specific criteria for determining their importance to the financialstatement user, are designated Major Funds, and are reported separately in the governmental funds statements. Allother funds are grouped together for reporting purposes. Major funds for the City of Auburn are:
General Fund Transportation HOME Housing Rehabilitation & First Time Homebuyer
Individual fund data for each non-major governmental fund is provided in combining statements included in theSupplementary Information section of this report.
Proprietary funds
Proprietary funds are generally used to account for services for which the City charges customers - either outsidecustomers, or internal units of departments with the City. Proprietary funds provide the same type of information asshown in the government-wide financial statements, only in more detail. Proprietary funds are used to report the samefunctions presented as business-type activities in the government-wide financial statements. The City uses proprietaryfunds to account for the Auburn Airport and the Waste Water Treatment Facility.
Fiduciary funds
Fiduciary funds are used to account for resources held for the benefit of parties outside of the reporting government.Fiduciary funds are not reflected in the government-wide financial statements because the resources of those fundsare not available to support the City’s own programs. The City utilizes two types of fiduciary funds:
Private-purpose trust funds are used to report all other trust arrangements under which principal andincome benefit individuals, private organizations, or other governments.
Agency funds are use to record assets of separate organizations for which the City serves as acustodian for the organization. All assets in agency funds are offset by a liability to the organization onwhose behalf they are held.
4

CITY OF AUBURNMANAGEMENT'S DISCUSSION AND ANALYSIS
FOR THE YEAR ENDED JUNE 30, 2018
Notes to the Financial Statements
The notes to the financial statements provide additional information that is essential to a full understanding of the dataprovided in the government-wide and fund financial statements. The notes to the financial statements follow the basicfinancial statements.
Required Supplementary Information
This report presents required supplementary information concerning the City of Auburn’s progress in its obligation toprovide pension and other post-employment benefits to its employees, and budgetary comparison information for theCity's general fund and major special revenue funds.
Combining and Individual Fund Statements and Schedules
This final section of the report includes combining information for the City's non-major funds and fiduciary funds.
GOVERNMENT-WIDE FINANCIAL ANALYSIS
This section of the Management Discussion and Analysis provides a comparison and review of governmentalactivities for two fiscal years. In addition, an analysis of the current fiscal year net position and changes in net positionis provided.
Table 1Statement of Net Position
As of June 30, 2018 and 2017(in thousands)
Governmental Activities Business-Type Activities Total Government
2018 2017 Net
Change 2018 2017Net
Change 2018 2017 Net
ChangeASSETS
Current and otherassets $ 11,619 $ 10,681 $ 938 $ 11,314 $ 5,453 $ 5,861 $ 22,933 $ 16,134 $ 6,799
Capital assets 19,838 20,612 (774) 38,976 35,188 3,788 58,814 55,800 3,014Total Assets 31,457 31,293 164 50,290 40,641 9,649 81,747 71,934 9,813
DEFERREDOUTFLOWS OFRESOURCES
5,041 4,241 800 1,329 1,192 137 6,370 5,433 937
LIABILITIESCurrent and other
liabilities 2,317 1,595 722 1,146 1,469 (323) 3,463 3,064 399Long-term liabilities 21,489 20,094 1,395 17,526 8,271 9,255 39,015 28,365 10,650
Total Liabilities 23,806 21,689 2,117 18,672 9,740 8,932 42,478 31,429 11,049
DEFERRED INFLOWSOF RESOURCES 898 1,040 (142) 123 67 56 1,021 1,107 (86)
NET POSITIONNet investment in
capital assets 19,644 20,247 (603) 23,392 28,337 (4,945) 43,036 48,584 (5,548)Restricted 2,118 2,112 6 - - - 2,118 2,112 6Unrestricted (9,968) (9,554) (414) 9,432 3,689 5,743 (536) (5,865) 5,329
Total Net Position $ 11,794 $ 12,805 $ (1,011) $ 32,824 $ 32,026 $ 798 $ 44,618 $ 44,831 $ (213)
5

CITY OF AUBURNMANAGEMENT'S DISCUSSION AND ANALYSIS
FOR THE YEAR ENDED JUNE 30, 2018
Governmental Activities
The City's governmental net position amounted to $11.8 million as of June 30, 2018, a decrease of approximately$(1,011) thousand over the fiscal year ended June 30, 2017. This decrease is the change in net position reflected inthe Governmental Activities column of the Statement of Activities, including pension adjustments reflected in Table 1.The City's net position from governmental activities as of June 30, 2018, is comprised of the following:
Cash and investments comprised $6,953,846 in the City treasury, $119,979 of which is restricted in use.Substantially all of these amounts were held in short to medium term investments in governmental securities andcorporate notes, as detailed in Note 2 to the financial statements.
Current accounts, taxes and intergovernmental receivables comprised $2,180,987, a decrease of $13,583 overthe previous year.
Loans receivable comprised $2,217,386, all of which represents loans provided by the City's Home InvestmentPartnerships Program to support first time homebuyers and housing rehabilitation and Community DevelopmentBlock Grant Program to support small business development.
Capital assets of $19,837,699, net of accumulated depreciation, which includes City infrastructure, buildings andimprovements, equipment, land improvements and related construction in progress.
Current liabilities, including accounts and interest payable, deposits and unearned revenues comprised$1,477,511.
A net pension liability of $16,093,934 and net OPEB liability of $1,557,857. Long-term liabilities comprised $4,676,774, which includes Pension Obligation Bond Series A-1, issued in 2006. Net position invested in capital assets net of related debt of $19.6 million, a slight decrease over the previous year
($20.2 million). This represents the City's investment in infrastructure and other capital assets used ingovernmental activities, net of amounts borrowed to finance that investment.
Restricted net position totaling $2.1 million which may be used only to construct specified capital projects or forpublic safety programs, street maintenance and construction, solid waste management, and communitydevelopment.
Unrestricted net position is the portion of net position that can be used to finance day-to-day operations withoutconstraints established by debt covenants or other legal requirements or restrictions. The City had a negativeunrestricted net position of $(9,967,752) as of June 30, 2018. This is due to long-term pension obligations andlong-term OPEB obligation that are now shown in the financial statements per GASB No. 68 and No. 75,respectively.
Business-Type Activities
Cash and investments comprised $9,269,671 in the City Treasury, $23,050 of which is restricted in use asdetailed in Note 2 to the financial statements.
Current accounts, taxes and intergovernmental receivables comprised $2,044,280. Total capital assets of $38,976,274, net of accumulated depreciation. Current liabilities, including accounts and interest payable, and deposits, comprised $662,567. A net pension liability of $1,294,137 and net OPEB liability of $80,698. Long-term liabilities comprised $16,634,926. Net position invested in capital assets net of related debt of $23.4 million, representing the City's investment in
infrastructure and other capital assets used in business-type activities, net of amounts borrowed to finance thatinvestment.
Unrestricted net position of $9,432,477.
6
CITY OF AUBURNMANAGEMENT'S DISCUSSION AND ANALYSIS
FOR THE YEAR ENDED JUNE 30, 2018
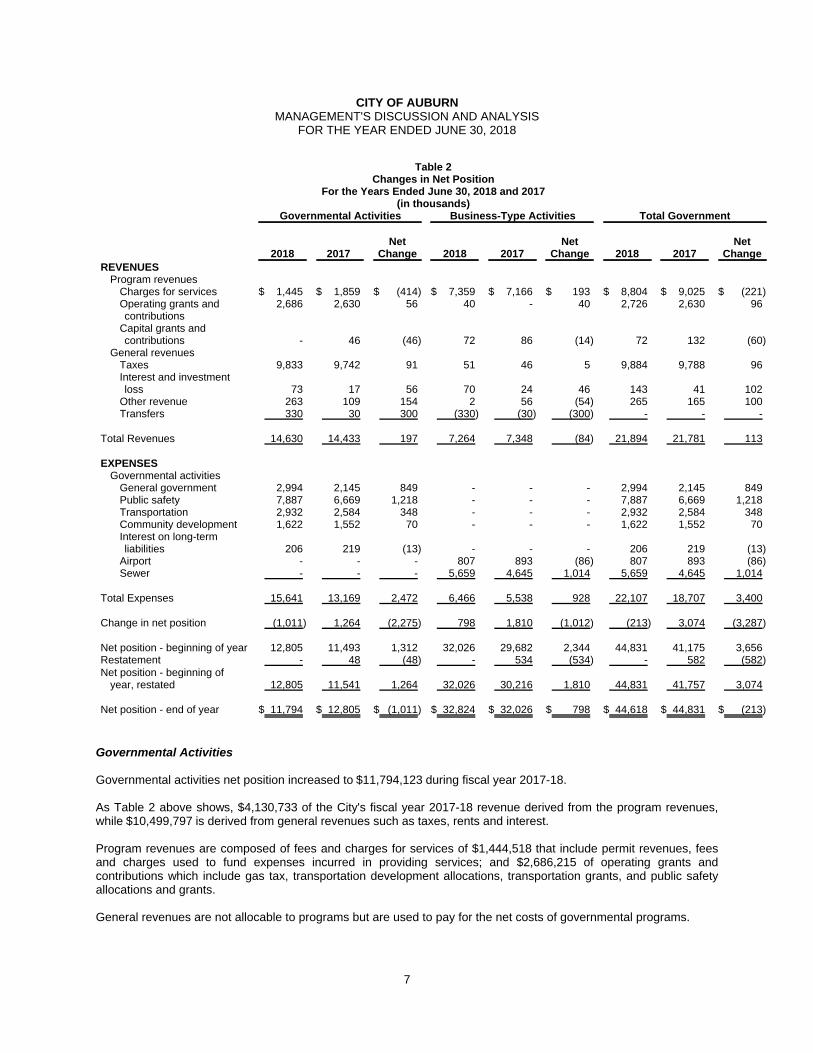
Table 2Changes in Net Position
For the Years Ended June 30, 2018 and 2017(in thousands)
Governmental Activities Business-Type Activities Total Government
2018 2017 Net
Change 2018 2017Net
Change 2018 2017Net
ChangeREVENUES
Program revenuesCharges for services $ 1,445 $ 1,859 $ (414) $ 7,359 $ 7,166 $ 193 $ 8,804 $ 9,025 $ (221)Operating grants andcontributions
2,686 2,630 56 40 - 40 2,726 2,630 96
Capital grants andcontributions - 46 (46) 72 86 (14) 72 132 (60)
General revenuesTaxes 9,833 9,742 91 51 46 5 9,884 9,788 96Interest and investmentloss 73 17 56 70 24 46 143 41 102
Other revenue 263 109 154 2 56 (54) 265 165 100Transfers 330 30 300 (330) (30) (300) - - -
Total Revenues 14,630 14,433 197 7,264 7,348 (84) 21,894 21,781 113
EXPENSESGovernmental activities
General government 2,994 2,145 849 - - - 2,994 2,145 849Public safety 7,887 6,669 1,218 - - - 7,887 6,669 1,218Transportation 2,932 2,584 348 - - - 2,932 2,584 348Community development 1,622 1,552 70 - - - 1,622 1,552 70Interest on long-termliabilities 206 219 (13) - - - 206 219 (13)
Airport - - - 807 893 (86) 807 893 (86)Sewer - - - 5,659 4,645 1,014 5,659 4,645 1,014
Total Expenses 15,641 13,169 2,472 6,466 5,538 928 22,107 18,707 3,400
Change in net position (1,011) 1,264 (2,275) 798 1,810 (1,012) (213) 3,074 (3,287)
Net position - beginning of year 12,805 11,493 1,312 32,026 29,682 2,344 44,831 41,175 3,656Restatement - 48 (48) - 534 (534) - 582 (582)Net position - beginning of
year, restated 12,805 11,541 1,264 32,026 30,216 1,810 44,831 41,757 3,074
Net position - end of year $ 11,794 $ 12,805 $ (1,011) $ 32,824 $ 32,026 $ 798 $ 44,618 $ 44,831 $ (213)
Governmental Activities
Governmental activities net position increased to $11,794,123 during fiscal year 2017-18.
As Table 2 above shows, $4,130,733 of the City's fiscal year 2017-18 revenue derived from the program revenues,while $10,499,797 is derived from general revenues such as taxes, rents and interest.
Program revenues are composed of fees and charges for services of $1,444,518 that include permit revenues, feesand charges used to fund expenses incurred in providing services; and $2,686,215 of operating grants andcontributions which include gas tax, transportation development allocations, transportation grants, and public safetyallocations and grants.
General revenues are not allocable to programs but are used to pay for the net costs of governmental programs.
7

CITY OF AUBURNMANAGEMENT'S DISCUSSION AND ANALYSIS
FOR THE YEAR ENDED JUNE 30, 2018
Business-Type Activities
Business-type activities net position increased to $32,824,229 during fiscal year 2017-18.
Net position in the City's Airport fund increased by $57,484 during fiscal year 2017-18. The increase is primarilyattributable to a reimbursement received for water line costs related to a new hangar being built.
Net position in the City's Sewer fund increased $741,156 during fiscal year 2017-18. The increase can be attributed toincreased sewer fees offset by lower maintenance costs.
FINANCIAL ANALYSIS OF THE CITY’S FUNDS
As noted earlier, the City uses fund accounting to ensure compliance with finance-related legal requirements. Thefund financial statements presented in this report address the need of the City to demonstrate compliance withfinancial restrictions and allow the statement’s users to separately analyze individual funds.
The focus of the City’s governmental funds is to provide information on near-term inflows, outflows, and balances ofresources that are available for spending. Such information is useful in assessing the City’s financing requirements. Inparticular, unassigned fund balances may serve as a useful measure of a government’s net resources available forspending at the end of the fiscal year.
Table 3Revenues Classified by Source
Governmental FundsFor the Years Ended June 30, 2018 and 2017
(in thousands)2018 2017
Amount % of Total Amount % of Total Variance % Change
Taxes $ 9,833,554 %68.4 $ 9,742,237 %69.1 $ 91,317 %0.9Licenses and permits 744,953 %5.2 699,752 %5.0 45,201 %6.5Fines and forfeitures 130,891 %0.9 68,699 %0.5 62,192 %90.5Use of money and property 372,647 %2.6 339,164 %2.4 33,483 %9.9Intergovernmental 2,686,215 %18.7 2,310,359 %16.4 375,856 %16.3Charges for services 326,781 %2.3 687,819 %4.9 (361,038) %(52.5)Other revenues 290,283 %2.0 242,380 %1.7 47,903 %19.8
$ 14,385,324 %100.1 $ 14,090,410 %100.0 $ 294,914 %2.1
Collections of taxes increased by $91,317, primarily due as a result of increase in assessed valuation resulting inhigher levels of property taxes.
Collections of licenses and permits increased by $45,201 due primarily to a one-time recognition of business licenserevenues resulting from a change in billing practices.
Collections of fines, forfeitures and penalties increased by $62,192 due to higher collections of traffic and civil fines.
Collections of intergovernmental revenues increased by $375,856 million due to continued increased collections ofrevenues related to transportation activities.
Collections of charges for services decreased by $(361,038) due to decreased development fee collections comparedto the prior year.
Collections of other revenues increased by $47,903.
8
CITY OF AUBURNMANAGEMENT'S DISCUSSION AND ANALYSIS
FOR THE YEAR ENDED JUNE 30, 2018
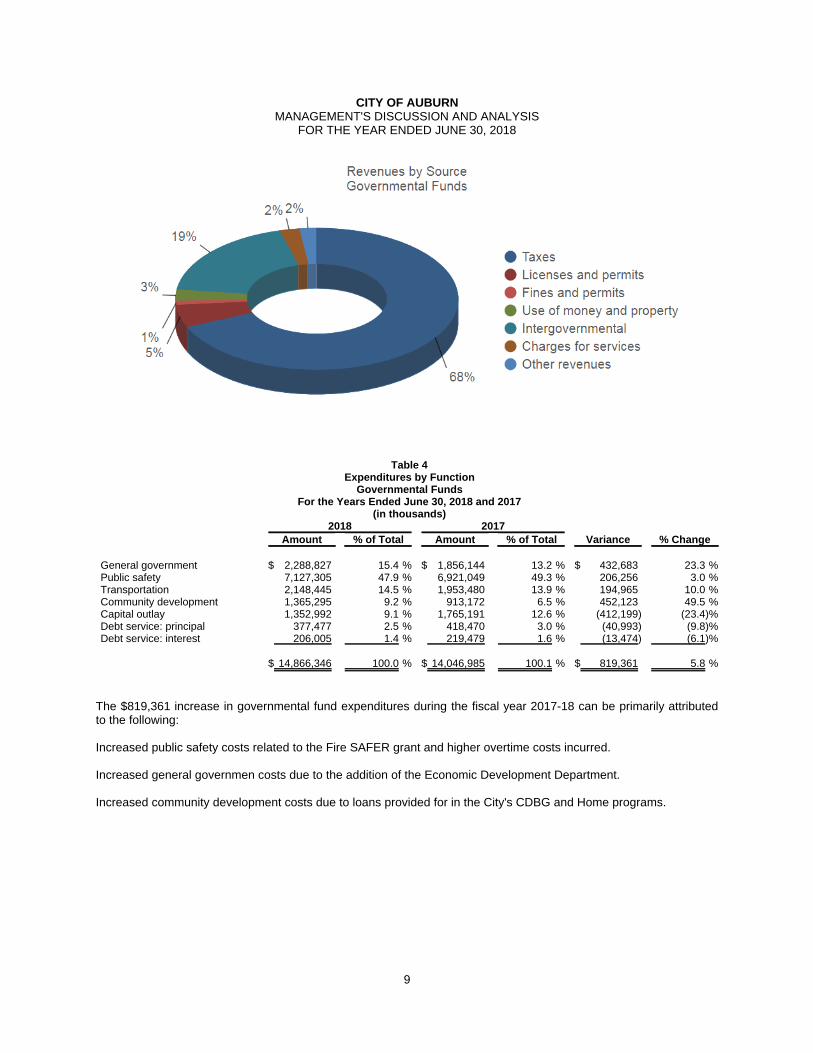
Table 4Expenditures by Function
Governmental FundsFor the Years Ended June 30, 2018 and 2017
(in thousands)2018 2017
Amount % of Total Amount % of Total Variance % Change
General government $ 2,288,827 %15.4 $ 1,856,144 %13.2 $ 432,683 %23.3Public safety 7,127,305 %47.9 6,921,049 %49.3 206,256 %3.0Transportation 2,148,445 %14.5 1,953,480 %13.9 194,965 %10.0Community development 1,365,295 %9.2 913,172 %6.5 452,123 %49.5Capital outlay 1,352,992 %9.1 1,765,191 %12.6 (412,199) %(23.4)Debt service: principal 377,477 %2.5 418,470 %3.0 (40,993) %(9.8)Debt service: interest 206,005 %1.4 219,479 %1.6 (13,474) %(6.1)
$ 14,866,346 %100.0 $ 14,046,985 %100.1 $ 819,361 %5.8
The $819,361 increase in governmental fund expenditures during the fiscal year 2017-18 can be primarily attributedto the following:
Increased public safety costs related to the Fire SAFER grant and higher overtime costs incurred.
Increased general governmen costs due to the addition of the Economic Development Department.
Increased community development costs due to loans provided for in the City's CDBG and Home programs.
9
CITY OF AUBURNMANAGEMENT'S DISCUSSION AND ANALYSIS
FOR THE YEAR ENDED JUNE 30, 2018
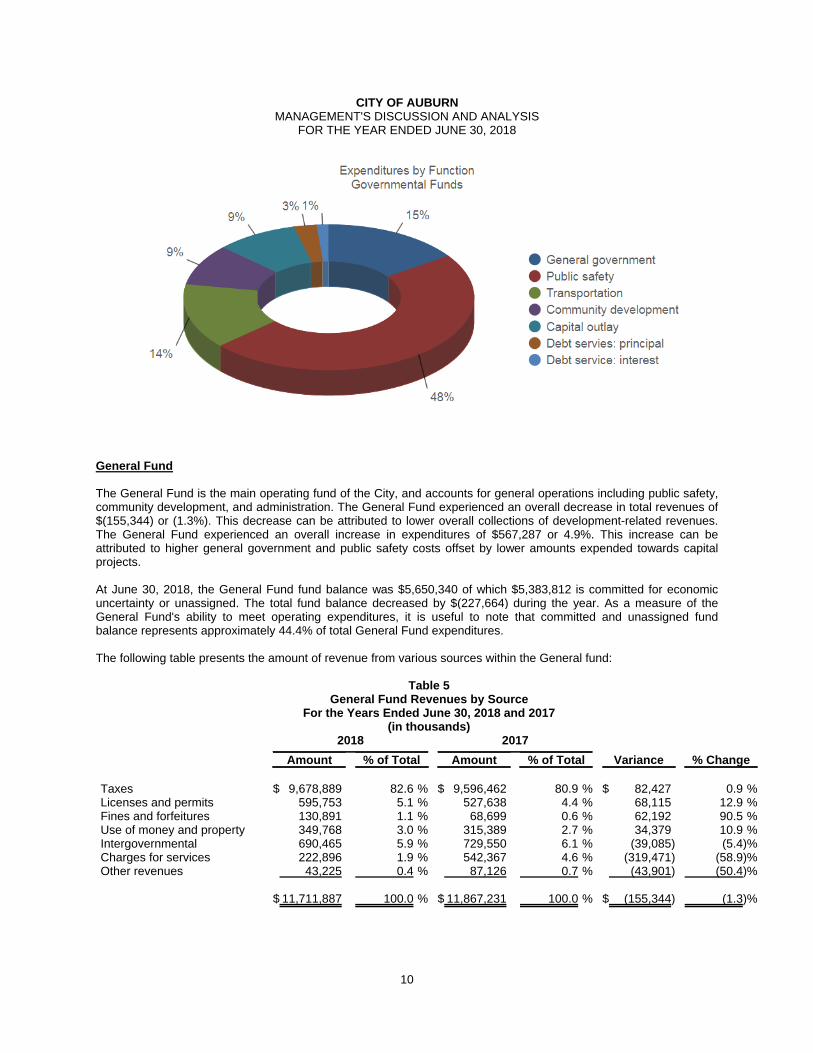
General Fund
The General Fund is the main operating fund of the City, and accounts for general operations including public safety,community development, and administration. The General Fund experienced an overall decrease in total revenues of$(155,344) or (1.3%). This decrease can be attributed to lower overall collections of development-related revenues.The General Fund experienced an overall increase in expenditures of $567,287 or 4.9%. This increase can beattributed to higher general government and public safety costs offset by lower amounts expended towards capitalprojects.
At June 30, 2018, the General Fund fund balance was $5,650,340 of which $5,383,812 is committed for economicuncertainty or unassigned. The total fund balance decreased by $(227,664) during the year. As a measure of theGeneral Fund's ability to meet operating expenditures, it is useful to note that committed and unassigned fundbalance represents approximately 44.4% of total General Fund expenditures.
The following table presents the amount of revenue from various sources within the General fund:
Table 5General Fund Revenues by Source
For the Years Ended June 30, 2018 and 2017(in thousands)
2018 2017
Amount % of Total Amount % of Total Variance % Change
Taxes $ 9,678,889 %82.6 $ 9,596,462 %80.9 $ 82,427 %0.9Licenses and permits 595,753 %5.1 527,638 %4.4 68,115 %12.9Fines and forfeitures 130,891 %1.1 68,699 %0.6 62,192 %90.5Use of money and property 349,768 %3.0 315,389 %2.7 34,379 %10.9Intergovernmental 690,465 %5.9 729,550 %6.1 (39,085) %(5.4)Charges for services 222,896 %1.9 542,367 %4.6 (319,471) %(58.9)Other revenues 43,225 %0.4 87,126 %0.7 (43,901) %(50.4)
$ 11,711,887 %100.0 $ 11,867,231 %100.0 $ (155,344) %(1.3)
10
CITY OF AUBURNMANAGEMENT'S DISCUSSION AND ANALYSIS
FOR THE YEAR ENDED JUNE 30, 2018
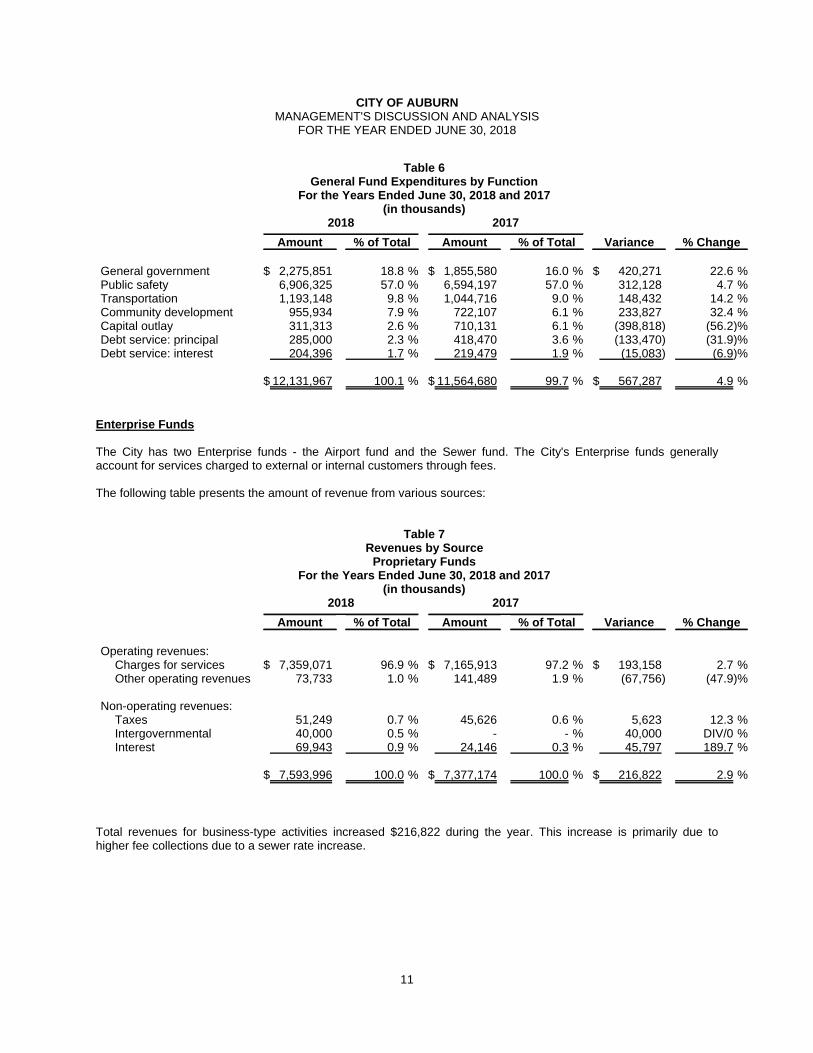
Table 6General Fund Expenditures by Function
For the Years Ended June 30, 2018 and 2017(in thousands)
2018 2017
Amount % of Total Amount % of Total Variance % Change
General government $ 2,275,851 %18.8 $ 1,855,580 %16.0 $ 420,271 %22.6Public safety 6,906,325 %57.0 6,594,197 %57.0 312,128 %4.7Transportation 1,193,148 %9.8 1,044,716 %9.0 148,432 %14.2Community development 955,934 %7.9 722,107 %6.1 233,827 %32.4Capital outlay 311,313 %2.6 710,131 %6.1 (398,818) %(56.2)Debt service: principal 285,000 %2.3 418,470 %3.6 (133,470) %(31.9)Debt service: interest 204,396 %1.7 219,479 %1.9 (15,083) %(6.9)
$ 12,131,967 %100.1 $ 11,564,680 %99.7 $ 567,287 %4.9
Enterprise Funds
The City has two Enterprise funds - the Airport fund and the Sewer fund. The City's Enterprise funds generallyaccount for services charged to external or internal customers through fees.
The following table presents the amount of revenue from various sources:
Table 7Revenues by Source
Proprietary FundsFor the Years Ended June 30, 2018 and 2017
(in thousands)2018 2017
Amount % of Total Amount % of Total Variance % Change
Operating revenues:Charges for services $ 7,359,071 %96.9 $ 7,165,913 %97.2 $ 193,158 %2.7Other operating revenues 73,733 %1.0 141,489 %1.9 (67,756) %(47.9)
Non-operating revenues:Taxes 51,249 %0.7 45,626 %0.6 5,623 %12.3Intergovernmental 40,000 %0.5 - %- 40,000 %DIV/0Interest 69,943 %0.9 24,146 %0.3 45,797 %189.7
$ 7,593,996 %100.0 $ 7,377,174 %100.0 $ 216,822 %2.9
Total revenues for business-type activities increased $216,822 during the year. This increase is primarily due tohigher fee collections due to a sewer rate increase.
11

CITY OF AUBURNMANAGEMENT'S DISCUSSION AND ANALYSIS
FOR THE YEAR ENDED JUNE 30, 2018
The following table presents the amount of expenses for the City's proprietary funds:
Table 8Expenses by TypeProprietary Funds
For the Years Ended June 30, 2018 and 2017(in thousands)
2018 2017
Amount % of Total Amount % of Total Variance % Change
Operating expenses:Salaries and benefits $ 1,008,845 %14.9 $ 931,483 %16.8 $ 77,362 %8.3Services and supplies 2,837,061 %41.7 2,557,966 %45.9 279,095 %10.9Maintenance 727,423 %10.7 243,232 %4.4 484,191 %199.1Depreciation 1,610,816 %23.7 1,558,122 %28.0 52,694 %3.4
Non-operating expensesInterest and amortization 281,211 %4.1 246,300 %4.4 34,911 %14.2Transfers 330,000 %4.9 30,000 %0.5 300,000 %1,000.0
$ 6,795,356 %100.0 $ 5,567,103 %100.0 $ 1,228,253 %22.1
The $1,228,253 net increase in proprietary fund expenses during the fiscal year can be primarily attributed to thefollowing:
A $77,362 increase in salaries and benefits related to an adjustment recognized for the City's pension costdistribution in the City's Sewer fund.
A $279,095 increase in services and supplies related to increased sewer system and airport operating costs. A $484,191 increase in maintenance expenses related to higher sewer capital and maintenance costs. An increase in transfers out to other funds related to the sewer line work for the Nevada Street Sidewalk Project.
12
CITY OF AUBURNMANAGEMENT'S DISCUSSION AND ANALYSIS
FOR THE YEAR ENDED JUNE 30, 2018
CAPITAL ASSETS AND DEBT ADMINISTRATION
Capital Assets
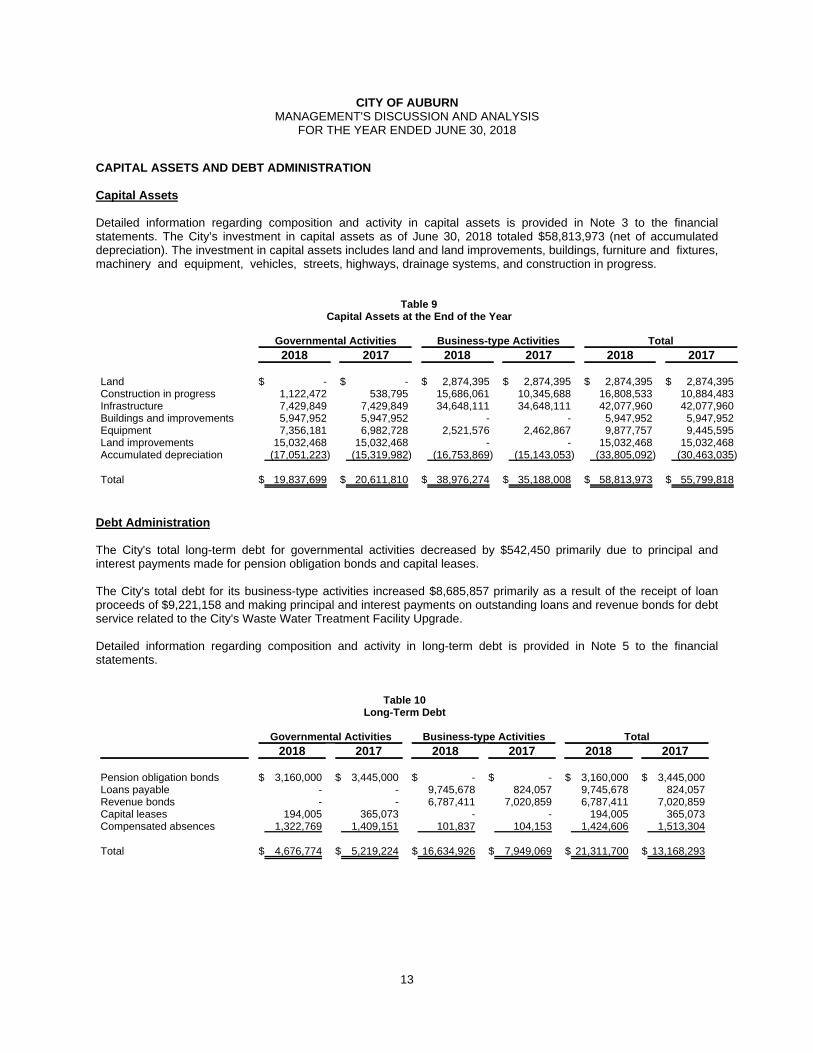
Detailed information regarding composition and activity in capital assets is provided in Note 3 to the financialstatements. The City’s investment in capital assets as of June 30, 2018 totaled $58,813,973 (net of accumulateddepreciation). The investment in capital assets includes land and land improvements, buildings, furniture and fixtures,machinery and equipment, vehicles, streets, highways, drainage systems, and construction in progress.
Table 9Capital Assets at the End of the Year
Governmental Activities Business-type Activities Total2018 2017 2018 2017 2018 2017
Land $ - $ - $ 2,874,395 $ 2,874,395 $ 2,874,395 $ 2,874,395Construction in progress 1,122,472 538,795 15,686,061 10,345,688 16,808,533 10,884,483Infrastructure 7,429,849 7,429,849 34,648,111 34,648,111 42,077,960 42,077,960Buildings and improvements 5,947,952 5,947,952 - - 5,947,952 5,947,952Equipment 7,356,181 6,982,728 2,521,576 2,462,867 9,877,757 9,445,595Land improvements 15,032,468 15,032,468 - - 15,032,468 15,032,468Accumulated depreciation (17,051,223) (15,319,982) (16,753,869) (15,143,053) (33,805,092) (30,463,035)
Total $ 19,837,699 $ 20,611,810 $ 38,976,274 $ 35,188,008 $ 58,813,973 $ 55,799,818
Debt Administration
The City's total long-term debt for governmental activities decreased by $542,450 primarily due to principal andinterest payments made for pension obligation bonds and capital leases.
The City's total debt for its business-type activities increased $8,685,857 primarily as a result of the receipt of loanproceeds of $9,221,158 and making principal and interest payments on outstanding loans and revenue bonds for debtservice related to the City's Waste Water Treatment Facility Upgrade.
Detailed information regarding composition and activity in long-term debt is provided in Note 5 to the financialstatements.
Table 10Long-Term Debt
Governmental Activities Business-type Activities Total2018 2017 2018 2017 2018 2017
Pension obligation bonds $ 3,160,000 $ 3,445,000 $ - $ - $ 3,160,000 $ 3,445,000Loans payable - - 9,745,678 824,057 9,745,678 824,057Revenue bonds - - 6,787,411 7,020,859 6,787,411 7,020,859Capital leases 194,005 365,073 - - 194,005 365,073Compensated absences 1,322,769 1,409,151 101,837 104,153 1,424,606 1,513,304
Total $ 4,676,774 $ 5,219,224 $ 16,634,926 $ 7,949,069 $ 21,311,700 $ 13,168,293
13
CITY OF AUBURNMANAGEMENT'S DISCUSSION AND ANALYSIS
FOR THE YEAR ENDED JUNE 30, 2018
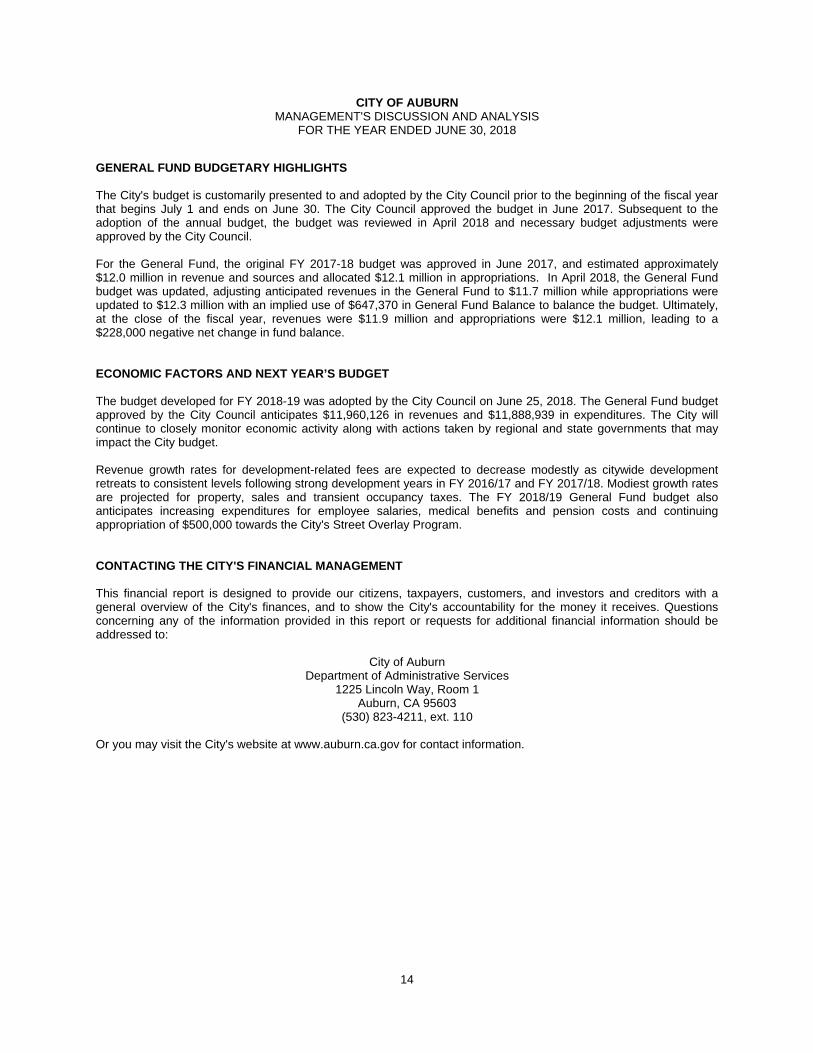
GENERAL FUND BUDGETARY HIGHLIGHTS
The City's budget is customarily presented to and adopted by the City Council prior to the beginning of the fiscal yearthat begins July 1 and ends on June 30. The City Council approved the budget in June 2017. Subsequent to theadoption of the annual budget, the budget was reviewed in April 2018 and necessary budget adjustments wereapproved by the City Council.
For the General Fund, the original FY 2017-18 budget was approved in June 2017, and estimated approximately$12.0 million in revenue and sources and allocated $12.1 million in appropriations. In April 2018, the General Fundbudget was updated, adjusting anticipated revenues in the General Fund to $11.7 million while appropriations wereupdated to $12.3 million with an implied use of $647,370 in General Fund Balance to balance the budget. Ultimately,at the close of the fiscal year, revenues were $11.9 million and appropriations were $12.1 million, leading to a$228,000 negative net change in fund balance.
ECONOMIC FACTORS AND NEXT YEAR’S BUDGET
The budget developed for FY 2018-19 was adopted by the City Council on June 25, 2018. The General Fund budgetapproved by the City Council anticipates $11,960,126 in revenues and $11,888,939 in expenditures. The City willcontinue to closely monitor economic activity along with actions taken by regional and state governments that mayimpact the City budget.
Revenue growth rates for development-related fees are expected to decrease modestly as citywide developmentretreats to consistent levels following strong development years in FY 2016/17 and FY 2017/18. Modiest growth ratesare projected for property, sales and transient occupancy taxes. The FY 2018/19 General Fund budget alsoanticipates increasing expenditures for employee salaries, medical benefits and pension costs and continuingappropriation of $500,000 towards the City's Street Overlay Program.
CONTACTING THE CITY'S FINANCIAL MANAGEMENT
This financial report is designed to provide our citizens, taxpayers, customers, and investors and creditors with ageneral overview of the City's finances, and to show the City's accountability for the money it receives. Questionsconcerning any of the information provided in this report or requests for additional financial information should beaddressed to:
City of AuburnDepartment of Administrative Services
1225 Lincoln Way, Room 1Auburn, CA 95603
(530) 823-4211, ext. 110
Or you may visit the City's website at www.auburn.ca.gov for contact information.
14

This page is intentionally left blank.

CITY OF AUBURNSTATEMENT OF NET POSITION
JUNE 30, 2018
GovernmentalActivities
Business-typeActivities Total
ASSETS
Cash and investments (Note 2) $ 6,833,867 $ 9,246,621 $ 16,080,488Receivables:
Accounts 292,739 299,924 592,663Intergovernmental 539,712 1,742,771 2,282,483Taxes 1,348,536 1,585 1,350,121
Prepaid items 266,528 - 266,528Loans receivable 2,217,386 - 2,217,386Restricted cash and investments (Note 2) 119,979 23,050 143,029Capital assets (Note 3):
Land and construction in progress 1,122,472 18,560,456 19,682,928Other capital assets, net of depreciation 18,715,227 20,415,818 39,131,045
Total capital assets 19,837,699 38,976,274 58,813,973
Total Assets 31,456,446 50,290,225 81,746,671
DEFERRED OUTFLOWS OF RESOURCES
Deferred amount on bond refunding (Note 6) - 948,567 948,567Changes in the net pension liability (Note 9) 5,041,338 380,760 5,422,098
Total Deferred Outflows of Resources 5,041,338 1,329,327 6,370,665
LIABILITIES
Accounts payable and accrued liabilities 1,357,505 639,517 1,997,022Accrued interest 27 - 27Deposits 119,979 23,050 143,029Long-term liabilities (Note 5):
Due within one year 839,591 483,454 1,323,045Due in more than one year 3,837,183 16,151,472 19,988,655
Net OPEB liability (Note 10):Due in more than one year 1,557,857 80,698 1,638,555
Net pension liability (Note 9):Due in more than one year 16,093,934 1,294,137 17,388,071
Total Liabilities 23,806,076 18,672,328 42,478,404
DEFERRED INFLOWS OF RESOURCES
Changes in the net OPEB liability (Note 10) 71,619 5,474 77,093Changes in the net pension liability (Note 9) 825,966 117,521 943,487
Total Deferred Inflows of Resources 897,585 122,995 1,020,580
NET POSITION
Net investment of capital assets 19,643,694 23,391,752 43,035,446Restricted for:
Public safety 30,954 - 30,954Street maintenance and construction 63,299 - 63,299Solid waste management 298,949 - 298,949Fire protection services 237,758 - 237,758Community development 390,696 - 390,696Capital projects 1,096,525 - 1,096,525
Unrestricted (9,967,752) 9,432,477 (535,275)
Total Net Position $ 11,794,123 $ 32,824,229 $ 44,618,352
See accompanying notes to the basic financial statements.15

CITY OF AUBURNSTATEMENT OF ACTIVITIES
FOR THE YEAR ENDED JUNE 30, 2018
Program Revenues Net (Expense) Revenue and Changes in Net PositionPrimary Government
Functions/Programs ExpensesCharges for
Services
OperatingGrants and
Contributions
CapitalGrants and
ContributionsGovernmental
ActivitiesBusiness-type
Activities TotalPRIMARY GOVERNMENT
Governmental activities:General government $ 2,994,356 $ 901,002 $ 272 $ - $ (2,093,082) $ - $ (2,093,082)Public safety 7,886,666 157,876 822,189 - (6,906,601) - (6,906,601)Transportation 2,932,160 380,508 1,557,897 - (993,755) - (993,755)Community development 1,622,255 5,132 305,857 - (1,311,266) - (1,311,266)Interest and fiscal charges 206,005 - - - (206,005) - (206,005)
Total governmental activities 15,641,442 1,444,518 2,686,215 - (11,510,709) - (11,510,709)
Business-type activities:Airport 806,418 690,185 40,000 71,733 - (4,500) (4,500)Sewer 5,658,938 6,668,886 - - - 1,009,948 1,009,948
Total business-type activities 6,465,356 7,359,071 40,000 71,733 - 1,005,448 1,005,448
Total primary government $ 22,106,798 $ 8,803,589 $ 2,726,215 $ 71,733 (11,510,709) 1,005,448 (10,505,261)
General revenues:Taxes:
Property taxes 3,855,830 51,249 3,907,079Sales and use taxes 4,811,629 - 4,811,629Franchise taxes 756,161 - 756,161Transient occupancy tax 323,551 - 323,551Other taxes 86,383 - 86,383
Interest and investment income 73,030 69,943 142,973Miscellaneous 263,213 2,000 265,213Transfers (Note 4) 330,000 (330,000) -
Total general revenues and transfers 10,499,797 (206,808) 10,292,989
Change in net position (1,010,912) 798,640 (212,272)
Net position - July 1, 2017 12,805,035 32,025,589 44,830,624
Net position - June 30, 2018 $ 11,794,123 $ 32,824,229 $ 44,618,352
See accompanying notes to the basic financial statements.16

CITY OF AUBURNBALANCE SHEET
GOVERNMENTAL FUNDSJUNE 30, 2018
General Fund Transportation
HOMEHousing
Rehabilitation& First TimeHomebuyer
OtherGovernmental
Funds
TotalGovernmental
Funds
ASSETS
Cash and investments $ 4,703,829 $ - $ 12,209 $ 2,117,829 $ 6,833,867Receivables:
Accounts 141,992 - - 150,747 292,739Taxes 1,348,536 - - - 1,348,536Intergovernmental 77,888 461,824 - - 539,712
Due from other funds 342,369 - - - 342,369Prepaid items and supplies 266,528 - - - 266,528Restricted cash and investments 119,979 - - - 119,979Loans receivable - - 2,100,203 117,183 2,217,386
Total Assets $ 7,001,121 $ 461,824 $ 2,112,412 $ 2,385,759 $ 11,961,116
LIABILITIES, DEFERREDINFLOWS OF RESOURCES ANDFUND BALANCES
LIABILITIES
Accounts payable and accrued liabilities $ 1,230,775 $ 55,037 $ - $ 71,693 $ 1,357,505
Accrued interest 27 - - - 27Deposits payable 119,979 - - - 119,979Due to other funds - 61,474 - 280,895 342,369
Total Liabilities 1,350,781 116,511 - 352,588 1,819,880
DEFERRED INFLOWS OFRESOURCES
Unavailable revenues - 461,824 2,100,203 117,183 2,679,210
FUND BALANCES (DEFICITS)
Nonspendable for:Prepaid costs 266,528 - - - 266,528
Restricted - - 12,209 2,118,181 2,130,390Committed to:
Economic uncertainty 2,635,012 - - - 2,635,012Unassigned 2,748,800 (116,511) - (202,193) 2,430,096
Total Fund Balances(Deficits) 5,650,340 (116,511) 12,209 1,915,988 7,462,026
Total Liabilities, DeferredInflows of Resources andFund Balances (Deficits) $ 7,001,121 $ 461,824 $ 2,112,412 $ 2,385,759 $ 11,961,116
See accompanying notes to the basic financial statements.17
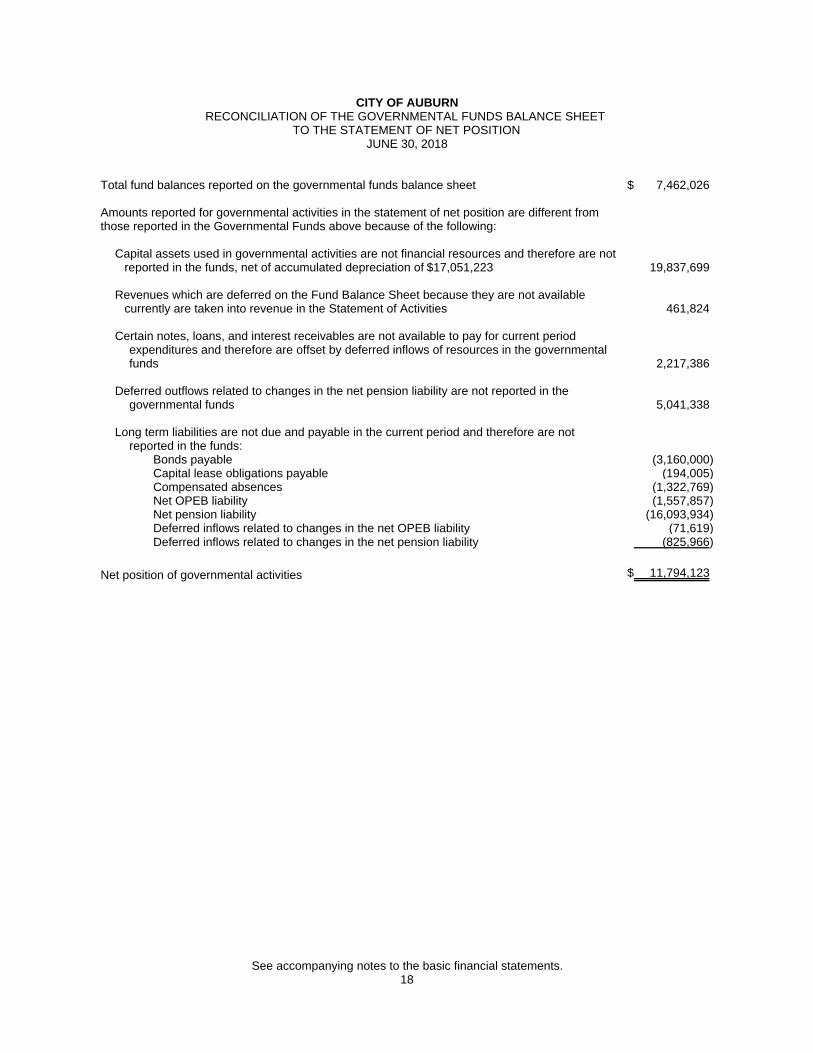
CITY OF AUBURNRECONCILIATION OF THE GOVERNMENTAL FUNDS BALANCE SHEET
TO THE STATEMENT OF NET POSITIONJUNE 30, 2018
Total fund balances reported on the governmental funds balance sheet $ 7,462,026
Amounts reported for governmental activities in the statement of net position are different fromthose reported in the Governmental Funds above because of the following:
Capital assets used in governmental activities are not financial resources and therefore are notreported in the funds, net of accumulated depreciation of $17,051,223 19,837,699
Revenues which are deferred on the Fund Balance Sheet because they are not availablecurrently are taken into revenue in the Statement of Activities 461,824
Certain notes, loans, and interest receivables are not available to pay for current periodexpenditures and therefore are offset by deferred inflows of resources in the governmentalfunds 2,217,386
Deferred outflows related to changes in the net pension liability are not reported in thegovernmental funds 5,041,338
Long term liabilities are not due and payable in the current period and therefore are notreported in the funds:
Bonds payable (3,160,000)Capital lease obligations payable (194,005)Compensated absences (1,322,769)Net OPEB liability (1,557,857)Net pension liability (16,093,934)Deferred inflows related to changes in the net OPEB liability (71,619)Deferred inflows related to changes in the net pension liability (825,966)
Net position of governmental activities $ 11,794,123
See accompanying notes to the basic financial statements.18
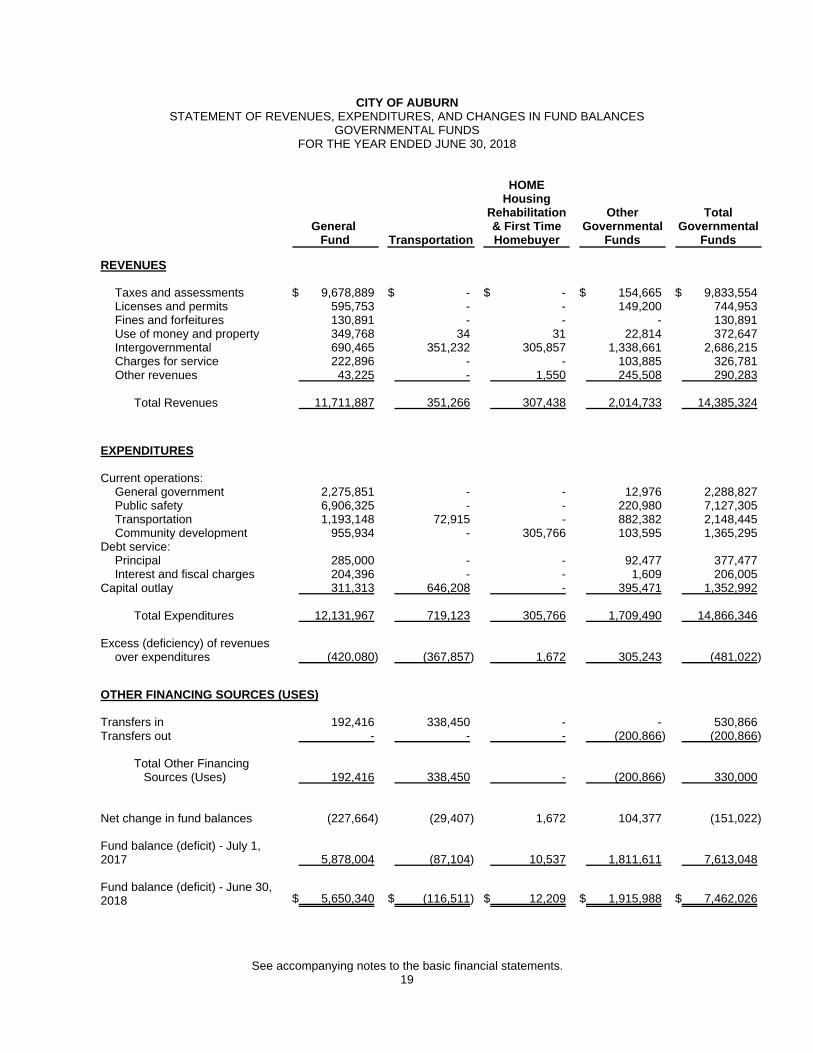
CITY OF AUBURNSTATEMENT OF REVENUES, EXPENDITURES, AND CHANGES IN FUND BALANCES
GOVERNMENTAL FUNDSFOR THE YEAR ENDED JUNE 30, 2018
General Fund Transportation
HOMEHousing
Rehabilitation& First TimeHomebuyer
OtherGovernmental
Funds
TotalGovernmental
Funds
REVENUES
Taxes and assessments $ 9,678,889 $ - $ - $ 154,665 $ 9,833,554Licenses and permits 595,753 - - 149,200 744,953Fines and forfeitures 130,891 - - - 130,891Use of money and property 349,768 34 31 22,814 372,647Intergovernmental 690,465 351,232 305,857 1,338,661 2,686,215Charges for service 222,896 - - 103,885 326,781Other revenues 43,225 - 1,550 245,508 290,283
Total Revenues 11,711,887 351,266 307,438 2,014,733 14,385,324
EXPENDITURES
Current operations:General government 2,275,851 - - 12,976 2,288,827Public safety 6,906,325 - - 220,980 7,127,305Transportation 1,193,148 72,915 - 882,382 2,148,445Community development 955,934 - 305,766 103,595 1,365,295
Debt service:Principal 285,000 - - 92,477 377,477Interest and fiscal charges 204,396 - - 1,609 206,005
Capital outlay 311,313 646,208 - 395,471 1,352,992
Total Expenditures 12,131,967 719,123 305,766 1,709,490 14,866,346
Excess (deficiency) of revenuesover expenditures (420,080) (367,857) 1,672 305,243 (481,022)
OTHER FINANCING SOURCES (USES)
Transfers in 192,416 338,450 - - 530,866Transfers out - - - (200,866) (200,866)
Total Other FinancingSources (Uses) 192,416 338,450 - (200,866) 330,000
Net change in fund balances (227,664) (29,407) 1,672 104,377 (151,022)
Fund balance (deficit) - July 1,2017 5,878,004 (87,104) 10,537 1,811,611 7,613,048
Fund balance (deficit) - June 30,2018 $ 5,650,340 $ (116,511) $ 12,209 $ 1,915,988 $ 7,462,026
See accompanying notes to the basic financial statements.19
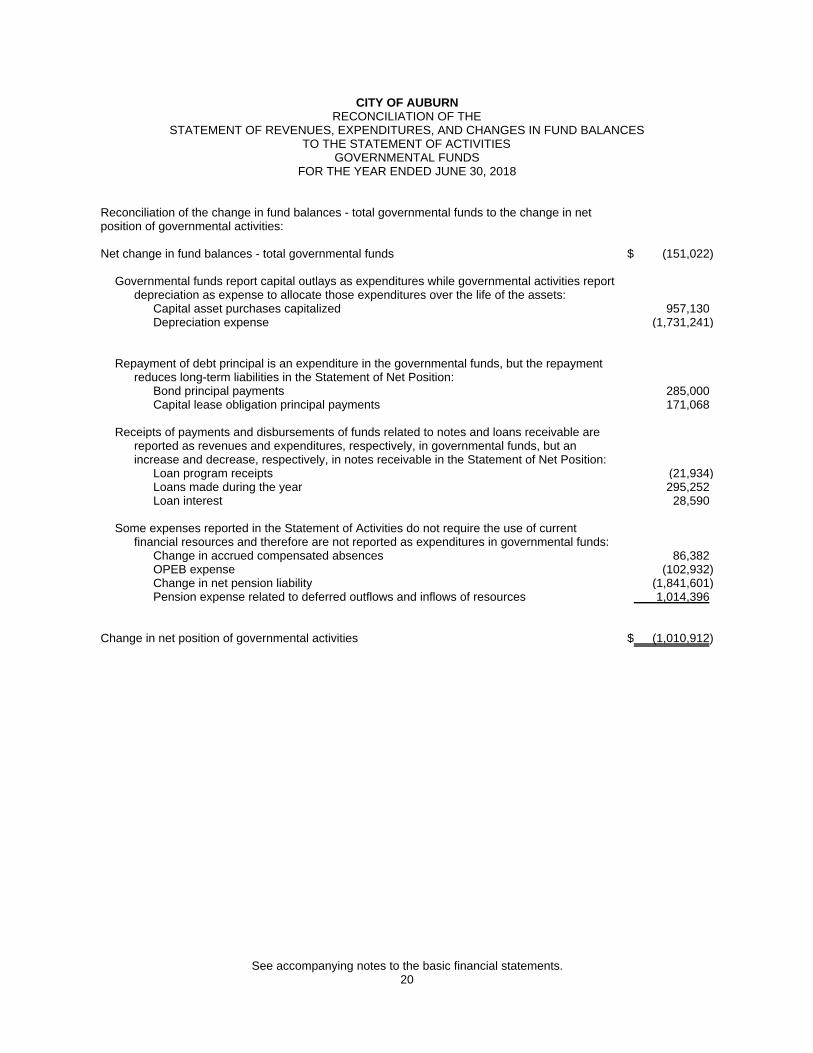
CITY OF AUBURNRECONCILIATION OF THE
STATEMENT OF REVENUES, EXPENDITURES, AND CHANGES IN FUND BALANCESTO THE STATEMENT OF ACTIVITIES
GOVERNMENTAL FUNDSFOR THE YEAR ENDED JUNE 30, 2018
Reconciliation of the change in fund balances - total governmental funds to the change in netposition of governmental activities:
Net change in fund balances - total governmental funds $ (151,022)
Governmental funds report capital outlays as expenditures while governmental activities reportdepreciation as expense to allocate those expenditures over the life of the assets:
Capital asset purchases capitalized 957,130Depreciation expense (1,731,241)
Repayment of debt principal is an expenditure in the governmental funds, but the repaymentreduces long-term liabilities in the Statement of Net Position:
Bond principal payments 285,000Capital lease obligation principal payments 171,068
Receipts of payments and disbursements of funds related to notes and loans receivable arereported as revenues and expenditures, respectively, in governmental funds, but anincrease and decrease, respectively, in notes receivable in the Statement of Net Position:
Loan program receipts (21,934)Loans made during the year 295,252Loan interest 28,590
Some expenses reported in the Statement of Activities do not require the use of currentfinancial resources and therefore are not reported as expenditures in governmental funds:
Change in accrued compensated absences 86,382OPEB expense (102,932)Change in net pension liability (1,841,601)Pension expense related to deferred outflows and inflows of resources 1,014,396
Change in net position of governmental activities $ (1,010,912)
See accompanying notes to the basic financial statements.20
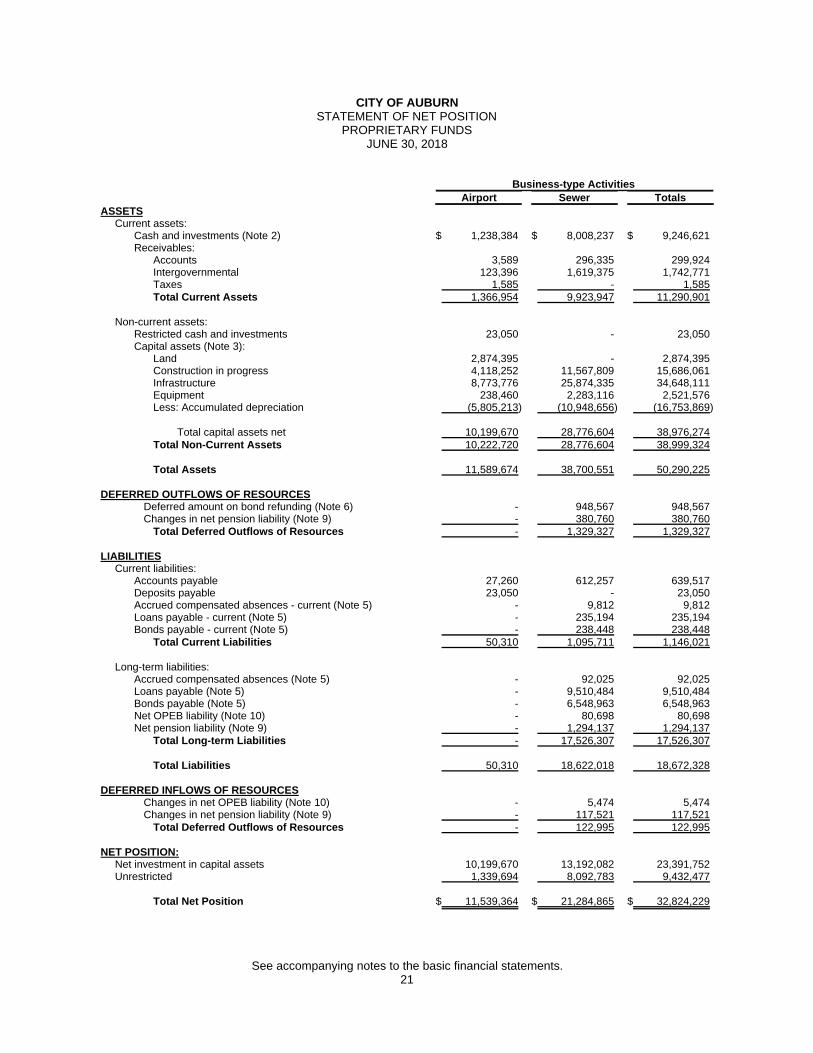
CITY OF AUBURNSTATEMENT OF NET POSITION
PROPRIETARY FUNDSJUNE 30, 2018
Business-type Activities Airport Sewer Totals
ASSETSCurrent assets:
Cash and investments (Note 2) $ 1,238,384 $ 8,008,237 $ 9,246,621Receivables:
Accounts 3,589 296,335 299,924Intergovernmental 123,396 1,619,375 1,742,771Taxes 1,585 - 1,585Total Current Assets 1,366,954 9,923,947 11,290,901
Non-current assets:Restricted cash and investments 23,050 - 23,050Capital assets (Note 3):
Land 2,874,395 - 2,874,395Construction in progress 4,118,252 11,567,809 15,686,061Infrastructure 8,773,776 25,874,335 34,648,111Equipment 238,460 2,283,116 2,521,576Less: Accumulated depreciation (5,805,213) (10,948,656) (16,753,869)
Total capital assets net 10,199,670 28,776,604 38,976,274Total Non-Current Assets 10,222,720 28,776,604 38,999,324
Total Assets 11,589,674 38,700,551 50,290,225
DEFERRED OUTFLOWS OF RESOURCESDeferred amount on bond refunding (Note 6) - 948,567 948,567Changes in net pension liability (Note 9) - 380,760 380,760
Total Deferred Outflows of Resources - 1,329,327 1,329,327
LIABILITIESCurrent liabilities:
Accounts payable 27,260 612,257 639,517Deposits payable 23,050 - 23,050Accrued compensated absences - current (Note 5) - 9,812 9,812Loans payable - current (Note 5) - 235,194 235,194Bonds payable - current (Note 5) - 238,448 238,448
Total Current Liabilities 50,310 1,095,711 1,146,021
Long-term liabilities:Accrued compensated absences (Note 5) - 92,025 92,025Loans payable (Note 5) - 9,510,484 9,510,484Bonds payable (Note 5) - 6,548,963 6,548,963Net OPEB liability (Note 10) - 80,698 80,698Net pension liability (Note 9) - 1,294,137 1,294,137
Total Long-term Liabilities - 17,526,307 17,526,307
Total Liabilities 50,310 18,622,018 18,672,328
DEFERRED INFLOWS OF RESOURCESChanges in net OPEB liability (Note 10) - 5,474 5,474Changes in net pension liability (Note 9) - 117,521 117,521
Total Deferred Outflows of Resources - 122,995 122,995
NET POSITION:Net investment in capital assets 10,199,670 13,192,082 23,391,752Unrestricted 1,339,694 8,092,783 9,432,477
Total Net Position $ 11,539,364 $ 21,284,865 $ 32,824,229
See accompanying notes to the basic financial statements.21

CITY OF AUBURNSTATEMENT OF REVENUES, EXPENSES AND CHANGES IN NET POSITION
PROPRIETARY FUNDSFOR THE YEAR ENDED JUNE 30, 2018
Business-type Activities Airport Sewer Totals
OPERATING REVENUES
Charges for services:User fees and charges $ 115,555 $ 6,277,218 $ 6,392,773Connection fees - 391,668 391,668Rents and concessions 574,630 - 574,630
Other revenues 71,733 2,000 73,733
Total Operating Revenue 761,918 6,670,886 7,432,804
OPERATING EXPENSES
Salaries and benefits 164,721 844,124 1,008,845Services and supplies 141,890 2,695,171 2,837,061Maintenance 67,763 659,660 727,423Depreciation 430,324 1,180,492 1,610,816
Total Operating Expenses 804,698 5,379,447 6,184,145
Operating (Loss) Income (42,780) 1,291,439 1,248,659
NON-OPERATING REVENUE AND EXPENSES
Taxes 51,249 - 51,249Intergovernmental revenue 40,000 - 40,000Interest income 10,735 59,208 69,943Interest expense (1,720) (279,491) (281,211)
Total Non-Operating Revenues and Expenses 100,264 (220,283) (120,019)
Income (Loss) Before Transfers 57,484 1,071,156 1,128,640
TRANSFERS
Transfers out - (330,000) (330,000)
Change in net position 57,484 741,156 798,640
Total Net Position - July 1, 2017 11,481,880 20,543,709 32,025,589
Total Net Position - June 30, 2018 $ 11,539,364 $ 21,284,865 $ 32,824,229
See accompanying notes to the basic financial statements.22

CITY OF AUBURNSTATEMENT OF CASH FLOWS
PROPRIETARY FUNDSFOR THE YEAR ENDED JUNE 30, 2018
Business-type Activities Airport Sewer Totals
CASH FLOWS FROM OPERATING ACTIVITIESCash received from customers $ 773,357 $ 6,657,482 $ 7,430,839Cash paid to suppliers (164,721) (482,390) (647,111)Cash paid to employees (193,295) (3,477,098) (3,670,393)
Net Cash Provided by Operating Activities 415,341 2,697,994 3,113,335
CASH FLOWS FROM NONCAPITAL FINANCINGACTIVITIES
Property taxes 51,318 - 51,318Intergovernmental 40,000 - 40,000Transfers to other funds - (330,000) (330,000)
Net Cash Provided by (Used for) NoncapitalFinancing Activities
91,318 (330,000) (238,682)
CASH FLOWS FROM CAPITAL AND RELATED FINANCINGACTIVITIES
Capital debt issuance - 7,601,883 7,601,883Acquisition and construction of capital assets (84,864) (5,314,221) (5,399,085)Principal paid on capital debt (64,444) (423,471) (487,915)Interest paid on capital debt (3,018) (279,488) (282,506)
Net Cash Provided by (Used for) Capital andRelated Financing Activities
(152,326) 1,584,703 1,432,377
CASH FLOWS FROM INVESTING ACTIVITIESInterest and dividends 10,735 59,208 69,943
Net Cash Provided by Investing Activities 10,735 59,208 69,943
Net Increase in Cash and Cash Equivalents 365,068 4,011,905 4,376,973
Cash and Cash Equivalents - July 1, 2017 896,366 3,996,332 4,892,698
Cash and Cash Equivalents - June 30, 2018 $ 1,261,434 $ 8,008,237 $ 9,269,671
See accompanying notes to the basic financial statements.23
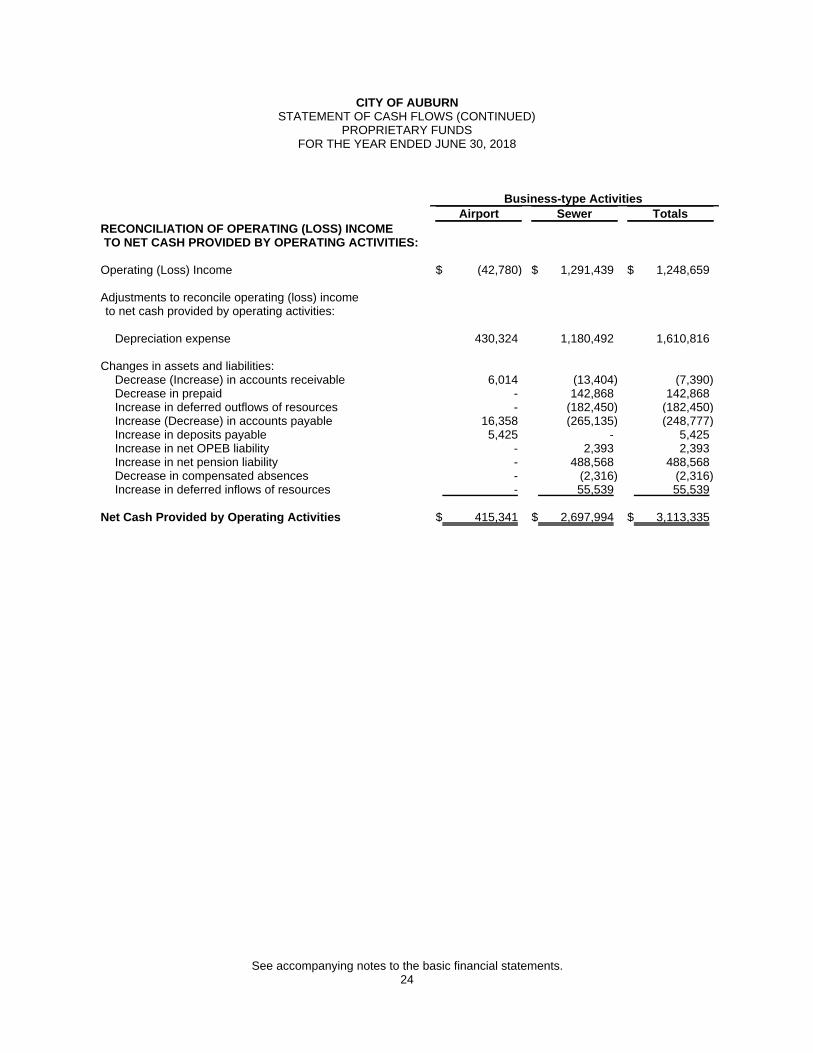
CITY OF AUBURNSTATEMENT OF CASH FLOWS (CONTINUED)
PROPRIETARY FUNDSFOR THE YEAR ENDED JUNE 30, 2018
Business-type Activities Airport Sewer Totals
RECONCILIATION OF OPERATING (LOSS) INCOME TO NET CASH PROVIDED BY OPERATING ACTIVITIES:
Operating (Loss) Income $ (42,780) $ 1,291,439 $ 1,248,659
Adjustments to reconcile operating (loss) incometo net cash provided by operating activities:
Depreciation expense 430,324 1,180,492 1,610,816
Changes in assets and liabilities:Decrease (Increase) in accounts receivable 6,014 (13,404) (7,390)Decrease in prepaid - 142,868 142,868Increase in deferred outflows of resources - (182,450) (182,450)Increase (Decrease) in accounts payable 16,358 (265,135) (248,777)Increase in deposits payable 5,425 - 5,425Increase in net OPEB liability - 2,393 2,393Increase in net pension liability - 488,568 488,568Decrease in compensated absences - (2,316) (2,316)Increase in deferred inflows of resources - 55,539 55,539
Net Cash Provided by Operating Activities $ 415,341 $ 2,697,994 $ 3,113,335
See accompanying notes to the basic financial statements.24
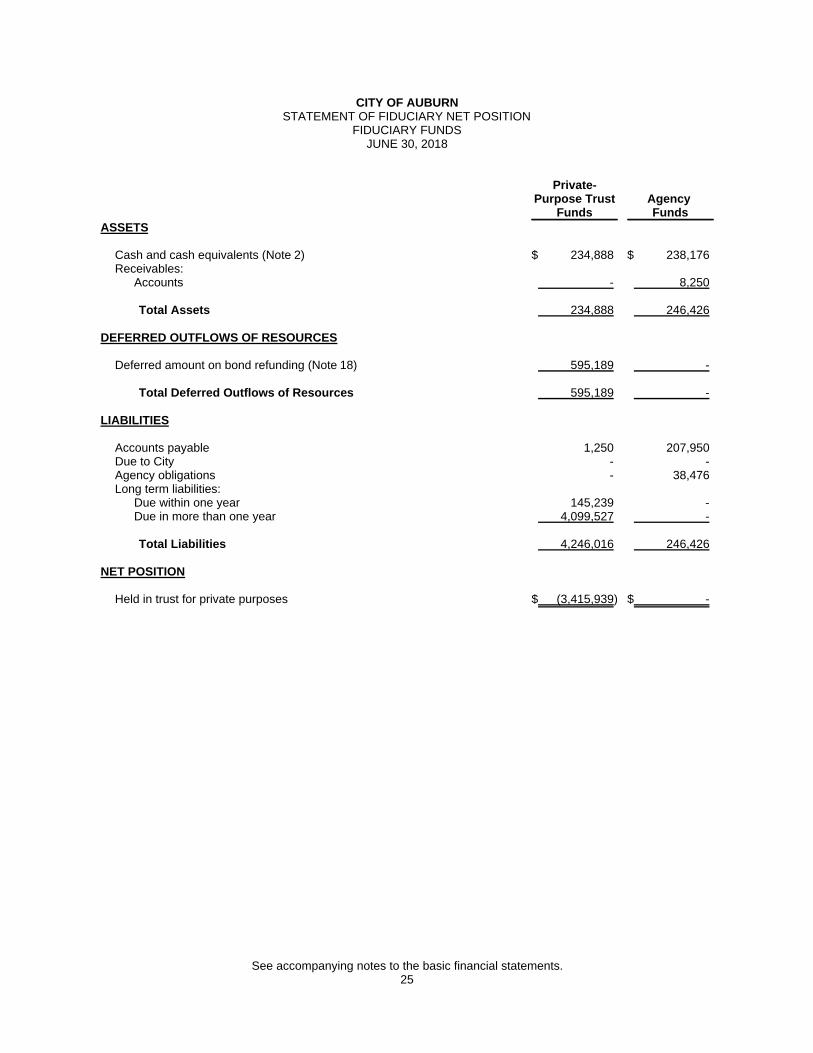
CITY OF AUBURNSTATEMENT OF FIDUCIARY NET POSITION
FIDUCIARY FUNDSJUNE 30, 2018
Private-Purpose Trust
FundsAgency Funds
ASSETS
Cash and cash equivalents (Note 2) $ 234,888 $ 238,176Receivables:
Accounts - 8,250
Total Assets 234,888 246,426
DEFERRED OUTFLOWS OF RESOURCES
Deferred amount on bond refunding (Note 18) 595,189 -
Total Deferred Outflows of Resources 595,189 -
LIABILITIES
Accounts payable 1,250 207,950Due to City - -Agency obligations - 38,476Long term liabilities:
Due within one year 145,239 -Due in more than one year 4,099,527 -
Total Liabilities 4,246,016 246,426
NET POSITION
Held in trust for private purposes $ (3,415,939) $ -
See accompanying notes to the basic financial statements.25

CITY OF AUBURNSTATEMENT OF CHANGES IN FIDUCIARY NET POSITION
FIDUCIARY FUNDSFOR THE YEAR ENDED JUNE 30, 2018
Private-Purpose Trust
FundsADDITIONS
Property taxes $ 314,737Interest income 2,040Other revenues 79,873
Total Additions 396,650
DEDUCTIONS
Distribution to participants 53,822Program expenses for former redevelopment agency 206,726Amortization 25,546
Total Deductions 286,094
Change in Fiduciary Net Position 110,556
Fiduciary Net Position - July 1, 2017 (3,526,495)
Fiduciary Net Position - June 30, 2018 $ (3,415,939)
See accompanying notes to the basic financial statements.26

CITY OF AUBURNNOTES TO BASIC FINANCIAL STATEMENTS
JUNE 30, 2018
NOTE 1: SUMMARY OF SIGNIFICANT ACCOUNTING POLICIES
The City of Auburn was incorporated in 1888. The City operates under the Council-Manager form of government andprovides the following services: public safety (police and fire), highways and streets, health and social services,culture-recreation, public improvements, planning and zoning, and general administration services.
The accounting policies of the City of Auburn conform to accounting principles generally accepted in the UnitedStates of America as applicable to governments. The following is a summary of the more significant policies:
A. The Reporting Entity
Generally accepted accounting principles require government financial statements to include the primary governmentand its component units. Component units of a governmental entity are legally separate entities for which the primarygovernment is considered to be financially accountable and for which the nature and significance of their relationshipwith the primary government are such that exclusion would cause the combined financial statements to bemisleading. The primary government is considered to be financially accountable if it appoints a majority of anorganization’s governing body and is able to impose its will on that organization or there is a potential for theorganization to provide specific financial benefits to or impose specific financial burdens on the primary government.
Reporting for component units on the City’s financial statements can be blended or discretely presented. Blendedcomponent units are, although legally separate entities, in substance part of the City’s operations and, therefore, datafrom these units are combined with data of the primary government. Discretely presented component units, on theother hand, would be reported in a separate column in the government-wide financial statements to emphasize it islegally separate from the government.
For financial reporting purposes, the City’s basic financial statements include all financial activities that are controlledby or are dependent upon actions taken by the City Council. The City's component unit is as follows:
Blended Component Units
City of Auburn Public Financing Authority - The Authority was formed September 8, 2008 by the execution of a JointPowers Authority Agreement between the City of Auburn and the former Auburn Urban Development Authority. TheAuthority is authorized to assist the City in future financing, including to borrow money for the purpose of financing theacquisition of bonds, notes, and other obligations of, or for the purpose of making loans to, the City, and/or refinanceoutstanding obligations of the City. As all debt issued by the Auburn Public Financing Authority has previously beenpaid off or refunded, there was no activity in the current year. Separate financial statements for the City of AuburnPublic Financing Authority are not issued.
Discretely Presented Component Units
There are no component units of the City which meet the criteria for discrete presentation.
Joint Agencies
The City participates in the following agencies that are not considered component units:
The City is a participant in Northern California Cities Self-Insurance Fund (NCCSIF), the purpose of which is formember cities to share in the administrative costs of providing liability and workers’ compensation insurance. TheNCCSIF is governed by a board of directors appointed by the member cities. Complete financial information can beobtained from the Program Administrator, 600 Montgomery Street, 9th Floor, San Francisco, CA 94111.
The City is a participant in California Joint Powers Risk Management Authority (CJPRMA), the purpose of which is toprovide excess coverage for its members. The CJPRMA is governed by a board of directors representing its membercities. Complete financial information can be obtained from the claims administrator at 3201 Doolan Road, Suite 285,Livermore, California 94551.
27
CITY OF AUBURNNOTES TO BASIC FINANCIAL STATEMENTS
JUNE 30, 2018
NOTE 1: SUMMARY OF SIGNIFICANT ACCOUNTING POLICIES (CONTINUED)
The City is a participant in California Transit Insurance Pool (CTIP), the purpose of which is to provide liabilitycoverage for its members. The CTIP is composed of nearly 40 member agencies and is governed by a board ofdirectors representing its member agencies. Complete financial information can be obtained from the ProgramAdministrator, CalTIP, 1750 Creekside Oaks Drive, Suite 200, Sacramento, CA 95833.
B. Basis of Presentation The City's basic financial statements are prepared in conformity with accounting principles generally accepted in theUnited States of America. The Governmental Accounting Standards Board is the acknowledged standard setting bodyfor establishing accounting and financial reporting standards followed by governmental entities in the United States ofAmerica. These statements require that the financial statements described below be presented.
Government-wide Financial Statements:
The Statement of Net Position and Statement of Activities display information about the reporting government as awhole. They include the activities of the overall City government except for fiduciary activities. Eliminations have beenmade to minimize the double counting of internal activities. Interfund services provided and used are eliminated in theprocess of consolidation. The City's net position is reported in three parts - net investment in capital assets; restrictednet position; and unrestricted net position. The City first utilizes restricted resources to finance qualifying activities.Governmental activities generally are financed through taxes, intergovernmental revenues, and other nonexchangerevenues. Business-type activities are financed in part by fees charged to external parties for goods or services.
The Statement of Activities presents a comparison between direct expenses and program revenues for each differentidentifiable activity of the City’s business-type activities and for each function of the City’s governmental activities.Direct expenses are those that are specifically associated with a program or function and, therefore, are clearlyidentifiable to a particular function. Program revenues include (a) charges paid by the recipients of goods andservices offered by the program, (b) grants and contributions that are restricted to meeting operational needs of aparticular program and (c) fees, grants and contributions that are restricted to financing the acquisition or constructionof capital assets. Revenues that are not classified as program revenues, including all taxes, are presented as generalrevenues.
Fund Financial Statements:
The fund financial statements provide information about the City's funds, including fiduciary funds and blendedcomponent units. Each fund is accounted for by providing a separate set of self-balancing accounts that constitute itsassets, deferred outflows of resources, liabilities, deferred inflows of resources, fund balances, revenues andexpenditures/expenses. Funds are organized into three major categories: governmental, proprietary, and fiduciary. Anemphasis is placed on major funds within the governmental and proprietary categories with each major fund displayedin a separate column. A fund is considered major if it is the primary operating fund of the City or meets the followingcriteria:
a. Total assets, deferred outflows of resources, liabilities, deferred inflows of resources, revenues orexpenditures/expenses of that individual governmental or enterprise fund are at least 10 percent of thecorresponding total for all funds of that category or type; and
b. Total assets, deferred outflows of resources, liabilities, deferred inflows of resources, revenues, orexpenditures/expenses of the individual governmental fund or enterprise fund are at least 5 percent of thecorresponding total for all governmental and enterprise funds combined.
28

CITY OF AUBURNNOTES TO BASIC FINANCIAL STATEMENTS
JUNE 30, 2018
NOTE 1: SUMMARY OF SIGNIFICANT ACCOUNTING POLICIES (CONTINUED)
All remaining governmental funds are aggregated and reported as nonmajor funds in a single column, regardless oftheir fund type.
The funds of the financial reporting entity are described below:
Governmental Funds
General Fund - The General Fund is the general operating fund of the City and is always classified as a major fund. Itis used to account for all activities except those legally or administratively required to be accounted for in other funds.
Special Revenue Funds - Special Revenue Funds are used to account for the proceeds of specific revenue sourcesthat are restricted or committed to expenditures for specified purposes other than debt service or capital projects.
Debt Service Funds - Debt Service Funds are used to account for and report financial resources that are restricted,committed, or assigned to expenditures for principal and interest.
Capital Project Funds - Capital Project Funds are used to account for financial resources that are restricted,committed, or assigned to expenditures for capital outlays, including the acquisition or construction of capital facilitiesand other capital assets.
Proprietary Funds
Enterprise Funds - Enterprise Funds are used to account for business-like activities provided to the general public.These activities are financed primarily by user charges and the measurement of financial activity focuses on netincome measurement similar to the private sector.
Fiduciary Funds (not included in government-wide statements)
Agency Funds - Agency Funds are clearing type funds for the collection of taxes or deposits held in trust, on behalf ofindividuals, private organizations and other governments. The funds are custodial in nature (assets equal liabilities)and do not involve measurement of results of operations.
Private-Purpose Trust Funds - Private-Purpose Trust Funds are used to report all other trust arrangements underwhich principal and income benefit individuals, private organizations, or other governments.
Major Funds
The City reports the following major governmental funds in the accompanying financial statements:
General Fund - This is the general operating fund of the City. It is used to account for all financial resources expectthose required to be accounted for in a separate fund.
Transportation Fund - The Transportation fund is used to account for monies received through the TransportationDevelopment Act (TDA) Tax and Surface Transportation Program (STP) funding.
HOME Housing Rehabilitation & First Time Homebuyer Fund - The HOME Housing Rehabilitation and First TimeHomebuyer (Community Development Block Grant) fund is used to account for monies received from the State andFederal governments and loaned by the City to individuals buying a home for the first time and/or engaging inapplicable home rehabilitation activities. Funds, when repaid, are provided to new individuals qualifying for loans.
29
CITY OF AUBURNNOTES TO BASIC FINANCIAL STATEMENTS
JUNE 30, 2018
NOTE 1: SUMMARY OF SIGNIFICANT ACCOUNTING POLICIES (CONTINUED)
The City reports the following major proprietary funds in the accompanying financial statements:
Airport Fund - The Airport fund is an enterprise fund established to account for the operation and maintenance of theCity’s general aviation airport serving recreation, commuter, limited air cargo, and public safety needs.
Sewer Fund - The Sewer fund is an enterprise fund established to account for the building, operating, and maintainingof the City’s sewer treatment plant and collection system.
C. Measurement Focus and Basis of Accounting
Measurement focus is a term used to describe "which" transactions are recorded within the various financialstatements. Basis of accounting refers to "when" revenues and expenditures or expenses are recognized in theaccounts and reported in the financial statements regardless of the measurement focus applied.
Measurement Focus
On the government-wide Statement of Net Position and the Statement of Activities, both governmental andproprietary activities are presented using the economic resources measurement focus as defined in item "b" below.
In the fund financial statements, the "current financial resources" measurement focus or the "economic resources"measurement focus is used as appropriate:
a. All governmental funds are accounted for using a "current financial resources" measurement focus. With thismeasurement focus, only current assets and deferred outflows of resources, and current liabilities anddeferred inflows of resources generally are included on their balance sheets. Their operating statementspresent sources and uses of available spendable financial resources during a given period. These funds usefund balance as their measure of available spendable financial resources at the end of the period.
b. All proprietary funds utilize an "economic resources" measurement focus. The accounting objectives of thismeasurement focus are the determination of operating income, changes in net position (or cost recovery),financial position, and cash flows. All assets and deferred outflows of resources, and all liabilities and deferredinflows of resources (whether current or noncurrent) associated with the operation of these funds are reported.Proprietary fund equity is classified as net position.
c. As agency funds report only assets and liabilities, they do not have a measurement focus. However, they usethe accrual basis of accounting to recognize receivables and payables. The "economic resources"measurement focus and the accrual basis of accounting is used for trust funds.
Basis of Accounting
In the government-wide Statement of Net Position and Statement of Activities, both governmental and proprietaryactivities are presented using the accrual basis of accounting. Under the accrual basis of accounting, revenues arerecognized when earned and expenses are recorded when the liability is incurred or economic asset is used.Revenues, expenses, gains, losses, assets and liabilities resulting from exchange and exchange-like transactions arerecognized when the exchange takes place.
In the fund financial statements, governmental funds are presented on the modified accrual basis of accounting.Under the modified accrual basis of accounting, revenues are recognized when "measurable and available."Measurable means knowing or being able to reasonably estimate the amount. Available means collectible within thecurrent period or soon enough thereafter to pay current liabilities. The City defines available to be within 60 days ofyear-end. Expenditures (including capital outlay) are recorded when the related fund liability is incurred, except forgeneral obligation bond principal and interest which are reported when due. Governmental capital asset acquisitionsare reported as expenditures in governmental funds. Proceeds for governmental long-term liabilities and acquisitionsunder capital leases are reported as other financing sources.
30

CITY OF AUBURNNOTES TO BASIC FINANCIAL STATEMENTS
JUNE 30, 2018
NOTE 1: SUMMARY OF SIGNIFICANT ACCOUNTING POLICIES (CONTINUED)
Those revenues susceptible to accrual include taxes, intergovernmental revenues, interest and charges for services.Certain indirect costs are included in program expenses reported for individual functions and activities.
Grant revenues are recognized in the fiscal year in which all eligibility requirements are met. Under the terms of grantagreements, the City may fund certain programs with a combination of cost-reimbursement grants, categorical blockgrants, and general revenues. Thus, both restricted and unrestricted net position are available to finance programexpenditures. The City's policy is to first apply restricted grant resources to such programs, followed by generalrevenues if necessary.
All proprietary funds utilize the accrual basis of accounting. Under the accrual basis of accounting, revenues arerecognized when earned and expenses are recorded when the liability is incurred or economic asset is used.Proprietary funds distinguish operating revenues and expenses from nonoperating items. Operating revenues andexpenses generally result from providing services and producing and delivering goods in connection with a proprietaryfund's principal operations. The principal operating revenues of the enterprise funds are charges for services.Operating expenses for proprietary funds include the cost of sales and services, administrative expenses, anddepreciation on capital assets. All revenues and expenses not meeting this definition are reported as nonoperatingrevenues and expenses. When both restricted and unrestricted resources are available for use, it is the City's policyto use restricted resources first, then unrestricted resources as they are needed.
D. Non-Current Governmental Assets/Liabilities
Non-current governmental assets and liabilities, such as capital assets and long-term liabilities, are reported in thegovernmental activities column in the government-wide statement of net position.
E. Cash and Investments
For purposes of the accompanying Statement of Cash Flows, the City considers all highly liquid investments with amaturity of three months or less when purchased including cash with fiscal agent, and their equity in the City’sinvestment pool, to be cash equivalents.
Investment transactions are recorded on the trade date. The fair value of investments is determined annually.Investments in nonparticipating interest-earning investment contracts are reported at cost; short term investments arereported at amortized cost; investments in Local Agency Investment Fund, an external pool, are reported at amortizedcost which approximates fair value; and the fair value of all other investments are obtained by using quotationsobtained from independent published sources or by the safekeeping institution. The fair value represents the amountthe City could reasonably expect to receive for an investment in a current sale between a willing buyer and seller.
Income from pooled investments is allocated to the individual funds based on the fund or participant’s average dailycash balance at quarter end in relation to the total pool investments. Income from non-pooled investments is recordedbased on the specific investments held by the fund.
F. Restricted Cash and Investments
Restricted assets in the governmental funds represent cash and investments held in the General fund for securitydeposits of $119,979. Restricted assets in the proprietary funds represent cash and investments held in the Airportfund for tenant deposits of $23,050.
G. Accounts and Interest Receivable
In the government-wide statements, receivables consist of all revenues earned at year-end and not yet received.Receivables are recorded in the financial statements net of any allowance for doubtful accounts. Managementbelieves its receivables are fully collectible and, accordingly, no allowance for doubtful accounts is required.
Major receivable balances for the governmental activities include accounts, interest, taxes, and intergovernmental.Business-type activities receivables consist mainly of user fees and intergovernmental revenues.
31

CITY OF AUBURNNOTES TO BASIC FINANCIAL STATEMENTS
JUNE 30, 2018
NOTE 1: SUMMARY OF SIGNIFICANT ACCOUNTING POLICIES (CONTINUED)
In the fund financial statements, material receivables in governmental funds include revenue accruals such as salestax, franchise tax, and grants and other similar intergovernmental revenues since they are usually both measurableand available. Nonexchange transactions collectible but not available are deferred in the fund financial statements inaccordance with modified accrual, but not deferred in the government-wide financial statements in accordance withthe accrual basis. Interest and investment earnings are recorded when earned only if paid within 60 days since theywould be considered both measurable and available. Proprietary fund material receivables consist of all revenuesearned at year-end and not yet received. Utility accounts receivable and interest earnings compose the majority ofproprietary fund receivables.
H. Other Assets
Inventory
Governmental fund inventories are recorded as expenditures at the time inventory is purchased rather than whenconsumed. Records are not maintained of inventory and supplies on hand, although these amounts are notconsidered material.
Prepaid Items
Payments made for services that will benefit periods beyond June 30, 2018, are recorded as prepaid costs under boththe accrual and modified accrual basis of accounting. The cost of prepaid items is recorded asexpenditures/expenses when consumed rather than when purchased.
I. Loans Receivable
For the purpose of the governmental fund financial statements, special revenue fund expenditures relating to long-term loans receivable arising from mortgage subsidy programs are charged to operations upon funding and the loansreceivable are recorded. The balance of the long-term receivable includes loans that may be forgiven if certain termsand conditions of the loans are met. The City reported $2,217,386 in loans receivable as of June 30, 2018.
J. Capital Assets
Capital assets, including public domain (infrastructure assets such as roads, bridges, water/sewer, lighting system,drainage systems, and flood control) are defined by the City as assets with a cost greater than $5,000 and a usefullife of more than one year. Capital assets are recorded at historical cost or estimated historical cost if actual historicalcost is unavailable. Contributed capital assets are recorded at their acquisition value at the date of donation.
Capital assets used in operations are depreciated or amortized using the straight-line method over the assetsestimated useful life in the government-wide financial statements. The range of estimated useful lives by type of assetis as follows:
Depreciable Asset Estimated LivesInfrastructure 40 yearsBuildings and improvements 40 yearsLand improvements 40 yearsEquipment 5-10 years
Maintenance and repairs are charged to operations when incurred. Betterments and major improvements whichsignificantly increase values, change capacities or extend useful lives are capitalized. Upon sale or retirement ofcapital assets, the cost and related accumulated depreciation are removed from the respective accounts and anyresulting gain or loss is included in the results of operations.
32
CITY OF AUBURNNOTES TO BASIC FINANCIAL STATEMENTS
JUNE 30, 2018
NOTE 1: SUMMARY OF SIGNIFICANT ACCOUNTING POLICIES (CONTINUED)
K. Property Taxes
Placer County assesses properties, bills, collects, and distributes property taxes to the City. The County remits theentire amount levied and handles all delinquencies, retaining interest and penalties.
Property taxes are levied on a fiscal year (July 1 - June 30). The secured property tax assessments are due onNovember 1 and February 1 and become delinquent after December 10 and April 10, respectively. The unsecuredproperty tax assessments are due on August 1 and become delinquent after August 31. Property taxes become a lienon the property effective January 1 of the preceding year.
The City recognizes property taxes when the individual installments are due provided they are collected within 60days after year-end.
L. Interfund Transactions
Interfund transactions are reflected as either loans, services provided or used, reimbursements or transfers.
Loans reported as receivables and payables are referred to as either “due to/from other funds” (i.e. the current portionof interfund loans) or “advances to/from other funds” (i.e., the noncurrent portion of interfund loans) as appropriateand are subject to elimination upon consolidation. Any residual balances outstanding between the governmentalactivities and the business-type activities are reported in the government-wide financial statements as “internalbalances.” Advances between funds, as reported in the fund financial statements, are offset by a nonspendable fundbalance account in applicable governmental funds to indicate that they are not in spendable form.
Services provided or used, deemed to be at market or near market rates, are treated as revenues and expendituresor expenses. These services provide information on the net cost of each government function and therefore are noteliminated in the process of preparing the government-wide statement of activities.
Reimbursements occur when the funds responsible for particular expenditures or expenses repay the funds thatinitially paid for them. Such reimbursements are reflected as expenditures or expenses in the reimbursing fund andreductions to expenditures or expenses in the reimbursed fund.
All other interfund transactions are treated as transfers. Transfers between funds are netted as part of thereconciliation to the government-wide presentation.
M. Unearned Revenue
Under the accrual and modified accrual basis of accounting, revenue may be recognized only when it is earned.When assets are recognized in connection with a transaction before the earnings process is complete, those assetsare offset by a corresponding liability for unearned revenue.N. Compensated Absences
Employees accrue vacation, sick, and compensatory time off benefits. An employee may accumulate vacation timeequal to the amount that can be earned in a two-year period. Vacation pay is paid upon separation of service orretirement. Sick leave benefits may be applied to earlier retirement. Upon termination, sick leave benefits in excess ofa specified maximum are paid.
All vacation and sick leave is accrued when incurred in the government-wide and proprietary fund financialstatements. In governmental funds, the cost of vacation and sick leave benefits is recognized when payments aremade to employees.
33
CITY OF AUBURNNOTES TO BASIC FINANCIAL STATEMENTS
JUNE 30, 2018
NOTE 1: SUMMARY OF SIGNIFICANT ACCOUNTING POLICIES (CONTINUED)
O. Pensions
For purposes of measuring the net pension liability and deferred outflows/inflows of resources related to pensions,and pension expense, information about the fiduciary net position of the City’s California Public Employees’Retirement System (CalPERS) plan (the Plan) and additions to/deductions from the Plan's fiduciary net position havebeen determined on the same basis as they are reported by CalPERS. For this purpose, benefit payments (includingrefunds of employee contributions) are recognized when due and payable in accordance with the benefit terms.Investments are reported at fair value.
P. Other Postemployment Benefits (OPEB)
For purposes of measuring the net OPEB liability, deferred outflows of resources and deferred inflows of resourcesrelated to OPEB, and OPEB expense, information about the fiduciary net position of the City's plan (OPEB Plan) andadditions to/deductions from the OPEB Plan's fiduciary net position have been determined on the same basis. Forthis purpose, benefit payments are recognized when currently due and payable in accordance with the benefit terms.Investments are reported at fair value.
Generally accepted accounting principles require that the reported results must pertain to liability and assetinformation within certain defined timeframes. For this report, the following timeframes are used:
Valuation Date June 30, 2017Measurement Date June 30, 2018Measurement Period July 1, 2017 - June 30, 3018
Q. Deferred Outflows/Inflows of Resources
In addition to assets, the statement of net position will sometimes report a separate section for deferred outflows ofresources. This separate financial statement element, deferred outflows of resources, represents a consumption ofnet position that applies to a future period and so will not be recognized as an outflow of resources(expense/expenditure) until then. The City has two items that qualify for reporting in this category. One item, deferredamount on bond refunding, is reported in the business-type funds. This item is deferred and recognized over the lifeof the new bond. See note 6 for further information on the advance refunding. The other item relates to the outflowsfrom changes in the net pension liability and is reported on the statement of net position.
In addition to liabilities, the statement of net position will sometimes report a separate section for deferred inflows ofresources. This separate financial statement element, deferred inflows of resources, represents an acquisition of netposition that applies to a future period and so will not be recognized as an inflow of resources (revenue) until thattime. The government has two types of items which qualify for reporting in this category. One item, unavailablerevenue, is reported only in the governmental funds balance sheet. The governmental funds report unavailablerevenues for receivables that have not been received within the modified accrual period. These amounts are deferredand recognized as an inflow of resources in the period that the amounts become available. The other item relates tothe inflows from changes in the net pension liability and is reported on the statement of net position.
34
CITY OF AUBURNNOTES TO BASIC FINANCIAL STATEMENTS
JUNE 30, 2018
NOTE 1: SUMMARY OF SIGNIFICANT ACCOUNTING POLICIES (CONTINUED)
R. Equity Classifications
Government-wide Statements
Net position is the excess of all the City's assets and deferred outflows of resources over all its liabilities and deferredinflows of resources, regardless of fund. Net position is divided into three categories. These categories apply only tonet position, which is determined at the Government-wide level, and are described below:
a. Net investment in capital assets - Consists of capital assets including restricted capital assets, net ofaccumulated depreciation and reduced by the outstanding balances of any bonds, mortgages, notes or otherborrowings that are attributable to the acquisition, construction, or improvement of those assets.
b. Restricted net position - Consists of net position with constraints placed on the use either by (1) external groupssuch as creditors, grantors, contributors, or laws or regulations of other governments; or (2) law throughconstitutional provisions or enabling legislation.
c. Unrestricted net position - All other net position that does not meet the definition of "restricted" or "netinvestment in capital assets, net of related debt."
Fund Statements
The governmental fund financial statements present fund balances based on classifications that comprise a hierarchythat is based primarily on the extent to which the City is bound to honor constraints on the specific purposes for whichamounts in the respective governmental funds can be spent. The classifications used in the governmental fundfinancial statements are as follows:
a. Nonspendable - Amounts that cannot be spent because they are either (1) not in spendable form or (2) legallyor contractually required to be maintained intact.
b. Restricted - Amounts that are restricted for specific purposes when constraints placed on the use of resourcesare either (1) externally imposed by creditors, grantors, contributors, laws, or regulations of othergovernments; or (2) imposed by law through constitutional provisions or enabling legislation.
c. Committed - Amounts that can only be used for specific purposes pursuant to constraints imposed by formalaction (resolution) of the government's highest level of decision-making authority.
d. Assigned - Amounts that are constrained by the City Council's intent to be used for specific purposes through aresolution, but are neither restricted or committed. The City Council assigns fund balances for specificpurposes by resolution adopting the annual budget for the upcoming fiscal year, or by an amending budgetresolution during the fiscal year.
e. Unassigned - Amounts representing the residual classification for the general fund or any other fund with anegative fund balance.
Further detail about the City's fund balance classification is described in Note 12.
35
CITY OF AUBURNNOTES TO BASIC FINANCIAL STATEMENTS
JUNE 30, 2018
NOTE 1: SUMMARY OF SIGNIFICANT ACCOUNTING POLICIES (CONTINUED)
S. General Budget Policies
The City operates under the general laws of the State of California and annually adopts a budget for its governmentaland proprietary funds to be effective July 1 for the ensuing fiscal year. From the effective date of the budget, which isadopted and controlled at the department level, the amounts stated therein as proposed expenditures becomeappropriations to the various City departments. The City Council may amend the budget by resolution during the fiscalyear. The City Manager may authorize transfers from one account to another within the same department. Debtservice on bond issues constitutes a legally authorized “non-appropriated budget.” Annual budgets are adopted on abasis consistent with accounting principles generally accepted in the United States of America. Encumbrances areconsidered to be expenditures in the year the commitment is entered into. Budget appropriations lapse at the end ofthe fiscal year unless encumbered by specific Council approval.
T. Use of Estimates
The preparation of financial statements in accordance with generally accepted accounting principles requiresmanagement to make estimates and assumptions that affect certain reported amounts and disclosures. Accordingly,actual results could differ from these estimates.
U. Reclassifications
Certain accounts in prior-year financial statements have been reclassified for comparative purposes to conform withthe presentation in the current-year financial statements.
V. Implementation of Government Accounting Standards Board Statements
Effective July 1, 2017, the City implemented the following accounting and financial reporting standards:
Governmental Accounting Standards Board Statement No. 85
In March 2017, GASB issued Statement No. 85, Omnibus 2017. This Statement seeks to improve consistency inaccounting and financial reporting by addressing practice issues that have been identified during implementation andapplication of certain GASB Statements, including issues related to blending component units, goodwill, fair valuemeasurement and application, and post-employment benefits (i.e., pensions and other post-employment benefits(OPEB)).
Governmental Accounting Standards Board Statement No. 86
In May 2017, GASB issued Statement No. 86, Certain Debt Extinguishment Issues. This Statement establishesstandards of accounting and financial reporting for in-substance defeasance transactions in which cash and othermonetary assets acquired with only existing resources (i.e., resources other than the proceeds of refunding debt) areplaced in an irrevocable trust for the purpose of extinguishing debt. Additionally, this Statement amends accountingand financial reporting requirements for prepaid insurance associated with debt that is extinguished, whether througha legal extinguishment or through an in-substance defeasance, regardless of how the cash and other monetaryassets were acquired. Finally, this Statement establishes an additional disclosure requirement related to debt that isdefeased in substance, regardless of how the cash and other monetary assets were acquired.
36

CITY OF AUBURNNOTES TO BASIC FINANCIAL STATEMENTS
JUNE 30, 2018
NOTE 1: SUMMARY OF SIGNIFICANT ACCOUNTING POLICIES (CONTINUED)
W. Future Governmental Accounting Standards Board Statements
These statements are not effective until July 1, 2018 or later. The City has not determined the effects on the financialstatements.
Governmental Accounting Standards Board Statement No. 83
In November 2016, GASB issued Statement No. 83, Certain Asset Retirement Obligations. This Statement addressesaccounting and financial reporting for certain asset retirement obligations (AROs). An ARO is a legally enforceableliability associated with the retirement of a tangible capital asset. A government that has legal obligations to performfuture asset retirement activities related to its tangible capital assets should recognize a liability based on theguidance in this Statement. The City has not determined what impact, if any, this pronouncement will have on thefinancial statements. Application of this statement is effective for the City's fiscal year ending June 30, 2019.
Governmental Accounting Standards Board Statement No. 84
In January 2017, GASB issued Statement No. 84, Fiduciary Activities. This Statement establishes criteria foridentifying fiduciary activities of all state and local governments. Additionally, this Statement describes four fiduciaryfunds that should be reported, as well as provides for recognition of a liability to the beneficiaries in a fiduciary fundwhen an event has occurred that compels the government to disburse fiduciary resources. The City has notdetermined what impact, if any, this pronouncement will have on the financial statements. Application of thisStatement is effective for the City's fiscal year ending June 30, 2020.
Governmental Accounting Standards Board Statement No. 87
In June 2017, GASB issued Statement No. 87, Leases. This Statement (1) increases the usefulness of governments’financial statements by requiring recognition of certain lease assets and liabilities for leases that previously wereclassified as operating leases and recognized as inflows of resources or outflows of resources based on the paymentprovisions of the contract; and (2) establishes a single model for lease accounting based on the foundational principlethat leases are financings of the right to use an underlying asset. Additionally, under this Statement, a lessee isrequired to recognize a lease liability and an intangible right-to-use lease asset, and a lessor is required to recognizea lease receivable and a deferred inflow of resources, thereby enhancing the relevance and consistency ofinformation about governments’ leasing activities. The City has not determined what impact, if any, thispronouncement will have on the financial statements. Application of this statement is effective for the City's fiscal yearending June 30, 2021.
Governmental Accounting Standards Board Statement No. 88
In March 2018, GASB issued Statement No. 88, Certain Disclosures Related to Debt, Including Direct Borrowings andDirect Placements. The objective of this statement is to clarify which liabilities governments should include in theirnote disclosures related to debt. GASB is requiring debt borrowings and direct placements to be presented separatelybecause they may expose a government to risks that are different from, or in addition to, risks related to other types ofdebt. The new standard also requires the disclosure of additional essential debt-related information for all types ofdebt, including amounts of unused lines of credit and assets pledged as collateral for debt. Also required to bedisclosed are terms specified in debt agreements related to: (1) significant events of default with finance-relatedconsequences, (2) significant termination events with finance-related consequences, (3) significant subjectiveacceleration clauses. The City has not determined what impact, if any, this pronouncement will have on the financialstatements. Application of this statement is effective for the City's fiscal year ending June 30, 2020.
37
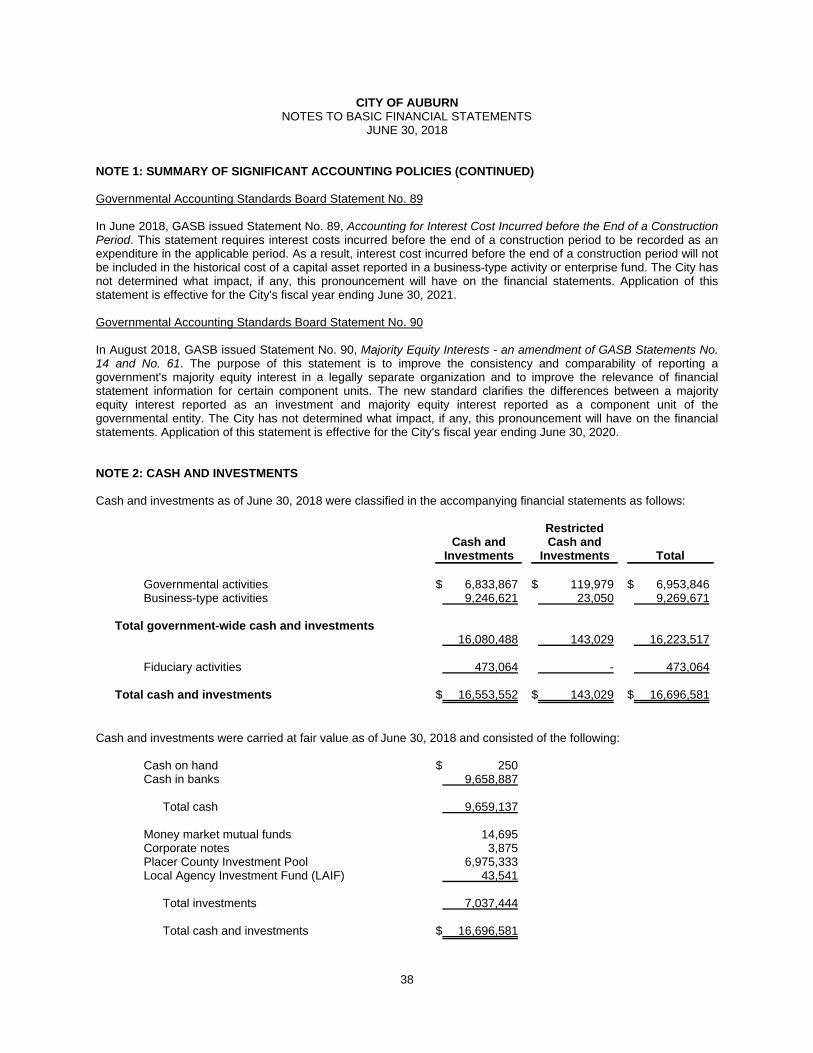
CITY OF AUBURNNOTES TO BASIC FINANCIAL STATEMENTS
JUNE 30, 2018
NOTE 1: SUMMARY OF SIGNIFICANT ACCOUNTING POLICIES (CONTINUED)
Governmental Accounting Standards Board Statement No. 89
In June 2018, GASB issued Statement No. 89, Accounting for Interest Cost Incurred before the End of a ConstructionPeriod. This statement requires interest costs incurred before the end of a construction period to be recorded as anexpenditure in the applicable period. As a result, interest cost incurred before the end of a construction period will notbe included in the historical cost of a capital asset reported in a business-type activity or enterprise fund. The City hasnot determined what impact, if any, this pronouncement will have on the financial statements. Application of thisstatement is effective for the City's fiscal year ending June 30, 2021.
Governmental Accounting Standards Board Statement No. 90
In August 2018, GASB issued Statement No. 90, Majority Equity Interests - an amendment of GASB Statements No.14 and No. 61. The purpose of this statement is to improve the consistency and comparability of reporting agovernment's majority equity interest in a legally separate organization and to improve the relevance of financialstatement information for certain component units. The new standard clarifies the differences between a majorityequity interest reported as an investment and majority equity interest reported as a component unit of thegovernmental entity. The City has not determined what impact, if any, this pronouncement will have on the financialstatements. Application of this statement is effective for the City's fiscal year ending June 30, 2020.
NOTE 2: CASH AND INVESTMENTS
Cash and investments as of June 30, 2018 were classified in the accompanying financial statements as follows:
Cash andInvestments
RestrictedCash and
Investments Total
Governmental activities $ 6,833,867 $ 119,979 $ 6,953,846Business-type activities 9,246,621 23,050 9,269,671
Total government-wide cash and investments16,080,488 143,029 16,223,517
Fiduciary activities 473,064 - 473,064
Total cash and investments $ 16,553,552 $ 143,029 $ 16,696,581
Cash and investments were carried at fair value as of June 30, 2018 and consisted of the following:
Cash on hand $ 250Cash in banks 9,658,887
Total cash 9,659,137
Money market mutual funds 14,695Corporate notes 3,875Placer County Investment Pool 6,975,333Local Agency Investment Fund (LAIF) 43,541
Total investments 7,037,444
Total cash and investments $ 16,696,581
38
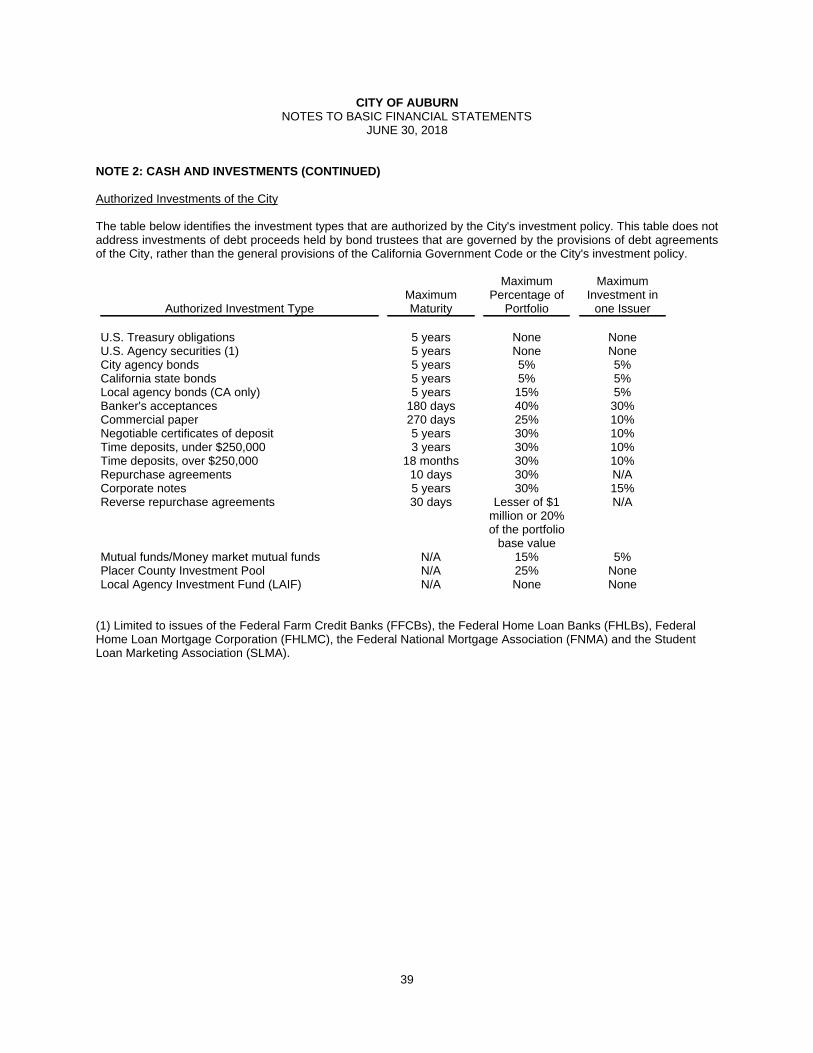
CITY OF AUBURNNOTES TO BASIC FINANCIAL STATEMENTS
JUNE 30, 2018
NOTE 2: CASH AND INVESTMENTS (CONTINUED)
Authorized Investments of the City
The table below identifies the investment types that are authorized by the City's investment policy. This table does notaddress investments of debt proceeds held by bond trustees that are governed by the provisions of debt agreementsof the City, rather than the general provisions of the California Government Code or the City's investment policy.
Authorized Investment TypeMaximumMaturity
MaximumPercentage of
Portfolio
MaximumInvestment in
one Issuer
U.S. Treasury obligations 5 years None NoneU.S. Agency securities (1) 5 years None NoneCity agency bonds 5 years 5% 5%California state bonds 5 years 5% 5%Local agency bonds (CA only) 5 years 15% 5%Banker's acceptances 180 days 40% 30%Commercial paper 270 days 25% 10%Negotiable certificates of deposit 5 years 30% 10%Time deposits, under $250,000 3 years 30% 10%Time deposits, over $250,000 18 months 30% 10%Repurchase agreements 10 days 30% N/ACorporate notes 5 years 30% 15%Reverse repurchase agreements 30 days Lesser of $1
million or 20%of the portfolio
base value
N/A
Mutual funds/Money market mutual funds N/A 15% 5%Placer County Investment Pool N/A 25% NoneLocal Agency Investment Fund (LAIF) N/A None None
(1) Limited to issues of the Federal Farm Credit Banks (FFCBs), the Federal Home Loan Banks (FHLBs), FederalHome Loan Mortgage Corporation (FHLMC), the Federal National Mortgage Association (FNMA) and the StudentLoan Marketing Association (SLMA).
39

CITY OF AUBURNNOTES TO BASIC FINANCIAL STATEMENTS
JUNE 30, 2018
NOTE 2: CASH AND INVESTMENTS (CONTINUED)
Investment Valuation
Investments are measured at fair value on a recurring basis. Recurring fair value measurements are those thatGovernmental Accounting Standards Board (GASB) Statements require or permit in the statement of net position atthe end of each reporting period. Fair value measurements are categorized based on the valuation inputs used tomeasure an asset’s fair value: Level 1 inputs are quoted prices in active markets for identical assets; Level 2 inputsare significant other observable inputs; Level 3 inputs are significant unobservable inputs. Investments’ fair valuemeasurements are as follows at June 30, 2018:
Fair Value Measurements UsingInvestments Level 1 Inputs Level 2 inputs Level 3 inputs Fair Value
Money market mutual funds $ 14,695 $ - $ - $ 14,695Corporate notes 3,875 - - 3,875
Total investments reported under fairvalue hierarchy
18,570 - - 18,570
Placer County Investment Pool - - - 6,975,333Local Agency Investment Fund (LAIF) - - - 43,541
Total investments $ 18,570 $ - $ - $ 7,037,444
Investment in State and County Investment Pools
The City is a voluntary participant in the Placer County Pooled Investment Fund that is governed by the County ofPlacer which monitors and reviews the management of public funds maintained in the investment pool in accordancewith the County investment policy and the California Government Code. The Board of Supervisors review andapprove the investment policy annually. The County Treasurer prepares and submits a comprehensive investmentreport to the Board of Supervisors every month. The report covers the type of investments in the pool, maturity dates,par value, actual cost and fair value. Investments in the Placer County Pooled Investment Fund are regarded ashighly liquid as deposits and withdrawals can be made at any time without penalty. The Pool does not impose amaximum investment limit. Required disclosure information regarding categorization of investments and other depositand investment risk disclosures can be found in the County’s financial statements. The County of Placer’s financialstatements may be obtained by contacting the County of Placer Auditor-Controller’s office at 2970 Richardson Drive,Auburn, CA 95603. The fair value of the City's investment in this pool is reported in the accompanying financialstatements at amounts based upon the City's prorata share of the fair value provided by the pool for the entireportfolio (in relation to the amortized cost of that portfolio). The balance available for withdrawal is based on theaccounting records maintained by the County, which is recorded on an amortized cost basis. The investment of$6,975,333 is not subject to valuation on a recurring basis.
The City is a voluntary participant in the Local Agency Investment Fund (LAIF) that is regulated by the CaliforniaGovernment Code under the oversight of the Treasurer of the State of California. The fair value of the City'sinvestment in this pool is reported in the accompanying financial statements at amounts based upon the City's proratashare of the fair value provided by LAIF for the entire portfolio (in relation to the amortized cost of that portfolio). Thebalance available for withdrawal is based on the accounting records maintained by LAIF, which is recorded on anamortized cost basis. The investment of $43,541 is not subject to valuation on a recurring basis.
Disclosure Relating to Interest Rate Risk
Interest rate risk is the risk that changes in market interest rates will adversely affect the fair value of an investment.Generally, the longer the maturity of an investment, the greater the sensitivity of its fair value to changes in marketinterest rates. To limit exposure to fair value losses resulting from increases in interest rates, the City's investmentpolicy limits investment maturities to a term appropriate to the need for funds so as to permit the City to meet allprojected obligations. Any investments that mature more than five years from the date of purchase cannot occurwithout prior approval of the City Council.
40

CITY OF AUBURNNOTES TO BASIC FINANCIAL STATEMENTS
JUNE 30, 2018
NOTE 2: CASH AND INVESTMENTS (CONTINUED)
Information about the sensitivity of the fair values of the City's investments to market rate fluctuations is provided bythe following table that shows the distribution of the City's investments by maturity as of June 30, 2018:
Interest Remaining Maturity WeightedAverage
Rate < 12 months 1-5 years > 5 years Fair Value Maturity (years)
Money market mutual funds Variable $ 14,695 $ - $ - $ 14,695 N/ACorporate notes %6.63 3,875 - - 3,875 (6.45) (1)Placer County Investment Pool Variable 6,975,333 - - 6,975,333 N/ALocal Agency Investment Fund (LAIF) Variable 43,541 - - 43,541 N/A
$ 7,037,444 $ - $ - $ 7,037,444
(1) Investment in Lehman Brothers corporate notes. Corporation filed for bankruptcy in 2008 and rating waswithdrawn. Notes matured January 18, 2012 and are held in escrow.
Investments with Fair Values Highly Sensitive to Interest Rate Fluctuations
The City had no investments that were highly sensitive to interest rate fluctuations as of June 30, 2018.
Disclosures Relating to Credit Risk
Generally, credit risk is the risk that an issuer of an investment will not fulfill its obligation to the holder of theinvestment. This is measured by the assignment of a rating by a nationally recognized statistical rating organization.Presented below is the minimum rating required by (where applicable) the California Government Code, theinvestment policy, or debt agreements, and the actual rating as of the fiscal year for each investment type.
Rating as of Fiscal Year End
TotalMinimum
Legal Rating S&P Moody's N/A
Money market mutual funds $ 14,695 Not rated Not ratedCorporate notes 3,875 A WR (1) WR (1)Placer County Investment Pool 6,975,333 Not rated Not ratedLocal Agency Investment Fund (LAIF) 43,541 Not rated Not rated
$ 7,037,444
(1) Investment in Lehman Brothers corporate notes. Corporation filed for bankruptcy in 2008 and rating waswithdrawn. Notes matured January 18, 2012 and are held in escrow.
Concentration of Credit Risk
The investment policy of the City limits the amount that can be invested in any one issuer to the lessor of the amountstipulated by the California Government Code or the limits noted above, with the exception of U.S. Treasuryobligations, U.S. Agency securities, and LAIF. As of June 30, 2018, the City held $6,975,333, or 99% of its investmentportfolio, in the Placer County Investment Pool. This exceeds the City's 25% policy limitation.
41
CITY OF AUBURNNOTES TO BASIC FINANCIAL STATEMENTS
JUNE 30, 2018
NOTE 2: CASH AND INVESTMENTS (CONTINUED)
Custodial Credit Risk
Custodial credit risk for deposits is the risk that, in the event of the failure of a depository financial institution, agovernment will not be able to recover its deposits or will not be able to recover collateral securities that are in thepossession of an outside party. The custodial credit risk for investments is the risk that, in the event of the failure ofthe counterparty (e.g. broker-dealer) to a transaction, a government will not be able to recover the value of itsinvestment or collateral securities that are in the possession of another party. The California Government Code andthe City investment policy do not contain legal or policy requirements that would limit the exposure to custodial creditrisk for deposits or investments, other than the following provision for deposits: The California Government Coderequires that a financial institution secure deposits made by state or local governmental units by pledging securities inan undivided collateral pool held by a depository regulated under state law (unless so waived by the government unit).The market value of the pledged securities in the collateral pool must equal at least 110% of the total amountdeposited by the public agencies. California law also allows financial institutions to secure City's deposits by pledgingfirst trust deed mortgage notes having a value of 150% of the secured public deposits.
Allocation of Interest Income Among Funds
Interest income from pooled investments is allocated to those funds which are required by law or administrative actionto receive interest. Interest is allocated monthly based on the ending cash balances of the previous month in eachfund receiving interest.
42

CITY OF AUBURNNOTES TO BASIC FINANCIAL STATEMENTS
JUNE 30, 2018
NOTE 3: CAPITAL ASSETS
Capital assets activity for the year ended June 30, 2018, was as follows:
Balance at July 1, 2017 Additions Retirements
Balance at June 30, 2018
Governmental activities:Capital assets not being depreciated
Construction-in-progress $ 538,795 $ 583,677 $ - $ 1,122,472
Total capital assets not being depreciated 538,795 583,677 - 1,122,472
Capital assets being depreciatedInfrastructure 7,429,849 - - 7,429,849Buildings and improvements 5,947,952 - - 5,947,952Equipment 6,982,728 373,453 - 7,356,181Land improvements 15,032,468 - - 15,032,468
Total capital assets being depreciated 35,392,997 373,453 - 35,766,450
Less accumulated depreciationInfrastructure (2,995,988) (332,441) - (3,328,429)Buildings and improvements (2,822,969) (135,316) - (2,958,285)Equipment (4,985,884) (455,446) - (5,441,330)Land improvements (4,515,141) (808,038) - (5,323,179)
Total accumulated depreciation (15,319,982) (1,731,241) - (17,051,223)
Total capital assets being depreciated, net 20,073,015 (1,357,788) - 18,715,227
Governmental activities capital assets, net $ 20,611,810 $ (774,111) $ - $ 19,837,699
Business-type activities:Capital assets not being depreciated
Land $ 2,874,395 $ - $ - $ 2,874,395Construction-in-progress 10,345,688 5,340,373 - 15,686,061
Total capital assets not being depreciated 13,220,083 5,340,373 - 18,560,456
Capital assets being depreciatedInfrastructure 34,648,111 - - 34,648,111Equipment 2,462,867 58,709 - 2,521,576
Total capital assets being depreciated 37,110,978 58,709 - 37,169,687
Less accumulated depreciationInfrastructure (13,397,907) (1,473,277) - (14,871,184)Equipment (1,745,146) (137,539) - (1,882,685)
Total accumulated depreciation (15,143,053) (1,610,816) - (16,753,869)
Total capital assets being depreciated, net 21,967,925 (1,552,107) - 20,415,818
Business-type capital assets, net $ 35,188,008 $ 3,788,266 $ - $ 38,976,274
43

CITY OF AUBURNNOTES TO BASIC FINANCIAL STATEMENTS
JUNE 30, 2018
NOTE 3: CAPITAL ASSETS (CONTINUED)
Depreciation was charged to functions based on their usage of the related assets as follows:
Governmental Activities:General administration $ 168,311Public safety 287,252Transportation 659,071Community development 616,607
Total governmental activities depreciation expense $ 1,731,241
Business-type Activities:Airport $ 430,324Sewer 1,180,492
Total business-type activities depreciation expense $ 1,610,816
NOTE 4: INTERFUND TRANSACTIONS
Due To/From Other Funds
During the course of operations, transactions occur between funds to account for goods received or servicesrendered. These receivables and payables are classified as due from or due to other funds. In addition, when fundsoverdraw their share of pooled cash, the receivables and payables are also classified as due from or due to otherfunds. The following are due to and due from balances as of June 30, 2018:
Due From Due To Description Amount
Major Governmental FundsGeneral Fund Transportation Cover negative cash $ 61,474General Fund Transit Cover negative cash 78,702General Fund AUSD Park Reserve Cover negative cash 202,193
Total Due From/Due To $ 342,369
44

CITY OF AUBURNNOTES TO BASIC FINANCIAL STATEMENTS
JUNE 30, 2018
NOTE 4: INTERFUND TRANSACTIONS (CONTINUED)
Transfers
Transfers are indicative of funding for capital projects, lease payments or debt service, subsidies of various Cityoperations, and re-allocations of special revenues. The following are the interfund transfers for fiscal year ended June30, 2018:
Transfer From Transfer To Description of Transfer Amount
Non-Major Governmental FundsTransit General Fund CalPERS pension bond debt service $ 23,000State Law Enforcement Grant General Fund SLESF transfer 139,416Project Fund Transportation Budgeted transfer from DIF fund 38,450
Total Governmental Interfund Transfers $ 200,866
Proprietary FundsSewer General Fund CalPERS pension bond debt service $ 30,000Sewer Transportation Nevada Street Sidewalk funding
agreement300,000
Total Proprietary Interfund Transfers $ 330,000NOTE 5: LONG-TERM LIABILITIES
The following is a summary of long-term liabilities transactions related to governmental activities of the City for theyear ended June 30, 2018:
Governmental Activities:Balance
July 1, 2017 Additions ReductionsBalance
June 30, 2018Current Portion
Pension obligation bonds $ 3,445,000 $ - $ (285,000) $ 3,160,000 $ 320,000Capital lease obligations 365,073 - (171,068) 194,005 66,305Other liabilities:
Compensated absences 1,409,151 588,664 (675,046) 1,322,769 453,286
Total Governmental Activities $ 5,219,224 $ 588,664 $ (1,131,114) $ 4,676,774 $ 839,591
A description of the long-term liabilities related to governmental activities at June 30, 2018 follows:
A. Pension Obligation Bonds
Taxable Pension Obligation Bonds 2006 Series A-1, issued June 15, 2006, in the amount of $4,965,000 and payablein annual installments of $65,000 to $340,000, with an interest rate of 5.69% to 5.93% and maturity on June 1, 2028.The bonds were used to pay the unfunded accrued actuarial liability to the California Public Employees’ RetirementSystem.
B. Capital Lease Obligations
Capital lease obligations are generally liquidated by lease payments made by the departments leasing the equipment.
C. Compensated Absences
Compensated absences are generally liquidated by the fund where the accrued liability occurred which is primarily theGeneral fund.
45

CITY OF AUBURNNOTES TO BASIC FINANCIAL STATEMENTS
JUNE 30, 2018
NOTE 5: LONG-TERM LIABILITIES (CONTINUED)
Following is a schedule of debt payment requirements of governmental activities to maturity for long-term debt,excluding compensated absences that have indefinite maturities and capital leases which are reported in Note 7.
Governmental Activities
Pension Obligation BondsFor the Year
Ending June 30, Principal Interest
2019 $ 320,000 $ 187,0642020 360,000 168,1842021 400,000 146,9442022 440,000 123,3442023 210,000 97,252
2024 - 2028 1,430,000 271,594
Total $ 3,160,000 $ 994,382
The following is a summary of long-term liabilities transactions related to business-type activities of the City for theyear ended June 30, 2018.
Business-type ActivitiesBalance
July 1, 2017 Additions ReductionsBalance
June 30, 2018CurrentPortion
Loans $ 975,996 $ 9,221,258 $ (346,677) $ 9,850,577 $ 282,234Less: Discount (151,939) - 47,040 (104,899) (47,040)
Loans, Net 824,057 9,221,258 (299,637) 9,745,678 235,194
2016 Sewer revenue bonds 6,725,000 - (220,000) 6,505,000 225,000Add: Premium 295,859 - (13,448) 282,411 13,448
2016 Sewer revenue bonds, net 7,020,859 - (233,448) 6,787,411 238,448
Other liabilities:Compensated absences 104,153 15,929 (18,245) 101,837 9,812
Total Business-type Activities $ 7,949,069 $ 9,237,187 $ (551,330) $ 16,634,926 $ 483,454
A description of the long-term liabilities related to business-type activities at June 30, 2018 is as follows:
D. Loans
State Department of Water Resources loan, issued February 23, 1998 in the amount of $2,173,820 and payable inannual installments of $108,691, with an interest rate of 0.0% and maturity on January 13, 2019. Loan proceeds wereused to finance construction of the wastewater treatment plant improvement project phase 1A.
State Department of Water Resources loan, issued April 21, 1999 in the amount of $2,892,368 and payable in annualinstallments of $173,543, with an interest rate of 0.0% and maturity on March 1, 2021. Loan proceeds were used tofinance construction of the wastewater treatment plant improvement project phase 1B.
State Water Resources Control Board loan, issued May 19, 2016 in the amount of $10,300,150 and payable in annualinstallments of $440,728, with an interest rate of 1.7% and maturity on September 13, 2048. Loan proceeds wereused to finance construction of the 2016 WWTP secondary treatment improvements project. The City is drawingdown the funds as the project progresses. At June 30, 2018, $9,221,258 of the loan has been drawn down.
46

CITY OF AUBURNNOTES TO BASIC FINANCIAL STATEMENTS
JUNE 30, 2018
NOTE 5: LONG-TERM LIABILITIES (CONTINUED)
E. 2016 Sewer Revenue Bonds
Wastewater Revenue Refunding Bonds Series 2016, issued September 1, 2016 in the amount of $7,005,000 andpayable in annual installments of $280,000 to $410,000, with an interest rate of 2.00% to 4.00% and maturity on June1, 2039. The bonds were used to refund the Wastewater Revenue Bonds Series 2009.
Following is a schedule of debt payment requirements of business-type activities to maturity for long-term debt,excluding the State Water Resources Control Board loan since the funds have not been fully drawn down andcompensated absences that have indefinite maturities.
Business- Type Activities
LoansFor the Year
Ending June 30, Principal Interest
2019 $ 282,234 $ -2020 173,543 -2021 173,541 -
Total $ 629,318 $ -
Sewer Revenue BondsFor the Year
Ending June 30, Principal Interest
2019 $ 225,000 $ 194,2412020 235,000 187,4912021 240,000 180,4412022 250,000 173,2412023 255,000 165,741
2024 - 2028 1,395,000 698,6562029 - 2033 1,625,000 471,6212034 - 2038 1,870,000 231,530
2039 410,000 12,300
Total $ 6,505,000 $ 2,315,262
NOTE 6: PRIOR ADVANCE REFUNDING
The City advance refunded $7,214,544 of outstanding Wastewater Revenue Bonds Series 2009 by depositing the netproceeds from the issuance of the 2016 Wastewater Revenue Refunding Bonds in an irrevocable trust with an escrowagent to provide funds for the future debt service payment on the refunded bonds. As a result, the WastewaterRevenue Bonds Series 2009 are considered defeased and the trust account assets and the liability for the defeasedbonds are not included in the City's financial statements.
The reacquisition price exceeded the net carrying amount of the old debt by $1,038,907. This amount is reported as adeferred outflow of resources and is being amortized over the life of the new debt. Amortization expense for the yearended June 30, 2018 totaled $45,170. At June 30, 2018, $948,567 was reported as deferred amount on bondrefunding.
47

CITY OF AUBURNNOTES TO BASIC FINANCIAL STATEMENTS
JUNE 30, 2018
NOTE 7: CAPITAL LEASES
The City has entered into certain capital lease agreements under which the related equipment will become theproperty of the City when all terms of the lease agreements are met.
Stated InterestRate
Present Valueof
RemainingPayments
Governmental activities 1.74 - 9.83% $ 194,005
Equipment and related accumulated depreciation acquired under capital leases is as follows:
Governmental Activities
Cost of equipment $ 875,906Less: accumulated depreciation (444,159)
Net value $ 431,747
As of June 30, 2018, capital lease annual amortization was as follows:
Year EndedJune 30,
Governmental Activities
2019 75,1232020 70,2722021 53,2872022 11,906
Total requirements 210,588Less interest (16,583)
Present value of remaining payments $ 194,005
48

CITY OF AUBURNNOTES TO BASIC FINANCIAL STATEMENTS
JUNE 30, 2018
NOTE 8: RENTAL INCOME FROM LEASES
The City leases property under noncancelleable tenant operating leases. The following is a schedule of futureminimum lease payments:
Year EndedJune 30,
GovernmentalActivities
Business-TypeActivities
2018 $ 199,024 $ 669,7252019 199,024 641,3212020 199,024 641,3212021 199,024 641,3212022 199,023 641,321
2023-2027 995,115 3,203,5142028-2032 923,555 3,088,0402033-2037 923,555 2,212,3992038-2042 814,790 1,777,0782043-2047 256,722 1,411,4982048-2052 51,481 920,1532053-2057 44,355 70,6072058-2062 44,355 27,021
Total rental income from leases $ 5,049,047 $ 15,945,319
NOTE 9: PENSION PLAN
A. General Information about the Pension Plan
Plan Description
All qualified permanent and probationary employees are eligible to participate in the Public Agency Cost-SharingMultiple-Employer Defined Benefit Pension Plan (the Plan), administered by the California Public Employees’Retirement System (CalPERS). The Plan’s benefit provisions are established by statute. The Plan is included as apension trust fund in the CalPERS Comprehensive Annual Financial Report, which is available online atwww.calpers.ca.gov.
The Plan consists of a miscellaneous pool and a safety pool (referred to as “risk pools”), which are comprised ofindividual employer miscellaneous and safety rate plans, respectively, including those of the City of Auburn. The Cityof Auburn's employer rate plans in the miscellaneous risk pool include the Miscellaneous plan (Miscellaneous) andthe PEPRA Miscellaneous plan (PEPRA Misc.). The City of Auburn's employer rate plans in the safety risk poolinclude the Safety Police First Tier plan (1st Tier Police), the Safety Police Second Tier plan (2nd Tier Police), theSafety Fire First Tier plan (1st Tier Fire), the Safety Fire Second Tier plan (2nd Tier Fire), the PEPRA Safety Fire plan(PEPRA Fire) and the PEPRA Safety Police plan (PEPRA Police).
Benefits Provided
The Plan provides service retirement and disability benefits, annual cost of living adjustments and death benefits toplan members, who must be public employees and beneficiaries. Benefits are based on years of credited service,equal to one year of full time employment. Classic members and PEPRA Safety members with five years of totalservice are eligible to retire at age 50 with statutorily reduced benefits. PEPRA Miscellaneous members with fiveyears of total service are eligible to retire at age 52 with statutorily reduced benefits. All members are eligible for non-duty disability benefits after five years of service. The death benefit is the Basic Death Benefit. The cost of livingadjustments for each plan are applied as specified by the Public Employees’ Retirement Law.
49

CITY OF AUBURNNOTES TO BASIC FINANCIAL STATEMENTS
JUNE 30, 2018
NOTE 9: PENSION PLAN (CONTINUED)
The Plans’ provisions and benefits in effect at June 30, 2018, are summarized as follows:
Employer Rate Plans in the Miscellaneous Risk Pool
Miscellaneous PEPRA Misc.Hire Date Prior to 1/1/2013 On or after 1/1/2013Benefit formula 2.0% @ 55 2.0% @ 62Benefit vesting schedule 5 years of service 5 years of serviceBenefit payments Monthly for life Monthly for lifeRetirement age 50 52Monthly benefits, as of % of eligiblecompensation
1.426% to 2.418% 1.0% to 2.5%
Required employee contribution rates 6.896% 6.25%Required employer contribution rates 8.921% 6.533%
Employer Rate Plans in the Safety Risk Pool
1st Tier Police 2nd Tier Police 1st Tier Fire 2nd Tier FireHire Date 7/1/2010 On or after 7/1/2010 On or after 1/1/1990 On or after 7/1/2010Benefit formula 3.0% @ 50 2.0% @ 50 3.0% @ 50 2.0% @ 50Benefit vesting schedule 5 years of service 5 years of service 5 years of service 5 years of serviceBenefit payments Monthly for life Monthly for life Monthly for life Monthly for lifeRetirement age 50 50 50 50Monthly benefits, as of % of eligiblecompensation
3.0% 2.0% to 2.7% 3.0% 2.0% to 2.7%
Required employee contribution rates 8.988% 8.933% 8.988% 8.933%Required employer contribution rates 19.723% 15.928% 22.694% 19.273%
PEPRA Fire PEPRA PoliceHire Date On or after 1/1/2013 On or after 1/1/2013Benefit formula 2.7% @ 57 2.7% @ 57Benefit vesting schedule 5 years of service 5 years of serviceBenefit payments Monthly for life Monthly for lifeRetirement age 50 50Monthly benefits, as of % of eligiblecompensation
2.0% to 2.7% 2.0% to 2.7%
Required employee contribution rates 0.00% 11.50%Required employer contribution rates 23.49% 11.99%
Contributions
Section 20814(c) of the California Public Employees’ Retirement Law requires that the employer contribution rates forall public employers be determined on an annual basis by the CalPERS actuary and shall be effective on the July 1following notice of a change in the rate. Contribution rates for the employer rate plans are determined through theCalPERS’ annual actuarial valuation process. Each employer rate plan’s actuarially determined rate is based on theestimated amount necessary to pay the employer rate plan’s allocated share of the cost of benefits earned byemployees during the year, and any unfunded accrued liability. The City of Auburn is required to contribute thedifference between the actuarially determined rate and the contribution rate of employees. The City of Auburn’scontributions to the Plan for the year ended June 30, 2018 were $1,713,575.
B. Pension Liabilities, Pension Expenses, and Deferred Outflows/Inflows of Resources Related to Pensions
As of June 30, 2018, the City reported net pension liability for its proportionate share of the net pension liability of thePlan of $17,388,071. $16,093,934 of the liability is reported in governmental activities and $1,294,137 of the liability isreported in business-type activities.
50
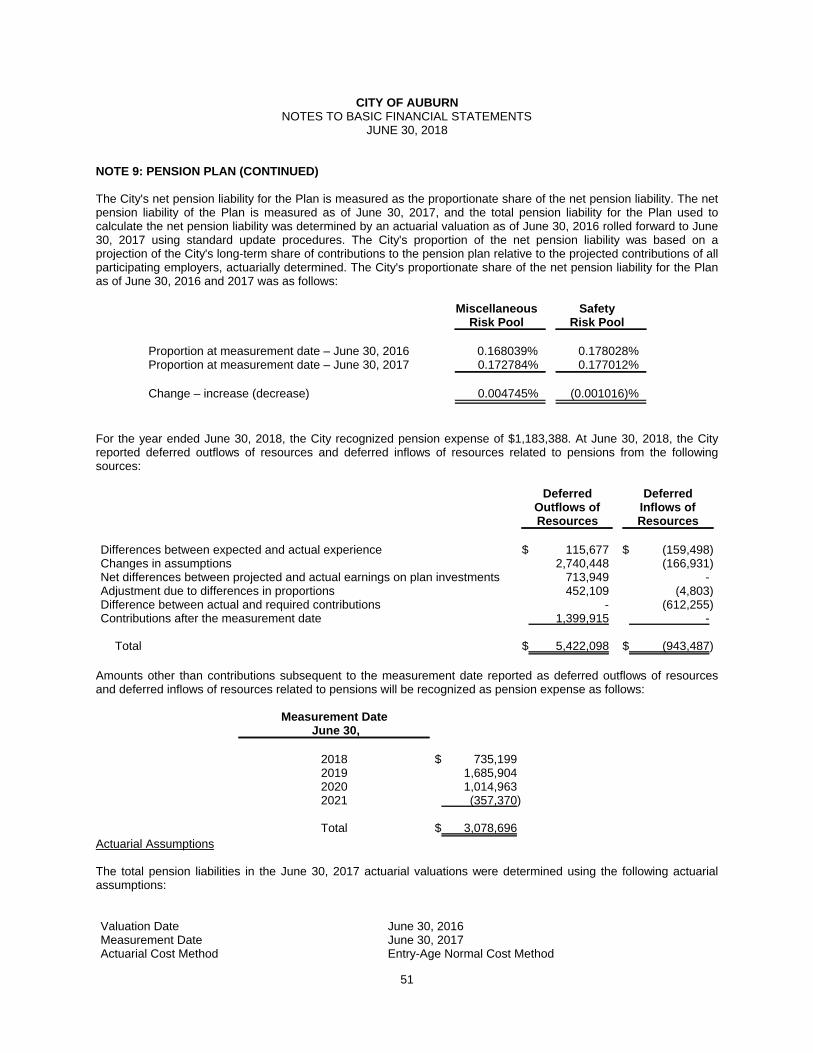
CITY OF AUBURNNOTES TO BASIC FINANCIAL STATEMENTS
JUNE 30, 2018
NOTE 9: PENSION PLAN (CONTINUED)
The City's net pension liability for the Plan is measured as the proportionate share of the net pension liability. The netpension liability of the Plan is measured as of June 30, 2017, and the total pension liability for the Plan used tocalculate the net pension liability was determined by an actuarial valuation as of June 30, 2016 rolled forward to June30, 2017 using standard update procedures. The City's proportion of the net pension liability was based on aprojection of the City's long-term share of contributions to the pension plan relative to the projected contributions of allparticipating employers, actuarially determined. The City's proportionate share of the net pension liability for the Planas of June 30, 2016 and 2017 was as follows:
MiscellaneousRisk Pool
SafetyRisk Pool
Proportion at measurement date – June 30, 2016 0.168039% 0.178028%Proportion at measurement date – June 30, 2017 0.172784% 0.177012%
Change – increase (decrease) 0.004745% (0.001016)%
For the year ended June 30, 2018, the City recognized pension expense of $1,183,388. At June 30, 2018, the Cityreported deferred outflows of resources and deferred inflows of resources related to pensions from the followingsources:
DeferredOutflows ofResources
DeferredInflows ofResources
Differences between expected and actual experience $ 115,677 $ (159,498)Changes in assumptions 2,740,448 (166,931)Net differences between projected and actual earnings on plan investments 713,949 -Adjustment due to differences in proportions 452,109 (4,803)Difference between actual and required contributions - (612,255)Contributions after the measurement date 1,399,915 -
Total $ 5,422,098 $ (943,487)
Amounts other than contributions subsequent to the measurement date reported as deferred outflows of resourcesand deferred inflows of resources related to pensions will be recognized as pension expense as follows:
Measurement Date June 30,
2018 $ 735,1992019 1,685,9042020 1,014,9632021 (357,370)
Total $ 3,078,696Actuarial Assumptions
The total pension liabilities in the June 30, 2017 actuarial valuations were determined using the following actuarialassumptions:
Valuation Date June 30, 2016Measurement Date June 30, 2017Actuarial Cost Method Entry-Age Normal Cost Method
51
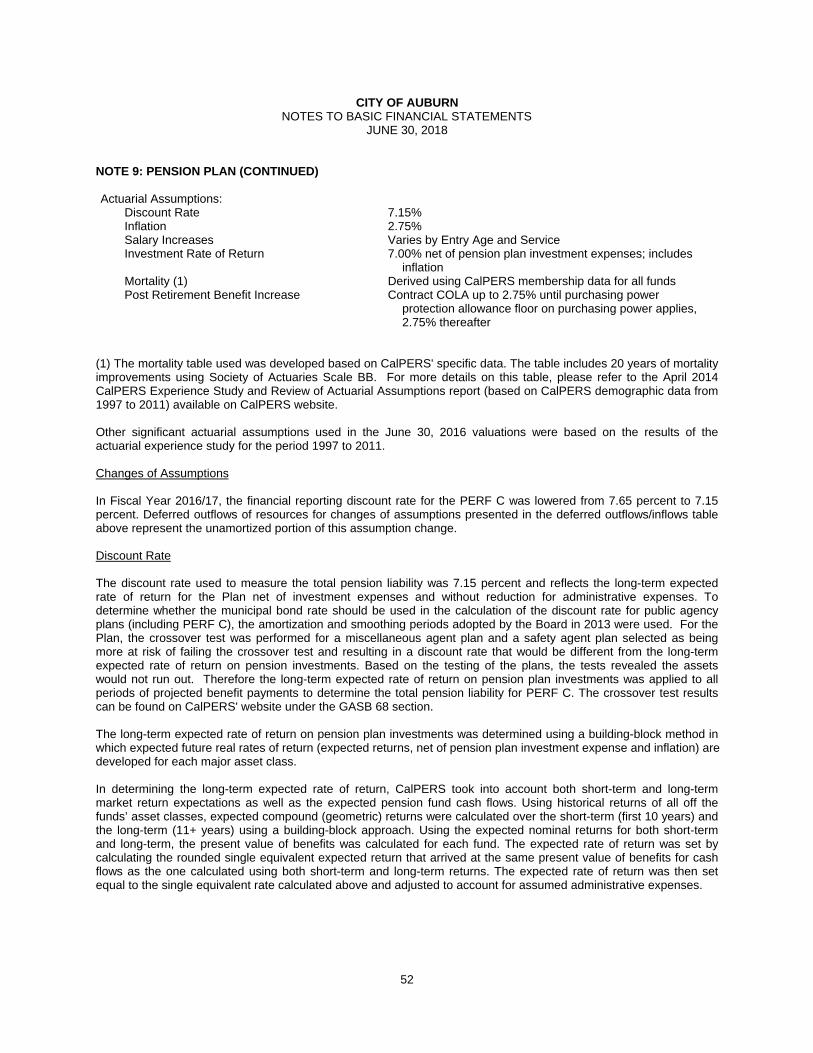
CITY OF AUBURNNOTES TO BASIC FINANCIAL STATEMENTS
JUNE 30, 2018
NOTE 9: PENSION PLAN (CONTINUED)
Actuarial Assumptions:Discount Rate 7.15%Inflation 2.75%Salary Increases Varies by Entry Age and ServiceInvestment Rate of Return 7.00% net of pension plan investment expenses; includes
inflationMortality (1) Derived using CalPERS membership data for all fundsPost Retirement Benefit Increase Contract COLA up to 2.75% until purchasing power
protection allowance floor on purchasing power applies,2.75% thereafter
(1) The mortality table used was developed based on CalPERS' specific data. The table includes 20 years of mortalityimprovements using Society of Actuaries Scale BB. For more details on this table, please refer to the April 2014CalPERS Experience Study and Review of Actuarial Assumptions report (based on CalPERS demographic data from1997 to 2011) available on CalPERS website.
Other significant actuarial assumptions used in the June 30, 2016 valuations were based on the results of theactuarial experience study for the period 1997 to 2011.
Changes of Assumptions
In Fiscal Year 2016/17, the financial reporting discount rate for the PERF C was lowered from 7.65 percent to 7.15percent. Deferred outflows of resources for changes of assumptions presented in the deferred outflows/inflows tableabove represent the unamortized portion of this assumption change.
Discount Rate
The discount rate used to measure the total pension liability was 7.15 percent and reflects the long-term expectedrate of return for the Plan net of investment expenses and without reduction for administrative expenses. Todetermine whether the municipal bond rate should be used in the calculation of the discount rate for public agencyplans (including PERF C), the amortization and smoothing periods adopted by the Board in 2013 were used. For thePlan, the crossover test was performed for a miscellaneous agent plan and a safety agent plan selected as beingmore at risk of failing the crossover test and resulting in a discount rate that would be different from the long-termexpected rate of return on pension investments. Based on the testing of the plans, the tests revealed the assetswould not run out. Therefore the long-term expected rate of return on pension plan investments was applied to allperiods of projected benefit payments to determine the total pension liability for PERF C. The crossover test resultscan be found on CalPERS' website under the GASB 68 section.
The long-term expected rate of return on pension plan investments was determined using a building-block method inwhich expected future real rates of return (expected returns, net of pension plan investment expense and inflation) aredeveloped for each major asset class.
In determining the long-term expected rate of return, CalPERS took into account both short-term and long-termmarket return expectations as well as the expected pension fund cash flows. Using historical returns of all off thefunds’ asset classes, expected compound (geometric) returns were calculated over the short-term (first 10 years) andthe long-term (11+ years) using a building-block approach. Using the expected nominal returns for both short-termand long-term, the present value of benefits was calculated for each fund. The expected rate of return was set bycalculating the rounded single equivalent expected return that arrived at the same present value of benefits for cashflows as the one calculated using both short-term and long-term returns. The expected rate of return was then setequal to the single equivalent rate calculated above and adjusted to account for assumed administrative expenses.
52
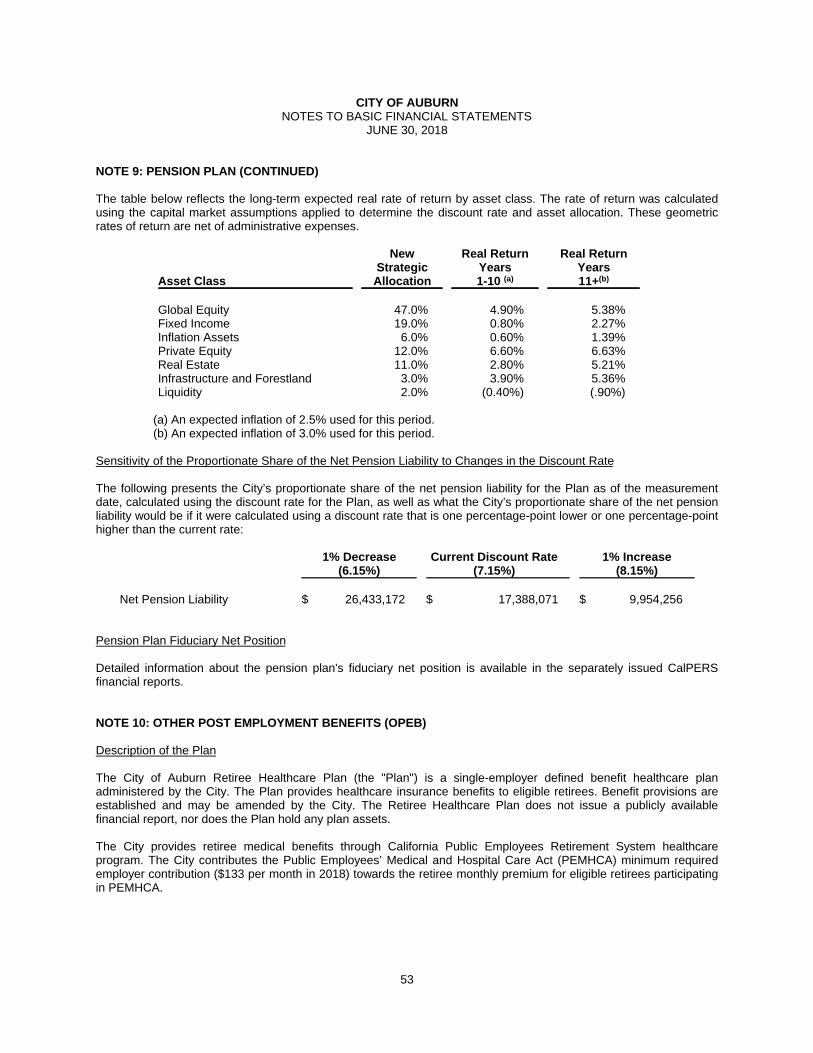
CITY OF AUBURNNOTES TO BASIC FINANCIAL STATEMENTS
JUNE 30, 2018
NOTE 9: PENSION PLAN (CONTINUED)
The table below reflects the long-term expected real rate of return by asset class. The rate of return was calculatedusing the capital market assumptions applied to determine the discount rate and asset allocation. These geometricrates of return are net of administrative expenses.
Asset Class
NewStrategicAllocation
Real ReturnYears1-10 (a)
Real ReturnYears11+(b)
Global Equity 47.0% 4.90% 5.38%Fixed Income 19.0% 0.80% 2.27%Inflation Assets 6.0% 0.60% 1.39%Private Equity 12.0% 6.60% 6.63%Real Estate 11.0% 2.80% 5.21%Infrastructure and Forestland 3.0% 3.90% 5.36%Liquidity 2.0% (0.40%) (.90%)
(a) An expected inflation of 2.5% used for this period.(b) An expected inflation of 3.0% used for this period.
Sensitivity of the Proportionate Share of the Net Pension Liability to Changes in the Discount Rate
The following presents the City’s proportionate share of the net pension liability for the Plan as of the measurementdate, calculated using the discount rate for the Plan, as well as what the City’s proportionate share of the net pensionliability would be if it were calculated using a discount rate that is one percentage-point lower or one percentage-pointhigher than the current rate:
1% Decrease(6.15%)
Current Discount Rate(7.15%)
1% Increase(8.15%)
Net Pension Liability $ 26,433,172 $ 17,388,071 $ 9,954,256
Pension Plan Fiduciary Net Position
Detailed information about the pension plan's fiduciary net position is available in the separately issued CalPERSfinancial reports.
NOTE 10: OTHER POST EMPLOYMENT BENEFITS (OPEB)
Description of the Plan
The City of Auburn Retiree Healthcare Plan (the "Plan") is a single-employer defined benefit healthcare planadministered by the City. The Plan provides healthcare insurance benefits to eligible retirees. Benefit provisions areestablished and may be amended by the City. The Retiree Healthcare Plan does not issue a publicly availablefinancial report, nor does the Plan hold any plan assets.
The City provides retiree medical benefits through California Public Employees Retirement System healthcareprogram. The City contributes the Public Employees’ Medical and Hospital Care Act (PEMHCA) minimum requiredemployer contribution ($133 per month in 2018) towards the retiree monthly premium for eligible retirees participatingin PEMHCA.
53
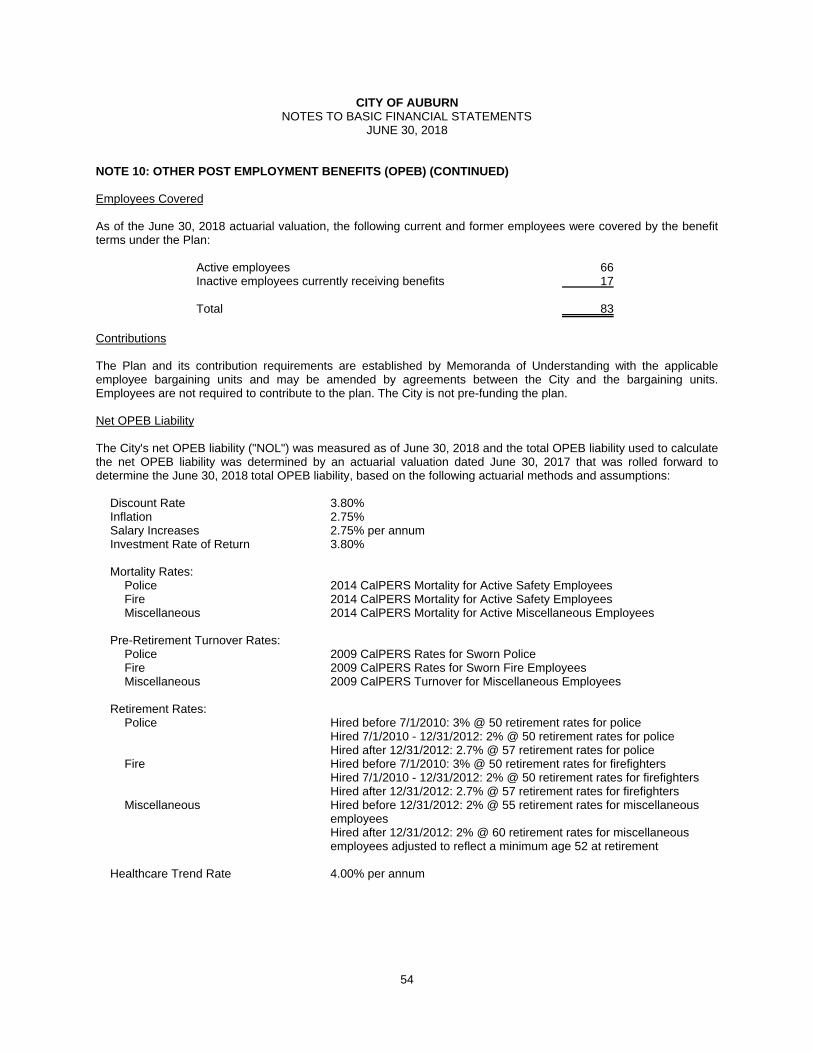
CITY OF AUBURNNOTES TO BASIC FINANCIAL STATEMENTS
JUNE 30, 2018
NOTE 10: OTHER POST EMPLOYMENT BENEFITS (OPEB) (CONTINUED)
Employees Covered
As of the June 30, 2018 actuarial valuation, the following current and former employees were covered by the benefitterms under the Plan:
Active employees 66Inactive employees currently receiving benefits 17
Total 83
Contributions
The Plan and its contribution requirements are established by Memoranda of Understanding with the applicableemployee bargaining units and may be amended by agreements between the City and the bargaining units.Employees are not required to contribute to the plan. The City is not pre-funding the plan.
Net OPEB Liability
The City's net OPEB liability ("NOL") was measured as of June 30, 2018 and the total OPEB liability used to calculatethe net OPEB liability was determined by an actuarial valuation dated June 30, 2017 that was rolled forward todetermine the June 30, 2018 total OPEB liability, based on the following actuarial methods and assumptions:
Discount Rate 3.80%Inflation 2.75%Salary Increases 2.75% per annumInvestment Rate of Return 3.80%
Mortality Rates:Police 2014 CalPERS Mortality for Active Safety EmployeesFire 2014 CalPERS Mortality for Active Safety EmployeesMiscellaneous 2014 CalPERS Mortality for Active Miscellaneous Employees
Pre-Retirement Turnover Rates:Police 2009 CalPERS Rates for Sworn PoliceFire 2009 CalPERS Rates for Sworn Fire EmployeesMiscellaneous 2009 CalPERS Turnover for Miscellaneous Employees
Retirement Rates:Police Hired before 7/1/2010: 3% @ 50 retirement rates for police
Hired 7/1/2010 - 12/31/2012: 2% @ 50 retirement rates for policeHired after 12/31/2012: 2.7% @ 57 retirement rates for police
Fire Hired before 7/1/2010: 3% @ 50 retirement rates for firefightersHired 7/1/2010 - 12/31/2012: 2% @ 50 retirement rates for firefightersHired after 12/31/2012: 2.7% @ 57 retirement rates for firefighters
Miscellaneous Hired before 12/31/2012: 2% @ 55 retirement rates for miscellaneousemployeesHired after 12/31/2012: 2% @ 60 retirement rates for miscellaneousemployees adjusted to reflect a minimum age 52 at retirement
Healthcare Trend Rate 4.00% per annum
54

CITY OF AUBURNNOTES TO BASIC FINANCIAL STATEMENTS
JUNE 30, 2018
NOTE 10: OTHER POST EMPLOYMENT BENEFITS (OPEB) (CONTINUED)
Discount Rate
The discount rate used to measure the total OPEB liability was 3.80% based on an assumption that contributionswould be sufficient to fully fund the obligation over a period not to exceed 30 years.
Changes in the OPEB Liability
The changes in the net OPEB liability for the Plan are as follows:
Total OPEBLiability
(a)
Plan FiduciaryNet Position
(b)
Net OPEBLiability/(Asset)
(c) = (a) - (b)
Balance at June 30, 2017 $ 1,604,849 $ - $ 1,604,849
Service cost 85,034 - 85,034Interest in TOL 62,063 - 62,063Employer contributions - 28,267 (28,267)Assumption changes (85,124) - (85,124)Benefit payments (28,267) (28,267) -
Net change during 2016-17 33,706 - 33,706
Balance at June 30, 2018 $ 1,638,555 $ - $ 1,638,555
Sensitivity of the Net OPEB Liability to Changes in the Discount Rate
The following represents the net OPEB liability of the City if it were calculated using a discount rate that is onepercentage-point lower or one percentage-point higher than the current rate, for measurement period endedJune 30, 2018:
1% Decrease(2.80%)
Current DiscountRate
(3.80%)1% Increase
(4.80%)
Net OPEB Liability $ 1,937,653 $ 1,638,555 $ 1,394,713
Sensitivity of the Net OPEB Liability to Changes in the Health Care Cost Trent Rates
The following represents the net OPEB liability of the City if it were calculated using health care cost trend rates thatare one percentage-point lower or one percentage-point higher than the current rate, for measurement period endedJune 30, 2018:
1% Decrease(3.00%)
Current HealthcareCost Trend Rate
(4.00%)1% Increase
(5.00%)
Net OPEB Liability $ 1,390,440 $ 1,638,555 $ 1,938,053
Recognition of Deferred Outflows and Deferred Inflows of Resources
Gains and losses related to changed in total OPEB liability and fiduciary net position are recognized in OPEBexpense systematically over time. Amounts first recognized in OPEB expense for the year the gain or loss occurs.The remaining amounts are categorized as deferred outflows and deferred inflows of resources related to OPEB andare to be recognized in future OPEB expense.
55

CITY OF AUBURNNOTES TO BASIC FINANCIAL STATEMENTS
JUNE 30, 2018
NOTE 10: OTHER POST EMPLOYMENT BENEFITS (OPEB) (CONTINUED)
The recognition period differs depending on the source of the gain or loss:
All other amounts Expected average remaining service lifetime (EARSL)(10.6 years at June 30, 2018)
OPEB Expense
For the fiscal year ended June 30, 2018, the City recognized OPEB expense of $139,066. As of the fiscal year endedJune 30, 2018, the City reported deferred outflows and deferred inflows of resources related to OPEB from thefollowing sources:
DeferredOutflows ofResources
DeferredInflows of
Resources
Changes of assumptions $ - $ 77,093
Total $ - $ 77,093
Amounts reported as deferred outflows and deferred inflows of resources related to OPEB will be recognized asexpense as follows:
Fiscal Year Ended June 30:
DeferredOutflow/(Inflows) of
Resources2019 $ 8,0312020 8,0312021 8,0312022 8,0312023 8,031
Thereafter 36,938
NOTE 11: NET POSITION
The government-wide and proprietary fund financial statements utilize a net position presentation. Net position iscategorized as net investment in capital assets, restricted and unrestricted.
Net investment in capital assets - consists of capital assets including restricted capital assets, net ofaccumulated depreciation and reduced by the outstanding balances of any bonds, mortgages, notes or otherborrowings that are attributable to the acquisition, construction or improvement of those assets.
Restricted net position - consists of net position with constraints placed on the use either by (1) externalgroups such as creditors, grantors, contributors or laws or regulations of other governments; or (2) lawthrough constitutional provisions or enabling legislation.
Unrestricted net position - all other net position that does not meet the definition of “restricted” or “netinvestment in capital assets”.
Net Position Restricted by Enabling Legislation
The government-wide statement of net position reports $2,118,181 of restricted net position, of which $1,096,525 isrestricted by enabling legislation.
56

CITY OF AUBURNNOTES TO BASIC FINANCIAL STATEMENTS
JUNE 30, 2018
NOTE 11: NET POSITION (CONTINUED)
Net Position Flow Assumption
When a government funds outlays for a particular purpose from both restricted and unrestricted resources, a flowassumption must be made about the order in which the resources are considered to be applied. When both restrictedand unrestricted net position are available. It is considered that restricted resources are used first, followed by theunrestricted resources.
NOTE 12: FUND BALANCE
GASB Statement No. 54, Fund Balance Reporting and Governmental Fund Type Definitions provides more clearlydefined fund balance categories to make the nature and extent of the constraints placed on a government’s fundbalances more transparent. The following classifications describe the relative strength of the spending constraints:
Non-Spendable: Amounts that cannot be spent because they are either (a) not in spendable form (not expected to beconverted to cash) or (b) legally or contractually required to be maintained intact. The City has classified prepaiditems as nonspendable since these items are not expected to be converted to cash or are not expected to beconverted to cash within the next year.
Restricted: Amounts subject to externally enforceable legal restrictions or constrained for a specific purpose byexternal parties, constitutional provision, or enabling legislation. This fund balance type is essentially the samedefinition as restricted net position under GASB Statement No. 34.
Committed: Amounts that can only be used for specific purposes pursuant to constraints imposed by the formal action(resolution) of the City Council. Committed amounts cannot be used for any other purpose unless the governmentremoves or changes the specified use by taking the same type of action (legislation, resolution, ordinance) itemployed to previously commit those amounts. Action to constrain resources must occur prior to year-end; however,the amount can be determined in the subsequent period.
Assigned: Amounts that are not restricted by the funding agency but are for specific purposes and assigned by CityCouncil for that purpose. City Council's action in creating the fund is to ensure that the funds are used for theirintended purpose. That purpose is not always planned for the current fiscal year as it may take several years to buildup a sufficient fund balance to be able to implement the stated purpose. This classification also represents allremaining amounts (except negative balances) reported in governmental funds, other than the general fund, that arenot classified as non-spendable, restricted, or committed.
Unassigned: Residual amounts in the general fund, not classified as non-spendable, restricted, committed, orassigned. For other governmental fund types, unassigned is only used when a deficit or negative fund balanceoccurs.
When a government fund outlays for a particular purpose from both restricted and unrestricted resources (the total ofcommitted, assigned, and unassigned fund balance), a flow assumption must be made about the order in which theresources are considered to be applied. When both restricted and unrestricted fund balance are available, it isconsidered that restricted fund balance is depleted before using any of the components of unrestricted fund balance.Further, when the components of unrestricted fund balance can be used for the same purpose, committed fundbalance is depleted first, followed by assigned fund balance. Unassigned fund balance is applied last.
Pursuant to City Council Resolution No. 15-25 adopted March 9, 2015, a formal fund balance policy establishedprocedures for reporting fund balance classifications and established a hierarchy for fund balance expenditures. Aspart of this policy, the City maintains a General Fund commitment for contingencies in the amount of $2,700,000adopted with each budget. This committed component of fund balance can only be expended upon approval by theCity Council and is intended to meet unforeseen contingencies such as emergencies, revenue shortfall, mandates orunanticipated inflation. It is not intended for routine capital projects or general operations. Upon expenditures from thisfund balance, the City Council may approve additions to replenish the balance.
57
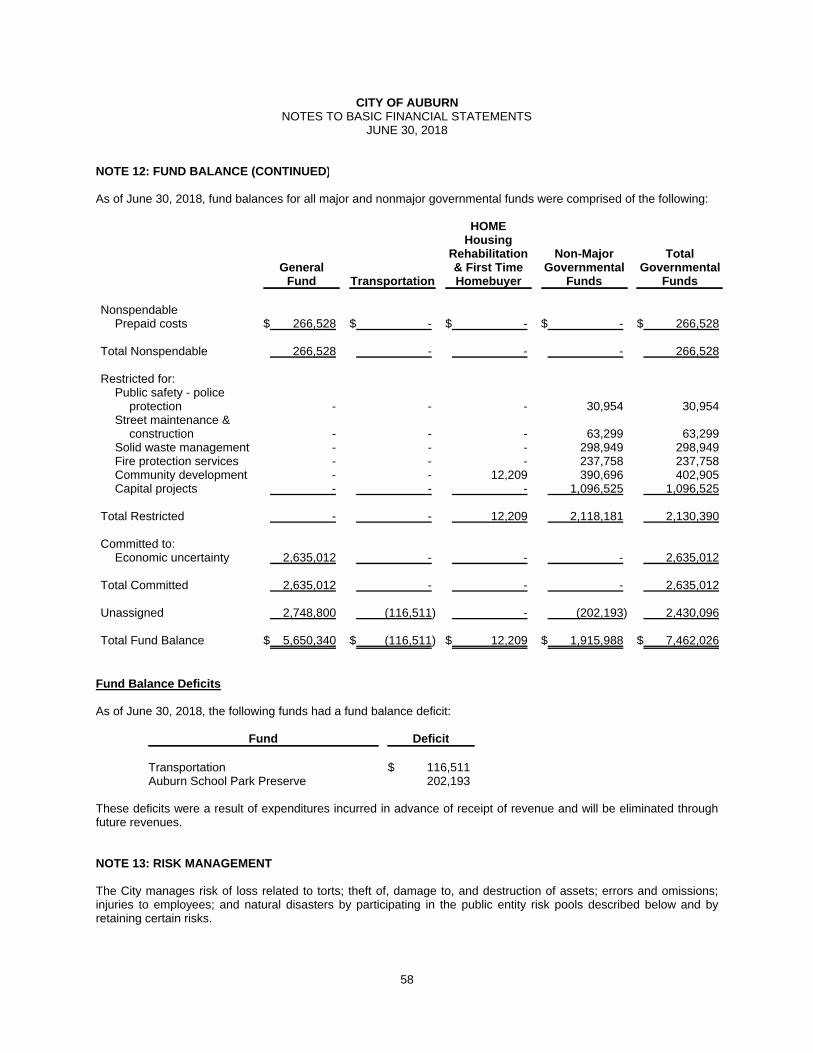
CITY OF AUBURNNOTES TO BASIC FINANCIAL STATEMENTS
JUNE 30, 2018
NOTE 12: FUND BALANCE (CONTINUED)
As of June 30, 2018, fund balances for all major and nonmajor governmental funds were comprised of the following:
GeneralFund Transportation
HOMEHousing
Rehabilitation& First TimeHomebuyer
Non-MajorGovernmental
Funds
TotalGovernmental
Funds
NonspendablePrepaid costs $ 266,528 $ - $ - $ - $ 266,528
Total Nonspendable 266,528 - - - 266,528
Restricted for:Public safety - police
protection - - - 30,954 30,954Street maintenance &
construction - - - 63,299 63,299Solid waste management - - - 298,949 298,949Fire protection services - - - 237,758 237,758Community development - - 12,209 390,696 402,905Capital projects - - - 1,096,525 1,096,525
Total Restricted - - 12,209 2,118,181 2,130,390
Committed to:Economic uncertainty 2,635,012 - - - 2,635,012
Total Committed 2,635,012 - - - 2,635,012
Unassigned 2,748,800 (116,511) - (202,193) 2,430,096
Total Fund Balance $ 5,650,340 $ (116,511) $ 12,209 $ 1,915,988 $ 7,462,026
Fund Balance Deficits
As of June 30, 2018, the following funds had a fund balance deficit:
Fund Deficit
Transportation $ 116,511Auburn School Park Preserve 202,193
These deficits were a result of expenditures incurred in advance of receipt of revenue and will be eliminated throughfuture revenues.
NOTE 13: RISK MANAGEMENT
The City manages risk of loss related to torts; theft of, damage to, and destruction of assets; errors and omissions;injuries to employees; and natural disasters by participating in the public entity risk pools described below and byretaining certain risks.
58
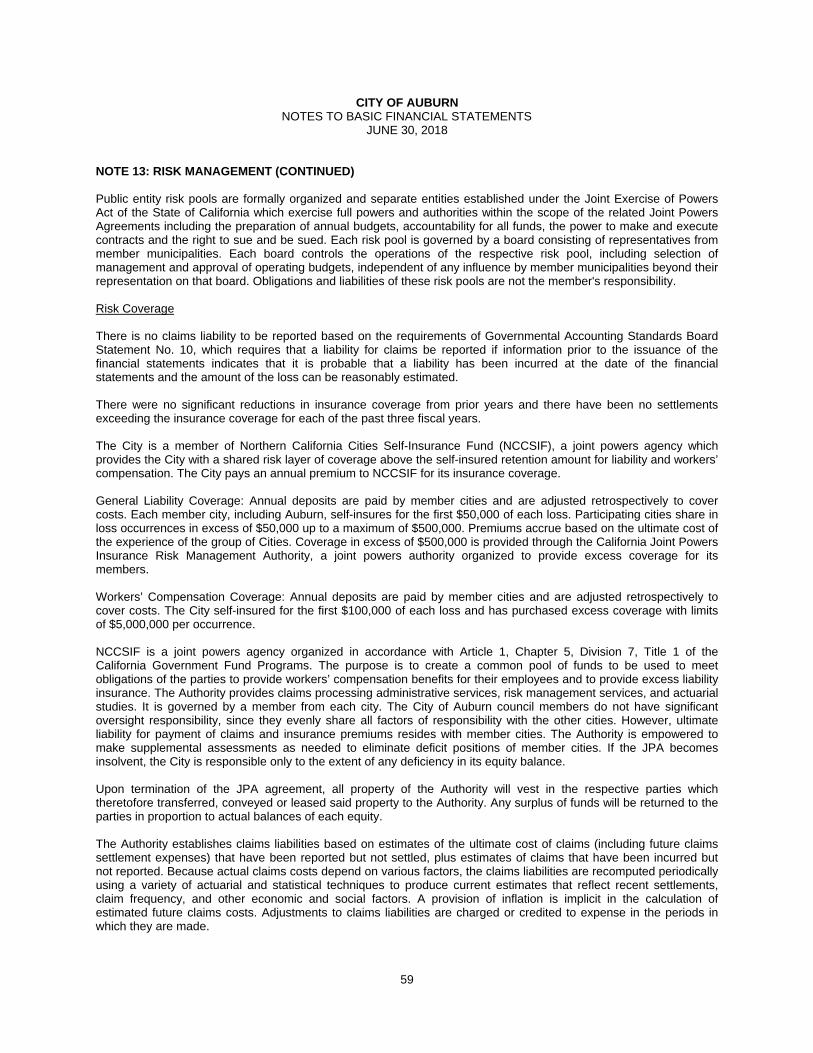
CITY OF AUBURNNOTES TO BASIC FINANCIAL STATEMENTS
JUNE 30, 2018
NOTE 13: RISK MANAGEMENT (CONTINUED)
Public entity risk pools are formally organized and separate entities established under the Joint Exercise of PowersAct of the State of California which exercise full powers and authorities within the scope of the related Joint PowersAgreements including the preparation of annual budgets, accountability for all funds, the power to make and executecontracts and the right to sue and be sued. Each risk pool is governed by a board consisting of representatives frommember municipalities. Each board controls the operations of the respective risk pool, including selection ofmanagement and approval of operating budgets, independent of any influence by member municipalities beyond theirrepresentation on that board. Obligations and liabilities of these risk pools are not the member's responsibility.
Risk Coverage
There is no claims liability to be reported based on the requirements of Governmental Accounting Standards BoardStatement No. 10, which requires that a liability for claims be reported if information prior to the issuance of thefinancial statements indicates that it is probable that a liability has been incurred at the date of the financialstatements and the amount of the loss can be reasonably estimated.
There were no significant reductions in insurance coverage from prior years and there have been no settlementsexceeding the insurance coverage for each of the past three fiscal years.
The City is a member of Northern California Cities Self-Insurance Fund (NCCSIF), a joint powers agency whichprovides the City with a shared risk layer of coverage above the self-insured retention amount for liability and workers’compensation. The City pays an annual premium to NCCSIF for its insurance coverage.
General Liability Coverage: Annual deposits are paid by member cities and are adjusted retrospectively to covercosts. Each member city, including Auburn, self-insures for the first $50,000 of each loss. Participating cities share inloss occurrences in excess of $50,000 up to a maximum of $500,000. Premiums accrue based on the ultimate cost ofthe experience of the group of Cities. Coverage in excess of $500,000 is provided through the California Joint PowersInsurance Risk Management Authority, a joint powers authority organized to provide excess coverage for itsmembers.
Workers’ Compensation Coverage: Annual deposits are paid by member cities and are adjusted retrospectively tocover costs. The City self-insured for the first $100,000 of each loss and has purchased excess coverage with limitsof $5,000,000 per occurrence.
NCCSIF is a joint powers agency organized in accordance with Article 1, Chapter 5, Division 7, Title 1 of theCalifornia Government Fund Programs. The purpose is to create a common pool of funds to be used to meetobligations of the parties to provide workers’ compensation benefits for their employees and to provide excess liabilityinsurance. The Authority provides claims processing administrative services, risk management services, and actuarialstudies. It is governed by a member from each city. The City of Auburn council members do not have significantoversight responsibility, since they evenly share all factors of responsibility with the other cities. However, ultimateliability for payment of claims and insurance premiums resides with member cities. The Authority is empowered tomake supplemental assessments as needed to eliminate deficit positions of member cities. If the JPA becomesinsolvent, the City is responsible only to the extent of any deficiency in its equity balance.
Upon termination of the JPA agreement, all property of the Authority will vest in the respective parties whichtheretofore transferred, conveyed or leased said property to the Authority. Any surplus of funds will be returned to theparties in proportion to actual balances of each equity.
The Authority establishes claims liabilities based on estimates of the ultimate cost of claims (including future claimssettlement expenses) that have been reported but not settled, plus estimates of claims that have been incurred butnot reported. Because actual claims costs depend on various factors, the claims liabilities are recomputed periodicallyusing a variety of actuarial and statistical techniques to produce current estimates that reflect recent settlements,claim frequency, and other economic and social factors. A provision of inflation is implicit in the calculation ofestimated future claims costs. Adjustments to claims liabilities are charged or credited to expense in the periods inwhich they are made.
59

CITY OF AUBURNNOTES TO BASIC FINANCIAL STATEMENTS
JUNE 30, 2018
NOTE 13: RISK MANAGEMENT (CONTINUED)
The participants as of June 30, 2018 were as follows:
Anderson Lincoln Auburn Marysville Colusa Nevada City Corning Oroville Dixon Paradise Elk Grove Placerville Folsom Red Bluff Galt Rio Vista Gridley Rocklin Ione Willows Jackson Yuba City
The City’s equity investment in the NCCSIF of $252,191 is recorded in the General fund as Prepaid Insurance. Thenet change in equity is shown as an income or expenditure item in the General fund.
NOTE 14: EXCESS OF EXPENDITURES OVER APPROPRIATIONS
The following funds incurred expenditures and transfers in excess of appropriations in the following amounts for theyear ended June 30, 2018:
Fund
ExcessExpendituresand Transfers
Property Seizures 43,949Small Business Loans 7,831State Law Enforcement Grant 60,000Facilities and Equipment 12,587
The excess expenditures were covered by available fund balance in the funds.
NOTE 15: CONTINGENT LIABILITIES AND COMMITMENTS
At June 30, 2018, the City had construction contracts outstanding of approximately $1,682,021 for the SewerOxidation Ditch project, airport projects, road overlay projects and the city hall storm damage/windows project.
Amounts received or receivable from grant agencies are subject to audit and adjustment by grantor agencies. Anydisallowed claims, including amounts already collected, may constitute a liability of the appreciable funds. Theamount, if any, of expenditures which may be disallowed by the grantor cannot be determined at this time althoughthe government expects such amounts, if any, to be immaterial.
NOTE 16: TAX ABATEMENTS
The City entered into a sales tax abatement agreement with Nella Oil Company, Flyers LLC on April 18, 2005pursuant to City Council Resolution No. 05-45. The sales tax abatement serves a public purpose through expandingeconomic opportunities for businesses in the City, expanding the City’s employment base, and generating sales taxrevenues to the City that the City can utilize to fund governmental services such as police, fire, street maintenance,and other programs.
Consistent with the terms of the tax abatement resolution, forty-six percent (46%) of sales tax revenues received bythe City from Nella Oil Company, Flyers LLC is reimbursed (abated) back to said business owner.
60

CITY OF AUBURNNOTES TO BASIC FINANCIAL STATEMENTS
JUNE 30, 2018
NOTE 16: TAX ABATEMENTS (CONTINUED)
Type of Business PurposePercentAbated
Gasoline/Petroleum Creation of Economic Opportunities andProvision of Government Services
46%
NOTE 17: SUCCESSOR AGENCY TRUST FOR ASSETS OF FORMER REDEVELOPMENT AGENCY
In accordance with Assembly Bill 1X26 and Assembly Bill 1434, all redevelopment agencies in the State of Californiawere dissolved and ceased to operate as legal entities as of February 1, 2012. The activity of the Successor AgencyTrust for Assets of Former Redevelopment Agency (Successor Agency) is recorded in a private purpose trust fund.
The following is a summary of changes in long-term liabilities for the year ended June 30, 2018:
Type of IndebtednessBalance
July 1, 2017Additions/
Adjustments RetirementsBalance
June 30, 2018Amounts Due
Within One Year
Tax allocation bonds $ 4,275,000 $ - $ (135,000) $ 4,140,000 $ 140,000Plus: Discounts 110,005 - (5,239) 104,766 5,239
Tax allocation bonds, net 4,385,005 - (140,239) 4,244,766 145,239
Total $ 4,385,005 $ - $ (140,239) $ 4,244,766 $ 145,239
Individual issues of debt payable outstanding at June 30, 2018, are as follows:
Tax Allocation Bonds:Auburn Urban Development Authority 2015 Tax Allocation Refunding Bonds, issued October1, 2015 in the amount of $4,475,000 and payable in annual installments of $70,000 to$235,000, with an interest rate of 2.75% to 5.00% and maturity on June 1, 2038. The bondswere used to refund the 2008 Tax Allocation Revenue Bonds. $ 4,140,000
Total Tax Allocation Bonds $ 4,140,000
Following is a schedule of debt payment requirements to maturity for long-term debt:
Tax Allocation BondsYear Ended
June 30, Principal Interest Total
2019 $ 140,000 $ 154,756 $ 294,7562020 145,000 149,156 294,1562021 155,000 143,356 298,3562022 160,000 137,156 297,1562023 170,000 130,756 300,756
2024 - 2028 945,000 541,456 1,486,4562029 - 2033 1,110,000 375,694 1,485,6942034 - 2038 1,315,000 161,600 1,476,600
Total $ 4,140,000 $ 1,793,930 $ 5,933,930
61
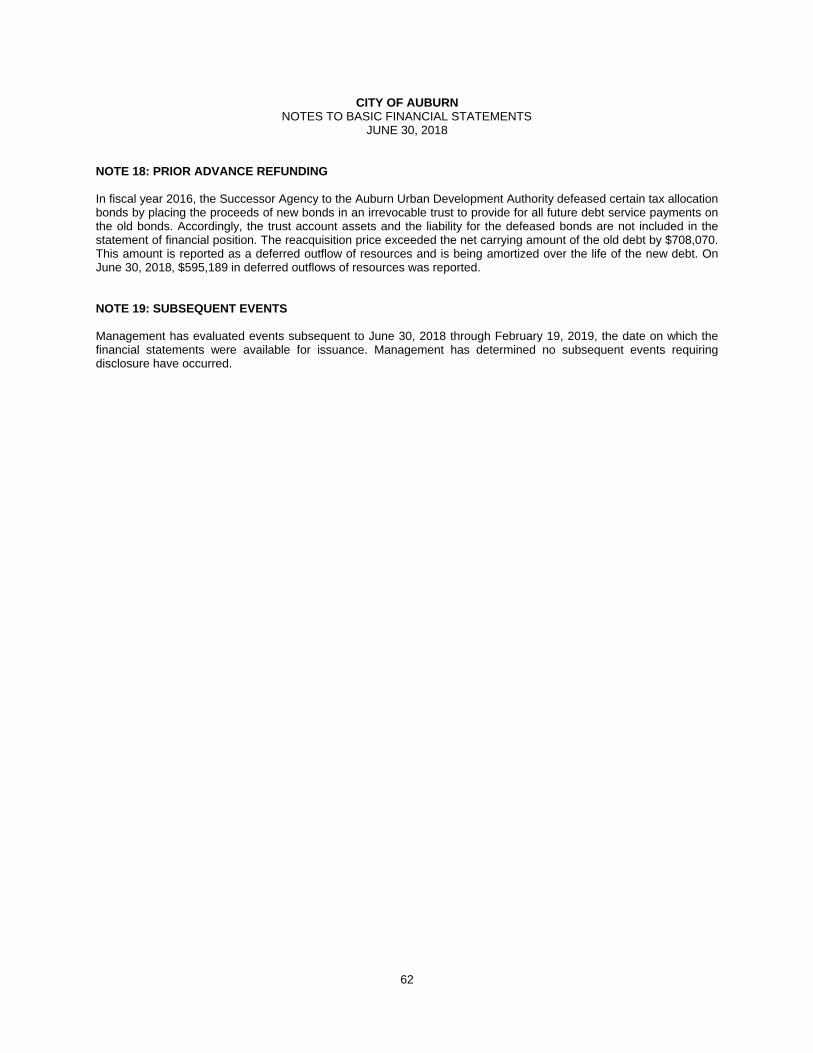
CITY OF AUBURNNOTES TO BASIC FINANCIAL STATEMENTS
JUNE 30, 2018
NOTE 18: PRIOR ADVANCE REFUNDING
In fiscal year 2016, the Successor Agency to the Auburn Urban Development Authority defeased certain tax allocationbonds by placing the proceeds of new bonds in an irrevocable trust to provide for all future debt service payments onthe old bonds. Accordingly, the trust account assets and the liability for the defeased bonds are not included in thestatement of financial position. The reacquisition price exceeded the net carrying amount of the old debt by $708,070.This amount is reported as a deferred outflow of resources and is being amortized over the life of the new debt. OnJune 30, 2018, $595,189 in deferred outflows of resources was reported.
NOTE 19: SUBSEQUENT EVENTS
Management has evaluated events subsequent to June 30, 2018 through February 19, 2019, the date on which thefinancial statements were available for issuance. Management has determined no subsequent events requiringdisclosure have occurred.
62

REQUIRED SUPPLEMENTARY INFORMATION

CITY OF AUBURNREQUIRED SUPPLEMENTARY INFORMATION
SCHEDULE OF THE CITY'S PROPORTIONATE SHARE OF THE NET PENSION LIABILITYAs of June 30, 2018
Last 10 Years*
Measurement Period2014 2015 2016 2017
Proportion of the net pension liability %0.16656 %0.16851 %0.17402 %0.17533
Proportionate share of the net pensionliability
$ 10,364,029 $ 11,566,338 $ 15,057,902 $ 17,388,071
Covered employee payroll $ 5,246,758 $ 5,395,469 $ 4,719,132 $ 5,285,037
Proportionate share of the net pensionliability as a percentage of coveredemployee payroll
%197.53 %214.37 %319.08 %329.01
Plan fiduciary net position as a percentageof the total pension liability %74.06 %78.40 %79.82 %73.29
Notes to Schedule:
Changes in assumptions – In 2017, amounts reported reflect an adjustment of the discount rate from 7.65 percent to7.15 percent. In 2016, there were no changes. In 2015, amounts reported reflect an adjustment of the discount ratefrom 7.5 percent (net of administrative expense) to 7.65 percent (without a reduction for pension plan administrativeexpense). In 2014, amounts reported were based on the 7.5 percent discount rate.
* Schedule is intended to show information for ten years. Fiscal year 2015 was the first year of implementation,therefore only four years are shown. Additional years' information will be displayed as it becomes available.
63

CITY OF AUBURNREQUIRED SUPPLEMENTARY INFORMATION
SCHEDULE OF CONTRIBUTIONSPrepared for the City's Miscellaneous and Safety Cost Sharing Defined Benefit Pension Plan
As of June 30, 2018
Last 10 Years*
Fiscal Year-End2015** 2016 2017 2018
Miscellaneous Plan
Contractually required contribution(actuarially determined)
$ 1,009,017 $ 1,172,934 $ 1,314,609 $ 1,399,915
Contributions in relation to the actuariallydetermined contributions (1,009,017) (1,172,934) (1,314,609) (1,399,915)
Contribution deficiency (excess) $ - $ - $ - $ -
Covered employee payroll $ 5,395,469 $ 4,719,132 $ 4,887,126 $ 5,401,485
Contributions as a percentage of coveredemployee payroll
%18.70 %24.85 %26.90 %25.92
* Schedule is intended to show information for ten years. Fiscal year 2015 was the first year of implementation,therefore only four years are shown. Additional years' information will be displayed as it becomes available.
**The June 30, 2015 balances have been restated to agree to the actual contributions per the City records.
64
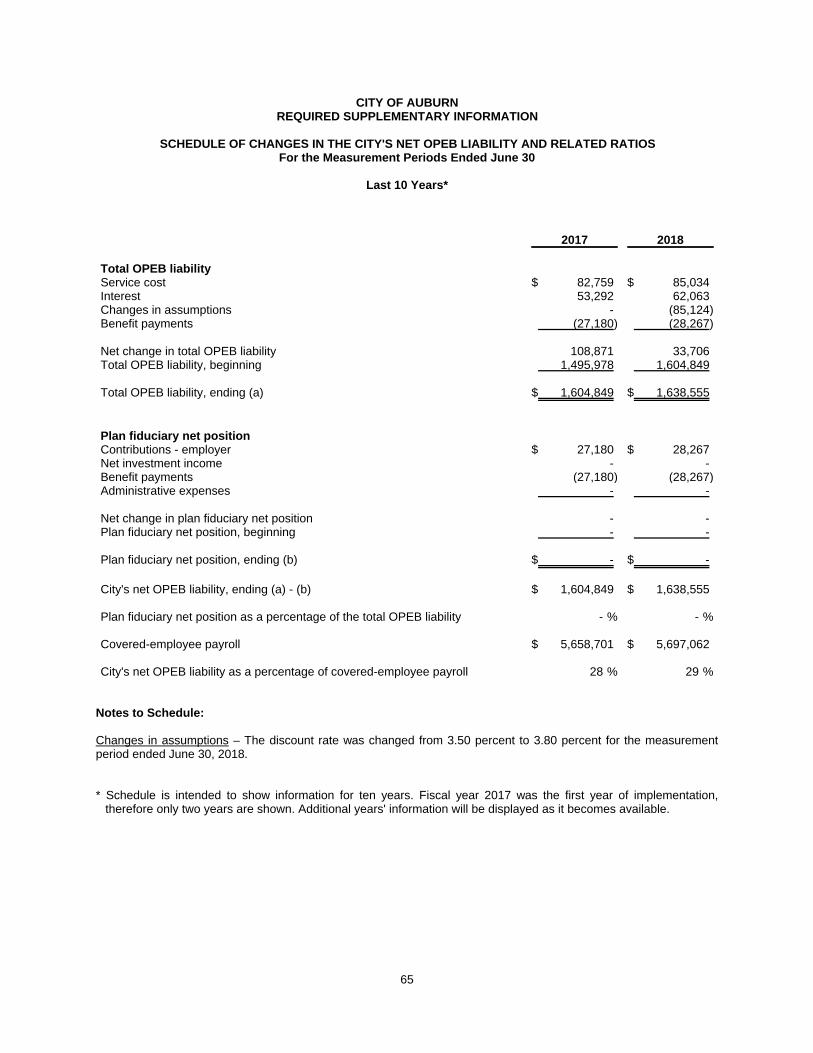
CITY OF AUBURNREQUIRED SUPPLEMENTARY INFORMATION
SCHEDULE OF CHANGES IN THE CITY'S NET OPEB LIABILITY AND RELATED RATIOSFor the Measurement Periods Ended June 30
Last 10 Years*
2017 2018
Total OPEB liabilityService cost $ 82,759 $ 85,034Interest 53,292 62,063Changes in assumptions - (85,124)Benefit payments (27,180) (28,267)
Net change in total OPEB liability 108,871 33,706Total OPEB liability, beginning 1,495,978 1,604,849
Total OPEB liability, ending (a) $ 1,604,849 $ 1,638,555
Plan fiduciary net positionContributions - employer $ 27,180 $ 28,267Net investment income - -Benefit payments (27,180) (28,267)Administrative expenses - -
Net change in plan fiduciary net position - -Plan fiduciary net position, beginning - -
Plan fiduciary net position, ending (b) $ - $ -
City's net OPEB liability, ending (a) - (b) $ 1,604,849 $ 1,638,555
Plan fiduciary net position as a percentage of the total OPEB liability %- %-
Covered-employee payroll $ 5,658,701 $ 5,697,062
City's net OPEB liability as a percentage of covered-employee payroll %28 %29
Notes to Schedule:
Changes in assumptions – The discount rate was changed from 3.50 percent to 3.80 percent for the measurementperiod ended June 30, 2018.
* Schedule is intended to show information for ten years. Fiscal year 2017 was the first year of implementation,therefore only two years are shown. Additional years' information will be displayed as it becomes available.
65
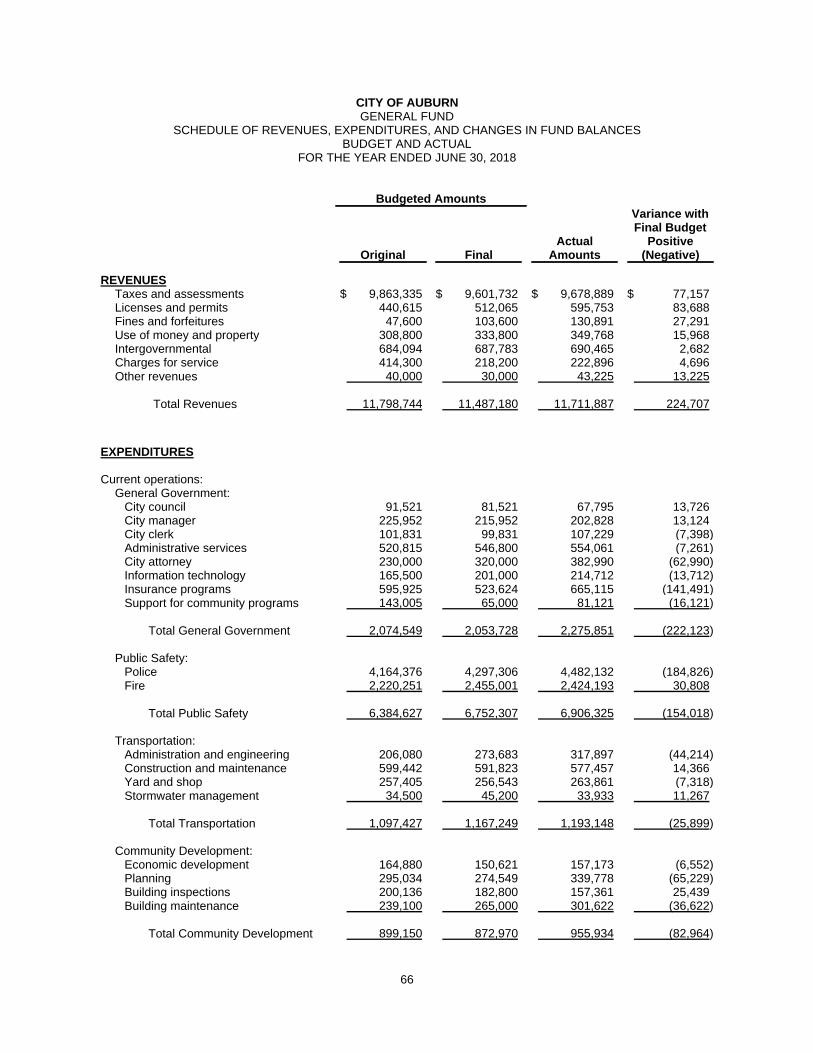
CITY OF AUBURNGENERAL FUND
SCHEDULE OF REVENUES, EXPENDITURES, AND CHANGES IN FUND BALANCESBUDGET AND ACTUAL
FOR THE YEAR ENDED JUNE 30, 2018
Budgeted Amounts
Original FinalActual
Amounts
Variance withFinal Budget
Positive(Negative)
REVENUESTaxes and assessments $ 9,863,335 $ 9,601,732 $ 9,678,889 $ 77,157Licenses and permits 440,615 512,065 595,753 83,688Fines and forfeitures 47,600 103,600 130,891 27,291Use of money and property 308,800 333,800 349,768 15,968Intergovernmental 684,094 687,783 690,465 2,682Charges for service 414,300 218,200 222,896 4,696Other revenues 40,000 30,000 43,225 13,225
Total Revenues 11,798,744 11,487,180 11,711,887 224,707
EXPENDITURES
Current operations:General Government:
City council 91,521 81,521 67,795 13,726City manager 225,952 215,952 202,828 13,124City clerk 101,831 99,831 107,229 (7,398)Administrative services 520,815 546,800 554,061 (7,261)City attorney 230,000 320,000 382,990 (62,990)Information technology 165,500 201,000 214,712 (13,712)Insurance programs 595,925 523,624 665,115 (141,491)Support for community programs 143,005 65,000 81,121 (16,121)
Total General Government 2,074,549 2,053,728 2,275,851 (222,123)
Public Safety:Police 4,164,376 4,297,306 4,482,132 (184,826)Fire 2,220,251 2,455,001 2,424,193 30,808
Total Public Safety 6,384,627 6,752,307 6,906,325 (154,018)
Transportation:Administration and engineering 206,080 273,683 317,897 (44,214)Construction and maintenance 599,442 591,823 577,457 14,366Yard and shop 257,405 256,543 263,861 (7,318)Stormwater management 34,500 45,200 33,933 11,267
Total Transportation 1,097,427 1,167,249 1,193,148 (25,899)
Community Development:Economic development 164,880 150,621 157,173 (6,552)Planning 295,034 274,549 339,778 (65,229)Building inspections 200,136 182,800 157,361 25,439Building maintenance 239,100 265,000 301,622 (36,622)
Total Community Development 899,150 872,970 955,934 (82,964)
66
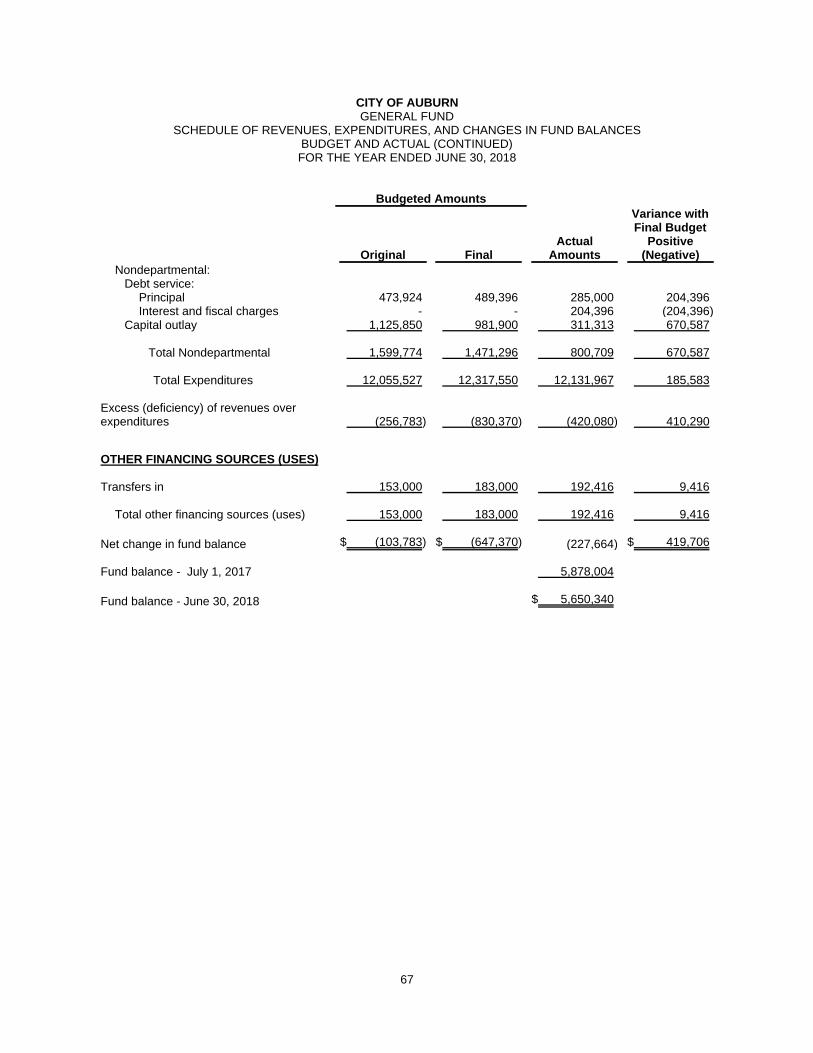
CITY OF AUBURNGENERAL FUND
SCHEDULE OF REVENUES, EXPENDITURES, AND CHANGES IN FUND BALANCESBUDGET AND ACTUAL (CONTINUED)FOR THE YEAR ENDED JUNE 30, 2018
Budgeted Amounts
Original FinalActual
Amounts
Variance withFinal Budget
Positive(Negative)
Nondepartmental:Debt service:
Principal 473,924 489,396 285,000 204,396Interest and fiscal charges - - 204,396 (204,396)
Capital outlay 1,125,850 981,900 311,313 670,587
Total Nondepartmental 1,599,774 1,471,296 800,709 670,587
Total Expenditures 12,055,527 12,317,550 12,131,967 185,583
Excess (deficiency) of revenues overexpenditures (256,783) (830,370) (420,080) 410,290
OTHER FINANCING SOURCES (USES)
Transfers in 153,000 183,000 192,416 9,416
Total other financing sources (uses) 153,000 183,000 192,416 9,416
Net change in fund balance $ (103,783) $ (647,370) (227,664) $ 419,706
Fund balance - July 1, 2017 5,878,004
Fund balance - June 30, 2018 $ 5,650,340
67

CITY OF AUBURNTRANSPORTATION - SPECIAL REVENUE FUND
SCHEDULE OF REVENUES, EXPENDITURES, AND CHANGES IN FUND BALANCESBUDGET AND ACTUAL
FOR THE YEAR ENDED JUNE 30, 2018
Budgeted Amounts
Original FinalActual
Amounts
Variance withFinal Budget
Positive(Negative)
REVENUES
Use of money and property $ - $ (50) $ 34 $ 84Intergovernmental 3,196,757 815,199 351,232 (463,967)
Total Revenues 3,196,757 815,149 351,266 (463,883)
EXPENDITURES
Current operations:Transportation 78,000 67,000 72,915 (5,915)
Capital outlay 4,034,757 1,492,100 646,208 845,892
Total Expenditures 4,112,757 1,559,100 719,123 839,977
Excess (deficiency) of revenues overexpenditures (916,000) (743,951) (367,857) 376,094
OTHER FINANCING SOURCES (USES)
Transfers in (925,000) (836,033) 338,450 1,174,483
Total other financing sources (uses) (925,000) (836,033) 338,450 1,174,483
Net change in fund balance $ (1,841,000) $ (743,951) (29,407) $ 714,544
Fund balance (deficit) - July 1, 2017 (87,104)
Fund balance (deficit) - June 30, 2018 $ (116,511)
68
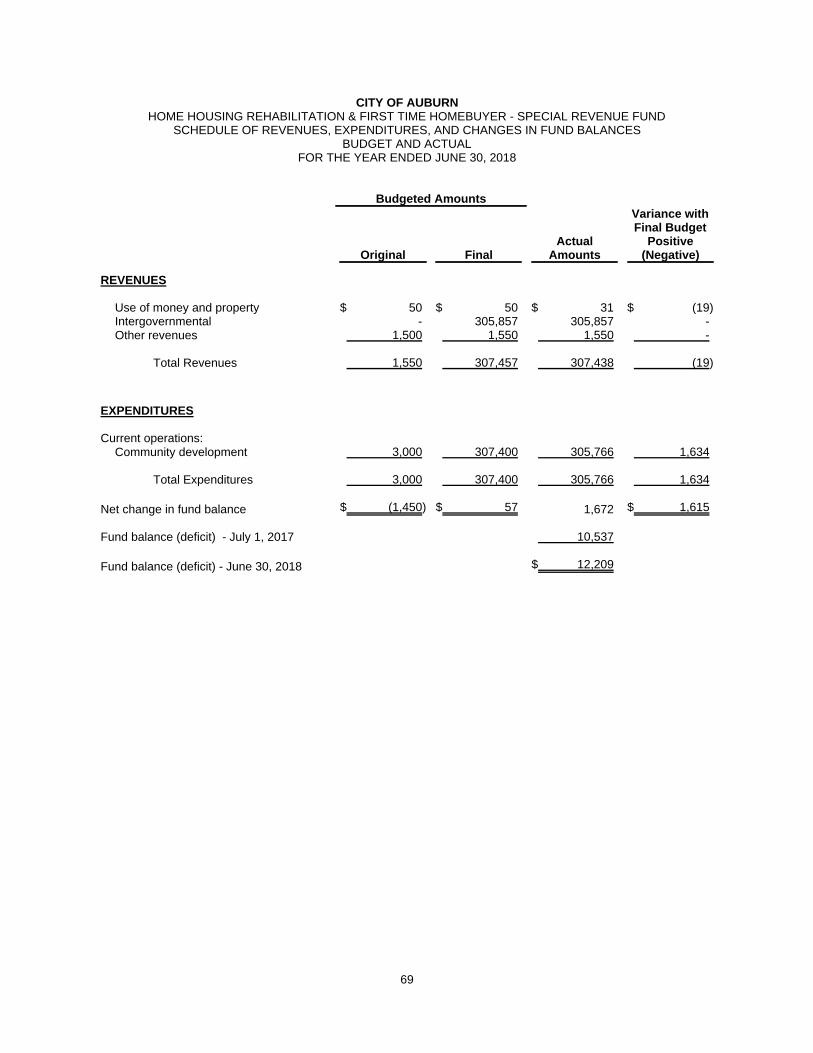
CITY OF AUBURNHOME HOUSING REHABILITATION & FIRST TIME HOMEBUYER - SPECIAL REVENUE FUND
SCHEDULE OF REVENUES, EXPENDITURES, AND CHANGES IN FUND BALANCESBUDGET AND ACTUAL
FOR THE YEAR ENDED JUNE 30, 2018
Budgeted Amounts
Original FinalActual
Amounts
Variance withFinal Budget
Positive(Negative)
REVENUES
Use of money and property $ 50 $ 50 $ 31 $ (19)Intergovernmental - 305,857 305,857 -Other revenues 1,500 1,550 1,550 -
Total Revenues 1,550 307,457 307,438 (19)
EXPENDITURES
Current operations:Community development 3,000 307,400 305,766 1,634
Total Expenditures 3,000 307,400 305,766 1,634
Net change in fund balance $ (1,450) $ 57 1,672 $ 1,615
Fund balance (deficit) - July 1, 2017 10,537
Fund balance (deficit) - June 30, 2018 $ 12,209
69
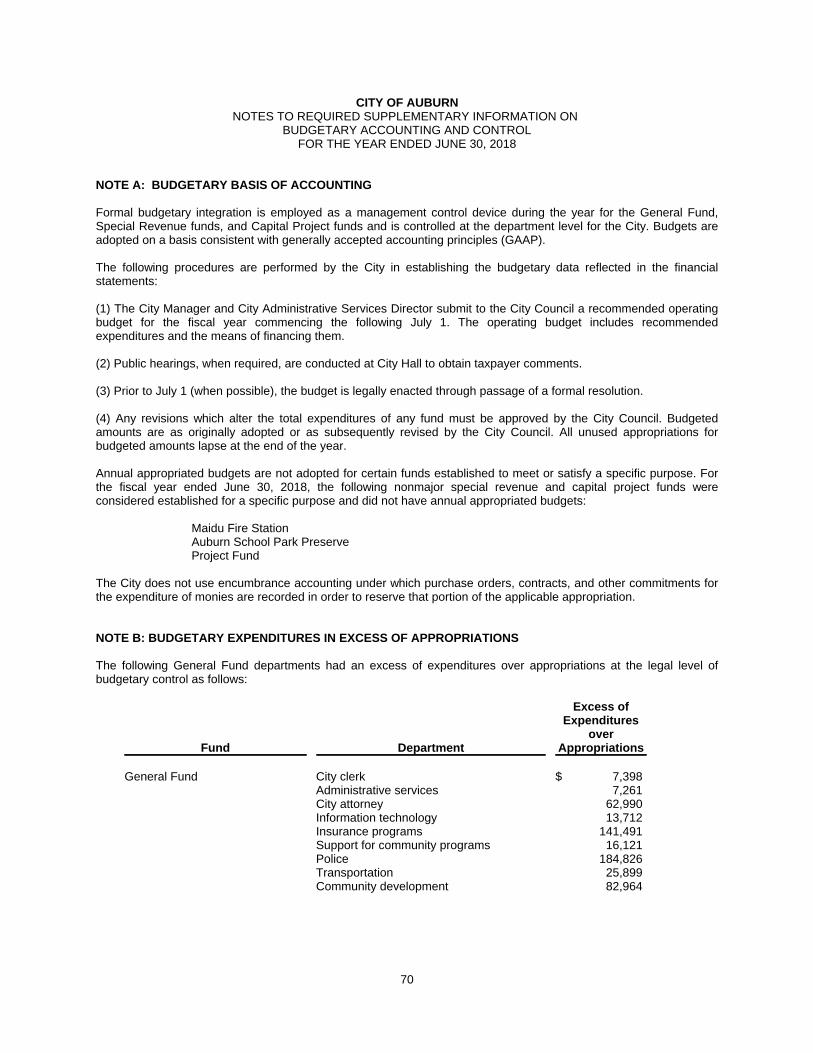
CITY OF AUBURNNOTES TO REQUIRED SUPPLEMENTARY INFORMATION ON
BUDGETARY ACCOUNTING AND CONTROLFOR THE YEAR ENDED JUNE 30, 2018
NOTE A: BUDGETARY BASIS OF ACCOUNTING
Formal budgetary integration is employed as a management control device during the year for the General Fund,Special Revenue funds, and Capital Project funds and is controlled at the department level for the City. Budgets areadopted on a basis consistent with generally accepted accounting principles (GAAP).
The following procedures are performed by the City in establishing the budgetary data reflected in the financialstatements:
(1) The City Manager and City Administrative Services Director submit to the City Council a recommended operatingbudget for the fiscal year commencing the following July 1. The operating budget includes recommendedexpenditures and the means of financing them.
(2) Public hearings, when required, are conducted at City Hall to obtain taxpayer comments.
(3) Prior to July 1 (when possible), the budget is legally enacted through passage of a formal resolution.
(4) Any revisions which alter the total expenditures of any fund must be approved by the City Council. Budgetedamounts are as originally adopted or as subsequently revised by the City Council. All unused appropriations forbudgeted amounts lapse at the end of the year.
Annual appropriated budgets are not adopted for certain funds established to meet or satisfy a specific purpose. Forthe fiscal year ended June 30, 2018, the following nonmajor special revenue and capital project funds wereconsidered established for a specific purpose and did not have annual appropriated budgets:
Maidu Fire StationAuburn School Park PreserveProject Fund
The City does not use encumbrance accounting under which purchase orders, contracts, and other commitments forthe expenditure of monies are recorded in order to reserve that portion of the applicable appropriation.
NOTE B: BUDGETARY EXPENDITURES IN EXCESS OF APPROPRIATIONS
The following General Fund departments had an excess of expenditures over appropriations at the legal level ofbudgetary control as follows:
Fund Department
Excess ofExpenditures
overAppropriations
General Fund City clerk $ 7,398Administrative services 7,261City attorney 62,990Information technology 13,712Insurance programs 141,491Support for community programs 16,121Police 184,826Transportation 25,899Community development 82,964
70
COMBINING AND INDIVIDUAL FUND FINANCIAL STATEMENTSAND OTHER SUPPLEMENTARY INFORMATION

NON-MAJOR GOVERNMENTAL FUNDS
The following funds are reported in total on the Governmental Fund Financial Statements under the column OtherGovernmental Funds.
SPECIAL REVENUE FUNDS
State Gas Tax Fund
The State Gas Tax fund accounts for gas tax revenue allocations from the State. Funds received are restricted toexpenditures for street maintenance, traffic safety, and construction.
Transit Fund
The Transit fund is used to account for all revenues and expenditures necessary to provide public transit services andto construct and maintain transit related facilities and infrastructure.
Property Seizures Fund
The Property Seizures fund accounts for cash and assets seized as a result of law enforcement activities. Generally,such funds are held on deposit until expiration of the required holding period and/or funds are provided to appropriateparties.
Maidu Fire Station Fund
The Maidu Fire Station fund accounts for development impact fees received for the maintenance and upkeep of theMaidu Fire Station. The Fire Department periodically appropriates these funds towards upkeep of the station and forthe purchase of new equipment.
Small Business Loans (Community Development Block Grant) Fund
The Small Business Loans (Community Development Block Grant) fund is used to account for monies received fromthe State and Federal governments and loaned by the City to individuals and businesses to encourage small businessgrowth. Funds, when repaid, are provided to new businesses.
Solid Waste Management Fund
The Solid Waste Management fund is used to account for recycling programs funded by State grants and programexpenditures related to the City’s closed landfill located at the Auburn Municipal Airport.
State Law Enforcement Grant Fund
The State Law Enforcement Personnel Grant fund accounts for grant revenues received from the State which mustbe wholly spent for Law Enforcement personnel. These funds reimburse the General fund for approximately 2.0 FTEPolice Officers.
Facilities and Equipment Fund
The Facilities and Equipment Plan fund accounts for revenues received through mitigation fees assessed onconstruction of new residential units and renovation of commercial and industrial spaces. Revenues received areused to fund recurring capital outlay as it relates to the purchase of equipment for citywide departments.
Miscellaneous Grants Fund
The Miscellaneous Grants fund accounts for grant revenues received for public safety (i.e. FEMA/Law Enforcement)activities. Generally, these funds must be used for specific law enforcement and fire activities.
72

NON-MAJOR GOVERNMENTAL FUNDS
CAPITAL PROJECTS FUNDS
Auburn School Park Preserve Fund
The Auburn School Park Preserve fund (ASPP) is used to account for the capital costs of restoring a park using avariety of funding sources. In FY 2005-06, a $1.5 million “loan” was provided to the ASPP fund from the City’sGeneral fund as an advance payment to the Army Corp of Engineers for related project costs (the Army Corp ofEngineers managed the construction of the Park).
Project Fund
The Project fund accounts for traffic mitigation fees collected for numerous project areas citywide. Funds collected foreach project area may only be used for traffic mitigation projects within boundaries defined by each fee arearesolution.
73
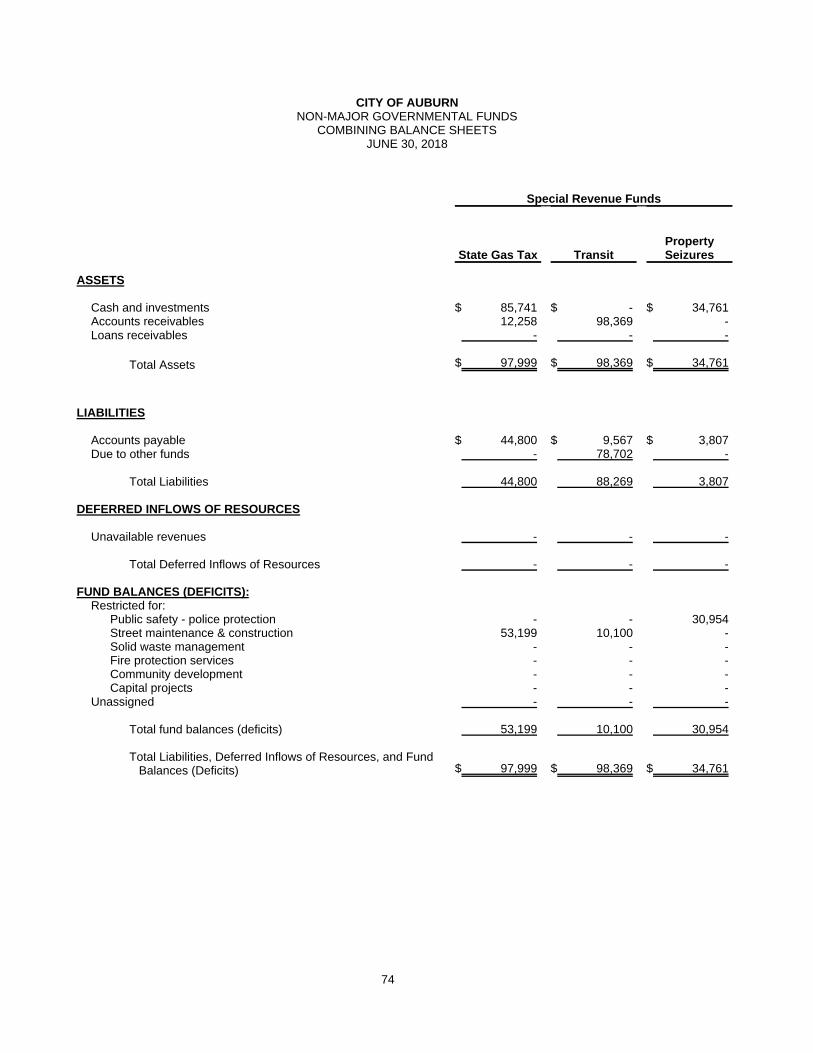
CITY OF AUBURNNON-MAJOR GOVERNMENTAL FUNDS
COMBINING BALANCE SHEETSJUNE 30, 2018
Special Revenue Funds
State Gas Tax TransitPropertySeizures
ASSETS
Cash and investments $ 85,741 $ - $ 34,761Accounts receivables 12,258 98,369 -Loans receivables - - -
Total Assets $ 97,999 $ 98,369 $ 34,761
LIABILITIES
Accounts payable $ 44,800 $ 9,567 $ 3,807Due to other funds - 78,702 -
Total Liabilities 44,800 88,269 3,807
DEFERRED INFLOWS OF RESOURCES
Unavailable revenues - - -
Total Deferred Inflows of Resources - - -
FUND BALANCES (DEFICITS):Restricted for:
Public safety - police protection - - 30,954Street maintenance & construction 53,199 10,100 -Solid waste management - - -Fire protection services - - -Community development - - -Capital projects - - -
Unassigned - - -
Total fund balances (deficits) 53,199 10,100 30,954
Total Liabilities, Deferred Inflows of Resources, and FundBalances (Deficits) $ 97,999 $ 98,369 $ 34,761
74
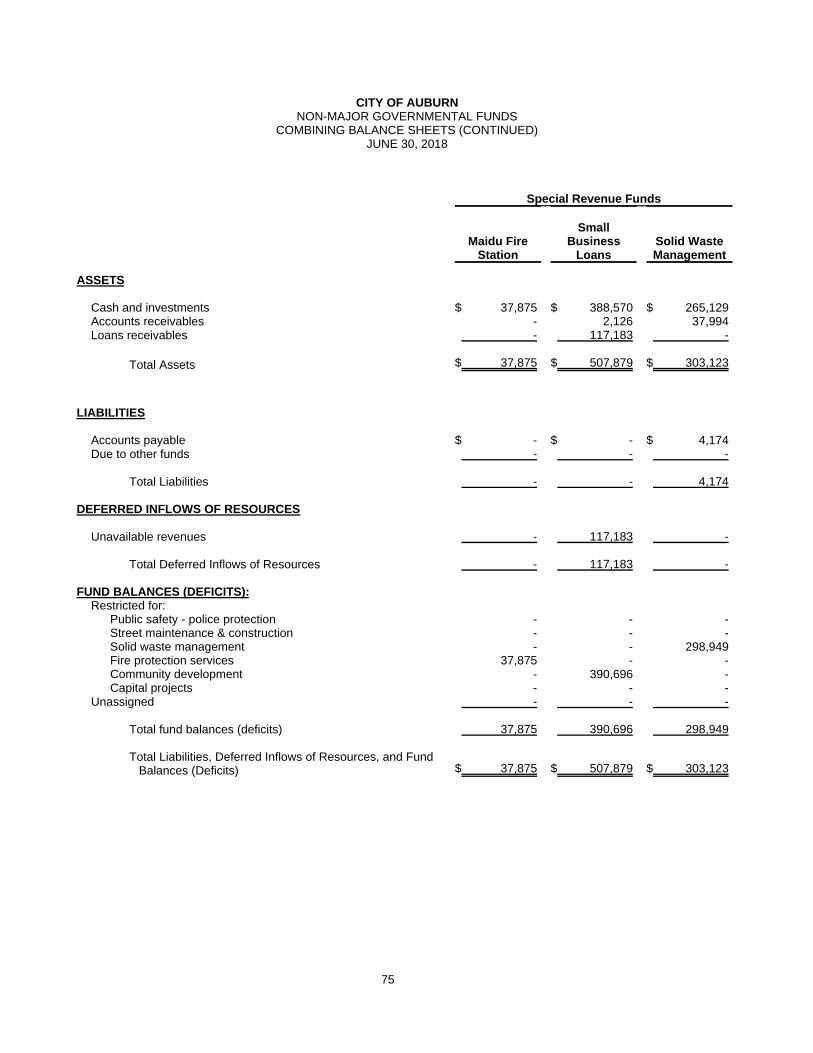
CITY OF AUBURNNON-MAJOR GOVERNMENTAL FUNDS
COMBINING BALANCE SHEETS (CONTINUED)JUNE 30, 2018
Special Revenue Funds
Maidu FireStation
SmallBusiness
LoansSolid WasteManagement
ASSETS
Cash and investments $ 37,875 $ 388,570 $ 265,129Accounts receivables - 2,126 37,994Loans receivables - 117,183 -
Total Assets $ 37,875 $ 507,879 $ 303,123
LIABILITIES
Accounts payable $ - $ - $ 4,174Due to other funds - - -
Total Liabilities - - 4,174
DEFERRED INFLOWS OF RESOURCES
Unavailable revenues - 117,183 -
Total Deferred Inflows of Resources - 117,183 -
FUND BALANCES (DEFICITS):Restricted for:
Public safety - police protection - - -Street maintenance & construction - - -Solid waste management - - 298,949Fire protection services 37,875 - -Community development - 390,696 -Capital projects - - -
Unassigned - - -
Total fund balances (deficits) 37,875 390,696 298,949
Total Liabilities, Deferred Inflows of Resources, and FundBalances (Deficits) $ 37,875 $ 507,879 $ 303,123
75

CITY OF AUBURNNON-MAJOR GOVERNMENTAL FUNDS
COMBINING BALANCE SHEETS (CONTINUED)JUNE 30, 2018
Special Revenue Funds
State LawEnforcement
GrantFacilities and
EquipmentMiscellaneous
Grants
ASSETS
Cash and investments $ - $ 402,207 $ 199,883Accounts receivables - - -Loans receivables - - -
Total Assets $ - $ 402,207 $ 199,883
LIABILITIES
Accounts payable $ - $ - $ -Due to other funds - - -
Total Liabilities - - -
DEFERRED INFLOWS OF RESOURCES
Unavailable revenues - - -
Total Deferred Inflows of Resources - - -
FUND BALANCES (DEFICITS):Restricted for:
Public safety - police protection - - -Street maintenance & construction - - -Solid waste management - - -Fire protection services - - 199,883Community development - - -Capital projects - 402,207 -
Unassigned - - -
Total fund balances (deficits) - 402,207 199,883
Total Liabilities, Deferred Inflows of Resources, and FundBalances (Deficits) $ - $ 402,207 $ 199,883
76

CITY OF AUBURNNON-MAJOR GOVERNMENTAL FUNDS
COMBINING BALANCE SHEETS (CONTINUED)JUNE 30, 2018
Capital Projects Funds
Auburn SchoolPark Preserve Project Fund
TotalNon-major
GovernmentalFunds
ASSETS
Cash and investments $ - $ 703,663 $ 2,117,829Accounts receivables - - 150,747Loans receivables - - 117,183
Total Assets $ - $ 703,663 $ 2,385,759
LIABILITIES
Accounts payable $ - $ 9,345 $ 71,693Due to other funds 202,193 - 280,895
Total Liabilities 202,193 9,345 352,588
DEFERRED INFLOWS OF RESOURCES
Unavailable revenues - - 117,183
Total Deferred Inflows of Resources - - 117,183
FUND BALANCES (DEFICITS):Restricted for:
Public safety - police protection - - 30,954Street maintenance & construction - - 63,299Solid waste management - - 298,949Fire protection services - - 237,758Community development - - 390,696Capital projects - 694,318 1,096,525
Unassigned (202,193) - (202,193)
Total fund balances (deficits) (202,193) 694,318 1,915,988
Total Liabilities, Deferred Inflows of Resources, and FundBalances (Deficits) $ - $ 703,663 $ 2,385,759
77
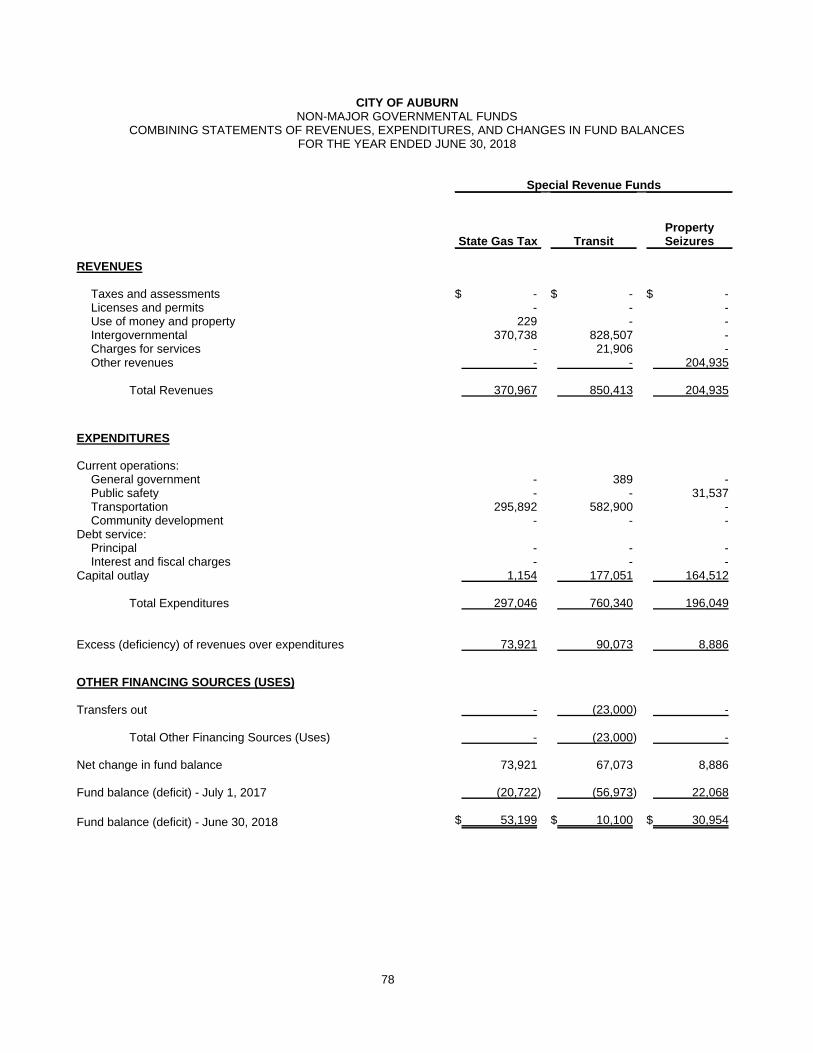
CITY OF AUBURNNON-MAJOR GOVERNMENTAL FUNDS
COMBINING STATEMENTS OF REVENUES, EXPENDITURES, AND CHANGES IN FUND BALANCESFOR THE YEAR ENDED JUNE 30, 2018
Special Revenue Funds
State Gas Tax TransitPropertySeizures
REVENUES
Taxes and assessments $ - $ - $ -Licenses and permits - - -Use of money and property 229 - -Intergovernmental 370,738 828,507 -Charges for services - 21,906 -Other revenues - - 204,935
Total Revenues 370,967 850,413 204,935
EXPENDITURES
Current operations:General government - 389 -Public safety - - 31,537Transportation 295,892 582,900 -Community development - - -
Debt service:Principal - - -Interest and fiscal charges - - -
Capital outlay 1,154 177,051 164,512
Total Expenditures 297,046 760,340 196,049
Excess (deficiency) of revenues over expenditures 73,921 90,073 8,886
OTHER FINANCING SOURCES (USES)
Transfers out - (23,000) -
Total Other Financing Sources (Uses) - (23,000) -
Net change in fund balance 73,921 67,073 8,886
Fund balance (deficit) - July 1, 2017 (20,722) (56,973) 22,068
Fund balance (deficit) - June 30, 2018 $ 53,199 $ 10,100 $ 30,954
78

CITY OF AUBURNNON-MAJOR GOVERNMENTAL FUNDS
COMBINING STATEMENTS OF REVENUES, EXPENDITURES, AND CHANGES IN FUND BALANCES (CONTINUED)FOR THE YEAR ENDED JUNE 30, 2018
Special Revenue Funds
Maidu FireStation
SmallBusiness
LoansSolid WasteManagement
REVENUES
Taxes and assessments $ - $ - $ 154,665Licenses and permits - - -Use of money and property - 114 1,753Intergovernmental - - -Charges for services - - -Other revenues - 25,514 -
Total Revenues - 25,628 156,418
EXPENDITURES
Current operations:General government - - -Public safety - - 188,759Transportation - - -Community development - 1,231 -
Debt service:Principal - - -Interest and fiscal charges - - -
Capital outlay - - -
Total Expenditures - 1,231 188,759
Excess (deficiency) of revenues over expenditures - 24,397 (32,341)
OTHER FINANCING SOURCES (USES)
Transfers out - - -
Total Other Financing Sources (Uses) - - -
Net change in fund balance - 24,397 (32,341)
Fund balance (deficit) - July 1, 2017 37,875 366,299 331,290
Fund balance (deficit) - June 30, 2018 $ 37,875 $ 390,696 $ 298,949
79

CITY OF AUBURNNON-MAJOR GOVERNMENTAL FUNDS
COMBINING STATEMENTS OF REVENUES, EXPENDITURES, AND CHANGES IN FUND BALANCES (CONTINUED)FOR THE YEAR ENDED JUNE 30, 2018
Special Revenue Funds
State LawEnforcement
GrantFacilities and
EquipmentMiscellaneous
Grants
REVENUES
Taxes and assessments $ - $ - $ -Licenses and permits - 149,200 -Use of money and property - 3,296 -Intergovernmental 139,416 - -Charges for services - - 60,487Other revenues - 11,812 3,247
Total Revenues 139,416 164,308 63,734
EXPENDITURES
Current operations:General government - 12,587 -Public safety - - 684Transportation - - 3,590Community development - - -
Debt service:Principal - - 92,477Interest and fiscal charges - - 1,609
Capital outlay - 52,754 -
Total Expenditures - 65,341 98,360
Excess (deficiency) of revenues over expenditures 139,416 98,967 (34,626)
OTHER FINANCING SOURCES (USES)
Transfers out (139,416) - -
Total Other Financing Sources (Uses) (139,416) - -
Net change in fund balance - 98,967 (34,626)
Fund balance (deficit) - July 1, 2017 - 303,240 234,509
Fund balance (deficit) - June 30, 2018 $ - $ 402,207 $ 199,883
80
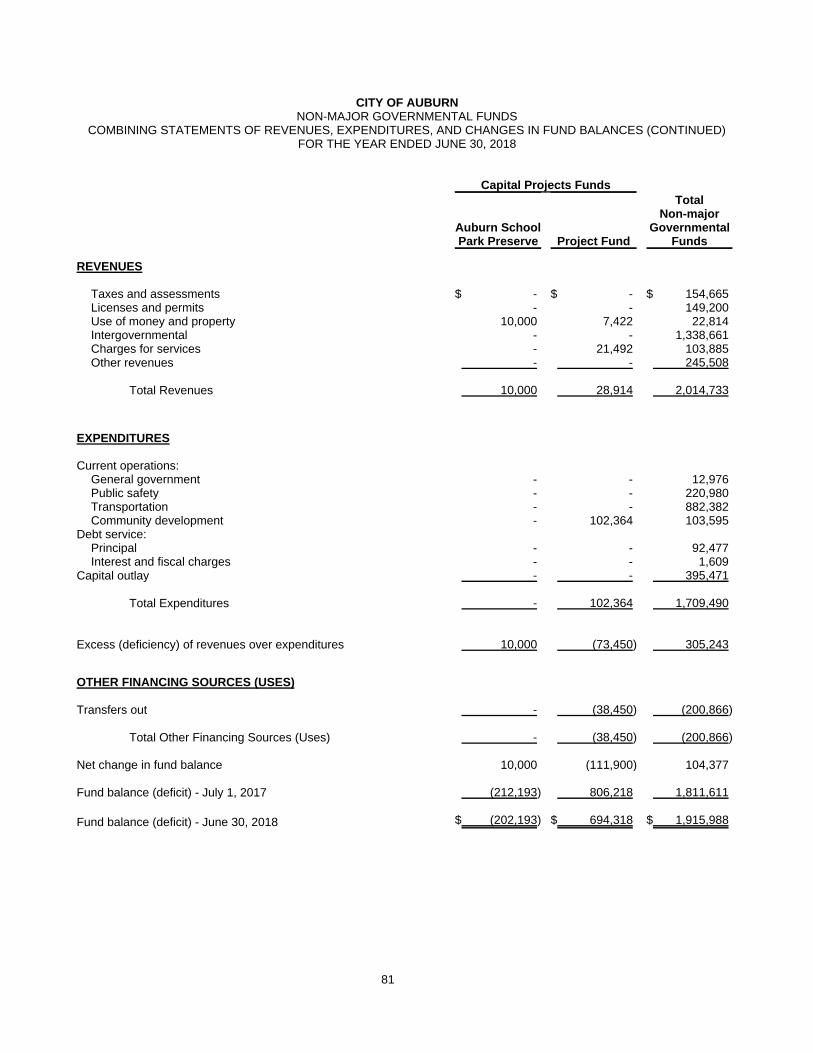
CITY OF AUBURNNON-MAJOR GOVERNMENTAL FUNDS
COMBINING STATEMENTS OF REVENUES, EXPENDITURES, AND CHANGES IN FUND BALANCES (CONTINUED)FOR THE YEAR ENDED JUNE 30, 2018
Capital Projects Funds
Auburn SchoolPark Preserve Project Fund
TotalNon-major
GovernmentalFunds
REVENUES
Taxes and assessments $ - $ - $ 154,665Licenses and permits - - 149,200Use of money and property 10,000 7,422 22,814Intergovernmental - - 1,338,661Charges for services - 21,492 103,885Other revenues - - 245,508
Total Revenues 10,000 28,914 2,014,733
EXPENDITURES
Current operations:General government - - 12,976Public safety - - 220,980Transportation - - 882,382Community development - 102,364 103,595
Debt service:Principal - - 92,477Interest and fiscal charges - - 1,609
Capital outlay - - 395,471
Total Expenditures - 102,364 1,709,490
Excess (deficiency) of revenues over expenditures 10,000 (73,450) 305,243
OTHER FINANCING SOURCES (USES)
Transfers out - (38,450) (200,866)
Total Other Financing Sources (Uses) - (38,450) (200,866)
Net change in fund balance 10,000 (111,900) 104,377
Fund balance (deficit) - July 1, 2017 (212,193) 806,218 1,811,611
Fund balance (deficit) - June 30, 2018 $ (202,193) $ 694,318 $ 1,915,988
81

CITY OF AUBURNSTATE GAS TAX - NONMAJOR SPECIAL REVENUE FUND
SCHEDULE OF REVENUES, EXPENDITURES, AND CHANGES IN FUND BALANCESBUDGET AND ACTUAL
FOR THE YEAR ENDED JUNE 30, 2018
Budgeted Amounts
Original FinalActual
Amounts
Variance withFinal Budget
Positive(Negative)
REVENUES
Use of money and property $ 100 $ - $ 229 $ 229Intergovernmental 312,393 400,454 370,738 (29,716)Other revenues 95,596 - - -
Total Revenues 408,089 400,454 370,967 (29,487)
EXPENDITURES
Current operations:Transportation 358,089 277,020 295,892 (18,872)
Capital outlay 50,000 97,000 1,154 95,846
Total Expenditures 408,089 374,020 297,046 76,974
Net change in fund balance $ - $ 26,434 73,921 $ 47,487
Fund balance (deficit) - July 1, 2017 (20,722)
Fund balance (deficit) - June 30, 2018 $ 53,199
82
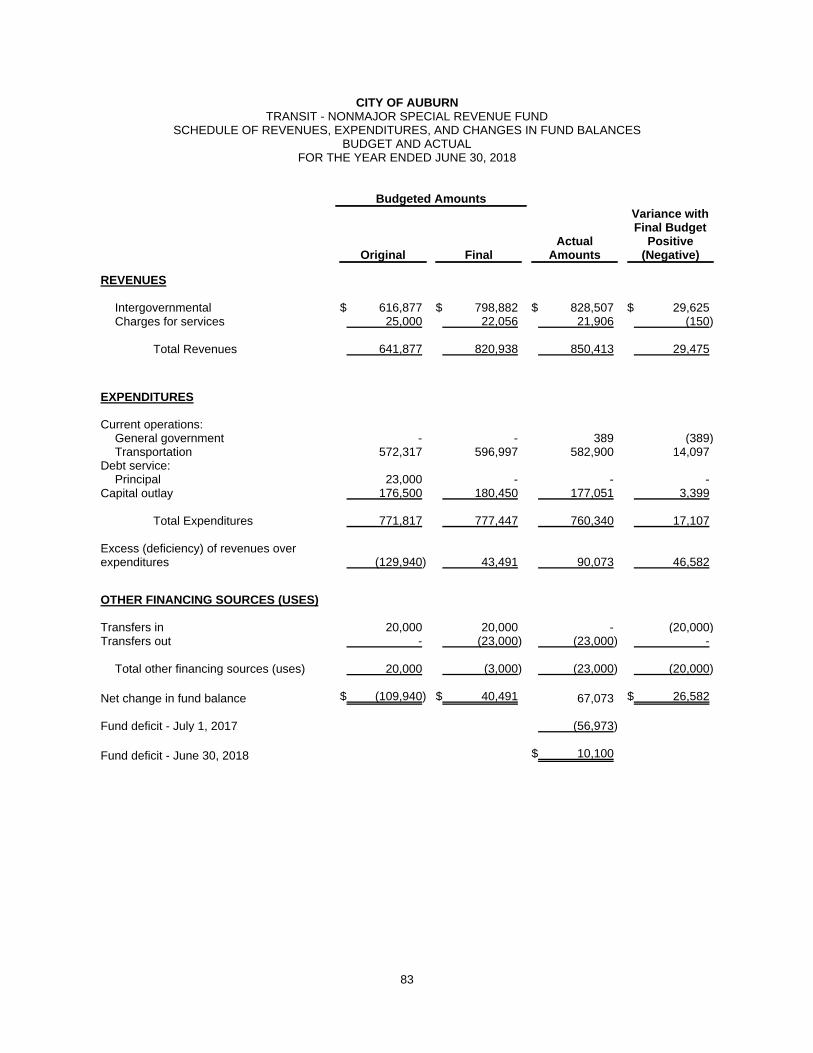
CITY OF AUBURNTRANSIT - NONMAJOR SPECIAL REVENUE FUND
SCHEDULE OF REVENUES, EXPENDITURES, AND CHANGES IN FUND BALANCESBUDGET AND ACTUAL
FOR THE YEAR ENDED JUNE 30, 2018
Budgeted Amounts
Original FinalActual
Amounts
Variance withFinal Budget
Positive(Negative)
REVENUES
Intergovernmental $ 616,877 $ 798,882 $ 828,507 $ 29,625Charges for services 25,000 22,056 21,906 (150)
Total Revenues 641,877 820,938 850,413 29,475
EXPENDITURES
Current operations:General government - - 389 (389)Transportation 572,317 596,997 582,900 14,097
Debt service:Principal 23,000 - - -
Capital outlay 176,500 180,450 177,051 3,399
Total Expenditures 771,817 777,447 760,340 17,107
Excess (deficiency) of revenues overexpenditures (129,940) 43,491 90,073 46,582
OTHER FINANCING SOURCES (USES)
Transfers in 20,000 20,000 - (20,000)Transfers out - (23,000) (23,000) -
Total other financing sources (uses) 20,000 (3,000) (23,000) (20,000)
Net change in fund balance $ (109,940) $ 40,491 67,073 $ 26,582
Fund deficit - July 1, 2017 (56,973)
Fund deficit - June 30, 2018 $ 10,100
83

CITY OF AUBURNPROPERTY SEIZURES - NONMAJOR SPECIAL REVENUE FUND
SCHEDULE OF REVENUES, EXPENDITURES, AND CHANGES IN FUND BALANCESBUDGET AND ACTUAL
FOR THE YEAR ENDED JUNE 30, 2018
Budgeted Amounts
Original FinalActual
Amounts
Variance withFinal Budget
Positive(Negative)
REVENUES
Other revenues $ 50,000 $ 190,000 $ 204,935 $ 14,935
Total Revenues 50,000 190,000 204,935 14,935
EXPENDITURES
Current operations:Public safety - 28,000 31,537 (3,537)
Capital outlay 19,404 124,100 164,512 (40,412)
Total Expenditures 19,404 152,100 196,049 (43,949)
Net change in fund balance $ 30,596 $ 37,900 8,886 $ (29,014)
Fund balance - July 1, 2017 22,068
Fund balance - June 30, 2018 $ 30,954
84

CITY OF AUBURNSMALL BUSINESS LOANS - NONMAJOR SPECIAL REVENUE FUND
SCHEDULE OF REVENUES, EXPENDITURES, AND CHANGES IN FUND BALANCESBUDGET AND ACTUAL
FOR THE YEAR ENDED JUNE 30, 2018
Budgeted Amounts
Original FinalActual
Amounts
Variance withFinal Budget
Positive(Negative)
REVENUES
Use of money and property $ 1,000 $ 1,900 $ 114 $ (1,786)Other revenues 25,600 25,512 25,514 2
Total Revenues 26,600 27,412 25,628 (1,784)
EXPENDITURES
Current operations:Community development 16,483 (6,600) 1,231 (7,831)
Total Expenditures 16,483 (6,600) 1,231 (7,831)
Net change in fund balance $ 10,117 $ 34,012 24,397 $ (9,615)
Fund balance - July 1, 2017 366,299
Fund balance - June 30, 2018 $ 390,696
85

CITY OF AUBURNSOLID WASTE MANAGEMENT - NONMAJOR SPECIAL REVENUE FUND
SCHEDULE OF REVENUES, EXPENDITURES, AND CHANGES IN FUND BALANCESBUDGET AND ACTUAL
FOR THE YEAR ENDED JUNE 30, 2018
Budgeted Amounts
Original FinalActual
Amounts
Variance withFinal Budget
Positive(Negative)
REVENUES
Taxes and assessments $ 146,880 $ 150,000 $ 154,665 $ 4,665Use of money and property 2,000 2,000 1,753 (247)Intergovernmental 5,000 5,000 - (5,000)
Total Revenues 153,880 157,000 156,418 (582)
EXPENDITURES
Current operations:Public safety 245,500 260,291 188,759 71,532
Total Expenditures 245,500 260,291 188,759 71,532
Net change in fund balance $ (91,620) $ (103,291) (32,341) $ 70,950
Fund balance - July 1, 2017 331,290
Fund balance - June 30, 2018 $ 298,949
86
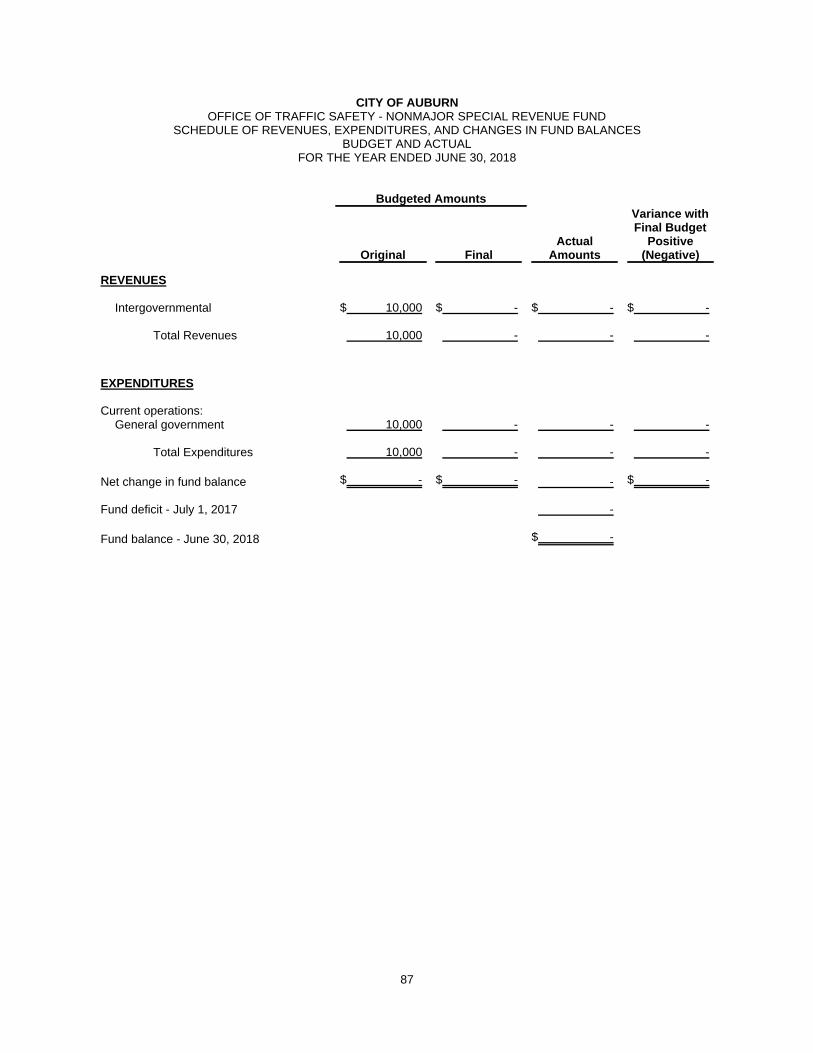
CITY OF AUBURNOFFICE OF TRAFFIC SAFETY - NONMAJOR SPECIAL REVENUE FUND
SCHEDULE OF REVENUES, EXPENDITURES, AND CHANGES IN FUND BALANCESBUDGET AND ACTUAL
FOR THE YEAR ENDED JUNE 30, 2018
Budgeted Amounts
Original FinalActual
Amounts
Variance withFinal Budget
Positive(Negative)
REVENUES
Intergovernmental $ 10,000 $ - $ - $ -
Total Revenues 10,000 - - -
EXPENDITURES
Current operations:General government 10,000 - - -
Total Expenditures 10,000 - - -
Net change in fund balance $ - $ - - $ -
Fund deficit - July 1, 2017 -
Fund balance - June 30, 2018 $ -
87

CITY OF AUBURNSTATE LAW ENFORCEMENT GRANT - NONMAJOR SPECIAL REVENUE FUND
SCHEDULE OF REVENUES, EXPENDITURES, AND CHANGES IN FUND BALANCESBUDGET AND ACTUAL
FOR THE YEAR ENDED JUNE 30, 2018
Budgeted Amounts
Original FinalActual
Amounts
Variance withFinal Budget
Positive(Negative)
REVENUES
Intergovernmental $ 100,000 $ 139,416 $ 139,416 $ -
Total Revenues 100,000 139,416 139,416 -
OTHER FINANCING SOURCES (USES)
Transfers out (100,000) (79,416) (139,416) (60,000)
Total Other Financing Sources (Uses) (100,000) (79,416) (139,416) (60,000)
Net change in fund balance $ - $ 60,000 - $ (60,000)
Fund balance - July 1, 2017 -
Fund balance - June 30, 2018 $ -
88
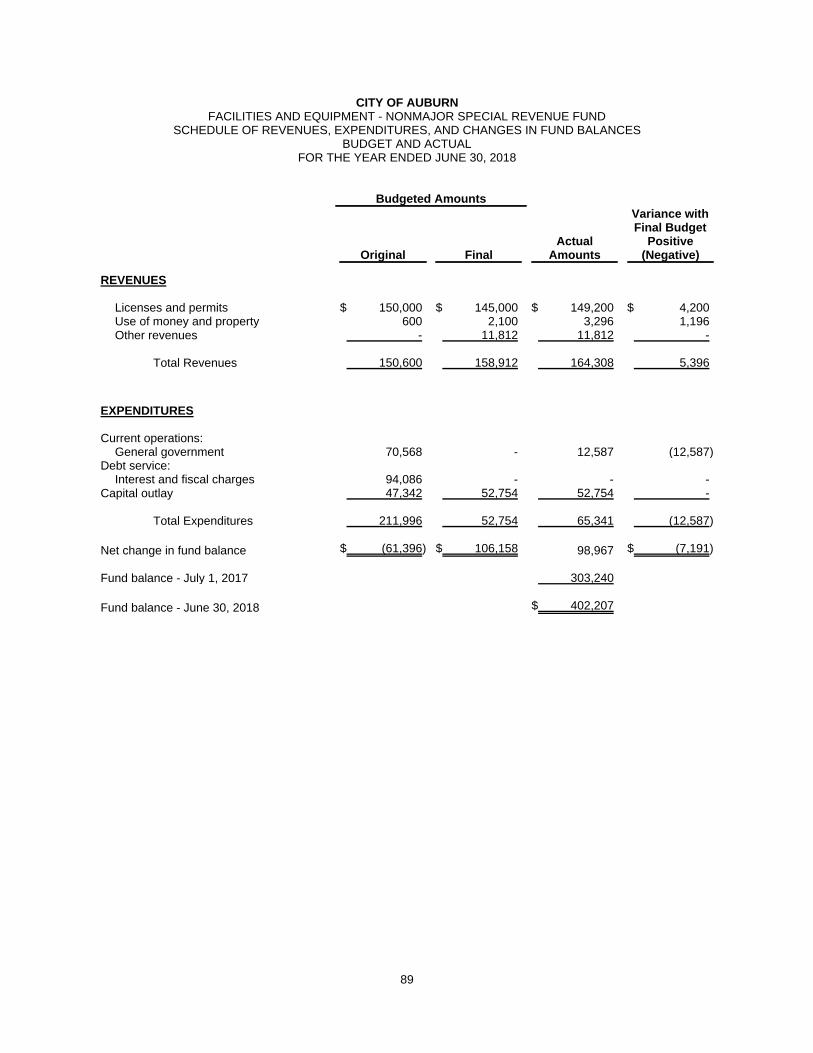
CITY OF AUBURNFACILITIES AND EQUIPMENT - NONMAJOR SPECIAL REVENUE FUND
SCHEDULE OF REVENUES, EXPENDITURES, AND CHANGES IN FUND BALANCESBUDGET AND ACTUAL
FOR THE YEAR ENDED JUNE 30, 2018
Budgeted Amounts
Original FinalActual
Amounts
Variance withFinal Budget
Positive(Negative)
REVENUES
Licenses and permits $ 150,000 $ 145,000 $ 149,200 $ 4,200Use of money and property 600 2,100 3,296 1,196Other revenues - 11,812 11,812 -
Total Revenues 150,600 158,912 164,308 5,396
EXPENDITURES
Current operations:General government 70,568 - 12,587 (12,587)
Debt service:Interest and fiscal charges 94,086 - - -
Capital outlay 47,342 52,754 52,754 -
Total Expenditures 211,996 52,754 65,341 (12,587)
Net change in fund balance $ (61,396) $ 106,158 98,967 $ (7,191)
Fund balance - July 1, 2017 303,240
Fund balance - June 30, 2018 $ 402,207
89

CITY OF AUBURNMISCELLANEOUS GRANTS - NONMAJOR SPECIAL REVENUE FUND
SCHEDULE OF REVENUES, EXPENDITURES, AND CHANGES IN FUND BALANCESBUDGET AND ACTUAL
FOR THE YEAR ENDED JUNE 30, 2018
Budgeted Amounts
Original FinalActual
Amounts
Variance withFinal Budget
Positive(Negative)
REVENUES
Charges for service $ 20,000 $ 60,487 $ 60,487 $ -Other revenues - 3,247 3,247 -
Total Revenues 20,000 63,734 63,734 -
EXPENDITURES
Current operations:Public safety 85,000 - 684 (684)Transportation - 5,000 3,590 1,410
Debt serviceInterest and fiscal charges - 94,086 92,477 1,609
Capital outlay - - 1,609 (1,609)
Total Expenditures 85,000 99,086 98,360 726
Net change in fund balance $ (65,000) $ (35,352) (34,626) $ 726
Fund balance - July 1, 2017 234,509
Fund balance - June 30, 2018 $ 199,883
90

FIDUCIARY FUNDSPRIVATE PURPOSE TRUST FUNDS
The Fiduciary Funds are used to report assets held in a trustee or agency capacity for others and therefore cannot beused to support the government’s own programs.
Private Purpose Trust Funds
These funds are used to report other trust arrangements under which principal and income benefit individuals, privateorganizations, or other governments. The private purpose trust funds maintained by the City include the following:
Merchant’s Council
This fund is used to report the activity of the Merchant’s Council nonprofit organization.
Historic Auburn
This fund is used to report the activity of the Historic Auburn nonprofit organization.
Signature Theatre Sewer District
This fund is used to report the activity of the Signature Theatre Sewer District.
Southwest Specific Plan
The fund is used to report the activity of the Southwest Specific Plan.
Successor Agency to the Auburn Urban Development Authority
The fund is used to report the dissolution of the Auburn Urban Development Authority.
91
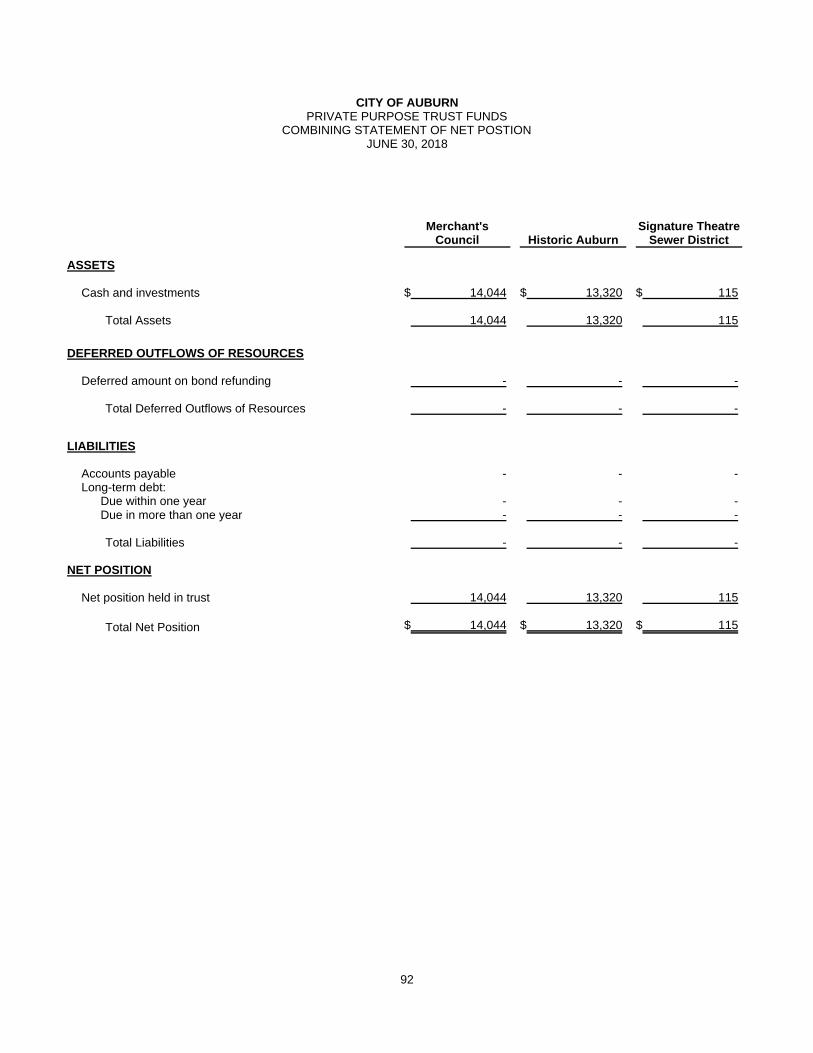
CITY OF AUBURNPRIVATE PURPOSE TRUST FUNDS
COMBINING STATEMENT OF NET POSTIONJUNE 30, 2018
Merchant'sCouncil Historic Auburn
Signature TheatreSewer District
ASSETS
Cash and investments $ 14,044 $ 13,320 $ 115
Total Assets 14,044 13,320 115
DEFERRED OUTFLOWS OF RESOURCES
Deferred amount on bond refunding - - -
Total Deferred Outflows of Resources - - -
LIABILITIES
Accounts payable - - -Long-term debt:
Due within one year - - -Due in more than one year - - -
Total Liabilities - - -
NET POSITION
Net position held in trust 14,044 13,320 115
Total Net Position $ 14,044 $ 13,320 $ 115
92

CITY OF AUBURNPRIVATE PURPOSE TRUST FUNDS
COMBINING STATEMENT OF NET POSTION (CONTINUED)JUNE 30, 2018
SouthwestSpecific Plan
Successor Agencyto the Auburn Urban
DevelopmentAuthority
TotalPrivate Purpose
Trust Funds
ASSETS
Cash and investments $ 6,698 $ 200,711 $ 234,888
Total Assets 6,698 200,711 234,888
DEFERRED OUTFLOWS OF RESOURCES
Deferred amount on bond refunding - 595,189 595,189
Total Deferred Outflows of Resources - 595,189 595,189
LIABILITIES
Accounts payable - 1,250 1,250Long-term debt:
Due within one year - 145,239 145,239Due in more than one year - 4,099,527 4,099,527
Total Liabilities - 4,246,016 4,246,016
NET POSITION
Net position held in trust 6,698 (3,450,116) (3,415,939)
Total Net Position $ 6,698 $ (3,450,116) $ (3,415,939)
93

CITY OF AUBURNPRIVATE PURPOSE TRUST FUNDS
COMBINING STATEMENT OF CHANGES IN NET POSITIONJUNE 30, 2018
Merchant'sCouncil Historic Auburn
Signature TheatreSewer District
REVENUES
Property taxes $ - $ - $ -Interest income - - -Other revenues 53,328 26,545 -
Total Revenues 53,328 26,545 -
EXPENDITURES
Distributions to participants 40,084 13,725 -Program expenses for former redevelopment agency - - -Amortization - - -
Total Expenditures 40,084 13,725 -
Change in net position 13,244 12,820 -
Net position - July 1, 2017 800 500 115
Net position - June 30, 2018 $ 14,044 $ 13,320 $ 115
94

CITY OF AUBURNPRIVATE PURPOSE TRUST FUNDS
COMBINING STATEMENT OF CHANGES IN NET POSITION (CONTINUED)JUNE 30, 2018
SouthwestSpecific Plan
Successor Agencyto the Auburn Urban
DevelopmentAuthority
TotalPrivate Purpose
Trust Funds
REVENUES
Property taxes $ - $ 314,737 $ 314,737Interest income 64 1,976 2,040Other revenues - - 79,873
Total Revenues 64 316,713 396,650
EXPENDITURES
Distributions to participants 13 - 53,822Program expenses for former redevelopment agency - 206,726 206,726Amortization - 25,546 25,546
Total Expenditures 13 232,272 286,094
Change in net position 51 84,441 110,556
Net position - July 1, 2017 6,647 (3,534,557) (3,526,495)
Net position - June 30, 2018 $ 6,698 $ (3,450,116) $ (3,415,939)
95

FIDUCIARY FUNDSAGENCY FUNDS
Agency Funds
These funds are used to report resources held by the City in a purely custodial capacity. The agency fundsmaintained by the City include the following:
Cable TV Access Fees
This fund collects monies from cable TV access fees and remits them to the Auburn Area Access CommunityTelevision Group.
Fire Safety Council
This fund collects monies from grants received for fire safety purposes and uses them for like purposes.
Recreation Park Development
This fund collects monies for recreation and park development.
Placer County Facilities Fee
This fund collects monies for the Placer County Facilities Fee and remits them to the Placer County FacilitiesDepartment.
Payroll Clearing
This fund collects monies from payroll and remits them to government agencies.
APOA Medical Savings Plan
This fund accounts for the APOA Medical Savings Plan. In compliance with GASB 43, the City established this trust toaccount for resources held in trust for the members of an employee benefit plan.
96

CITY OF AUBURNAGENCY FUNDS
COMBINING STATEMENT OF ASSETS AND LIABILITIESFOR THE YEAR ENDED JUNE 30, 2018
Cable TVAccess Fees
Fire SafetyCouncil
RecreationPark
DevelopmentPlacer CountyFacilities Fee
ASSETS
Cash and investments $ 51,723 $ 53 $ 123,174 $ 70,494Receivables:
Accounts 8,250 - - -
Total Assets $ 59,973 $ 53 $ 123,174 $ 70,494
LIABILITIES
Accounts payable $ 41,470 $ - $ 122,928 $ 35,454Agency obligations 18,503 53 246 35,040
Total Liabilities $ 59,973 $ 53 $ 123,174 $ 70,494
97

CITY OF AUBURNAGENCY FUNDS
COMBINING STATEMENT OF ASSETS AND LIABILITIES (CONTINUED)FOR THE YEAR ENDED JUNE 30, 2018
PayrollClearing
APOA MedicalSavings Plan
Total AgencyFunds
ASSETS
Cash and investments $ (6,160) $ (1,108) $ 238,176Receivables:
Accounts - - 8,250
Total Assets $ (6,160) $ (1,108) $ 246,426
LIABILITIES
Accounts payable $ 8,098 $ - $ 207,950Agency obligations (14,258) (1,108) 38,476
Total Liabilities $ (6,160) $ (1,108) $ 246,426
98
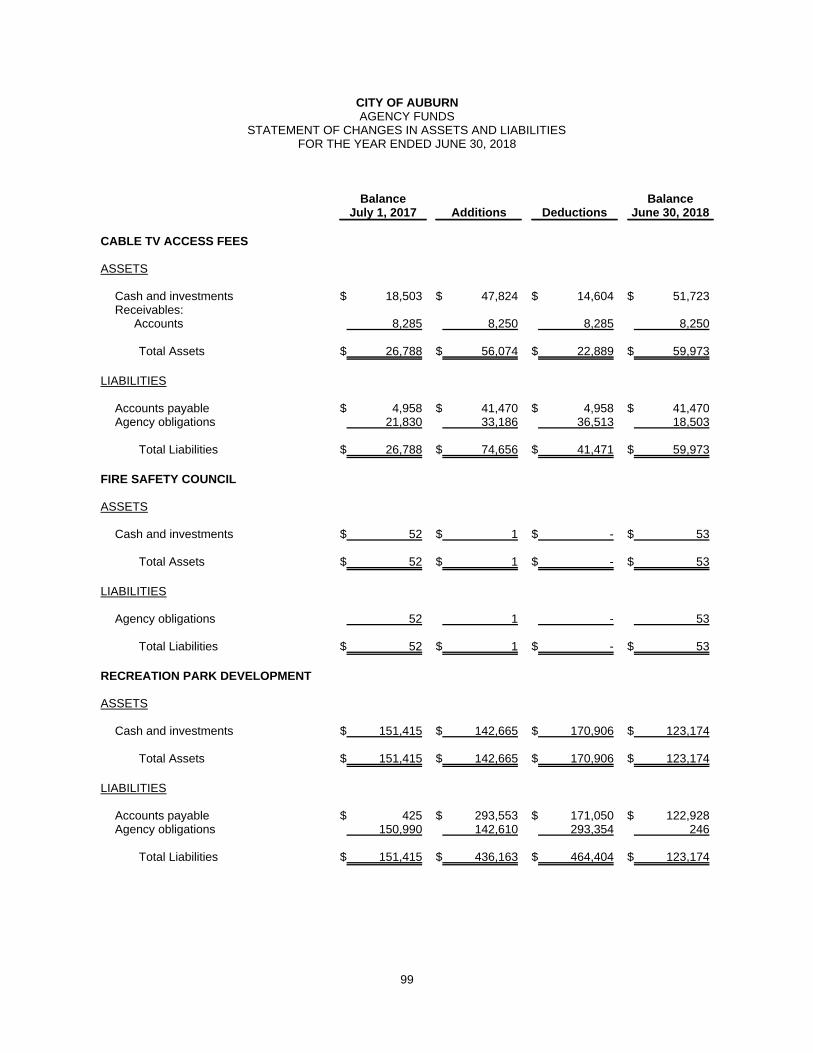
CITY OF AUBURNAGENCY FUNDS
STATEMENT OF CHANGES IN ASSETS AND LIABILITIESFOR THE YEAR ENDED JUNE 30, 2018
BalanceJuly 1, 2017 Additions Deductions
BalanceJune 30, 2018
CABLE TV ACCESS FEES
ASSETS
Cash and investments $ 18,503 $ 47,824 $ 14,604 $ 51,723Receivables:
Accounts 8,285 8,250 8,285 8,250
Total Assets $ 26,788 $ 56,074 $ 22,889 $ 59,973
LIABILITIES
Accounts payable $ 4,958 $ 41,470 $ 4,958 $ 41,470Agency obligations 21,830 33,186 36,513 18,503
Total Liabilities $ 26,788 $ 74,656 $ 41,471 $ 59,973
FIRE SAFETY COUNCIL
ASSETS
Cash and investments $ 52 $ 1 $ - $ 53
Total Assets $ 52 $ 1 $ - $ 53
LIABILITIES
Agency obligations 52 1 - 53
Total Liabilities $ 52 $ 1 $ - $ 53
RECREATION PARK DEVELOPMENT
ASSETS
Cash and investments $ 151,415 $ 142,665 $ 170,906 $ 123,174
Total Assets $ 151,415 $ 142,665 $ 170,906 $ 123,174
LIABILITIES
Accounts payable $ 425 $ 293,553 $ 171,050 $ 122,928Agency obligations 150,990 142,610 293,354 246
Total Liabilities $ 151,415 $ 436,163 $ 464,404 $ 123,174
99

CITY OF AUBURNAGENCY FUNDS
STATEMENT OF CHANGES IN ASSETS AND LIABILITIES (CONTINUED)FOR THE YEAR ENDED JUNE 30, 2018
BalanceJuly 1, 2017 Additions Deductions
BalanceJune 30, 2018
PLACER COUNTY FACILITIES FEE
ASSETS
Cash and investments $ 81,170 $ 107,762 $ 118,438 $ 70,494
Total Assets $ 81,170 $ 107,762 $ 118,438 $ 70,494
LIABILITIES
Accounts payable $ 56,985 $ 153,892 $ 175,423 $ 35,454Agency obligations 24,185 164,747 153,892 35,040
Total Liabilities $ 81,170 $ 318,639 $ 329,315 $ 70,494
PAYROLL CLEARING
ASSETS
Cash and investments $ 294 $ - $ 6,454 $ (6,160)Receivables:
Other receivables 584 - 584 -
Total Assets $ 878 $ - $ 7,038 $ (6,160)
LIABILITIES
Accounts payable $ 6,943 $ 1,155 $ - $ 8,098Agency obligations (6,065) - 8,193 (14,258)
Total Liabilities $ 878 $ 1,155 $ 8,193 $ (6,160)
APOA MEDICAL SAVINGS PLAN
ASSETS
Cash and investments $ 10,590 $ - $ 11,698 $ (1,108)
Total Assets $ 10,590 $ - $ 11,698 $ (1,108)
LIABILITIES
Accounts payable $ 10,590 $ - $ 11,698 $ (1,108)
Total Liabilities $ 10,590 $ - $ 11,698 $ (1,108)
100
STATISTICAL SECTION
STATISTICAL SECTION
This part of the City's comprehensive annual financial report presents detailed information as a context forunderstanding what the information in the financial statements, note disclosures, and required supplementaryinformation says about the City's overall financial health.
Contents Page
Financial Trends
These schedules contain trend information to help the reader understand how the City'sfinancial performance and well-being have changed over time.
102 - 106
Revenue Capacity
These schedules contain information to help the reader assess the City’s mostsignificant local revenue source, property taxes.
107 - 110
Debt Capacity
These schedules present information to help the reader assess the affordability of theCity's current levels of outstanding debt and the City's ability to issue additional debt inthe future.
111 - 114
Economic and Demographic Information
These schedules offer demographic and economic indicators to help the readerunderstand the environment within which the City's financial activities take place and tohelp make comparisons over time and with other governments.
115 - 116
Operating Information
These schedules contain service and infrastructure data to help the reader understandhow the City’s financial information relates to the services the City provides and theactivities it performs.
117 - 119
Source: Unless otherwise noted, the information in these schedules is derived from the comprehensive annualfinancial reports for the relevant year.
101
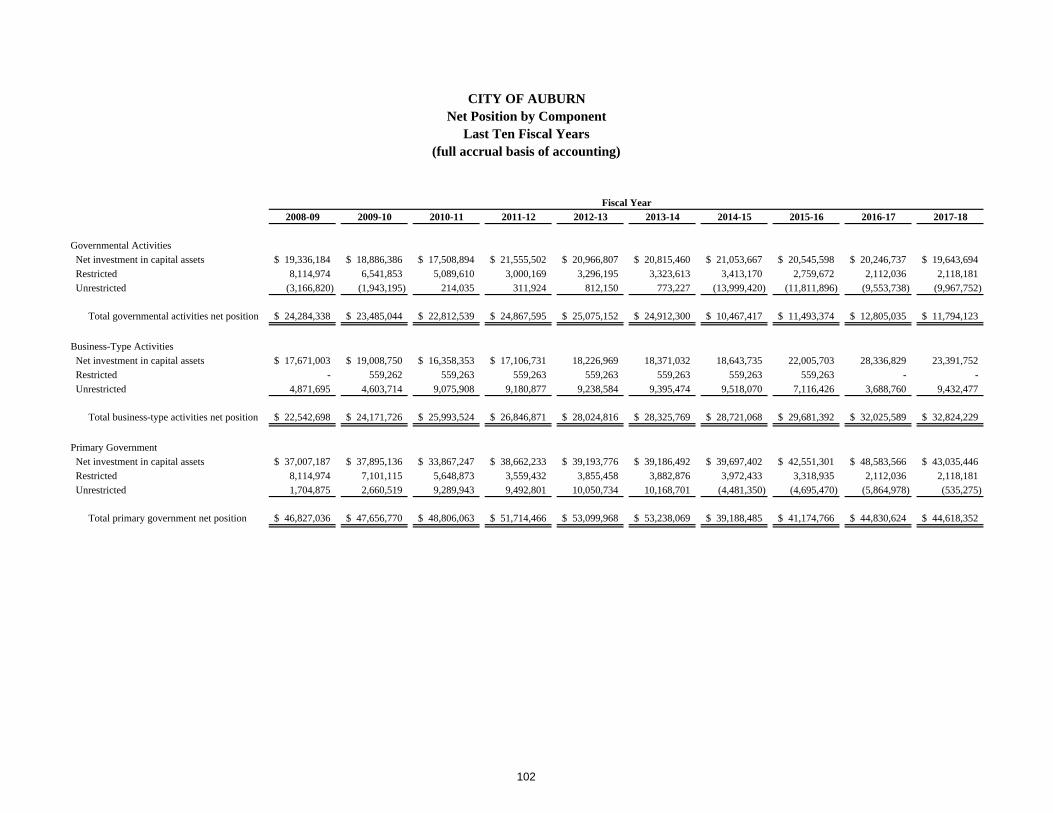
2008-09 2009-10 2010-11 2011-12 2012-13 2013-14 2014-15 2015-16 2016-17 2017-18
Governmental Activities Net investment in capital assets 19,336,184$ 18,886,386$ 17,508,894$ 21,555,502$ 20,966,807$ 20,815,460$ 21,053,667$ 20,545,598$ 20,246,737$ 19,643,694$ Restricted 8,114,974 6,541,853 5,089,610 3,000,169 3,296,195 3,323,613 3,413,170 2,759,672 2,112,036 2,118,181 Unrestricted (3,166,820) (1,943,195) 214,035 311,924 812,150 773,227 (13,999,420) (11,811,896) (9,553,738) (9,967,752)
Total governmental activities net position 24,284,338$ 23,485,044$ 22,812,539$ 24,867,595$ 25,075,152$ 24,912,300$ 10,467,417$ 11,493,374$ 12,805,035$ 11,794,123$
Business-Type Activities Net investment in capital assets 17,671,003$ 19,008,750$ 16,358,353$ 17,106,731$ 18,226,969 18,371,032 18,643,735 22,005,703 28,336,829 23,391,752 Restricted - 559,262 559,263 559,263 559,263 559,263 559,263 559,263 - - Unrestricted 4,871,695 4,603,714 9,075,908 9,180,877 9,238,584 9,395,474 9,518,070 7,116,426 3,688,760 9,432,477
Total business-type activities net position 22,542,698$ 24,171,726$ 25,993,524$ 26,846,871$ 28,024,816$ 28,325,769$ 28,721,068$ 29,681,392$ 32,025,589$ 32,824,229$
Primary Government Net investment in capital assets 37,007,187$ 37,895,136$ 33,867,247$ 38,662,233$ 39,193,776$ 39,186,492$ 39,697,402$ 42,551,301$ 48,583,566$ 43,035,446$ Restricted 8,114,974 7,101,115 5,648,873 3,559,432 3,855,458 3,882,876 3,972,433 3,318,935 2,112,036 2,118,181 Unrestricted 1,704,875 2,660,519 9,289,943 9,492,801 10,050,734 10,168,701 (4,481,350) (4,695,470) (5,864,978) (535,275)
Total primary government net position 46,827,036$ 47,656,770$ 48,806,063$ 51,714,466$ 53,099,968$ 53,238,069$ 39,188,485$ 41,174,766$ 44,830,624$ 44,618,352$
CITY OF AUBURNNet Position by Component
Last Ten Fiscal Years(full accrual basis of accounting)
Fiscal Year
102

2008-09 2009-10 2010-11 2011-12 2012-13 2013-14 2014-15 2015-16 2016-17 2017-18
ExpensesGovernmental Activities: General government 1,741,542$ 1,735,630$ 1,340,063$ 1,678,027$ 1,890,167$ 1,474,340$ 1,889,941$ 1,125,600$ 2,144,834$ 2,994,356$ Public safety 6,066,740 5,503,174 5,147,639 5,139,270 5,421,554 6,369,373 6,053,257 6,409,094 6,669,186 7,886,666 Transportation 2,592,016 2,926,324 3,254,955 2,766,145 3,508,302 3,145,072 2,137,436 3,569,520 2,584,346 2,932,160 Community development 1,490,980 1,326,272 881,511 670,701 693,696 934,437 1,513,541 891,621 1,551,508 1,622,255 Recreation and culture 33,292 36,339 - - - - - - - - Interest on long-term debt 475,274 276,751 539,949 360,834 266,979 258,754 243,174 228,595 219,479 206,005
Total Governmental Activities Expenses 12,399,844 11,804,490 11,164,117 10,614,977 11,780,698 12,181,976 11,837,349 12,224,430 13,169,353 15,641,442
Business-Type Activities Airport 574,112 604,719 551,423 647,973 666,373 681,504 760,253 856,554 892,856 806,418 Sewer 3,432,180 3,433,579 3,543,183 4,128,331 4,108,614 5,040,454 4,684,549 4,944,147 4,644,247 5,658,938
Total Business-Type Activities Expenses 4,006,292 4,038,298 4,094,606 4,776,304 4,774,987 5,721,958 5,444,802 5,800,701 5,537,103 6,465,356
Total Primary Government Expenses 16,406,136$ 15,842,788$ 15,258,723$ 15,391,281$ 16,555,685$ 17,903,934$ 17,282,151$ 18,025,131$ 18,706,456$ 22,106,798$
Program RevenuesGovernmental Activities: Charges for services: General government 749,498$ 496,199$ 593,738$ 548,326$ 810,080$ 523,315$ 580,477$ 549,138$ 1,370,010$ 901,002$ Public safety 369,292 120,660 30,726 30,093 25,249 24,609 21,097 24,680 99,326 157,876 Transportation 72,560 65,710 225,045 243,660 284,103 265,717 353,966 352,938 360,678 380,508 Community development 209,542 303,883 - - - - 891,621 - 29,346 5,132 Recreation and culture 34,563 34,358 - - - - - - - - Operating grants and contributions 2,536,633 1,154,715 1,700,882 1,115,106 2,565,297 2,574,530 3,652,206 2,329,220 2,629,755 2,686,215 Capital grants and contributions 2,801,230 1,257,311 490,889 492,234 2,468 - 19,666 - 46,316 -
Total Governmental Activities Program Revenues 6,773,318 3,432,836 3,041,280 2,429,419 3,687,197 3,388,171 5,519,033 3,255,976 4,535,431 4,130,733
` Charges for services: Airport 566,954 834,189 526,017 611,558 630,290 672,754 652,827 680,150 637,958 690,185 Sewer 4,334,075 4,635,541 4,635,853 4,899,585 5,388,670 5,218,233 5,653,470 5,881,043 6,527,955 6,668,886 Operating grants and contributions 6,350 2,986 609,843 1,553 77,692 86,311 84,249 - - 40,000 Capital grants and contributions - - - - - - - - 85,522 71,733
Total Business-Type Activities Program Revenues 4,907,379 5,472,716 5,771,713 5,512,696 6,096,652 5,977,298 6,390,546 6,561,193 7,251,435 7,470,804
Total Primary Government Program Revenues 11,680,697$ 8,905,552$ 8,812,993$ 7,942,115$ 9,783,849$ 9,365,469$ 11,909,579$ 9,817,169$ 11,786,866$ 11,601,537$
CITY OF AUBURNChanges in Net PositionLast Ten Fiscal Years
(full accrual basis of accounting)
Fiscal Year
103

2008-09 2009-10 2010-11 2011-12 2012-13 2013-14 2014-15 2015-16 2016-17 2017-18
Net (Expense)/Revenue (1) Governmental activities (5,626,526)$ (8,371,654)$ (8,122,837)$ (8,185,558)$ (8,093,501)$ (8,793,805)$ (6,318,316)$ (8,968,454)$ (8,633,922)$ (11,510,709)$ Business-type activities 901,087 1,434,418 1,677,107 736,392 1,321,665 255,340 945,744 760,492 1,714,332 1,005,448
Total Primary Government Net (Expense) (4,725,439)$ (6,937,236)$ (6,445,730)$ (7,449,166)$ (6,771,836)$ (8,538,465)$ (5,372,572)$ (8,207,962)$ (6,919,590)$ (10,505,261)$
General Revenues and Other changes in Net PositionGovernmental Activities: Taxes: Property taxes 4,064,058$ 3,816,117$ 3,454,566$ 3,177,351$ 3,097,824$ 2,627,318$ 3,311,186$ 3,481,455$ 3,668,441$ 3,855,830$ Sales and use taxes 2,059,504 1,903,834 2,027,383 2,316,047 2,787,736 2,957,859 3,291,054 4,227,963 4,988,444 4,811,629 In-lieu taxes 1,040,123 701,744 832,427 1,011,481 1,231,066 1,470,211 1,291,045 1,464,589 - - Franchise taxes 657,957 621,108 622,156 622,265 630,244 632,963 663,639 683,065 708,961 756,161 Transient occupancy taxes 212,709 180,575 198,041 211,217 209,158 226,298 241,158 239,656 298,716 323,551 Other taxes 25,808 27,869 42,647 37,300 52,759 56,069 64,218 72,330 77,675 86,383 Grants and contributions - unrestricted - - 61,677 6,717 6,960 431,011 5,657 5,576 - - Interest and investment earnings 259,023 269,401 140,108 59,814 7,934 119,117 58,888 (38,649) 16,920 73,030 Miscellaneous 141,737 51,712 58,905 45,704 326,904 52,653 50,735 78,504 132,530 263,213 Transfers - - 12,422 10,452 45,801 57,454 44,974 28,908 30,000 330,000 Loss on sale of capital assets - - - - - - - - (23,659) - Extraordinary gain - - - 2,470,706 - - - - - -
Total Governmental Activities 8,460,919 7,572,360 7,450,332 9,969,054 8,396,386 8,630,953 9,022,554 10,243,397 9,898,028 10,499,797
Business-Type Activities Property taxes 36,181 30,272 26,184 26,177 38,568 47,364 30,326 35,083 45,626 51,249 Interest and investment earnings 144,374 164,338 129,879 79,770 3,910 38,063 8,076 36,439 24,146 69,943 Miscellaneous - - 1,050 21,460 40,000 17,640 87 12,348 55,967 2,000 Transfers 64,800 - (12,422) (10,452) (45,801) (57,454) (44,974) (28,908) (30,000) (330,000)
Total Business-Type Activities 245,355 194,610 144,691 116,955 36,677 45,613 (6,485) 54,962 95,739 (206,808)
Total Primary Government 8,706,274$ 7,766,970$ 7,595,023$ 10,086,009$ 8,433,063$ 8,676,566$ 9,016,069$ 10,298,359$ 9,993,767$ 10,292,989$
Change in Net Position Governmental activities 2,834,393$ (799,294)$ (672,505)$ 1,783,496$ 302,885$ (162,852)$ 2,704,238$ 1,274,943$ 1,264,106$ (1,010,912)$ Business-type activities 1,146,442 1,629,028 1,821,798 853,347 1,358,342 300,953 939,259 815,454 1,810,071 798,640
Total Primary Government 3,980,835$ 829,734$ 1,149,293$ 2,636,843$ 1,661,227$ 138,101$ 3,643,497$ 2,090,397$ 3,074,177$ (212,272)$
Note:
CITY OF AUBURNChanges in Net PositionLast Ten Fiscal Years
(full accrual basis of accounting)
Fiscal Year
(1) Net expense is the difference between the expenses and program revenues of a function or program. It indicates the degree to which a function or program supports itself with its own fees and grants versus its reliance upon funding from taxes and general revenues. Numbers in parentheses are net expenses, indicating that expenses were greater than program revenues and therefore general revenues were needed to finance that function or program.
104
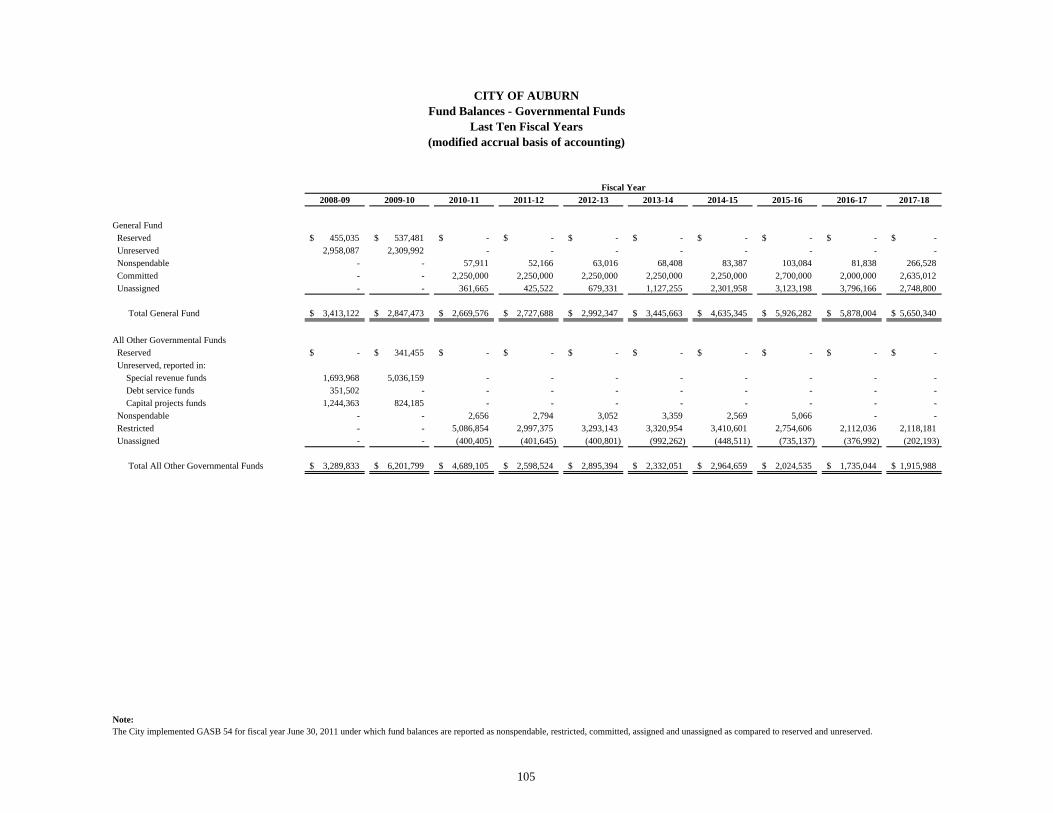
2008-09 2009-10 2010-11 2011-12 2012-13 2013-14 2014-15 2015-16 2016-17 2017-18
General Fund Reserved 455,035$ 537,481$ -$ -$ -$ -$ -$ -$ -$ -$ Unreserved 2,958,087 2,309,992 - - - - - - - - Nonspendable - - 57,911 52,166 63,016 68,408 83,387 103,084 81,838 266,528 Committed - - 2,250,000 2,250,000 2,250,000 2,250,000 2,250,000 2,700,000 2,000,000 2,635,012 Unassigned - - 361,665 425,522 679,331 1,127,255 2,301,958 3,123,198 3,796,166 2,748,800
Total General Fund 3,413,122$ 2,847,473$ 2,669,576$ 2,727,688$ 2,992,347$ 3,445,663$ 4,635,345$ 5,926,282$ 5,878,004$ 5,650,340$
All Other Governmental Funds Reserved -$ 341,455$ -$ -$ -$ -$ -$ -$ -$ -$ Unreserved, reported in: Special revenue funds 1,693,968 5,036,159 - - - - - - - - Debt service funds 351,502 - - - - - - - - - Capital projects funds 1,244,363 824,185 - - - - - - - - Nonspendable - - 2,656 2,794 3,052 3,359 2,569 5,066 - - Restricted - - 5,086,854 2,997,375 3,293,143 3,320,954 3,410,601 2,754,606 2,112,036 2,118,181 Unassigned - - (400,405) (401,645) (400,801) (992,262) (448,511) (735,137) (376,992) (202,193)
Total All Other Governmental Funds 3,289,833$ 6,201,799$ 4,689,105$ 2,598,524$ 2,895,394$ 2,332,051$ 2,964,659$ 2,024,535$ 1,735,044$ 1,915,988$
Note:
CITY OF AUBURNFund Balances - Governmental Funds
Last Ten Fiscal Years(modified accrual basis of accounting)
Fiscal Year
The City implemented GASB 54 for fiscal year June 30, 2011 under which fund balances are reported as nonspendable, restricted, committed, assigned and unassigned as compared to reserved and unreserved.
105

2008-09 2009-10 2010-11 2011-12 2012-13 2013-14 2014-15 2015-16 2016-17 2017-18
Revenues Taxes 7,541,403$ 6,535,207$ 7,162,454$ 7,510,603$ 8,008,787$ 7,970,718$ 8,871,408$ 10,169,058$ 9,742,237$ 9,833,554$ Franchise fees 518,756 621,108 - - - - - - - - Licenses and permits 383,622 461,496 326,069 301,267 631,012 334,890 425,675 363,765 699,752 744,953 Fines and forfeitures 142,998 106,386 103,169 74,950 62,369 50,287 48,391 55,479 68,699 130,891 Use of money and protery 613,929 575,533 452,064 360,115 299,653 404,117 354,682 257,104 339,164 372,647 Intergovernmental 5,712,125 2,386,783 2,253,448 1,463,061 2,574,725 3,005,541 3,677,529 2,282,180 2,310,359 2,686,215 Charges for services 179,412 146,796 108,315 145,561 134,332 143,464 185,680 211,759 687,819 235,331 Other revenues 141,737 51,712 58,905 45,704 326,904 52,653 50,735 78,504 242,380 290,283
Total Revenues 15,233,982 10,885,021 10,464,424 9,901,261 12,037,782 11,961,670 13,614,100 13,417,849 14,090,410 14,293,874
Expenditures Current: General government 1,606,237 1,452,089 1,194,839 1,510,220 1,755,477 1,285,454 1,535,156 1,624,101 1,856,144 2,288,827 Public safety 5,702,042 5,499,427 5,119,592 5,267,512 5,513,843 6,135,398 5,970,331 6,166,988 6,921,049 7,127,305 Transportation 2,096,725 1,802,750 2,445,107 1,716,030 2,427,123 2,142,154 2,065,210 3,092,363 1,953,480 2,148,445 Community development 1,494,664 1,310,866 878,671 667,861 690,856 934,437 625,686 423,018 913,172 1,273,845 Recreation and culture 33,292 35,979 - - - - - - - - Capital outlay 4,895,952 3,267,510 1,779,017 1,032,454 1,301,682 1,030,225 1,073,781 1,030,281 1,765,191 1,352,992 Debt service Principal 499,235 183,149 208,222 140,383 207,403 331,993 359,490 363,856 418,470 377,477 Interest 454,713 267,968 541,889 382,928 268,691 269,490 254,807 243,633 219,479 206,005 Adminsitrative, issuance and other costs 105,823 - - - - - - - - -
Total Expenditures 16,888,683 13,819,738 12,167,337 10,717,388 12,165,075 12,129,151 11,884,461 12,944,240 14,046,985 14,774,896
Excess of Revenues Over (Under) Expenditures (1,654,701) (2,934,717) (1,702,913) (816,127) (127,293) (167,481) 1,729,639 473,609 43,425 (481,022)
Other Financial Sources (Uses) Bonds issued 4,805,000 - - - - - - - - - Discounts on debt issued (102,677) - - - - - - - - - Capital lease - 47,506 - - - - - - 211,214 - Issuance of debt - - - - 643,021 - - 99,876 - - Transfers in 906,258 425,902 590,279 135,091 194,531 198,963 205,896 627,682 1,009,546 530,866 Transfers out (906,258) (425,902) (577,857) (124,639) (148,730) (141,509) (160,922) (598,774) (979,546) (200,866)
Total Other Financial Sources (Uses) 4,702,323 47,506 12,422 10,452 688,822 57,454 44,974 128,784 241,214 330,000
Extraordinary Loss - - - (1,498,454) - - - - - -
Net Change in Fund Balances 3,047,622$ (2,887,211)$ (1,690,491)$ (2,304,129)$ 561,529$ (110,027)$ 1,774,613$ 602,393$ 284,639$ (151,022)$
Debt Service as a Percentage of Noncapital Expenditures 8.84% 4.28% 7.22% 5.40% 4.38% 5.42% 5.68% 5.10% 5.19% 4.35%
CITY OF AUBURNChanges in Fund Balances - Governmental Funds
Last Ten Fiscal Years(modified accrual basis of accounting)
Fiscal Year
106
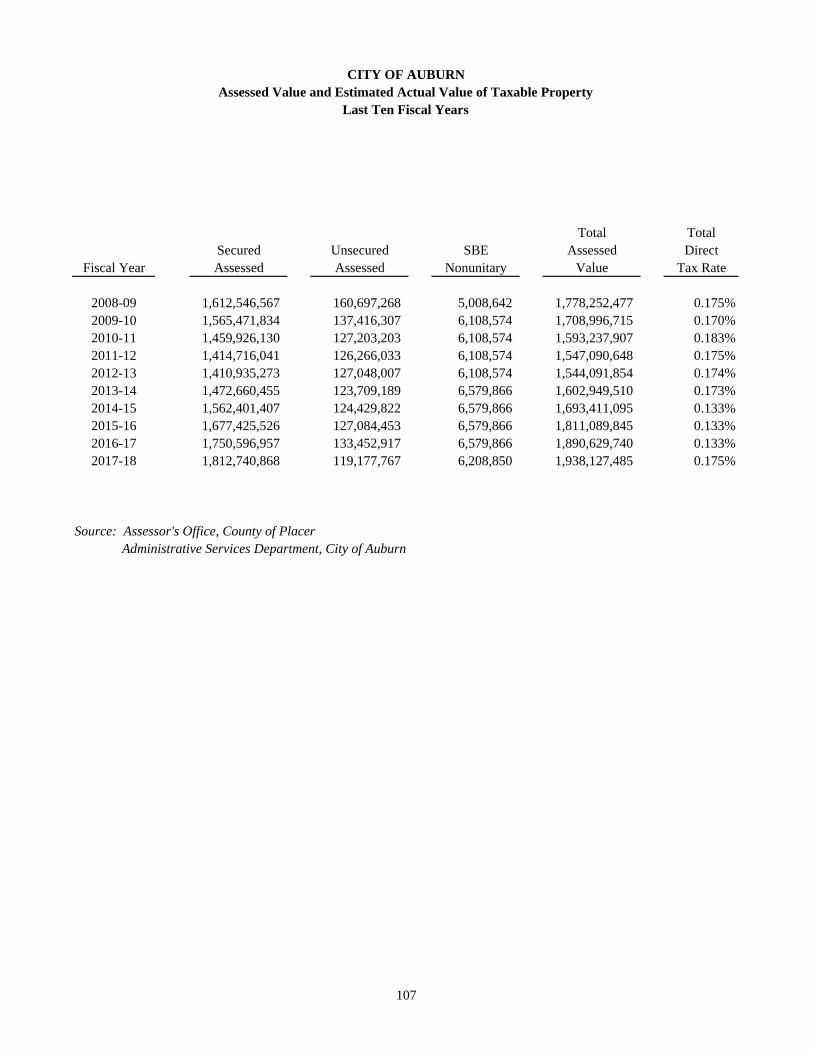
Total TotalSecured Unsecured SBE Assessed Direct
Fiscal Year Assessed Assessed Nonunitary Value Tax Rate
2008-09 1,612,546,567 160,697,268 5,008,642 1,778,252,477 0.175%2009-10 1,565,471,834 137,416,307 6,108,574 1,708,996,715 0.170%2010-11 1,459,926,130 127,203,203 6,108,574 1,593,237,907 0.183%2011-12 1,414,716,041 126,266,033 6,108,574 1,547,090,648 0.175%2012-13 1,410,935,273 127,048,007 6,108,574 1,544,091,854 0.174%2013-14 1,472,660,455 123,709,189 6,579,866 1,602,949,510 0.173%2014-15 1,562,401,407 124,429,822 6,579,866 1,693,411,095 0.133%2015-16 1,677,425,526 127,084,453 6,579,866 1,811,089,845 0.133%2016-17 1,750,596,957 133,452,917 6,579,866 1,890,629,740 0.133%2017-18 1,812,740,868 119,177,767 6,208,850 1,938,127,485 0.175%
Source: Assessor's Office, County of Placer Administrative Services Department, City of Auburn
CITY OF AUBURNAssessed Value and Estimated Actual Value of Taxable Property
Last Ten Fiscal Years
107

Direct Rate City's Share VoterLocal City of Placer of 1% Levy Approved Total
Government Auburn Nevada Union Total Per Prop City Debt Redevelopment DirectFiscal Year Rate (a) B & I Irrigation High Rate (b) 13 (c) Rate Rate (d) Rate (e)
2008/09 1.00 - 0.0025 0.02009 1.02259 0.17471 - 1.0000 0.17007
2009/10 1.00 - 0.0021 0.02177 1.02387 0.17471 - 1.0000 0.18274
2010/11 1.00 - 0.0023 0.02651 1.02881 0.17471 - 1.0000 0.17539
2011/12 1.00 - 0.0026 0.02628 1.02888 0.17471 - 1.0000 0.17370
2012/13 1.00 - - 0.02848 1.02848 0.17471 - - 0.17340
2013/14 1.00 - - 0.02799 1.02799 0.17471 - - 0.13324
2014/15 1.00 - - 0.01939 1.01939 0.17471 - - 0.13330
2015/16 1.00 - - 0.01465 1.01465 0.17417 - - 0.13348
2016/17 1.00 - - 0.02416 1.02416 0.17470 - - 0.13358
2017/18 1.00 - - 0.02555 1.02555 0.17470 - - 0.17470
Notes:
Source:Placer County Assessor's Office
(c) City's share of 1% levy is based on the City's share of the general fund tax rate area with the largest net taxable value within the City. ERAF general fund tax shifts may not be included in the tax ratio figures.
(d) Redevelopment rate is based on the largest RDA tax rate area and only includes rate(s) from indebtedness adopted prior to 1989 per California State statute. RDA direct and overlapping rates are applied only to the incremental property values. The approval of ABX1 26 eliminated Redevelopment from the State of California for the fiscal year 2012/13 and thereafter.
e) Total Direct Rate is the weighted average of all individual direct rates applied by the City/Agency preparing the Statistical Section information and excludes revenues dervied from aircraft. Beginning in 2013/14 the Total Direct Rate no longer includes revenue generated from the former redevelopment tax rate areas. Challenges to recognized enforceable obligations are assumed to have been resovled during 2012/13. For the purposes of this report, residualrevenue is assumed to be distributed to the City/Agency in the same proportions as general fund revenue.
CITY OF AUBURNProperty Tax Rates - All Overlapping Governments
Last Ten Fiscal Years(Rate per $100 of Taxable Value)
(a) In 1978, California coters passed Proposition 13 which set the property tax rate at a 1.00% fixed amount. This 1.00% is shared by all taxing agencies for which the subject property resides within. In addition to the 1.00% fixed amount, property owners are charged taxes as a percentage of assessed value for the payment of any other voterapproved bonds.
Overlapping Rates
(b) Overlapping rates are those of local and county governments that apply to property owners within the City. Not all overlapping rates apply to all property owners.
108

Percent of Taxable Total CityAssessed Taxable
Taxpayer Value Assessed Value
Parkhill LII Partnership 16,211,033$ 0.84%260 Racetrack Street LLC 13,220,466 0.68%Longs Drug Stores Inc. 11,109,010 0.57%1616 I Street Properties 9,779,822 0.50%Auburn Promenade Ltd. 8,400,235 0.43%Persimmon Terrace Apts LP 6,800,000 0.35%Auburn Town Square LLC 5,941,017 0.31%UAIC Development Corporation 5,765,763 0.30%Auburn Investors LLC 5,728,036 0.30%PAC77 LP 5,247,278 0.27%
88,202,660$ 4.55%
Total City of Auburn assessed property valuation Fiscal Year 2017/18 1,938,127,485$
Percent of Taxable Total CityAssessed Taxable
Taxpayer Value Assessed Value
Coherent Inc 32,662,816$ 1.63%Reneson Hotels, Inc. 14,067,251 0.97%Auburn Creekside, LLC 10,511,699 0.72%Regal Cinemas, Inc. 10,424,559 0.72%BKR Investors, LLC 8,622,819 0.59%Carpenter Advanced Ceramics 7,134,490 0.49%RMP Properties LLC 6,599,453 0.45%Auburn Creekside Buildings A & E LLC 6,497,092 0.45%UAIC Development Corporation 5,964,417 0.41%Alfred & Peggy Lee 5,297,319 0.36%
107,781,915$ 6.79%
Total City of Auburn assessed property valuation Fiscal Year 2008/09 (including AUDA) 1,999,941,536$
Source:Placer County Assessor's Office
CITY OF AUBURNPrincipal Property Tax Payers
Current Year and Nine Years Ago
Fiscal Year 2017/18
Fiscal Year 2008/09
109
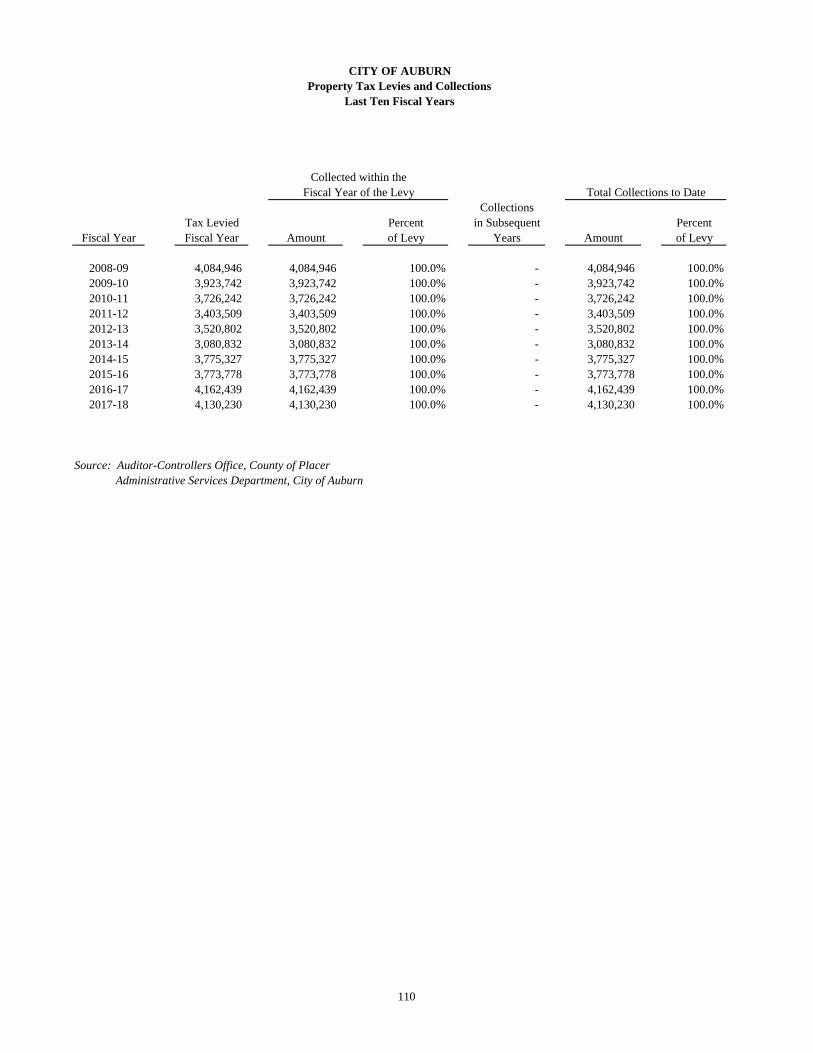
CollectionsTax Levied Percent in Subsequent Percent
Fiscal Year Fiscal Year Amount of Levy Years Amount of Levy
2008-09 4,084,946 4,084,946 100.0% - 4,084,946 100.0%2009-10 3,923,742 3,923,742 100.0% - 3,923,742 100.0%2010-11 3,726,242 3,726,242 100.0% - 3,726,242 100.0%2011-12 3,403,509 3,403,509 100.0% - 3,403,509 100.0%2012-13 3,520,802 3,520,802 100.0% - 3,520,802 100.0%2013-14 3,080,832 3,080,832 100.0% - 3,080,832 100.0%2014-15 3,775,327 3,775,327 100.0% - 3,775,327 100.0%2015-16 3,773,778 3,773,778 100.0% - 3,773,778 100.0%2016-17 4,162,439 4,162,439 100.0% - 4,162,439 100.0%2017-18 4,130,230 4,130,230 100.0% - 4,130,230 100.0%
Source: Auditor-Controllers Office, County of Placer Administrative Services Department, City of Auburn
CITY OF AUBURNProperty Tax Levies and Collections
Last Ten Fiscal Years
Fiscal Year of the LevyCollected within the
Total Collections to Date
110

Fiscal Year
Pension Obligation
Bonds
Tax Allocation
Bonds
Loans and Notes
PayableDue to Other
AgenciesCapital Leases Total
Loans and Notes
PayableRevenue Bonds Total
Total Primary
Government
Percentage of Personal Income (1)
Percentage of Assessed Value (2)
PerCapita (1)
2008-2009 4,775,000 4,530,746 32,570 31,278 93,177 9,462,771 3,987,580 - 3,987,580 13,450,351 3.23% 0.76% 1,010
2009-2010 4,685,000 4,459,169 19,832 29,044 46,269 9,239,314 3,628,100 8,187,914 11,816,014 21,055,328 5.13% 1.23% 1,561
2010-2011 4,575,000 4,387,592 6,710 26,810 38,404 9,034,516 3,263,482 8,036,606 11,300,088 20,334,604 4.63% 1.28% 1,498
2011-2012 4,450,000 - - - 29,731 4,479,731 2,893,728 7,885,298 10,779,026 15,258,757 3.11% 0.99% 1,133
2012-2013 4,305,000 - - - 610,349 4,915,349 2,178,739 7,728,990 9,907,729 14,823,078 3.19% 0.96% 1,102
2013-2014 4,130,000 - - - 453,356 4,583,356 1,845,752 7,567,683 9,413,435 13,996,791 3.12% 0.87% 1,014
2014-2015 3,930,000 - - - 293,866 4,223,866 1,507,628 7,401,377 8,909,005 13,132,871 2.66% 0.78% 950
2015-2016 3,700,000 - - - 317,329 4,017,329 1,154,807 7,230,070 8,384,877 12,402,206 2.51% 0.68% 881
2016-2017 3,445,000 - - - 365,073 3,810,073 824,057 7,020,859 7,844,916 11,654,989 2.25% 0.62% 827
2017-2018 3,160,000 - - - 194,005 3,354,005 9,745,678 6,787,411 16,533,089 19,887,094 3.48% 1.03% 1,361
Notes:
(1) See Demographic and Economic Statistics schedule for personal income and population data.
(2) See Assessed Value and Estimated Actual Value of Taxable Property schedule for property value data.
n/a - information is not available until the following year
Sources:
Auditor-Controller's Office, County of Placer
Administrative Services Department, City of Auburn
Governmental Activities Business-Type Activities
CITY OF AUBURNRatios of Outstanding Debt by Type
Last Ten Fiscal Years
111

Fiscal Year
Pension Obligation
Bonds Total
Percent of Assessed Value (1) Population Per Capita
2008-2009 4,775,000 4,775,000 0.27% 13,432 355
2009-2010 4,685,000 4,685,000 0.27% 13,578 345
2010-2011 4,575,000 4,575,000 0.29% 13,410 341
2011-2012 4,450,000 4,450,000 0.29% 13,468 330
2012-2013 4,305,000 4,305,000 0.28% 13,446 320
2013-2014 4,130,000 4,130,000 0.26% 13,660 302
2014-2015 3,930,000 3,930,000 0.23% 13,960 282
2015-2016 3,700,000 3,700,000 0.20% 14,070 263
2016-2017 3,445,000 3,445,000 0.18% 14,096 244
2017-2018 3,160,000 3,160,000 0.16% 14,611 216
Notes:(1) See Assessed Value and Estimated Actual Value of Taxable Property schedule for property value data.
Sources:Auditor-Controller's Office, County of PlacerAdministrative Services Department, City of Auburn
General Bonded Debt Outstanding
CITY OF AUBURNRatios of General Bonded Debt Outstanding
Last Ten Fiscal Years
112

City Assessed Valuation 1,938,127,485$
Percent Applicable
Outstanding DebtJune 30, 2018
Estimated Share of Overlapping
Debt
OVERLAPPING TAX AND ASSESSMENT DEBT:Placer Union High School District 14.544% 24,411,873$ 3,550,463$
Total Overlapping Tax and Assessment Debt 24,411,873 3,550,463
OVERLAPPING GENERAL FUND OBLIGATION DEBT:Placer County General Fund Obligations 2.767% 28,395,000$ 785,690$ Placer County Office of Education Certificates of Participations 2.767% 1,110,000 30,714 Sierra Joint Community college District General Fund Obligations 2.094% 4,770,000 99,884 Placer Union High School District Certificates of Participation 14.544% 1,845,000 268,337 Auburn Union School District Certificates of Participation 40.498% 39,267,117 15,902,397 Loomis Union School District Certificates of Participation 0.005% 1,945,000 97 Placer Mosquito and Vector Control District COPS 2.767% 3,270,000 90,481
Total Overlapping General Fund and Obligation Debt 80,602,117 17,177,600
OVERLAPPING TAX INCREMENT DEBT: 100.000% 4,140,000 4,140,000
Total Overlapping Debt 109,153,990 24,868,063
DIRECT GENERAL FUND OBLIGATION DEBT:City of Auburn Pension Obligations 100.000% 3,160,000 3,160,000 Capital leases 100.000% 194,005 194,005
Total Direct Debt 3,354,005 3,354,005
Total Combined Debt 112,507,995$ 28,222,068$
RATIOS TO 2017/18 ASSESSED VALUATION:Total Overlapping Tax and Assessment Debt 0.180%
RATIOS TO ADJUSTED ASSESSED VALUATION:Combined Direct Debt ($3,354,005) 0.160%Combined Total Debt 1.420%
Notes:
Sources:Auditor-Controller's Office, County of PlacerAdministrative Services Department, City of AuburnCalifornia Municipal Statistics
CITY OF AUBURNDirect and Overlapping Bonded Debt
As of June 30, 2018
The percentage of overlapping debt applicable to the City is estimated using taxable assessed property value. Applicable percentages were estimated by determining the portion of the overlapping district's assessed value that is within the boundaries of the City divided by the district's total taxable assessed value.
113

Secured Property Assessed Value, Net of Exempt Real Property 1,812,740,868$
Bonded debt limit (3.75% of assessed value) (1) 67,977,783$
Less debt subject to limit: Total pension obligation bonds at 6/30/2018 (3,160,000) Total sewer revenue bonds at 6/30/2018 (6,787,411)
Legal debt margin 58,030,372$
Note:
Sources:Auditor-Controller's Office, County of PlacerAdministrative Services Department, City of Auburn
CITY OF AUBURNComputation of Legal Bonded Debt Margin
As of June 30, 2018
(1) California Government Code Section 43605 sets the debt limit at 15%. The Code section was enacted prior to the change in basing assessed value at full market value when it was previously 25% of market value. This, the limit shown as 3.75% is one-fourth the limit to account for the adjustment of showing assessed valuation at full cash value.
114

Taxable Per Capita AverageAssessed Taxable Property Unemployment
Calendar Year Population Total (in ,000's) Per Capita Valuation Values Rate
2009 13,313 416,676 31,298 1,999,941,536 148,894 5.2%2010 13,489 410,670 30,445 1,921,190,548 141,493 8.6%2011 13,578 438,936 32,327 1,794,952,305 133,852 9.3%2012 13,468 489,912 36,376 1,745,535,004 129,606 8.7%2013 13,446 464,519 34,547 1,544,091,854 112,868 5.8%2014 13,804 448,975 32,525 1,602,949,510 114,155 4.9%2015 13,817 494,220 35,769 1,693,411,095 117,810 7.3%2016 14,070 494,271 35,129 1,811,089,845 128,720 5.9%2017 14,096 518,653 36,794 1,878,486,617 133,264 5.2%2018 14,611 571,800 39,135 1,938,127,485 132,649 4.2%
Source: Auditor-Controllers Office, County of Placer MuniServices, LLC Employment Development Department, State of California
Personal Income
CITY OF AUBURNDemographic and Economic Statistics
Last Ten Fiscal Years
115

Fiscal Year 2008/09Percent of
Employer No. of Employees Total Employment No. of Employees
Placer County Office of Education 417 6.42% -Auburn Union School District 165 2.54% -Pride Industries 160 2.46% 160Help At Home Senior Care 150 2.31% -Placer County (Domes Offices) 144 2.22% 70Flyers Energy 120 1.85% 75Save Mart 110 1.69% -Placer Union School District 104 1.60% -City of Auburn 78 1.20% 84Auburn Journal 70 1.08% 90Placer County Water Agency* - - 179AT&T - - 94Miltenyi Biotech - - 50United States Post Office - - 75Auburn Placer Disposal - Recology* - - 85
Note:* - Placer County Water Agency and Auburn Placer Disposal - Recology are not within City limits.
Source: MuniServices, LLC
Fiscal Year 2017/18
CITY OF AUBURNPRINCIPAL EMPLOYERS
2018
116

2007 2008 2009 2010 2011 2012 2013 2014 2015 2016 2017 2018
City Council 5.0 5.0 5.0 5.0 5.0 5.0 5.0 5.0 5.0 5.0 5.0 5.0 City Manager's Office 1.5 1.0 1.0 1.0 1.0 1.0 1.0 1.0 1.0 1.0 1.0 1.0 Economic Development - - - - - - - - - - - 1.0 City Clerk's Office 2.0 2.0 2.0 2.0 2.0 2.0 2.0 2.0 2.0 2.0 2.0 1.0 Finance / Administrative Services 8.0 6.0 4.0 4.0 4.0 4.0 4.0 4.0 4.0 4.0 4.0 4.0 Community Development 10.0 8.0 6.5 6.5 5.5 5.5 5.5 4.0 3.0 3.0 4.0 4.0 Police Department 36.5 36.0 35.0 30.0 27.0 28.0 28.0 28.0 26.0 26.0 26.5 27.0 Fire Department 13.0 13.0 11.0 11.0 11.0 11.0 16.0 16.0 14.0 14.0 13.5 15.0 Public Works 27.0 21.5 19.5 18.5 18.5 17.5 18.0 18.0 17.0 17.0 18.0 17.0 Airport 1.0 - - - - - - - - - - -
Total Full-Time Equivalent Employees: 104.0 92.5 84.0 78.0 74.0 74.0 79.5 78.0 72.0 72.0 74.0 75.0
Source: Administrative Services Department, City of Auburn
CITY OF AUBURNFull-Time and Part-Time City Government Employees
Last Ten Fiscal Years
As of June 30,
117

2008-09 2009-10 2010-11 2011-12 2012-13 2013-14 2014-15 2015-16 2016-17 2017-18AUBURN AIRPORT: Tie-downs per year 1,034 916 802 884 884 884 884 884 1,007 1,029 Hangar rentals per year 83 80 73 62 62 62 108 108 109 109 Gallons of fuel sold per year 209,467 168,016 134,040 168,422 192,481 169,754 204,299 201,945 206,940 248,927
ENVIRONMENT AND UTILITIES: Gallons of wastewater treated per year (in millions) 446 481 612 506 501 423 363 374 494 396
FIRE: Fires per year 108 114 114 86 110 136 95 75 120 96 Emergency medical calls per year 1,333 1,377 1,238 1,317 1,377 1,224 1,262 1,175 1,406 1,407 Hazardous materials incidents per year 47 63 51 36 40 29 36 38 59 52 Non-emergency service calls per year 336 314 312 257 297 432 411 481 532 554
POLICE: 911 calls per year 2,325 2,541 2,665 306 4,442 5,194 4,964 4,780 4,835 4,733 Arrests per year 1,134 825 770 542 689 687 775 535 944 686 (1)
BUILDING PERMITS: Building permits issues per year 455 461 660 484 473 528 607 679 665 777 New building and alteration valuation 12,391,787$ 17,084,250$ 11,844,465$ 10,573,919$ 14,845,275$ 12,993,989$ 18,597,176$ 16,251,607$ 41,939,654$ 34,367,446$
Source: City of Auburn(1) Criminal cases only.
Fiscal Year
CITY OF AUBURNOperating IndicatorsLast Ten Fiscal Years
118
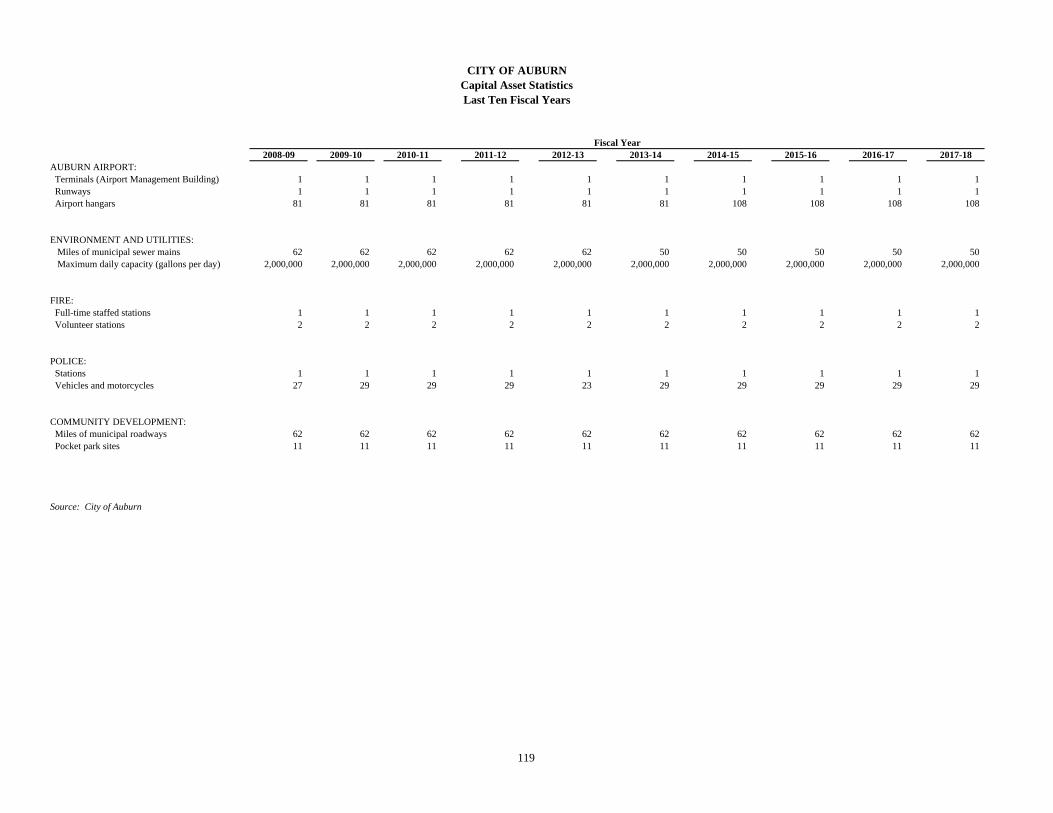
2008-09 2009-10 2010-11 2011-12 2012-13 2013-14 2014-15 2015-16 2016-17 2017-18AUBURN AIRPORT: Terminals (Airport Management Building) 1 1 1 1 1 1 1 1 1 1 Runways 1 1 1 1 1 1 1 1 1 1 Airport hangars 81 81 81 81 81 81 108 108 108 108
ENVIRONMENT AND UTILITIES: Miles of municipal sewer mains 62 62 62 62 62 50 50 50 50 50 Maximum daily capacity (gallons per day) 2,000,000 2,000,000 2,000,000 2,000,000 2,000,000 2,000,000 2,000,000 2,000,000 2,000,000 2,000,000
FIRE: Full-time staffed stations 1 1 1 1 1 1 1 1 1 1 Volunteer stations 2 2 2 2 2 2 2 2 2 2
POLICE: Stations 1 1 1 1 1 1 1 1 1 1 Vehicles and motorcycles 27 29 29 29 23 29 29 29 29 29
COMMUNITY DEVELOPMENT: Miles of municipal roadways 62 62 62 62 62 62 62 62 62 62 Pocket park sites 11 11 11 11 11 11 11 11 11 11
Source: City of Auburn
CITY OF AUBURNCapital Asset StatisticsLast Ten Fiscal Years
Fiscal Year
119